


Languages
Pages
Legal

CODE AND REGULATORY BARRIERS TO THE LIVING BUILDING CHALLENGE FOR SUSTAINABLE, AFFORDABLE, RESIDENTIAL DEVELOPMENT
REPORT #3: COST BENEFIT SUMMARY
PREPARED FOR: PREPARED BY:
CITY OF VANCOUVER, WA CASCADIA REGION CLARK COUNTY, WA GREEN BUILDING COUNCIL
Produced through funding from the Washington Department of Community, Trade, and Economic Development.
PROJECT TEAM & CONTRIBUTORS
This report is the third and fi nal for the project: Code and Regulatory Barriers to the Living Building Challenge for Sustinable, Affordable, Residential Development (SARD). The SARD project is funded through the Washington State Department of Community, Trade and Economic Development and managed by the City of Vancouver, which contracted with the Cascadia Region Green Building Council to perform the study.
PROJECT LEADS
Marian Lahav, Senior Planner City of Vancouver
Gordy Euler, Planner, Clark County
CONSULTANTS
Gina Franzosa, Oregon State Director, Cascadia Region Green Building Council
Lisa Petterson, Associate, SERA Architects
Eric Ridenour, Associate, SERA Architects
Steve Clem, Director of PreConstruction, Skanska
ACKNOWLEDGEMENTS
The following agencies provided real cost information and feedback for Report #3:
City of Vancouver: Community Planning, Development Review Services/Building, Public Works, Transportation, Fire Marshal, Community Development Block Grant Program, and Human Resources
Clark County: Community Development, Community Planning, Public Works, Transportation, Fire, and Public Health
Clark Regional Wastewater District Engineering
Clark Public Utilities District
Vancouver Housing Authority
YW Housing
The following individuals from local jurisdictions provided insight and information based on their experiences implementing innovative programs that Vancouver and Clark County may wish to undertake:
Cynthia Moffi t, King County
Debbie Cleek, City of Portland
Jenna Garmon, City of Eugene
Report #3, Cost Benefi t Summary: Code Barriers for Sustainable, Affordable, Residential Development
1 June 2009
TABLE OF CONTENTS
EXECUTIVE SUMMARY .....................................................................................................1
INTRODUCTION ................................................................................................................7
BENEFITS ......................................................................................................................11
COSTS ............................................................................................................................15
APPENDIX A: BENEFITS .................................................................................................19
APPENDIX B: SUMMARY OF RESPONSES TO PUBLIC SECTOR SURVEY ON COST AND IMPLEMENTATION ISSUES .............................................................................................24
APPENDIX C: PRIVATE SECTOR COSTS / PAYBACK CALCULATIONS ................................38

Report #3, Cost Benefi t Summary: 1Code Barriers for Sustainable, Affordable, Residential Development
1 June 2009
EXECUTIVE SUMMARY
This report quantifi es the cost and benefi ts of removing barriers to sustainable, affordable, residential development (SARD) in Clark County and the City of Vancouver. Its purposes are:
To provide an estimate of the benefi ts resulting from implementation of green building goals in • the context of sustainable, affordable, residential development;
To provide an estimate of the cost impacts of implementing the proposed code, standard, and • policy recommendations delineated in Report #2 to the City and County; and
To provide an estimate of the cost impacts of sustainable development (as defi ned by the Living • Building Challenge™) to developers and buyers of affordable, residential projects.
The Living Building Challenge, a rigorous performance-based standard developed by the Cascadia Region Green Building Council, was used as a metric to defi ne sustainable development. The standard was selected because it is the most stringent standard established for green building projects available today, and thus represents the closest measure of true sustainability in the built environment.
Report #1: Findings highlighted the obstacles project teams may encounter when seeking approval for a Living Building project. Some of the barriers found were directly related to City and County regulations, while others extended beyond the authority of the local jurisdiction to the state level.
Report #2: Strategies and Recommendations provided a prioritized list of key barriers with short and long term recommendations for overcoming those barriers.
This report, Report #3: Costs and Benefi ts, provides some understanding of the costs of implementing each of the twenty-one recommendations identifi ed in Report #2 and provides a summary of the environmental, societal, and fi nancial benefi ts of sustainable, affordable, residential development. The report also provides developers of single and multi-family residential projects with a range of additional fi rst costs for developments which strive to achieve the Living Building Challenge. Finally, the payback period for investing in single and multi-family residential buildings, which strive to attain this high level of sustainability, was evaluated against water and energy costs in the City of Vancouver and Clark County.
The costs of implementing the twenty-one recommendations noted in Report #2 were estimated in four general categories: additional staff needs, additional training needs, additional costs for a public outreach campaign, and infrastructure costs associated with implementing any of the other three. For the purposes of estimating the costs for each recommendation, it was assumed that all twenty-one measures were implemented in isolation. In reality, we recommend that the measures be combined, either with each other or with joint funding from the City and County to minimize duplication of effort and achieve economies of scale. The measures were prioritized in terms of long term and short term recommendations in the previous report. A next step for moving forward with the recommendations would be development of an implementation plan that thoroughly considers potential synergies between the various recommendations.
Quantifying the true costs of non-sustainable development is very diffi cult, as the larger societal costs of many current development practices are not often accounted for. For example, the global impacts of greenhouse gas emissions from the long distance transport of materials is not included in the current costs of materials, allowing materials from China to be cheaper than those manufactured in our own state. Similarly, the added health care costs that result from residents living or working around off-gassing materials is not included in the cost of the construction.
The cost of building a Living Building was estimated by comparing the cost estimates from two
2 Report #3, Cost Benefi t Summary: Code Barriers for Sustainable, Affordable, Residential Development
1 June 2009
real projects constructed locally to the same projects hypothetically redesigned to meet the Living Building Challenge. For the purposes of this cost estimating exercise, the societal costs of non-sustainable development were not accounted for. Only direct construction costs attributable to changes in the development’s physical features and systems were considered for this analysis. Payback was calculated using only direct water and energy costs. The less tangible, but very real, benefi ts seen from improved quality of life are not included in the payback calculation.
In the City of Vancouver/Clark County, our analysis showed the payback period for projects striving to meet the Living Building Challenge were relatively high. This is due to the small scale of the residential projects and the comparatively low local utility rates charged in the area. The incentives available in a jurisdiction also have an effect on the fi rst cost increase, which in turn affects payback. Projects in the City of Vancouver and Clark County can utilize federal and state incentives for many of the project’s energy related features. Other jurisdictions offer additional incentives which lower fi rst costs further.
Report #3, Cost Benefi t Summary: 3Code Barriers for Sustainable, Affordable, Residential Development
1 June 2009
Benefi t Category Benefi ts
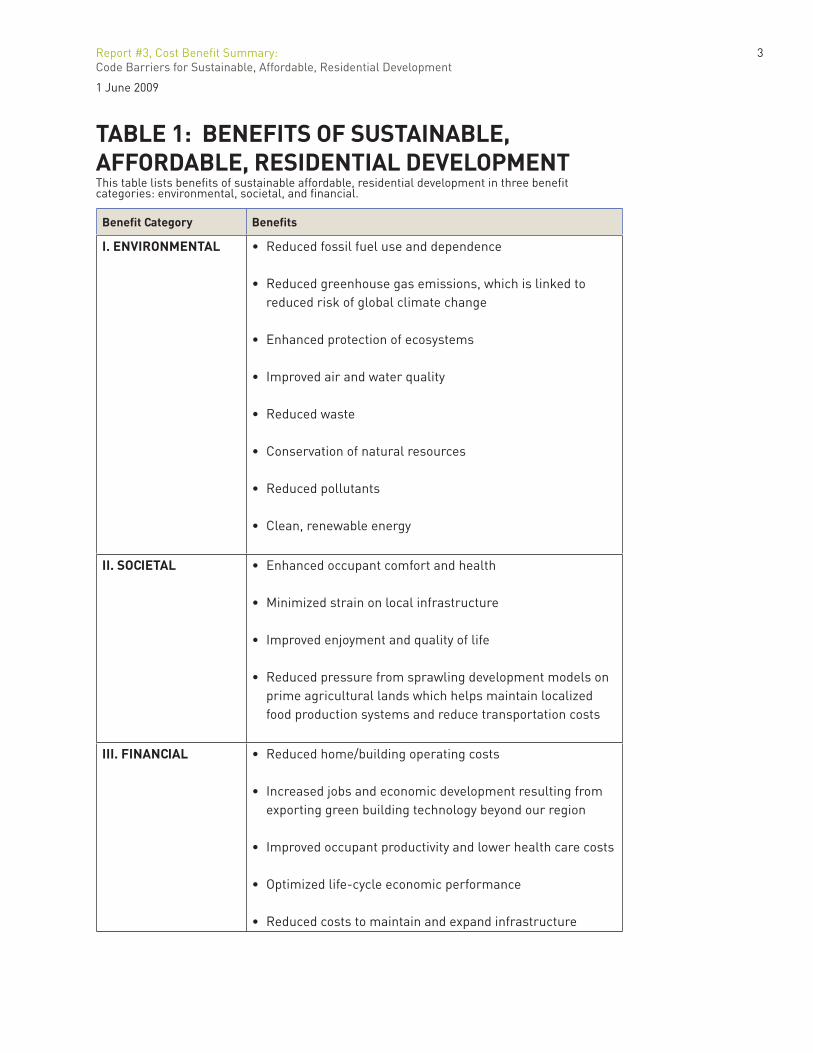
I. ENVIRONMENTAL • Reduced fossil fuel use and dependence
• Reduced greenhouse gas emissions, which is linked to reduced risk of global climate change
• Enhanced protection of ecosystems • Improved air and water quality
• Reduced waste
• Conservation of natural resources
• Reduced pollutants
• Clean, renewable energy
II. SOCIETAL • Enhanced occupant comfort and health • Minimized strain on local infrastructure
• Improved enjoyment and quality of life
• Reduced pressure from sprawling development models on prime agricultural lands which helps maintain localized food production systems and reduce transportation costs
III. FINANCIAL • Reduced home/building operating costs
• Increased jobs and economic development resulting from exporting green building technology beyond our region
• Improved occupant productivity and lower health care costs
• Optimized life-cycle economic performance
• Reduced costs to maintain and expand infrastructure
TABLE 1: BENEFITS OF SUSTAINABLE, AFFORDABLE, RESIDENTIAL DEVELOPMENTThis table lists benefi ts of sustainable affordable, residential development in three benefi t categories: environmental, societal, and fi nancial.
4 Report #3, Cost Benefi t Summary: Code Barriers for Sustainable, Affordable, Residential Development
1 June 2009
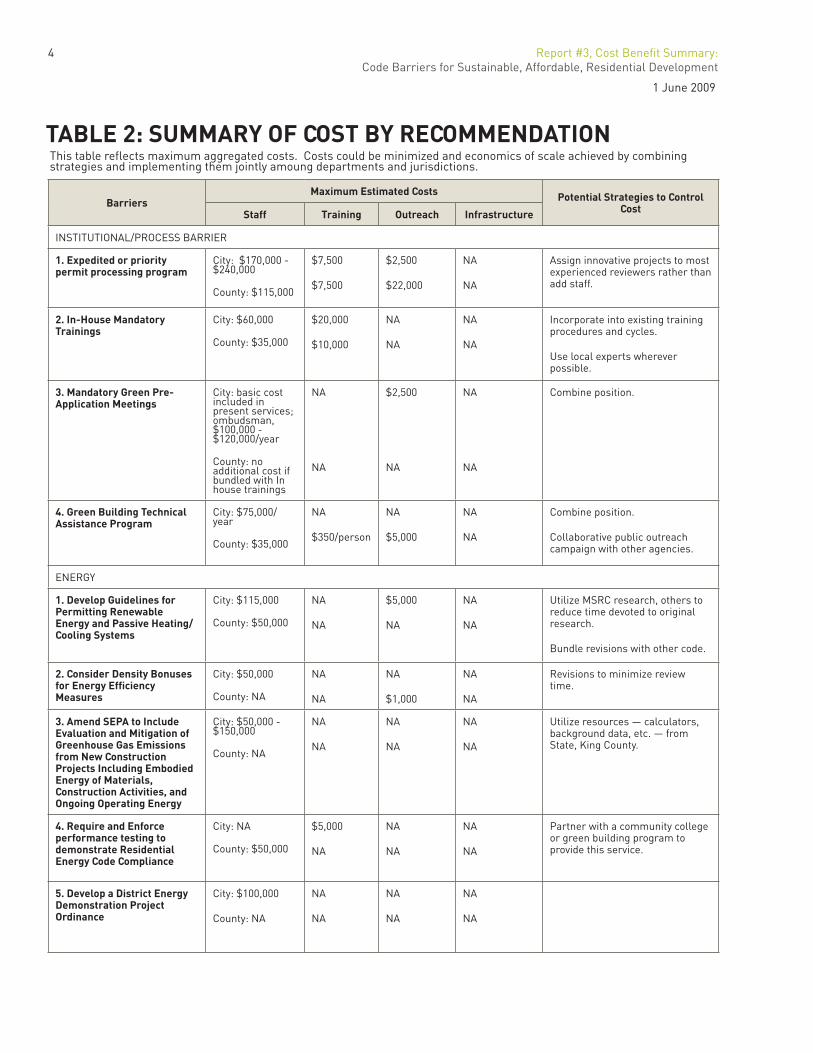
TABLE 2: SUMMARY OF COST BY RECOMMENDATION
Barriers Maximum Estimated Costs Potential Strategies to Control
CostStaff Training Outreach Infrastructure
INSTITUTIONAL/PROCESS BARRIER
1. Expedited or priority permit processing program
City: $170,000 - $240,000
County: $115,000
$7,500
$7,500
$2,500
$22,000
NA
NA
Assign innovative projects to most experienced reviewers rather than add staff.
2. In-House Mandatory Trainings
City: $60,000
County: $35,000
$20,000
$10,000
NA
NA
NA
NA
Incorporate into existing training procedures and cycles.
Use local experts wherever possible.
3. Mandatory Green Pre-Application Meetings
City: basic cost included in present services; ombudsman, $100,000 - $120,000/year
County: no additional cost if bundled with In house trainings
NA
NA
$2,500
NA
NA
NA
Combine position.
4. Green Building Technical Assistance Program
City: $75,000/year
County: $35,000
NA
$350/person
NA
$5,000
NA
NA
Combine position.
Collaborative public outreach campaign with other agencies.
ENERGY
1. Develop Guidelines for Permitting Renewable Energy and Passive Heating/Cooling Systems
City: $115,000
County: $50,000
NA
NA
$5,000
NA
NA
NA
Utilize MSRC research, others to reduce time devoted to original research.
Bundle revisions with other code.
2. Consider Density Bonuses for Energy Effi ciency Measures
City: $50,000
County: NA
NA
NA
NA
$1,000
NA
NA
Revisions to minimize review time.
3. Amend SEPA to Include Evaluation and Mitigation of Greenhouse Gas Emissions from New Construction Projects Including Embodied Energy of Materials, Construction Activities, and Ongoing Operating Energy
City: $50,000 - $150,000
County: NA
NA
NA
NA
NA
NA
NA
Utilize resources — calculators, background data, etc. — from State, King County.
4. Require and Enforce performance testing to demonstrate Residential Energy Code Compliance
City: NA
County: $50,000
$5,000
NA
NA
NA
NA
NA
Partner with a community college or green building program to provide this service.
5. Develop a District Energy Demonstration Project Ordinance
City: $100,000
County: NA
NA
NA
NA
NA
NA
NA
This table refl ects maximum aggregated costs. Costs could be minimized and economics of scale achieved by combining strategies and implementing them jointly amoung departments and jurisdictions.
Report #3, Cost Benefi t Summary: 5Code Barriers for Sustainable, Affordable, Residential Development
1 June 2009
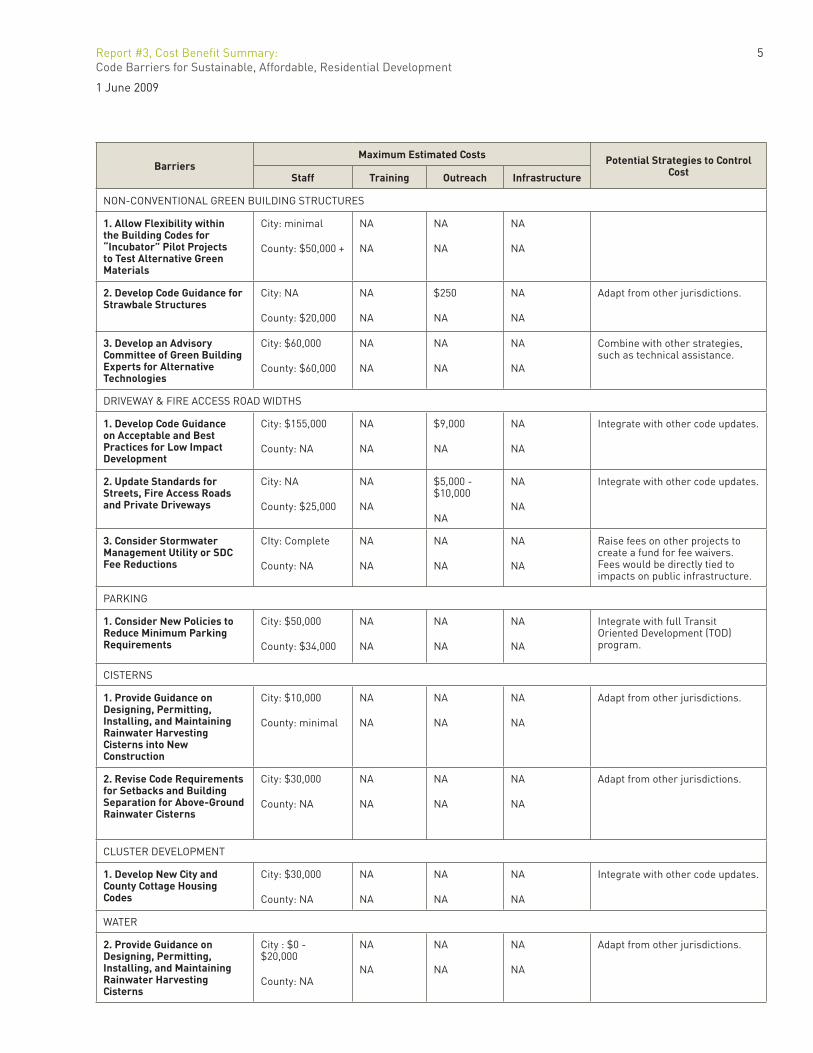
Barriers Maximum Estimated Costs Potential Strategies to Control
CostStaff Training Outreach Infrastructure
NON-CONVENTIONAL GREEN BUILDING STRUCTURES
1. Allow Flexibility within the Building Codes for “Incubator” Pilot Projects to Test Alternative Green Materials
City: minimal
County: $50,000 +
NA
NA
NA
NA
NA
NA
2. Develop Code Guidance for Strawbale Structures
City: NA
County: $20,000
NA
NA
$250
NA
NA
NA
Adapt from other jurisdictions.
3. Develop an Advisory Committee of Green Building Experts for Alternative Technologies
City: $60,000
County: $60,000
NA
NA
NA
NA
NA
NA
Combine with other strategies, such as technical assistance.
DRIVEWAY & FIRE ACCESS ROAD WIDTHS
1. Develop Code Guidance on Acceptable and Best Practices for Low Impact Development
City: $155,000
County: NA
NA
NA
$9,000
NA
NA
NA
Integrate with other code updates.
2. Update Standards for Streets, Fire Access Roads and Private Driveways
City: NA
County: $25,000
NA
NA
$5,000 - $10,000
NA
NA
NA
Integrate with other code updates.
3. Consider Stormwater Management Utility or SDC Fee Reductions
CIty: Complete
County: NA
NA
NA
NA
NA
NA
NA
Raise fees on other projects to create a fund for fee waivers. Fees would be directly tied to impacts on public infrastructure.
PARKING
1. Consider New Policies to Reduce Minimum Parking Requirements
City: $50,000
County: $34,000
NA
NA
NA
NA
NA
NA
Integrate with full Transit Oriented Development (TOD) program.
CISTERNS
1. Provide Guidance on Designing, Permitting, Installing, and Maintaining Rainwater Harvesting Cisterns into New Construction
City: $10,000
County: minimal
NA
NA
NA
NA
NA
NA
Adapt from other jurisdictions.
2. Revise Code Requirements for Setbacks and Building Separation for Above-Ground Rainwater Cisterns
City: $30,000
County: NA
NA
NA
NA
NA
NA
NA
Adapt from other jurisdictions.
CLUSTER DEVELOPMENT
1. Develop New City and County Cottage Housing Codes
City: $30,000
County: NA
NA
NA
NA
NA
NA
NA
Integrate with other code updates.
WATER
2. Provide Guidance on Designing, Permitting, Installing, and Maintaining Rainwater Harvesting Cisterns
City : $0 - $20,000
County: NA
NA
NA
NA
NA
NA
NA
Adapt from other jurisdictions.
6 Report #3, Cost Benefi t Summary: Code Barriers for Sustainable, Affordable, Residential Development
1 June 2009
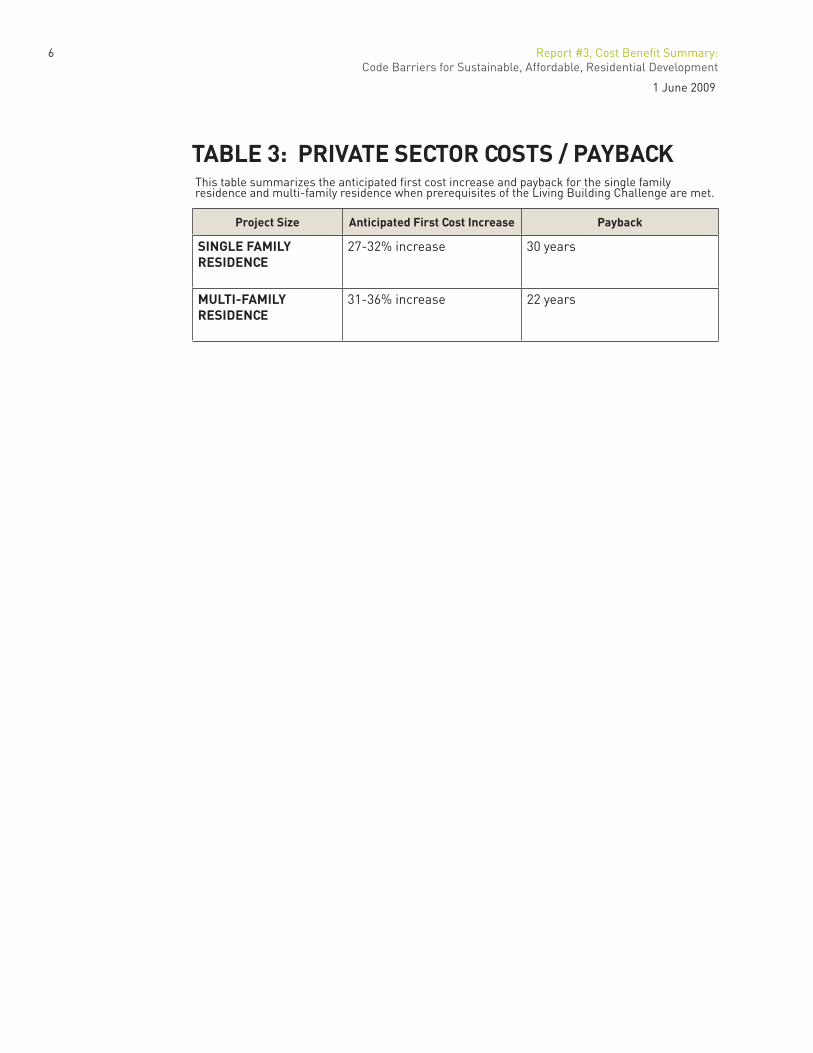
Project Size Anticipated First Cost Increase Payback
SINGLE FAMILYRESIDENCE
27-32% increase 30 years
MULTI-FAMILYRESIDENCE
31-36% increase 22 years
TABLE 3: PRIVATE SECTOR COSTS / PAYBACKThis table summarizes the anticipated fi rst cost increase and payback for the single family residence and multi-family residence when prerequisites of the Living Building Challenge are met.
Report #3, Cost Benefi t Summary: 7Code Barriers for Sustainable, Affordable, Residential Development
1 June 2009
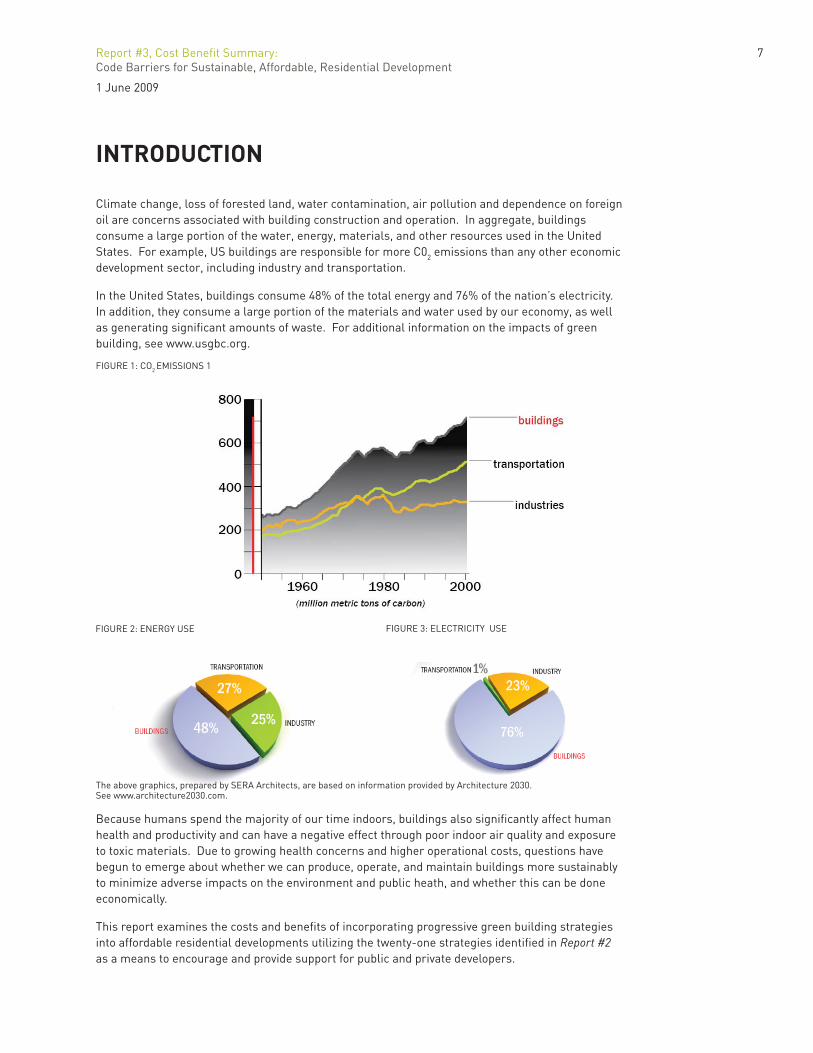
FIGURE 1: CO2 EMISSIONS 1
FIGURE 2: ENERGY USE FIGURE 3: ELECTRICITY USE
INTRODUCTION
Climate change, loss of forested land, water contamination, air pollution and dependence on foreign oil are concerns associated with building construction and operation. In aggregate, buildings consume a large portion of the water, energy, materials, and other resources used in the United States. For example, US buildings are responsible for more C02 emissions than any other economic development sector, including industry and transportation.
In the United States, buildings consume 48% of the total energy and 76% of the nation’s electricity. In addition, they consume a large portion of the materials and water used by our economy, as well as generating signifi cant amounts of waste. For additional information on the impacts of green building, see www.usgbc.org.
Because humans spend the majority of our time indoors, buildings also signifi cantly affect human health and productivity and can have a negative effect through poor indoor air quality and exposure to toxic materials. Due to growing health concerns and higher operational costs, questions have begun to emerge about whether we can produce, operate, and maintain buildings more sustainably to minimize adverse impacts on the environment and public heath, and whether this can be done economically.
This report examines the costs and benefi ts of incorporating progressive green building strategies into affordable residential developments utilizing the twenty-one strategies identifi ed in Report #2 as a means to encourage and provide support for public and private developers.
The above graphics, prepared by SERA Architects, are based on information provided by Architecture 2030. See www.architecture2030.com.
8 Report #3, Cost Benefi t Summary: Code Barriers for Sustainable, Affordable, Residential Development
1 June 2009
Code
Zoning VMC Title 20, CCC Title 40
Land Divisions VMC 20.320, CCC 40.540
Planned Unit Development VMC 20.260, CCC 40.520
Site Plan VMC 20.270, CCC 40.520
Grading VMC 17.12, CCC 14.07
Erosion Control VMC 14.24, CCC 40.380
Stormwater Management VMC 14.25, CCC 40.380
Parking Standards VMC 20.945, CCC 40.340
Street Standards VMC Title 11, CCC 40.350
International Building Code – 2006 Edition Standards and Amendments WAC 51-50
International Mechanical Code – 2006 Edition Standards and Amendments WAC 51-52
International Fire Code – 2006 Edition Standards and Amendments WAC 51-54
Uniform Plumbing Code – 2006 Edition Standards and Amendments WAC 51-56, 51-57
Washington State Energy Code – 2006 Edition WAC 51-11
Washington State Ventilation and Indoor Air Quality Code – 2006 Edition
WAC 51-13
On-site Sewage Systems CCC 24.17
Group A Public Drinking Water Systems WAC 246-290
Group B Public Drinking Water Systems WAC 246-291
Large On-Site Sewage Systems WAC 246-272B
Wastewater Treatment Facilities WAC 173-240
Evidence of Adequate Drinking Water Supply RCW 19.27.097
BACKGROUND
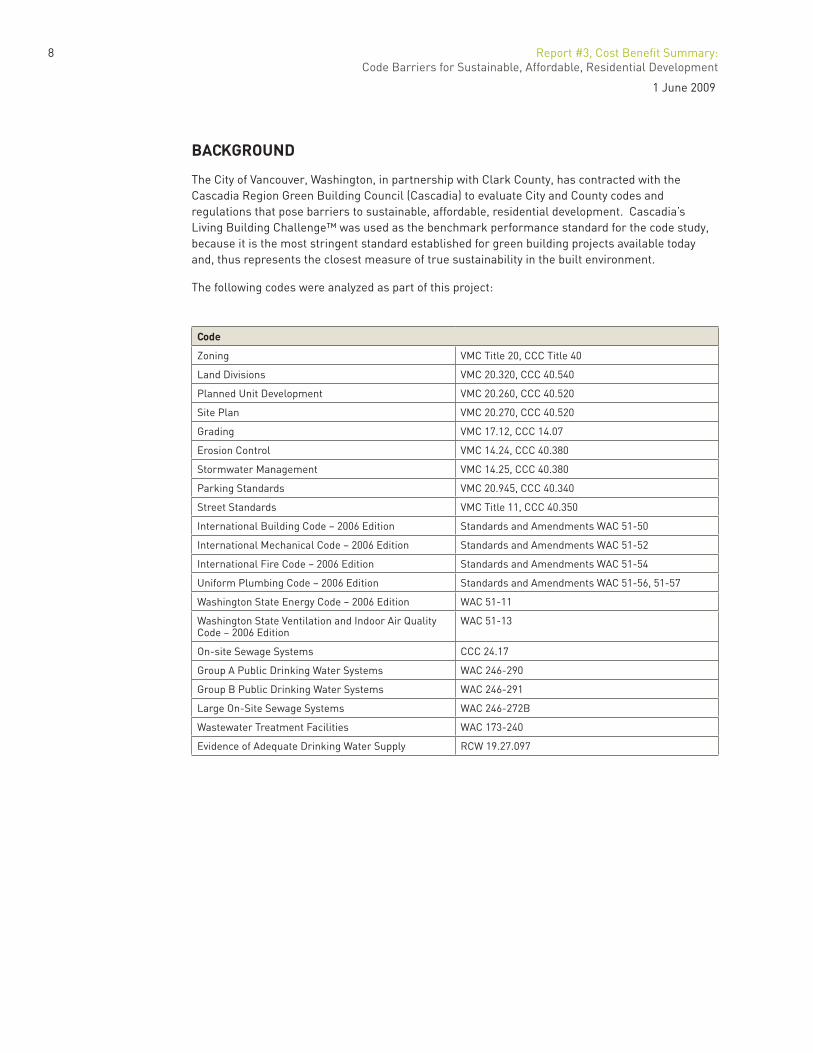
The City of Vancouver, Washington, in partnership with Clark County, has contracted with the Cascadia Region Green Building Council (Cascadia) to evaluate City and County codes and regulations that pose barriers to sustainable, affordable, residential development. Cascadia’s Living Building Challenge™ was used as the benchmark performance standard for the code study, because it is the most stringent standard established for green building projects available today and, thus represents the closest measure of true sustainability in the built environment.
The following codes were analyzed as part of this project:
Report #3, Cost Benefi t Summary: 9Code Barriers for Sustainable, Affordable, Residential Development
1 June 2009
In November 2008, Cascadia published Report #1: Findings, identifying more than 80 obstacles that currently exist within Vancouver and Clark County codes and regulations, which project teams may encounter when seeking approval for a Living Building project. Roughly 30 of these code barriers were found in the land use and development codes and another 50 were found within the building, mechanical, electrical, plumbing, fi re, ventilation and indoor air, and energy codes. Some of the barriers were directly related to City and County regulations, while others extended beyond the authority of the local jurisdictions to the State level. A full list of building, development, and land use code barriers was identifi ed in Report #1: Findings, which can be found online at: www.cityofvancouver.us/envplan.
Report #2: Strategies & Recommendations, published in April 2009, summarized a comprehensive list of strategies to address the barriers identifi ed in Report #1: Findings and divided them into 21 short-term and long-term recommendations. This prioritized list of key barriers was developed in order to assist the City and County with addressing and removing barriers to sustainable, affordable, residential development.
GOALS
The purposes of Report #3 are:
To provide an estimate of the benefi ts resulting from implementation of green building goals in • the context of sustainable, affordable, residential development;
To provide an estimate of the cost impacts of implementing the proposed code, standard and • policy recommendations delineated in Report #2 to the City and County; and
To provide an estimate of the cost impacts of sustainable development (as defi ned by the Living • Building Challenge) to developers and buyers of affordable, residential projects.

Report #3, Cost Benefi t Summary: 11Code Barriers for Sustainable, Affordable, Residential Development
1 June 2009
BENEFITS
The benefi ts of sustainable development can be categorized in three primary areas: Environmental Benefi ts, Societal Benefi ts, and Financial Benefi ts.
The benefi ts listed below are intended to demonstrate the breadth and diversity of potential positive outcomes that can be realized through sustainable building practices. References to studies and research regarding green building benefi ts are cited for areas where the benefi ts are not widely known or understood. The US Green Building Council’s website1 provides an excellent overview of both the impacts buildings have on the environment and the benefi ts from green building practices.
ENVIRONMENTAL BENEFITS
Sustainable development reduces the substantial impact buildings have on the natural environment, while increasing quality of life. Sustainable development also reduces fossil fuel use through energy effi ciency and on-site production of renewable energy, which in turn reduces climate change and air pollution. It also provides direct environmental benefi ts for local and global ecosystems through the use of environmentally-sustainable practices. Sustainable development reduces the amount of material added to the waste stream and helps to conserve natural resources. Finally, sustainable development reduces the pollutants off-gassing into our atmosphere, providing a benefi t to both human and non-human species.
• Reduced fossil fuel use and dependenceGreen buildings help to reduce fossil fuel consumption through energy effi ciency and the use of clean energy technologies. Fossil fuels – e.g. petroleum, coal, natural gas – are limited resources. As they become more scarce, they are likely to increase in cost and could contribute to growing global instability if they continue as the dominant energy source for global economies. Extraction and transport of petroleum and other fossil fuels are also linked to environmental degradation through air pollution at oil fi elds and refi neries, and water pollution through oil spills and the refi ning process.
• Reduced greenhouse gas emissionsIn addition to impacts associated with their extraction and scarcity, consumption of fossil fuels is linked to global climate change. The Architecture 2030 website states, “credible scientists give us 10 years to be well on our way toward global greenhouse gas (GHG) emissions reductions, in order to avoid catastrophic climate change. Yet there are hundreds of coal-fi red power plants currently on the drawing boards in the US. Seventy-six percent (76%) of the energy produced by these plants will go to operate buildings.“2
The phenomenon of climate
change is projected to lead to more volatile weather patterns and higher sea levels. The University of Arizona’s Department of Geosciences Environmental Studies Laboratory has mapped the increased sea levels estimated to result from increases in global temperature to demonstrate the catastrophic effects that could occur.3
• Enhanced protection of ecosystems Many green building strategies can help reduce impacts on ecosystems. Reducing the need for water reduces stress on local water infrastructure and allows more water from managed watersheds to be made available for aquatic ecosystems.
1 See www.usgbc.org/Display page.aspx?CMSPageID=1718.
2 See www.architecture2030.org.
3 See http://www.geo.arizona.edu/dges/research/other/climate_change_and_sea_level/sea_level_rise/fl orida/sir_usafl _i.htm.
12 Report #3, Cost Benefi t Summary: Code Barriers for Sustainable, Affordable, Residential Development
1 June 2009
Sustainably produced materials, such as forest products, can also signifi cantly reduce building impacts on ecosystems. For a forest product to be certifi ed as sustainable, the forest management unit must demonstrate responsible forestry practices, including forest ecosystem maintenance, long-term timber management plans, and wildlife surveys.
Green buildings also keep ecosystems intact through careful siting and correct sizing. Building on or near an ecosystem that is sensitive to human activity can easily harm wildlife by hampering breeding or destroying hunting grounds. Siting decisions that avoid the most sensitive lands, maintain appropriate buffers, and provide for habitat continuity can directly support healthy ecosystems.
• Improved air quality Currently, green building practices that improve air quality are mainly concentrated on reducing toxicity of the materials using strategies such as incorporating only low VOC (volatile organic compounds) materials and enhanced ventilation rates. When low toxicity materials are selected, the potential for industrial pollutants to be introduced into the air or water streams is reduced. Several strategies have indirect benefi ts on general outdoor air quality as well. For example, reducing energy use also reduces particulates and greenhouse gasses associated with conventional energy production. Recycling of demolition materials and use of materials with high recycled content can reduce pollutants related to waste incineration in areas where that is a common practice.
• Improved water quality Water quality is also improved through several green building strategies. On-site management of stormwater reduces the potential for pollution of waterways, especially where storm and sanitary sewers are combined. Treatment of stormwater with swales directly reduces phosphates and particulates in surface waters.
• Reduced waste Because green buildings incorporate recycled materials and reduce construction scrap materials, they prevent those materials from ending up in landfi lls. A green building can also be planned for deconstruction at the end of its lifetime, thus saving any reusable materials and preventing the release of toxins associated with building demolition.
• Conservation of natural resources One objective of green building seeks to reduce the consumption of material resources by mandating recycling and the wise use of resources during construction and by promoting the use of recycled building materials.
• Reduced pollutants Paint, adhesives, carpets, and wood contain a wide array of chemical pollutants. These toxic substances continue to be released into the indoor and outdoor atmosphere long after construction has been completed. They can contaminate the air and water, with some substances remaining in the environment for many years. Because green buildings contain low-emitting materials, they pose less of a risk to the building’s occupants and to the natural environment.
• Public Health Outcomes How communities are built affects human behavior which, in turn, affects public health. In their report, Understanding the Relationship between Public Health and the Built Environment, the LEED-ND® core committee summarized the positive relationship between smaller, dense development and physical activity, which results in fewer traffi c accidents, and improved respiratory health and mental health.4
4 Ewing, R. & Kreutzer, R., “Understanding the Relationship Between Public Health and the Built Environment: A Report Prepared for the LEED-ND Core Committee.
Report #3, Cost Benefi t Summary: 13Code Barriers for Sustainable, Affordable, Residential Development
1 June 2009
SOCIETAL BENEFITS
Several studies have been performed to better understand the less tangible, but real benefi ts sustainable developments provide to society as a whole. Because the benefi ts of improving visual, thermal, and acoustic environments are so diffi cult to measure, studies have instead assessed the increased productivity that results from living or working in these environments. Occupant comfort and health are enhanced by the introduction of daylighting. Potentially one of the most signifi cant improvements that can be made to the environment is improved air quality through reduced exposure to VOCs emitted by materials used during and after the building process. In addition, the societal benefi ts from sustainable development include minimized need to expand the capacity of local roads and utilities and reduced pressure from sprawl on prime agriculture lands.
• Enhanced occupant comfort and health/Improved quality of lifeNumerous studies have found that good ventilation, access to views, and exposure to natural daylight result in less sick days among building users, and can indirectly improve the quality of life.5 Two studies involving “more than 11,000 workers in 107 buildings in Europe also found increases in perceived productivity, fewer illness symptoms, and less absenteeism in buildings that provide workers with control over temperature and ventilation conditions compared to a control group.”6 A major link drawn includes increased productivity of users, which benefi ts society at large.
These comfort and health benefi ts also have been studied to indirectly analyze quality of life. For example, in schools, access to daylight has been linked to better student performance,7 while in retail settings, daylighting has been shown to improve sales.8
There are also directly attributable factors that infl uence human health which result from green building practices. For example, the Public Health and Economic Impact of Dampness and Mold study, completed in 2007, found “that exposure to dampness and mold in buildings poses a signifi cant public health risk, resulting in an economic impact of $3.5 billion each year.”9
• Minimize need to expand the capacity of local roads and utilities When green building projects manage stormwater on site or reduce the wastewater fl ow to public sewers, they can reduce the pressure to expand utility infrastructure, a signifi cant (and typically public) expense.
• Reduced pressure from sprawling development models on prime agricultural lands Green building strategies that favor clustered development and preservation of open space can help to preserve farmlands, as well as natural areas. Farmland close to a city is of especially high value because of its accessibility to consumers, which minimizes transit costs. This proximity also generally means the land nearest the city is under the most pressure to develop.
• Expansion of green practices industry-wideAn indirect, but important benefi t of sustainable development practices results from the experience and leadership of the businesses that adopt emerging practices. By adopting best practices, builders and others demonstrate their leadership, help improve the industry practices, and position themselves for future business development opportunities.
5 Judith Heerwagen, “Sustainable Design Can Be an Asset to the Bottom Line - expanded internet edition,” Environmental Design & Construction, Posted 07/15/02. Available at: http://www.edcmag.com/CDA/Article Information/features/BNP__Features__Item/0,4120,80724,00.html.
6 Ibid.
7 Lisa Heschong, “Daylighting In Schools: Reanalysis Report,” California Energy Commission available at www.newbuildings.org/downloads/FinalAttachments/A-3_Dayltg_Schools_2.2.5.pdf.
8 Lisa Heschong, “Daylighting In Retail Sales,” California Energy Commission available a www.newbuildings.org/downloads/Final Attachments/A-5_Daylgt_Retail_2.3.7.pdf.
9 Mudarri, D. & Fisk W., “ Public Health and Economic Impact of Dampness and Mold,” 2007.
14 Report #3, Cost Benefi t Summary: Code Barriers for Sustainable, Affordable, Residential Development
1 June 2009
FINANCIAL BENEFITS
The fi nancial benefi ts of green buildings include lower costs for energy, waste disposal, and water, as well as lower environmental and emissions costs, and lower operations and maintenance costs. In addition to the direct tangible benefi ts of lower operating costs, which are primarily a result of a reduction in energy use, sustainable development provides indirect value to the development’s inhabitants, through improved occupant health, happiness, and productivity, which in turn provides an economic benefi t to employers working in green buildings. Financial benefi ts can also be realized at the local or regional scale through the potential for greatly expanding markets for green products and services, which creates jobs and exportable skills and products.
• Reduced home / building operating costsPerhaps the most compelling argument for green buildings is their proven ability to provide monetary savings over time. “By incorporating green-building practices, Washingtonians and Oregonians could save more than $90 million each year in energy, water, and construction-related costs.“10 These savings come from better energy performance resulting from better insulation, more effi cient heating, cooling, and ventilation equipment, more effective and effi cient lighting, and by harnessing waste energy within the building. On-site renewable energy sources like solar, wind, and biomass can add to overall reductions in utility expenses.
• Expanded market for green product and services, resulting increased jobsThe market for green products and services continues to grow and expand at an exponential pace. Incorporating green building practices in local development further increases this emerging market, creates a demand for locally-made products, positions the region in a leadership role, and thereby can help strengthen our trade with out-of-region markets, as well. The Pacifi c Northwest is home to many green building experts and manufacturers of green products; thus increasing sustainable development also increases our regional brand.
• Improved occupant productivity and lower health care costs As noted above, sustainable developments will generally have happier, healthier and more productive occupants. “Recent studies reveal that buildings with good overall environmental quality can reduce the rate of respiratory disease, allergy, asthma, sick building symptoms, and enhance worker performance. The potential fi nancial benefi ts of improving indoor environments exceed costs by a factor of 8 to 14.“11 If an 8-14% increase in overall productivity is multiplied by the payroll cost of a business, the savings attributed to green building can be very high indeed.
• Optimized life-cycle economic performance An important, but often overlooked, green building strategy is to build for durability. A building component or system that is designed to perform well for a long period of time and be easily cleaned and serviced is likely to save money over the lifetime of a building.
• Reduced costs to maintain and expand infrastructure By reducing the need for new or larger roads and utilities, we save resources as well as dollars.
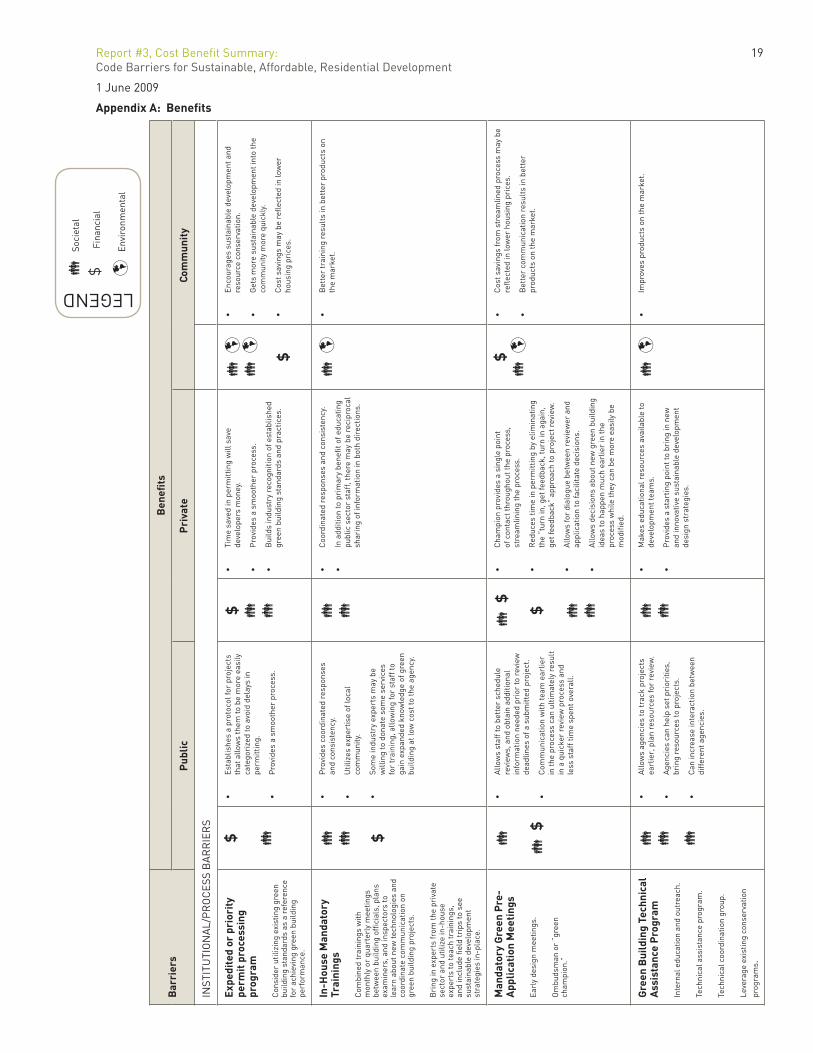
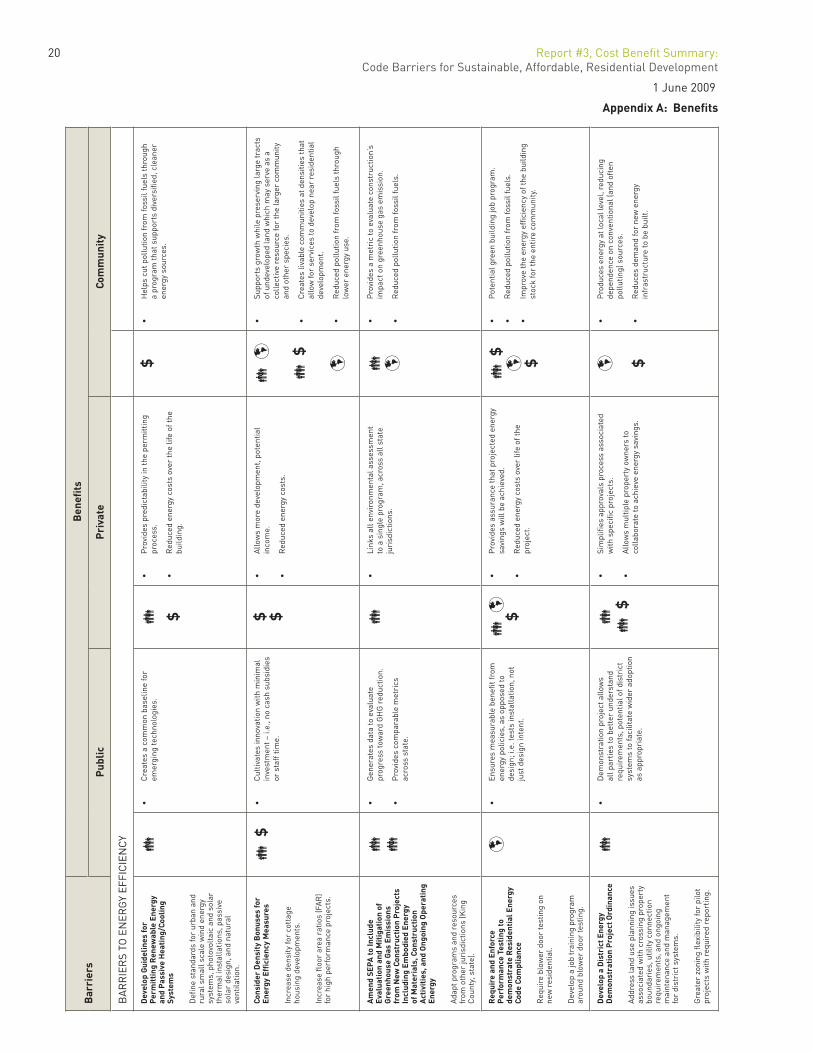
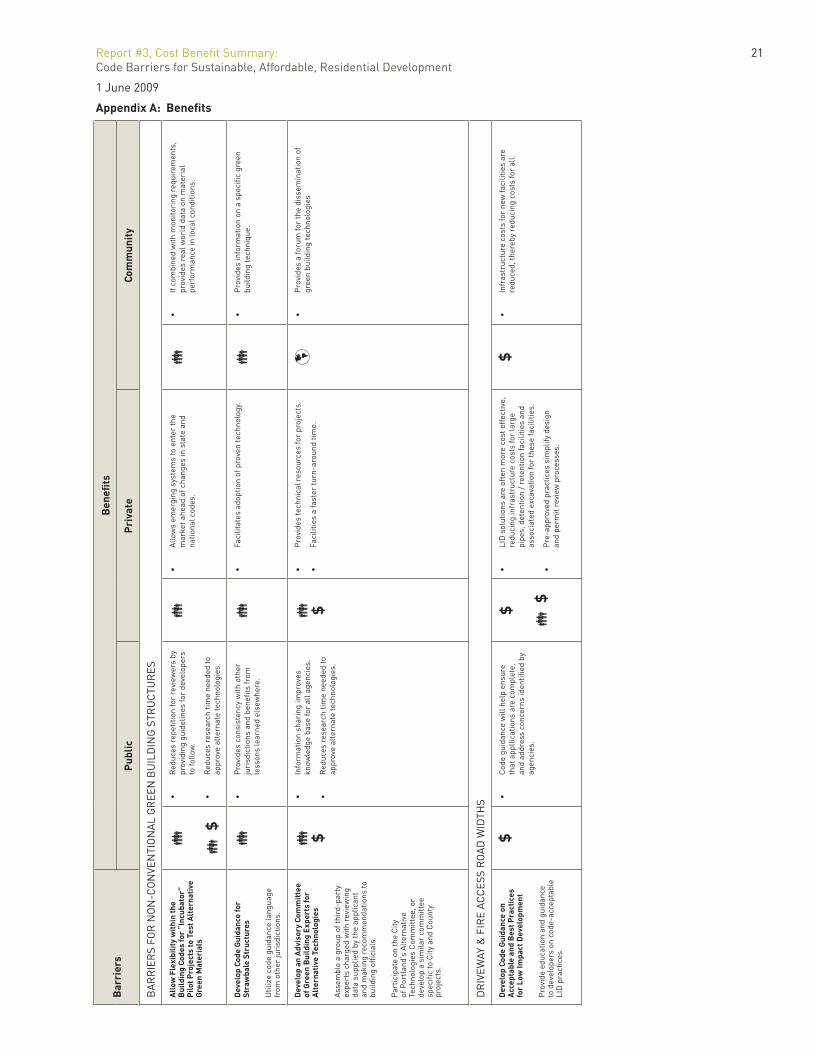
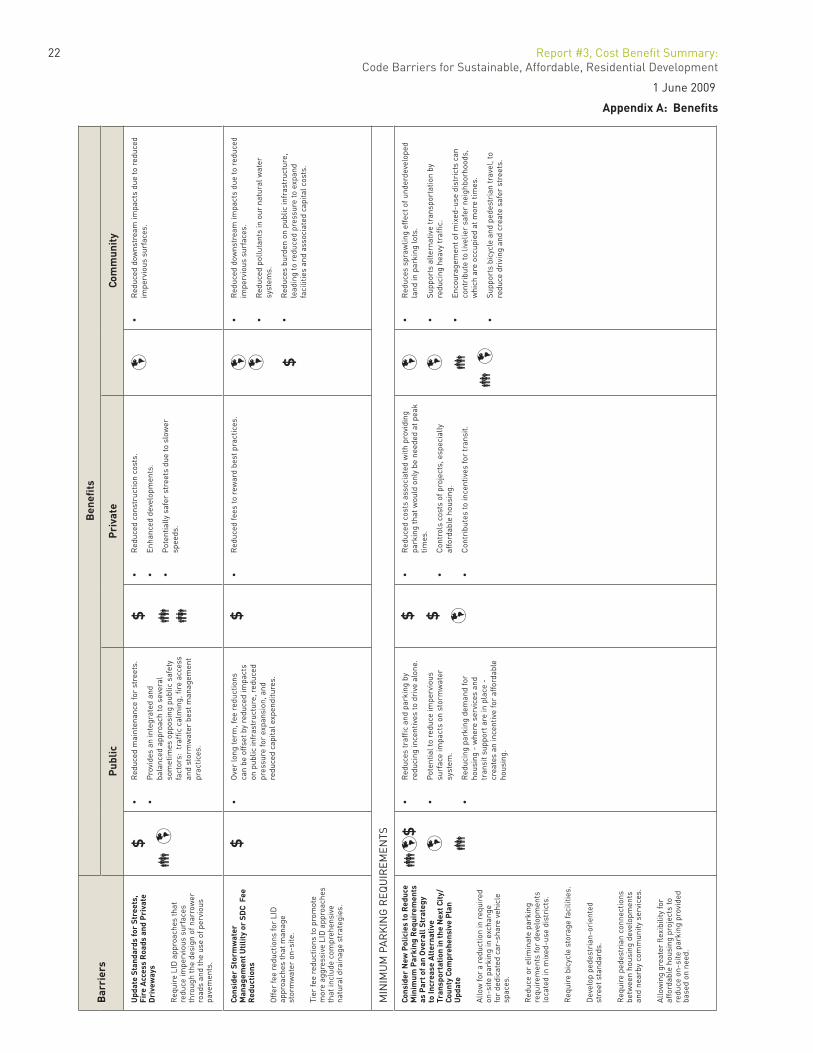
The specifi c environmental, societal, and fi nancial benefi ts for each of the twenty-one recommendations are summarized in Appendix A. The table is divided into three columns summarizing the public sector benefi ts, private sector benefi ts, and the benefi ts to the community at large. In addition, icons are assigned to fl ag when a benefi t is fi nancial, societal, or environmental. For many of the strategies, more than one category might apply.
10 ECONorthwest, “Green Building: Saving Salmon, the Environment, and Mondy on the Path to Sustainability Opportunities for the Pacifi c Northwest,” Available at www.econw.com/reports/Green-Building-Salmon-Environment-Sustainability_ECONorthwest.pdf.
11 William Fisk and Arthur Rosenfeld, “Potential Nationwide Improvements in Productivity and Health From Better Indoor Environments,” Lawrence Berkeley National Laboratory, May 1998TABLEi.
Report #3, Cost Benefi t Summary: 15Code Barriers for Sustainable, Affordable, Residential Development
1 June 2009
COSTS
The costs of implementing sustainable, affordable, residential development were broken into two main categories: Public Sector Costs, which include costs to the municipalities, and Private Sector Costs, which include costs to developers. Public sector costs need to be offset by fees or offset through increased funding from an already tight general fund, while private sector costs are usually transferred to buyers and renters.
PUBLIC SECTOR COSTS OF IMPLEMENTING THE 21 RECOMMENDATIONS
The costs for each of the 21 recommendations for implementation identifi ed in Report #2 are summarized in Table 2: Summary of Cost by Recommendation. They refl ect aggregated survey responses from City, County, and local Utility District staff, as well as from contacts with staff at King County, the City of Portland and the City of Eugene. The survey asked for detailed information on the staffi ng needs, training needs, infrastructure needs, and public outreach costs. Actual survey questions and summarized responses are presented in Appendix B.
Table 2: Summary of Cost by Recommendation also identifi es some key strategies for controlling implementation costs that were captured from survey responses. Several responses noted that one of the ways to reduce costs to the City and County would be through the joint implementation of some of the recommended programs. It should be emphasized that signifi cant savings to the public sector can be achieved by “bundling” multiple initiatives into one review process. Since a signifi cant part of the public sector’s process for approving code changes is administrative, e.g. public outreach mailings, staff time for setting meetings and hearings, etc., there will be effi ciencies in pursuing a comprehensive set of policy changes, rather than pursuing piecemeal changes.
PRIVATE SECTOR COSTS OF SUSTAINABLE, AFFORDABLE, RESIDENTIAL DEVELOPMENT
Background
Several studies have been done on the costs of adding sustainable design features to buildings. One study, Green Building Costs and Financial Benefi ts, states, “The average premium for these green buildings is slightly less than 2%, or $3-5/ft2, substantially lower than is commonly perceived.”12 Because of the prevalence of the LEED© rating system, most studies have compared conventional building projects to LEED projects. These studies have found results ranging from a very small cost premium (less than 1%) to a 6% cost premium for LEED Platinum projects. The Federal General Services Administration (GSA) study LEED Cost Study13 found a range for GSA buildings of between a -.04% cost decrease to 8.1% cost increase. The Davis Langdon study entitled The Cost of Green Revisited: Reexamining the Feasibility and Cost Impact of Sustainable Design in the Light of Increased Market Adoption14 found that “there is no signifi cant difference in average costs for green building as compared to non-green buildings.” This study evaluated 221 buildings in total, 83 LEED buildings and 138 non-LEED buildings. The buildings were categorized by type to facilitate comparison.
Less information is available on the potential cost increase for buildings achieving the Living Building standard. Two studies provide information in this area: The David and Lucile Packard
12 Gregory E. Kats, Capitol E, “Green Building Costs and Financial Benefi ts,” Massachusetts Technology Collaborative, available at www.cap-e.com/ewebeditpro/items/O59F3481.pdf
13 See www.wbdg.org/ccb/GSAMAN/gsaleed.pdf for the GSA Cost of LEED® Study.
14 See the Davis Langdon website http://www.davislangdon.com/USA/Research/ResearchFinder/2007-The-Cost-of-Green-Revisited for more information on the Cost of LEED® study.
16 Report #3, Cost Benefi t Summary: Code Barriers for Sustainable, Affordable, Residential Development
1 June 2009
Foundation’s Los Altos Project Sustainability Report15 and the Living Building Financial Study.16 The Packard report, fi rst completed in 2001 and updated in 2002, was the fi rst comprehensive look at the costs of all levels of LEED construction from Certifi ed through Platinum, including the Living Building. At that time, the Living Building was a conceptual framework and not a rating system, which meant many of the requirements of the Living Building project were not defi ned and thus could not be priced. Although the Packard matrix demonstrated that the level of Living Building was the best long term economic choice, the anticipated fi rst cost premium was signifi cant for the proposed project (a foundation headquarters located in California’s Bay Area).
A second study on the cost of Living Buildings entitled The Living Building Financial Study: The Effects of Climate, Building Type and Incentives on Creating the Buildings of Tomorrow17 was completed in April of 2009 by the team of SERA Architects, Skanska USA Building, Gerding /Edlen Development, New Buildings Institute, and Interface Engineering, along with Cascadia staff. This study evaluated nine different building types in four climate zones and found, “Living Buildings can be built cost effectively in today’s market-driven economy given the rising costs of energy and water.” The study went on to delineate the importance of building type, use, and scale, as well as the role of incentives on the affordability of this highest level of sustainability.
Understanding Costs to the City and County
In order to develop a scope for the cost to the City and County for implementing each of the 21 recommendations, a survey was sent to City, County, and local Utility District staff. The survey asked for detailed information on the staffi ng needs, training needs, infrastructure needs, and public outreach costs for each of the recommendations identifi ed in Report #2. The survey question responses are summarized in Appendix B. It was noted in several responses that one of the ways to reduce costs to the City and County would be through the joint implementation of some of the recommended programs.
Methodology for Estimating Costs and Premiums
The costs and premiums for building a Living Building were estimated using the protocol developed in The Living Building Financial Study, published by Cascadia. Calculations determined the increase in fi rst cost and the payback period for two projects: a multi-family and a single family residential project, which were considered representative of sustainable, affordable residential housing developments in the area.
Similar to the approach used to identify code barriers in Report #1, real projects were utilized both to simplify the methodology, as well as to provide a solid foundation for careful estimating. For the single-family residence, an 1,840 sf house, known as the Bacon Brenes House, was used as the cost model. For the multi-family residential project, the Tupelo Alley Development, a 140-unit mixed-use development was used. Each project’s cost estimate was divided into two areas: construction costs and owner / design build costs. Construction costs include costs for materials or systems and fees for contractor or subcontractor services. Owner / Design Build costs refer to costs borne by the developer, such as design fees, permit fees, carbon or habitat offsets, and incentives. Together, these two cost categories represent the total project cost. No costs were excluded, except for the cost of land, which is location specifi c and can vary widely. Each of the strategies added to the project is priced separately. For each strategy, the estimate displays the premium for the item on that division of work (e.g. Plumbing, Electrical, Mechanical) and the premium on percentage basis compared to the total cost of construction.
15 See http://www.bnim.com/fmi/xsl/research/packard/index.xsl for complete information of the Packard matrix and report. Visit the Packard Foundation website at http://www.packard.org/home.aspx for more information on the foundation.
16 See Cascadia’s website http://www.ilbi.org/resources/research/fi nancial-study for more information on the Living Building Financial Study.
17 Ibid.
Report #3, Cost Benefi t Summary: 17Code Barriers for Sustainable, Affordable, Residential Development
1 June 2009
Incentives available for sustainable development were subtracted from the total project cost. Specifi c incentives available for projects in the study area include: the Washington State Solar PV Incentive, the Washington State Solar Thermal Incentive (which is sales tax exempt), the Clark County Public Utilities Solar Thermal Rebate, and the Clark Public Utilities Residential Rebates. In addition, federal incentives for solar were also included. Finally, it was assumed that a Living Building, which has no public water or sewer usage, could receive a 50% reduction in the County and City’s systems development charges (SDC’s).
Cost premiums for Living Building strategies were priced assuming that the proposed modifi cations were a part of the original design, not incorporated late in the project design or construction. This is based on the reasonable assumption that a developer would decide at the outset of a project whether or not to pursue the Living Building Challenge, not when the project is nearing completion, which would cause substantial project cost increases. The strategies employed to achieve Living Building status were all based on current, readily available technologies, using products and techniques currently in use.
Similar to the value engineering process during design, where individual systems, products, or materials are analyzed for cost impacts and less expensive alternates, changes to meet the Living Building Challenge were analyzed on a net-impact basis across the various building trade disciplines (e.g. mechanical, electrical, plumbing, structural). Although the impacts of each measure on other systems were considered, detailed engineering was not completed. For example, in the multi-family residential project, the building was redesigned to have a different orientation, which resulted in a cost reduction due to reduced building envelope area. This modifi cation also created an energy conservation benefi t because of less heat loss, which was accounted for. However, a full energy model was not provided to verify if we could also reduce the size of the mechanical system beyond the reduction in effi ciencies achieved from modifying the mechanical systems as a separate energy conservation measure (ECM). Potentially because of the reduced heat loss from the improved building envelope, we might also be able to downsize the mechanical system, as well.
Methodology for Estimating Payback Period
The methodology developed in The Living Building Financial Study was also utilized to arrive at an estimated payback for developing the project as a Living Building. First, the cost estimating team compared the building baseline costs (i.e. costs of a building built per current code standard construction practices) to the costs projected for the Living Building modifi cation (adjusted to May 2009 dollars) to arrive at the present worth for each building. Energy and water usage for baseline buildings were calculated using an escalation rate of 3% for energy and water in accordance with Federal Energy Management Program (FEMP). Current energy and water rates were multiplied by the present worth factor of 24.165 (this factor refl ects a 30-year life cycle, 4.5% discount rate and 3% differential escalation). The total life cycle cost looks at both the annual cost and the present worth of the building to arrive at a present worth for the baseline building. The Living Building does not have any operational costs added to it as it has net zero energy and net zero water usage.
A major unknown, and unknowable, in these calculations is infl ation. It is also diffi cult to estimate how energy prices will change over time, especially considering that carbon emissions may become a nationally regulated or taxed commodity, which would establish a price for carbon and increase the price of carbon-fueled energy. The calculations used in the study follow the FEMP Modifi ed Uniform Present Value methodology18 for calculating the present value of energy costs or savings accruing over time. This is a relatively conservative approach because, while runaway infl ation is possible, it is even more likely that energy costs will rise and that carbon will soon have a cost that will increase energy costs more.
18 See NISTIR 85-3273 Energy Price indices and Discount Factors for Life-Cycle Cost Analysis; http://www1.eere.energy.gov/femp/pdfs/ashb08.pdf- 1102.4KB-EREN.
18 Report #3, Cost Benefi t Summary: Code Barriers for Sustainable, Affordable, Residential Development
1 June 2009
Results
Because of their small scale, residential buildings have one of the highest fi rst cost increases and a relatively long payback period (time needed to recapture the fi rst cost premium). In the City of Vancouver and Clark County the added costs for a net zero energy, net zero water, toxic free residence are anticipated to be between 27 and 32% for a single family residence and between 31 and 36% for a multi-family residence. The payback period varied depending on the assumed location of the structure, as the water and sewer rates vary slightly between residences inside the City of Vancouver and those outside the city limits. The payback period for a single family residence was approximately 30 years; for multi-family residential project, the payback period was 22 years.
It is interesting to note that varying choices (like eliminating a garage, changing building materials, or reducing house size) which were outside the parameters of this study, could negate the fi rst cost increases to achieving the Living Building Standard. Furthermore, the payback period is directly related to the cost of energy and water. If energy and water rates were higher, the calculated payback period would be reduced. Utility rates in Vancouver and Clark County are lower than other municipalities in the region where we have performed similar payback calculations. While lower rates may keep individual customer bills low, they also create a disincentive to building green in the local area.
Incentives also infl uence payback. Projects in the CIty of Vancouver and Clark County can utilize federal and state incentives for many of the project’s energy related features. Other jurisdictions offer additional incentives which lower fi rst costs further.
Report #3, Cost Benefi t Summary: 19Code Barriers for Sustainable, Affordable, Residential Development
1 June 2009
Appendix A: Benefi ts
Bar
rier
sB
enefi
ts
Pub
licP
riva
teCo
mm
unit
y
INST
ITU
TIO
NA
L/P
RO
CES
S B
AR
RIE
RS
Expe
dite
d or
pri
orit
y pe
rmit
pro
cess
ing
prog
ram
Con
side
r ut
ilizi
ng e
xist
ing
gree
n bu
ildin
g st
anda
rds
as a
ref
eren
ce
for
achi
evin
g gr
een
build
ing
perf
orm
ance
.
$Es
tabl
ishe
s a
prot
ocol
for
proj
ects
•
that
allo
ws
them
to b
e m
ore
easi
ly
cate
gori
zed
to a
void
del
ays
in
perm
ittin
g.
Pro
vide
s a
smoo
ther
pro
cess
.•
$Ti
me
save
d in
per
mitt
ing
will
sav
e •
deve
lope
rs m
oney
.
Pro
vide
s a
smoo
ther
pro
cess
.•
Bui
lds
indu
stry
rec
ogni
tion
of e
stab
lishe
d •
gree
n bu
ildin
g st
anda
rds
and
prac
tices
.
$
Enco
urag
es s
usta
inab
le d
evel
opm
ent a
nd
• re
sour
ce c
onse
rvat
ion.
Get
s m
ore
sust
aina
ble
deve
lopm
ent i
nto
the
• co
mm
unity
mor
e qu
ickl
y.
Cos
t sav
ings
may
be
refl e
cted
in lo
wer
•
hous
ing
pric
es.
In-H
ouse
Man
dato
ry
Trai
ning
s
Com
bine
d tr
aini
ngs
with
m
onth
ly o
r qu
arte
rly
mee
tings
be
twee
n bu
ildin
g offi c
ials
, pla
ns
exam
iner
s, a
nd in
spec
tors
to
lear
n ab
out n
ew te
chno
logi
es a
nd
coor
dina
te c
omm
unic
atio
n on
gr
een
build
ing
proj
ects
.
Bri
ng in
exp
erts
from
the
priv
ate
sect
or a
nd u
tiliz
e in
-hou
se
expe
rts
to te
ach
trai
ning
s,
and
incl
ude fi e
ld tr
ips
to s
ee
sust
aina
ble
deve
lopm
ent
stra
tegi
es in
-pla
ce.
$
Pro
vide
s co
ordi
nate
d re
spon
ses
• an
d co
nsis
tenc
y.
Util
izes
exp
ertis
e of
loca
l •
com
mun
ity.
Som
e in
dust
ry e
xper
ts m
ay b
e •
will
ing
to d
onat
e so
me
serv
ices
fo
r tr
aini
ng, a
llow
ing
for
staf
f to
gain
exp
ande
d kn
owle
dge
of g
reen
bu
ildin
g at
low
cos
t to
the
agen
cy.
Coo
rdin
ated
res
pons
es a
nd c
onsi
sten
cy.
•
In a
dditi
on to
pri
mar
y be
nefi t
of e
duca
ting
• pu
blic
sec
tor
staf
f, th
ere
may
be
reci
proc
al
shar
ing
of in
form
atio
n in
bot
h di
rect
ions
.
B
ette
r tr
aini
ng r
esul
ts in
bet
ter
prod
ucts
on
• th
e m
arke
t.
Man
dato
ry G
reen
Pre
-A
pplic
atio
n M
eeti
ngs
Earl
y de
sign
mee
tings
.
Om
buds
man
or
“gre
en
cham
pion
.”
$
Allo
ws
staf
f to
bett
er s
ched
ule
• re
view
s, a
nd o
btai
n ad
ditio
nal
info
rmat
ion
need
ed p
rior
to r
evie
w
dead
lines
of a
sub
mitt
ed p
roje
ct.
Com
mun
icat
ion
with
team
ear
lier
• in
the
proc
ess
can
ultim
atel
y re
sult
in
a q
uick
er r
evie
w p
roce
ss a
nd
less
sta
ff ti
me
spen
t ove
rall.
$ $
Cha
mpi
on p
rovi
des
a si
ngle
poi
nt
• of
con
tact
thro
ugho
ut th
e pr
oces
s,
stre
amlin
ing
the
proc
ess.
Red
uces
tim
e in
per
mitt
ing
by e
limin
atin
g •
the
“tur
n in
, get
feed
back
, tur
n in
aga
in,
get f
eedb
ack”
app
roac
h to
pro
ject
rev
iew
.
Allo
ws
for
dial
ogue
bet
wee
n re
view
er a
nd
• ap
plic
atio
n to
faci
litat
e de
cisi
ons.
Allo
ws
deci
sion
s ab
out n
ew g
reen
bui
ldin
g •
idea
s to
hap
pen
muc
h ea
rlie
r in
the
proc
ess
whi
le th
ey c
an b
e m
ore
easi
ly b
e m
odifi
ed.
$
Cos
t sav
ings
from
str
eam
lined
pro
cess
may
be
• refl e
cted
in lo
wer
hou
sing
pri
ces.
Bet
ter
com
mun
icat
ion
resu
lts
in b
ette
r •
prod
ucts
on
the
mar
ket.
Gre
en B
uild
ing
Tech
nica
l A
ssis
tanc
e P
rogr
am
Inte
rnal
edu
catio
n an
d ou
trea
ch.
Tech
nica
l ass
ista
nce
prog
ram
.
Tech
nica
l coo
rdin
atio
n gr
oup.
Leve
rage
exi
stin
g co
nser
vatio
n pr
ogra
ms.
Allo
ws
agen
cies
to tr
ack
proj
ects
•
earl
ier,
pla
n re
sour
ces
for
revi
ew.
Age
ncie
s ca
n he
lp s
et p
rior
ities
, •
brin
g re
sour
ces
to p
roje
cts.
Can
incr
ease
inte
ract
ion
betw
een
• di
ffer
ent a
genc
ies.
Mak
es e
duca
tiona
l res
ourc
es a
vaila
ble
to
• de
velo
pmen
t tea
ms.
Pro
vide
s a
star
ting
poin
t to
brin
g in
new
•
and
inno
vativ
e su
stai
nabl
e de
velo
pmen
t de
sign
str
ateg
ies.
Im
prov
es p
rodu
cts
on th
e m
arke
t.•
Soc
ieta
l
$
F
inan
cial
Env
iron
men
tal
LEGEND
20 Report #3, Cost Benefi t Summary: Code Barriers for Sustainable, Affordable, Residential Development
1 June 2009
Appendix A: Benefi ts
Bar
rier
sB
enefi
ts
Pub
licP
riva
teCo
mm
unit
y
BA
RR
IER
S TO
EN
ERG
Y EF
FIC
IEN
CY
Dev
elop
Gui
delin
es fo
r P
erm
itti
ng R
enew
able
Ene
rgy
and
Pas
sive
Hea
ting
/Coo
ling
Syst
ems
Defi
ne
stan
dard
s fo
r ur
ban
and
rura
l sm
all s
cale
win
d en
ergy
sy
stem
s, p
hoto
volt
aic
and
sola
r th
erm
al in
stal
latio
ns, p
assi
ve
sola
r de
sign
, and
nat
ural
ve
ntila
tion.
Cre
ates
a c
omm
on b
asel
ine
for
• em
ergi
ng te
chno
logi
es.
$
Pro
vide
s pr
edic
tabi
lity
in th
e pe
rmitt
ing
• pr
oces
s.
Red
uced
ene
rgy
cost
s ov
er th
e lif
e of
the
• bu
ildin
g.
$H
elps
cut
pol
lutio
n fr
om fo
ssil
fuel
s th
roug
h •
a pr
ogra
m th
at s
uppo
rts
dive
rsifi
ed, c
lean
er
ener
gy s
ourc
es.
Cons
ider
Den
sity
Bon
uses
for
Ener
gy E
ffi c
ienc
y M
easu
res
Incr
ease
den
sity
for
cott
age
hous
ing
deve
lopm
ents
.
Incr
ease
fl oo
r ar
ea r
atio
s (F
AR
) fo
r hi
gh p
erfo
rman
ce p
roje
cts.
$C
ultiv
ates
inno
vatio
n w
ith m
inim
al
• in
vest
men
t – i.
e., n
o ca
sh s
ubsi
dies
or
sta
ff ti
me.
$ $A
llow
s m
ore
deve
lopm
ent,
pote
ntia
l •
inco
me.
Red
uced
ene
rgy
cost
s.•
$
Supp
orts
gro
wth
whi
le p
rese
rvin
g la
rge
trac
ts
• of
und
evel
oped
land
whi
ch m
ay s
erve
as
a co
llect
ive
reso
urce
for
the
larg
er c
omm
unity
an
d ot
her
spec
ies.
Cre
ates
liva
ble
com
mun
ities
at d
ensi
ties
that
•
allo
w fo
r se
rvic
es to
dev
elop
nea
r re
side
ntia
l de
velo
pmen
t.
Red
uced
pol
lutio
n fr
om fo
ssil
fuel
s th
roug
h •
low
er e
nerg
y us
e.
Am
end
SEPA
to In
clud
e Ev
alua
tion
and
Mit
igat
ion
of
Gre
enho
use
Gas
Em
issi
ons
from
New
Con
stru
ctio
n P
roje
cts
Incl
udin
g Em
bodi
ed E
nerg
y of
Mat
eria
ls, C
onst
ruct
ion
Act
ivit
ies,
and
Ong
oing
Ope
rati
ng
Ener
gy
Ada
pt p
rogr
ams
and
reso
urce
s fr
om o
ther
juri
sdic
tions
(Kin
g C
ount
y, s
tate
).
Gen
erat
es d
ata
to e
valu
ate
• pr
ogre
ss to
war
d G
HG
red
uctio
n.
Pro
vide
s co
mpa
rabl
e m
etri
cs
• ac
ross
sta
te.
Link
s al
l env
iron
men
tal a
sses
smen
t •
to a
sin
gle
prog
ram
, acr
oss
all s
tate
ju
risd
ictio
ns.
Pro
vide
s a
met
ric
to e
valu
ate
cons
truc
tion’
s •
impa
ct o
n gr
eenh
ouse
gas
em
issi
on.
Red
uced
pol
lutio
n fr
om fo
ssil
fuel
s.•
Req
uire
and
Enf
orce
P
erfo
rman
ce T
esti
ng to
de
mon
stra
te R
esid
enti
al E
nerg
y Co
de C
ompl
ianc
e
Req
uire
blo
wer
doo
r te
stin
g on
ne
w r
esid
entia
l.
Dev
elop
a jo
b tr
aini
ng p
rogr
am
arou
nd b
low
er d
oor
test
ing.
Ensu
res
mea
sura
ble
benefi t
from
•
ener
gy p
olic
ies,
as
oppo
sed
to
desi
gn; i
.e. t
ests
inst
alla
tion,
not
ju
st d
esig
n in
tent
.
$
Pro
vide
s as
sura
nce
that
pro
ject
ed e
nerg
y •
savi
ngs
will
be
achi
eved
.
Red
uced
ene
rgy
cost
s ov
er li
fe o
f the
•
proj
ect.
$ $
Pot
entia
l gre
en b
uild
ing
job
prog
ram
.•
Red
uced
pol
lutio
n fr
om fo
ssil
fuel
s.•
Impr
ove
the
ener
gy e
ffi ci
ency
of t
he b
uild
ing
• st
ock
for
the
entir
e co
mm
unity
.
Dev
elop
a D
istr
ict E
nerg
y D
emon
stra
tion
Pro
ject
Ord
inan
ce
Add
ress
land
use
pla
nnin
g is
sues
as
soci
ated
with
cro
ssin
g pr
oper
ty
boun
dari
es, u
tility
con
nect
ion
requ
irem
ents
, and
ong
oing
m
aint
enan
ce a
nd m
anag
emen
t fo
r di
stri
ct s
yste
ms.
Gre
ater
zon
ing fl e
xibi
lity
for
pilo
t pr
ojec
ts w
ith r
equi
red
repo
rtin
g.
Dem
onst
ratio
n pr
ojec
t allo
ws
• al
l par
ties
to b
ette
r un
ders
tand
re
quir
emen
ts, p
oten
tial o
f dis
tric
t sy
stem
s to
faci
litat
e w
ider
ado
ptio
n as
app
ropr
iate
.
$
Sim
plifi
es a
ppro
vals
pro
cess
ass
ocia
ted
• w
ith s
pecifi c
pro
ject
s.
Allo
ws
mul
tiple
pro
pert
y ow
ners
to
• co
llabo
rate
to a
chie
ve e
nerg
y sa
ving
s.
$
Pro
duce
s en
ergy
at l
ocal
leve
l, re
duci
ng
• de
pend
ence
on
conv
entio
nal (
and
ofte
n po
llutin
g) s
ourc
es.
Red
uces
dem
and
for
new
ene
rgy
• in
fras
truc
ture
to b
e bu
ilt.
Report #3, Cost Benefi t Summary: 21Code Barriers for Sustainable, Affordable, Residential Development
1 June 2009
Appendix A: Benefi tsB
arri
ers
Ben
efi t
s
Pub
licP
riva
teCo
mm
unit
y
BA
RR
IER
S FO
R N
ON
-CO
NVE
NTI
ON
AL
GR
EEN
BU
ILD
ING
STR
UC
TUR
ES
All
ow F
lexi
bilit
y w
ithi
n th
e B
uild
ing
Code
s fo
r “I
ncub
ator
” P
ilot P
roje
cts
to T
est A
lter
nati
ve
Gre
en M
ater
ials
$
Red
uces
rep
etiti
on fo
r re
view
ers
by
• pr
ovid
ing
guid
elin
es fo
r de
velo
pers
to
follo
w.
Red
uces
res
earc
h tim
e ne
eded
to
• ap
prov
e al
tern
ate
tech
nolo
gies
.
Allo
ws
emer
ging
sys
tem
s to
ent
er th
e •
mar
ket a
head
of c
hang
es in
sta
te a
nd
natio
nal c
odes
.
If co
mbi
ned
with
mon
itori
ng r
equi
rem
ents
, •
prov
ides
rea
l wor
ld d
ata
on m
ater
ial
perf
orm
ance
in lo
cal c
ondi
tions
.
Dev
elop
Cod
e G
uida
nce
for
Stra
wba
le S
truc
ture
s
Util
ize
code
gui
danc
e la
ngua
ge
from
oth
er ju
risd
ictio
ns.
Pro
vide
s co
nsis
tenc
y w
ith o
ther
•
juri
sdic
tions
and
ben
efi t
s fr
om
less
ons
lear
ned
else
whe
re.
Faci
litat
es a
dopt
ion
of p
rove
n te
chno
logy
.•
Pro
vide
s in
form
atio
n on
a s
pecifi c
gre
en
• bu
ildin
g te
chni
que.
Dev
elop
an
Adv
isor
y Co
mm
itte
e of
Gre
en B
uild
ing
Expe
rts
for
Alt
erna
tive
Tec
hnol
ogie
s
Ass
embl
e a
grou
p of
thir
d-pa
rty
expe
rts
char
ged
with
rev
iew
ing
data
sup
plie
d by
the
appl
ican
t an
d m
akin
g re
com
men
datio
ns to
bu
ildin
g offi c
ials
.
Par
ticip
ate
on th
e C
ity
of P
ortl
and’
s A
lter
nativ
e Te
chno
logi
es C
omm
ittee
, or
deve
lop
a si
mila
r co
mm
ittee
sp
ecifi
c to
City
and
Cou
nty
proj
ects
.
$
Info
rmat
ion
shar
ing
impr
oves
•
know
ledg
e ba
se fo
r al
l age
ncie
s.
Red
uces
res
earc
h tim
e ne
eded
to
• ap
prov
e al
tern
ate
tech
nolo
gies
.
$
Pro
vide
s te
chni
cal r
esou
rces
for
proj
ects
.•
Faci
litie
s a
fast
er tu
rn-a
roun
d tim
e.•
Pro
vide
s a
foru
m fo
r th
e di
ssem
inat
ion
of
• gr
een
build
ing
tech
nolo
gies
DR
IVEW
AY &
FIR
E AC
CES
S R
OA
D W
IDTH
S
Dev
elop
Cod
e G
uida
nce
on
Acc
epta
ble
and
Bes
t Pra
ctic
es
for
Low
Impa
ct D
evel
opm
ent
Pro
vide
edu
catio
n an
d gu
idan
ce
to d
evel
oper
s on
cod
e-ac
cept
able
LI
D p
ract
ices
.
$C
ode
guid
ance
will
hel
p en
sure
•
that
app
llica
tions
are
com
plet
e,
and
addr
ess
conc
erns
iden
tifi e
d by
ag
enci
es.
$ $
LID
sol
utio
ns a
re o
ften
mor
e co
st e
ffec
tive,
•
redu
cing
infr
astr
uctu
re c
osts
for
larg
e pi
pes,
det
entio
n / r
eten
tion
faci
litie
s an
d as
soci
ated
exc
avat
ion
for
thes
e fa
cilit
ies.
Pre
-app
rove
d pr
actic
es s
impl
ify d
esig
n •
and
perm
it re
view
pro
cess
es.
$In
fras
truc
ture
cos
ts fo
r ne
w fa
cilit
ies
are
• re
duce
d, th
ereb
y re
duci
ng c
osts
for
all.
22 Report #3, Cost Benefi t Summary: Code Barriers for Sustainable, Affordable, Residential Development
1 June 2009
Appendix A: Benefi tsB
arri
ers
Ben
efi t
s
Pub
licP
riva
teCo
mm
unit
y
Upd
ate
Stan
dard
s fo
r St
reet
s,
Fire
Acc
ess
Roa
ds a
nd P
riva
te
Dri
vew
ays
Req
uire
LID
app
roac
hes
that
re
duce
impe
rvio
us s
urfa
ces
thro
ugh
the
desi
gn o
f nar
row
er
road
s an
d th
e us
e of
per
viou
s pa
vem
ents
.
$
Red
uced
mai
nten
ance
for
stre
ets.
•
Pro
vide
s an
inte
grat
ed a
nd
• ba
lanc
ed a
ppro
ach
to s
ever
al
som
etim
es o
ppos
ing
publ
ic s
afet
y fa
ctor
s: t
raffi
c ca
lmin
g, fi
re a
cces
s an
d st
orm
wat
er b
est m
anag
emen
t pr
actic
es.
$R
educ
ed c
onst
ruct
ion
cost
s.•
Enha
nced
dev
elop
men
ts.
•
Pot
entia
lly s
afer
str
eets
due
to s
low
er
• sp
eeds
.
Red
uced
dow
nstr
eam
impa
cts
due
to r
educ
ed
• im
perv
ious
sur
face
s.
Cons
ider
Sto
rmw
ater
M
anag
emen
t Uti
lity
or S
DC
Fee
R
educ
tion
s
Off
er fe
e re
duct
ions
for
LID
ap
proa
ches
that
man
age
stor
mw
ater
on-
site
.
Tier
fee
redu
ctio
ns to
pro
mot
e m
ore
aggr
essi
ve L
ID a
ppro
ache
s th
at in
clud
e co
mpr
ehen
sive
na
tura
l dra
inag
e st
rate
gies
.
$O
ver
long
term
, fee
red
uctio
ns
• ca
n be
off
set b
y re
duce
d im
pact
s on
pub
lic in
fras
truc
ture
, red
uced
pr
essu
re fo
r ex
pans
ion,
and
re
duce
d ca
pita
l exp
endi
ture
s.
$R
educ
ed fe
es to
rew
ard
best
pra
ctic
es.
•
$
Red
uced
dow
nstr
eam
impa
cts
due
to r
educ
ed
• im
perv
ious
sur
face
s.
Red
uced
pol
luta
nts
in o
ur n
atur
al w
ater
•
syst
ems.
Red
uces
bur
den
on p
ublic
infr
astr
uctu
re,
• le
adin
g to
red
uced
pre
ssur
e to
exp
and
faci
litie
s an
d as
soci
ated
cap
ital c
osts
.
MIN
IMU
M P
AR
KIN
G R
EQU
IREM
ENTS
Cons
ider
New
Pol
icie
s to
Red
uce
Min
imum
Par
king
Req
uire
men
ts
as P
art o
f an
Ove
rall
Str
ateg
y to
Incr
ease
Alt
erna
tive
Tr
ansp
orta
tion
in th
e N
ext C
ity/
Coun
ty C
ompr
ehen
sive
Pla
n U
pdat
e
Allo
w fo
r a
redu
ctio
n in
req
uire
d on
-site
par
king
in e
xcha
nge
for
dedi
cate
d ca
r-sh
are
vehi
cle
spac
es.
Red
uce
or e
limin
ate
park
ing
requ
irem
ents
for
deve
lopm
ents
lo
cate
d in
mix
ed-u
se d
istr
icts
.
Req
uire
bic
ycle
sto
rage
faci
litie
s.
Dev
elop
ped
estr
ian-
orie
nted
st
reet
sta
ndar
ds.
Req
uire
ped
estr
ian
conn
ectio
ns
betw
een
hous
ing
deve
lopm
ents
an
d ne
arby
com
mun
ity s
ervi
ces.
Allo
win
g gr
eate
r fl e
xibi
lity
for
affo
rdab
le h
ousi
ng p
roje
cts
to
redu
ce o
n-si
te p
arki
ng p
rovi
ded
base
d on
nee
d.
$R
educ
es tr
affi c
and
par
king
by
• re
duci
ng in
cent
ives
to d
rive
alo
ne.
Pot
entia
l to
redu
ce im
perv
ious
•
surf
ace
impa
cts
on s
torm
wat
er
syst
em.
Red
ucin
g pa
rkin
g de
man
d fo
r •
hous
ing
- w
here
ser
vice
s an
d tr
ansi
t sup
port
are
in p
lace
-
crea
tes
an in
cent
ive
for
affo
rdab
le
hous
ing.
$ $
Red
uced
cos
ts a
ssoc
iate
d w
ith p
rovi
ding
•
park
ing
that
wou
ld o
nly
be n
eede
d at
pea
k tim
es.
Con
trol
s co
sts
of p
roje
cts,
esp
ecia
lly
• af
ford
able
hou
sing
.
Con
trib
utes
to in
cent
ives
for
tran
sit.
•
Red
uces
spr
awlin
g ef
fect
of u
nder
deve
lope
d •
land
in p
arki
ng lo
ts.
Supp
orts
alt
erna
tive
tran
spor
tatio
n by
•
redu
cing
hea
vy tr
affi c
.
Enco
urag
emen
t of m
ixed
-use
dis
tric
ts c
an
• co
ntri
bute
to li
velie
r sa
fer
neig
hbor
hood
s,
whi
ch a
re o
ccup
ied
at m
ore
times
.
Supp
orts
bic
ycle
and
ped
estr
ian
trav
el, t
o •
redu
ce d
rivi
ng a
nd c
reat
e sa
fer
stre
ets.
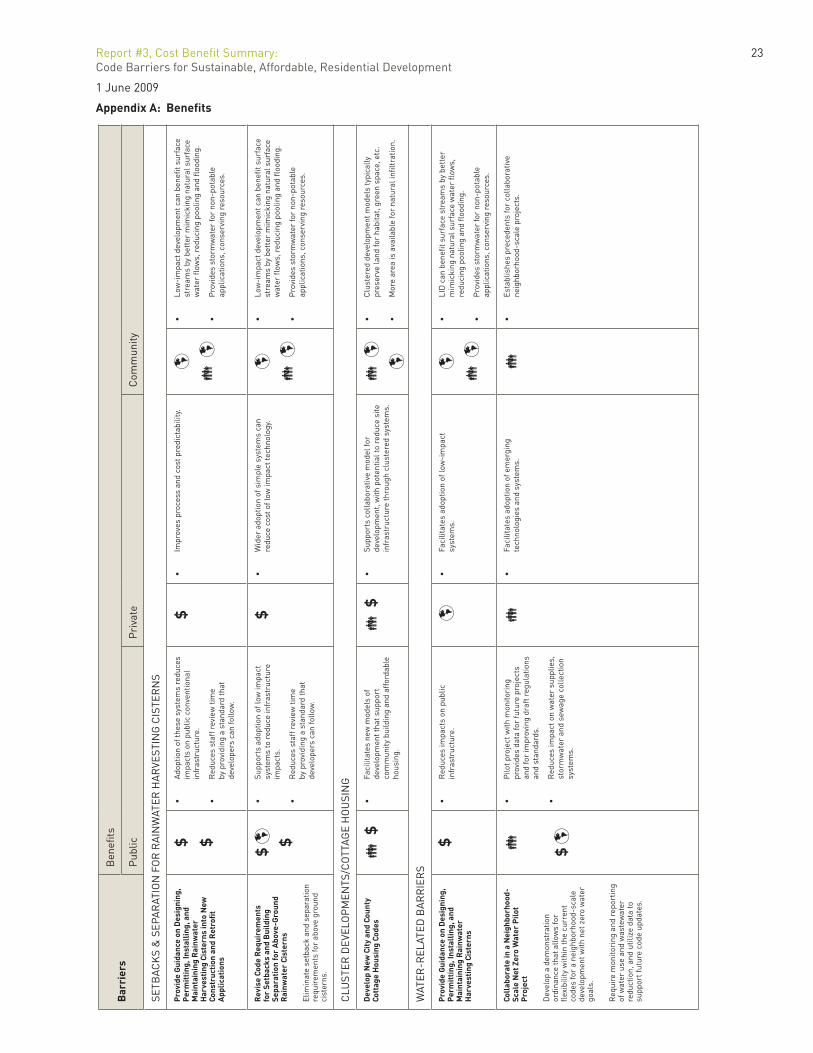
Report #3, Cost Benefi t Summary: 23Code Barriers for Sustainable, Affordable, Residential Development
1 June 2009
Appendix A: Benefi tsB
arri
ers
Ben
efi t
s
Pub
licP
riva
teC
omm
unity
SETB
ACK
S &
SEP
AR
ATIO
N F
OR
RA
INW
ATER
HA
RVE
STIN
G C
ISTE
RN
S
Pro
vide
Gui
danc
e on
Des
igni
ng,
Per
mit
ting
, Ins
tall
ing,
and
M
aint
aini
ng R
ainw
ater
H
arve
stin
g Ci
ster
ns in
to N
ew
Cons
truc
tion
and
Ret
rofi t
A
pplic
atio
ns
$ $
Ado
ptio
n of
thes
e sy
stem
s re
duce
s •
impa
cts
on p
ublic
con
vent
iona
l in
fras
truc
ture
.
Red
uces
sta
ff r
evie
w ti
me
• by
pro
vidi
ng a
sta
ndar
d th
at
deve
lope
rs c
an fo
llow
.
$Im
prov
es p
roce
ss a
nd c
ost p
redi
ctab
ility
.•
Low
-im
pact
dev
elop
men
t can
ben
efi t
sur
face
•
stre
ams
by b
ette
r m
imic
king
nat
ural
sur
face
w
ater
fl ow
s, r
educ
ing
pool
ing
and fl o
odin
g.
Pro
vide
s st
orm
wat
er fo
r no
n-po
tabl
e •
appl
icat
ions
, con
serv
ing
reso
urce
s.
Rev
ise
Code
Req
uire
men
ts
for
Setb
acks
and
Bui
ldin
g Se
para
tion
for
Abo
ve-G
roun
d R
ainw
ater
Cis
tern
s
Elim
inat
e se
tbac
k an
d se
para
tion
requ
irem
ents
for
abov
e gr
ound
ci
ster
ns.
$ $
Supp
orts
ado
ptio
n of
low
impa
ct
• sy
stem
s to
red
uce
infr
astr
uctu
re
impa
cts.
Red
uces
sta
ff r
evie
w ti
me
• by
pro
vidi
ng a
sta
ndar
d th
at
deve
lope
rs c
an fo
llow
.
$W
ider
ado
ptio
n of
sim
ple
syst
ems
can
• re
duce
cos
t of l
ow im
pact
tech
nolo
gy.
Low
-im
pact
dev
elop
men
t can
ben
efi t
sur
face
•
stre
ams
by b
ette
r m
imic
king
nat
ural
sur
face
w
ater
fl ow
s, r
educ
ing
pool
ing
and fl o
odin
g.
Pro
vide
s st
orm
wat
er fo
r no
n-po
tabl
e •
appl
icat
ions
, con
serv
ing
reso
urce
s.
CLU
STER
DEV
ELO
PM
ENTS
/CO
TTAG
E H
OU
SIN
G
Dev
elop
New
Cit
y an
d Co
unty
Co
ttag
e H
ousi
ng C
odes
$Fa
cilit
ates
new
mod
els
of
• de
velo
pmen
t tha
t sup
port
co
mm
unity
bui
ldin
g an
d af
ford
able
ho
usin
g.
$Su
ppor
ts c
olla
bora
tive
mod
el fo
r •
deve
lopm
ent,
with
pot
entia
l to
redu
ce s
ite
infr
astr
uctu
re th
roug
h cl
uste
red
syst
ems.
C
lust
ered
dev
elop
men
t mod
els
typi
cally
•
pres
erve
land
for
habi
tat,
gree
n sp
ace,
etc
.
Mor
e ar
ea is
ava
ilabl
e fo
r na
tura
l infi
ltra
tion.
•
WAT
ER-R
ELAT
ED B
AR
RIE
RS
Pro
vide
Gui
danc
e on
Des
igni
ng,
Per
mit
ting
, Ins
tall
ing,
and
M
aint
aini
ng R
ainw
ater
H
arve
stin
g Ci
ster
ns
$R
educ
es im
pact
s on
pub
lic
• in
fras
truc
ture
.
Faci
litat
es a
dopt
ion
of lo
w-i
mpa
ct
• sy
stem
s.
LID
can
ben
efi t
sur
face
str
eam
s by
bet
ter
• m
imic
king
nat
ural
sur
face
wat
er fl
ows,
re
duci
ng p
oolin
g an
d fl o
odin
g.
Pro
vide
s st
orm
wat
er fo
r no
n-po
tabl
e •
appl
icat
ions
, con
serv
ing
reso
urce
s.
Coll
abor
ate
in a
Nei
ghbo
rhoo
d-Sc
ale
Net
Zer
o W
ater
Pilo
t P
roje
ct
Dev
elop
a d
emon
stra
tion
ordi
nanc
e th
at a
llow
s fo
r fl e
xibi
lity
with
in th
e cu
rren
t co
des
for
a ne
ighb
orho
od-s
cale
de
velo
pmen
t with
net
zer
o w
ater
go
als.
Req
uire
mon
itori
ng a
nd r
epor
ting
of w
ater
use
and
was
tew
ater
re
duct
ion,
and
util
ize
data
to
supp
ort f
utur
e co
de u
pdat
es.
$
Pilo
t pro
ject
with
mon
itori
ng
• pr
ovid
es d
ata
for
futu
re p
roje
cts
and
for
impr
ovin
g dr
aft r
egul
atio
ns
and
stan
dard
s.
Red
uces
impa
ct o
n w
ater
sup
plie
s,
• st
orm
wat
er a
nd s
ewag
e co
llect
ion
syst
ems.
Faci
litat
es a
dopt
ion
of e
mer
ging
•
tech
nolo
gies
and
sys
tem
s.Es
tabl
ishe
s pr
eced
ents
for
colla
bora
tive
• ne
ighb
orho
od-s
cale
pro
ject
s.
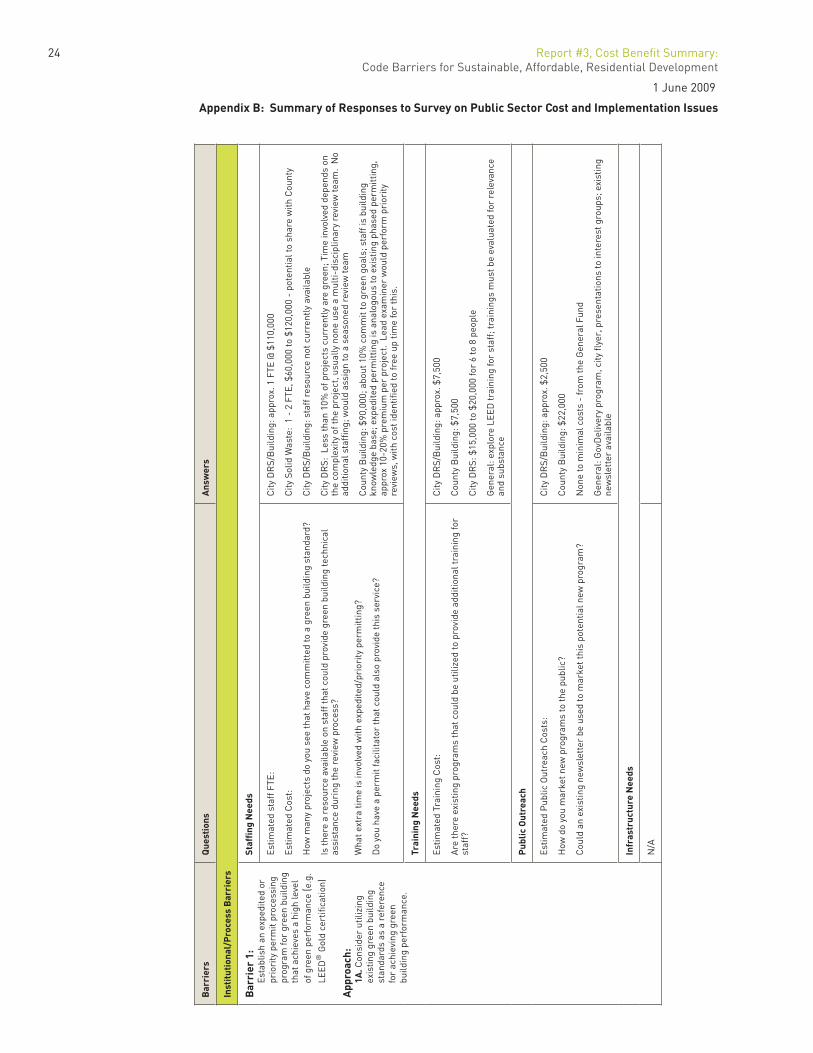
24 Report #3, Cost Benefi t Summary: Code Barriers for Sustainable, Affordable, Residential Development
1 June 2009
Appendix B: Summary of Responses to Survey on Public Sector Cost and Implementation Issues
Bar
rier
sQ
uest
ions
Ans
wer
s
Inst
itut
iona
l/P
roce
ss B
arri
ers
Bar
rier
1:
Es
tabl
ish
an e
xped
ited
or
prio
rity
per
mit
proc
essi
ng
prog
ram
for
gree
n bu
ildin
g th
at a
chie
ves
a hi
gh le
vel
of g
reen
per
form
ance
(e.g
.
LEED
® G
old
cert
ifi ca
tion)
App
roac
h:
1A
. Con
side
r ut
ilizi
ng
exis
ting
gree
n bu
ildin
g st
anda
rds
as a
ref
eren
ce
for
achi
evin
g gr
een
build
ing
perf
orm
ance
.
Staffi n
g N
eeds
Estim
ated
sta
ff F
TE:
Estim
ated
Cos
t:
How
man
y pr
ojec
ts d
o yo
u se
e th
at h
ave
com
mitt
ed to
a g
reen
bui
ldin
g st
anda
rd?
Is th
ere
a re
sour
ce a
vaila
ble
on s
taff
that
cou
ld p
rovi
de g
reen
bui
ldin
g te
chni
cal
assi
stan
ce d
urin
g th
e re
view
pro
cess
?
Wha
t ext
ra ti
me
is in
volv
ed w
ith e
xped
ited/
prio
rity
per
mitt
ing?
Do
you
have
a p
erm
it fa
cilit
ator
that
cou
ld a
lso
prov
ide
this
ser
vice
?
City
DR
S/B
uild
ing:
app
rox.
1 F
TE @
$11
0,00
0
City
Sol
id W
aste
: 1
- 2
FTE,
$60
,000
to $
120,
000
- po
tent
ial t
o sh
are
with
Cou
nty
City
DR
S/B
uild
ing:
sta
ff r
esou
rce
not c
urre
ntly
ava
ilabl
e
City
DR
S: L
ess
than
10%
of p
roje
cts
curr
entl
y ar
e gr
een;
Tim
e in
volv
ed d
epen
ds o
n th
e co
mpl
exity
of t
he p
roje
ct, u
sual
ly n
one
use
a m
ulti-
disc
iplin
ary
revi
ew te
am.
No
addi
tiona
l sta
ffi ng
; wou
ld a
ssig
n to
a s
easo
ned
revi
ew te
am
Cou
nty
Bui
ldin
g: $
90,0
00; a
bout
10%
com
mit
to g
reen
goa
ls; s
taff
is b
uild
ing
know
ledg
e ba
se; e
xped
ited
perm
ittin
g is
ana
logo
us to
exi
stin
g ph
ased
per
mitt
ing,
ap
prox
10-
20%
pre
miu
m p
er p
roje
ct.
Lead
exa
min
er w
ould
per
form
pri
ority
re
view
s, w
ith c
ost i
dent
ifi ed
to fr
ee u
p tim
e fo
r th
is.
Trai
ning
Nee
ds
Estim
ated
Tra
inin
g C
ost:
Are
ther
e ex
istin
g pr
ogra
ms
that
cou
ld b
e ut
ilize
d to
pro
vide
add
ition
al tr
aini
ng fo
r st
aff?
City
DR
S/B
uild
ing:
app
rox.
$7,
500
Cou
nty
Bui
ldin
g: $
7,50
0
City
DR
S: $
15,0
00 to
$20
,000
for
6 to
8 p
eopl
e
Gen
eral
: exp
lore
LEE
D tr
aini
ng fo
r st
aff;
trai
ning
s m
ust b
e ev
alua
ted
for
rele
vanc
e an
d su
bsta
nce
Pub
lic O
utre
ach
Estim
ated
Pub
lic O
utre
ach
Cos
ts:
How
do
you
mar
ket n
ew p
rogr
ams
to th
e pu
blic
?
Cou
ld a
n ex
istin
g ne
wsl
ette
r be
use
d to
mar
ket t
his
pote
ntia
l new
pro
gram
?
City
DR
S/B
uild
ing:
app
rox.
$2,
500
Cou
nty
Bui
ldin
g: $
22,0
00
Non
e to
min
imal
cos
ts -
from
the
Gen
eral
Fun
d
Gen
eral
: Gov
Del
iver
y pr
ogra
m, c
ity fl
yer,
pre
sent
atio
ns to
inte
rest
gro
ups;
exi
stin
g ne
wsl
ette
r av
aila
ble
Infr
astr
uctu
re N
eeds
N/A
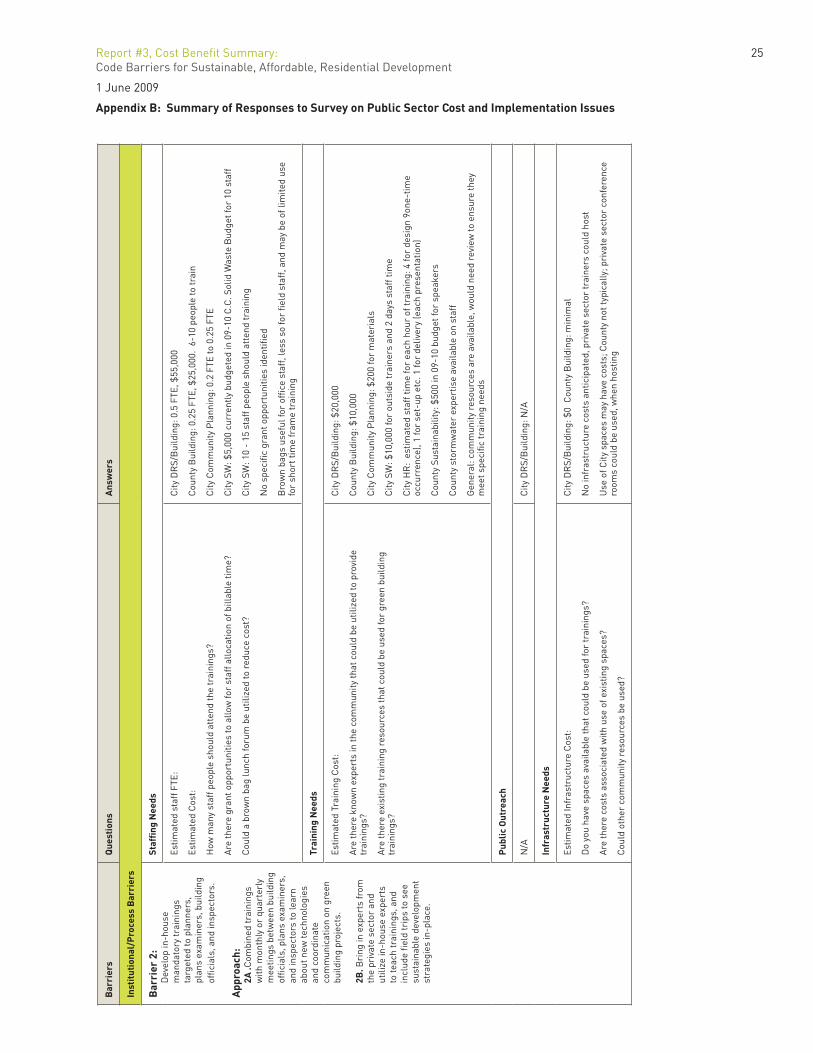
Report #3, Cost Benefi t Summary: 25Code Barriers for Sustainable, Affordable, Residential Development
1 June 2009
Appendix B: Summary of Responses to Survey on Public Sector Cost and Implementation IssuesB
arri
ers
Que
stio
nsA
nsw
ers
Inst
itut
iona
l/P
roce
ss B
arri
ers
Bar
rier
2:
D
evel
op in
-hou
se
man
dato
ry tr
aini
ngs
targ
eted
to p
lann
ers,
pl
ans
exam
iner
s, b
uild
ing
offi c
ials
, and
insp
ecto
rs.
App
roac
h:
2A
.Com
bine
d tr
aini
ngs
with
mon
thly
or
quar
terl
y m
eetin
gs b
etw
een
build
ing
offi c
ials
, pla
ns e
xam
iner
s,
and
insp
ecto
rs to
lear
n ab
out n
ew te
chno
logi
es
and
coor
dina
te
com
mun
icat
ion
on g
reen
bu
ildin
g pr
ojec
ts.
2B
. Bri
ng in
exp
erts
from
th
e pr
ivat
e se
ctor
and
ut
ilize
in-h
ouse
exp
erts
to
teac
h tr
aini
ngs,
and
in
clud
e fi e
ld tr
ips
to s
ee
sust
aina
ble
deve
lopm
ent
stra
tegi
es in
-pla
ce.
Staffi n
g N
eeds
Estim
ated
sta
ff F
TE:
Estim
ated
Cos
t:
How
man
y st
aff p
eopl
e sh
ould
att
end
the
trai
ning
s?
Are
ther
e gr
ant o
ppor
tuni
ties
to a
llow
for
staf
f allo
catio
n of
bill
able
tim
e?
Cou
ld a
bro
wn
bag
lunc
h fo
rum
be
utili
zed
to r
educ
e co
st?
City
DR
S/B
uild
ing:
0.5
FTE
, $55
,000
Cou
nty
Bui
ldin
g: 0
.25
FTE,
$25
,000
. 6-
10 p
eopl
e to
trai
n
City
Com
mun
ity P
lann
ing:
0.2
FTE
to 0
.25
FTE
City
SW
: $5,
000
curr
entl
y bu
dget
ed in
09-
10 C
.C. S
olid
Was
te B
udge
t for
10
staf
f
City
SW
: 10
- 15
sta
ff p
eopl
e sh
ould
att
end
trai
ning
No
spec
ifi c
gran
t opp
ortu
nitie
s id
entifi
ed
Bro
wn
bags
use
ful f
or o
ffi ce
sta
ff, l
ess
so fo
r fi e
ld s
taff
, and
may
be
of li
mite
d us
e fo
r sh
ort t
ime
fram
e tr
aini
ng
Trai
ning
Nee
ds
Estim
ated
Tra
inin
g C
ost:
Are
ther
e kn
own
expe
rts
in th
e co
mm
unity
that
cou
ld b
e ut
ilize
d to
pro
vide
tr
aini
ngs?
Are
ther
e ex
istin
g tr
aini
ng r
esou
rces
that
cou
ld b
e us
ed fo
r gr
een
build
ing
trai
ning
s?
City
DR
S/B
uild
ing:
$20
,000
Cou
nty
Bui
ldin
g: $
10,0
00
City
Com
mun
ity P
lann
ing:
$20
0 fo
r m
ater
ials
City
SW
: $10
,000
for
outs
ide
trai
ners
and
2 d
ays
staf
f tim
e
City
HR
: es
timat
ed s
taff
tim
e fo
r ea
ch h
our
of tr
aini
ng: 4
for
desi
gn 9
one-
time
occu
rren
ce),
1 fo
r se
t-up
etc
. 1 fo
r de
liver
y (e
ach
pres
enta
tion)
Cou
nty
Sust
aina
bilit
y: $
500
in 0
9-10
bud
get f
or s
peak
ers
Cou
nty
stor
mw
ater
exp
ertis
e av
aila
ble
on s
taff
Gen
eral
: com
mun
ity r
esou
rces
are
ava
ilabl
e, w
ould
nee
d re
view
to e
nsur
e th
ey
mee
t spe
cifi c
trai
ning
nee
ds
Pub
lic O
utre
ach
N/A
City
DR
S/B
uild
ing:
N/A
Infr
astr
uctu
re N
eeds
Estim
ated
Infr
astr
uctu
re C
ost:
Do
you
have
spa
ces
avai
labl
e th
at c
ould
be
used
for
trai
ning
s?
Are
ther
e co
sts
asso
ciat
ed w
ith u
se o
f exi
stin
g sp
aces
?
Cou
ld o
ther
com
mun
ity r
esou
rces
be
used
?
City
DR
S/B
uild
ing:
$0
Cou
nty
Bui
ldin
g: m
inim
al
No
infr
astr
uctu
re c
osts
ant
icip
ated
, pri
vate
sec
tor
trai
ners
cou
ld h
ost
Use
of C
ity s
pace
s m
ay h
ave
cost
s; C
ount
y no
t typ
ical
ly; p
riva
te s
ecto
r co
nfer
ence
ro
oms
coul
d be
use
d, w
hen
host
ing
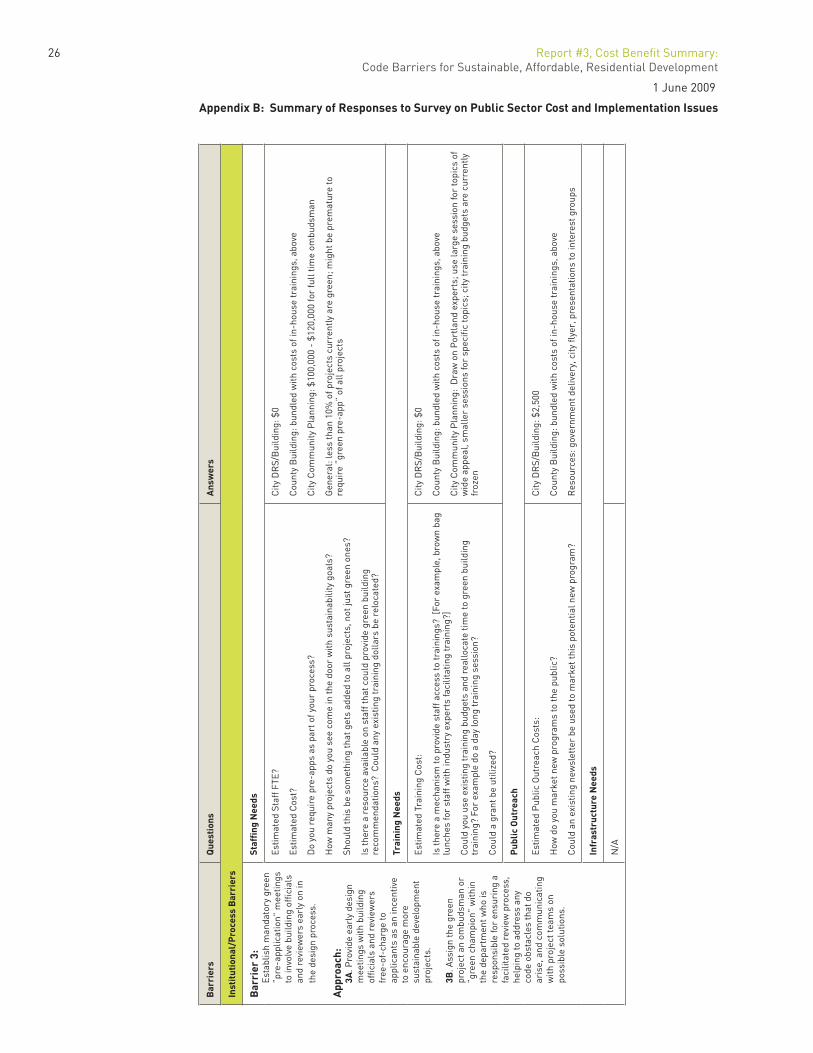
26 Report #3, Cost Benefi t Summary: Code Barriers for Sustainable, Affordable, Residential Development
1 June 2009
Appendix B: Summary of Responses to Survey on Public Sector Cost and Implementation Issues
Bar
rier
sQ
uest
ions
Ans
wer
s
Inst
itut
iona
l/P
roce
ss B
arri
ers
Bar
rier
3:
Es
tabl
ish
man
dato
ry g
reen
“p
re-a
pplic
atio
n” m
eetin
gs
to in
volv
e bu
ildin
g offi c
ials
an
d re
view
ers
earl
y on
in
the
desi
gn p
roce
ss.
App
roac
h:
3A
. Pro
vide
ear
ly d
esig
n m
eetin
gs w
ith b
uild
ing
offi c
ials
and
rev
iew
ers
free
-of-
char
ge to
ap
plic
ants
as
an in
cent
ive
to e
ncou
rage
mor
e su
stai
nabl
e de
velo
pmen
t pr
ojec
ts.
3B
. Ass
ign
the
gree
n pr
ojec
t an
ombu
dsm
an o
r “g
reen
cha
mpi
on”
with
in
the
depa
rtm
ent w
ho is
re
spon
sibl
e fo
r en
suri
ng a
fa
cilit
ated
rev
iew
pro
cess
, he
lpin
g to
add
ress
any
co
de o
bsta
cles
that
do
aris
e, a
nd c
omm
unic
atin
g w
ith p
roje
ct te
ams
on
poss
ible
sol
utio
ns.
Staffi n
g N
eeds
Estim
ated
Sta
ff F
TE?
Estim
ated
Cos
t?
Do
you
requ
ire
pre-
apps
as
part
of y
our
proc
ess?
How
man
y pr
ojec
ts d
o yo
u se
e co
me
in th
e do
or w
ith s
usta
inab
ility
goa
ls?
Shou
ld th
is b
e so
met
hing
that
get
s ad
ded
to a
ll pr
ojec
ts, n
ot ju
st g
reen
one
s?
Is th
ere
a re
sour
ce a
vaila
ble
on s
taff
that
cou
ld p
rovi
de g
reen
bui
ldin
g re
com
men
datio
ns?
Cou
ld a
ny e
xist
ing
trai
ning
dol
lars
be
relo
cate
d?
City
DR
S/B
uild
ing:
$0
Cou
nty
Bui
ldin
g: b
undl
ed w
ith c
osts
of i
n-ho
use
trai
ning
s, a
bove
City
Com
mun
ity P
lann
ing:
$10
0,00
0 -
$120
,000
for
full
time
ombu
dsm
an
Gen
eral
: les
s th
an 1
0% o
f pro
ject
s cu
rren
tly
are
gree
n; m
ight
be
prem
atur
e to
re
quir
e “g
reen
pre
-app
” of
all
proj
ects
Trai
ning
Nee
ds
Estim
ated
Tra
inin
g C
ost:
Is th
ere
a m
echa
nism
to p
rovi
de s
taff
acc
ess
to tr
aini
ngs?
[Fo
r ex
ampl
e, b
row
n ba
g lu
nche
s fo
r st
aff w
ith in
dust
ry e
xper
ts fa
cilit
atin
g tr
aini
ng?]
Cou
ld y
ou u
se e
xist
ing
trai
ning
bud
gets
and
rea
lloca
te ti
me
to g
reen
bui
ldin
g tr
aini
ng?
For
exam
ple
do a
day
long
trai
ning
ses
sion
?
Cou
ld a
gra
nt b
e ut
ilize
d?
City
DR
S/B
uild
ing:
$0
Cou
nty
Bui
ldin
g: b
undl
ed w
ith c
osts
of i
n-ho
use
trai
ning
s, a
bove
City
Com
mun
ity P
lann
ing:
Dra
w o
n P
ortl
and
expe
rts;
use
larg
e se
ssio
n fo
r to
pics
of
wid
e ap
peal
, sm
alle
r se
ssio
ns fo
r sp
ecifi
c to
pics
; city
trai
ning
bud
gets
are
cur
rent
ly
froz
en
Pub
lic O
utre
ach
Estim
ated
Pub
lic O
utre
ach
Cos
ts:
How
do
you
mar
ket n
ew p
rogr
ams
to th
e pu
blic
?
Cou
ld a
n ex
istin
g ne
wsl
ette
r be
use
d to
mar
ket t
his
pote
ntia
l new
pro
gram
?
City
DR
S/B
uild
ing:
$2,
500
Cou
nty
Bui
ldin
g: b
undl
ed w
ith c
osts
of i
n-ho
use
trai
ning
s, a
bove
Res
ourc
es: g
over
nmen
t del
iver
y, c
ity fl
yer,
pre
sent
atio
ns to
inte
rest
gro
ups
Infr
astr
uctu
re N
eeds
N/A
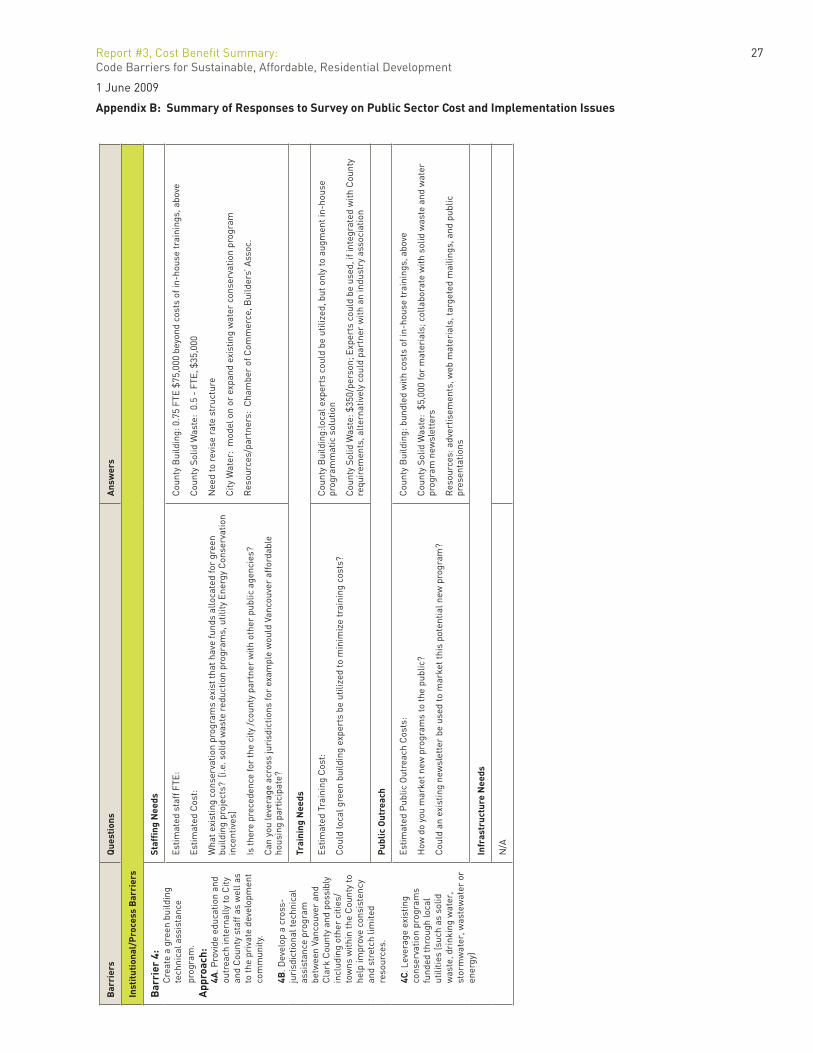
Report #3, Cost Benefi t Summary: 27Code Barriers for Sustainable, Affordable, Residential Development
1 June 2009
Appendix B: Summary of Responses to Survey on Public Sector Cost and Implementation IssuesB
arri
ers
Que
stio
nsA
nsw
ers
Inst
itut
iona
l/P
roce
ss B
arri
ers
Bar
rier
4:
C
reat
e a
gree
n bu
ildin
g te
chni
cal a
ssis
tanc
e pr
ogra
m.
App
roac
h:
4A
. Pro
vide
edu
catio
n an
d ou
trea
ch in
tern
ally
to C
ity
and
Cou
nty
staf
f as
wel
l as
to th
e pr
ivat
e de
velo
pmen
t co
mm
unity
.
4B
. Dev
elop
a c
ross
-ju
risd
ictio
nal t
echn
ical
as
sist
ance
pro
gram
be
twee
n Va
ncou
ver
and
Cla
rk C
ount
y an
d po
ssib
ly
incl
udin
g ot
her
citie
s/to
wns
with
in th
e C
ount
y to
he
lp im
prov
e co
nsis
tenc
y an
d st
retc
h lim
ited
reso
urce
s.
4C
. Lev
erag
e ex
istin
g co
nser
vatio
n pr
ogra
ms
fund
ed th
roug
h lo
cal
utili
ties
(suc
h as
sol
id
was
te, d
rink
ing
wat
er,
stor
mw
ater
, was
tew
ater
or
ener
gy)
Staffi n
g N
eeds
Estim
ated
sta
ff F
TE:
Estim
ated
Cos
t:
Wha
t exi
stin
g co
nser
vatio
n pr
ogra
ms
exis
t tha
t hav
e fu
nds
allo
cate
d fo
r gr
een
build
ing
proj
ects
? [i
.e. s
olid
was
te r
educ
tion
prog
ram
s, u
tility
Ene
rgy
Con
serv
atio
n in
cent
ives
]
Is th
ere
prec
eden
ce fo
r th
e ci
ty /c
ount
y pa
rtne
r w
ith o
ther
pub
lic a
genc
ies?
Can
you
leve
rage
acr
oss
juri
sdic
tions
for
exam
ple
wou
ld V
anco
uver
aff
orda
ble
hous
ing
part
icip
ate?
Cou
nty
Bui
ldin
g: 0
.75
FTE
$75,
000
beyo
nd c
osts
of i
n-ho
use
trai
ning
s, a
bove
Cou
nty
Solid
Was
te:
0.5
- FT
E, $
35,0
00
Nee
d to
rev
ise
rate
str
uctu
re
City
Wat
er:
mod
el o
n or
exp
and
exis
ting
wat
er c
onse
rvat
ion
prog
ram
Res
ourc
es/p
artn
ers:
Cha
mbe
r of
Com
mer
ce, B
uild
ers’
Ass
oc.
Trai
ning
Nee
ds
Estim
ated
Tra
inin
g C
ost:
Cou
ld lo
cal g
reen
bui
ldin
g ex
pert
s be
util
ized
to m
inim
ize
trai
ning
cos
ts?
Cou
nty
Bui
ldin
g:lo
cal e
xper
ts c
ould
be
utili
zed,
but
onl
y to
aug
men
t in-
hous
e pr
ogra
mm
atic
sol
utio
n
Cou
nty
Solid
Was
te: $
350/
pers
on; E
xper
ts c
ould
be
used
, if i
nteg
rate
d w
ith C
ount
y re
quir
emen
ts, a
lter
nativ
ely
coul
d pa
rtne
r w
ith a
n in
dust
ry a
ssoc
iatio
n
Pub
lic O
utre
ach
Estim
ated
Pub
lic O
utre
ach
Cos
ts:
How
do
you
mar
ket n
ew p
rogr
ams
to th
e pu
blic
?
Cou
ld a
n ex
istin
g ne
wsl
ette
r be
use
d to
mar
ket t
his
pote
ntia
l new
pro
gram
?
Cou
nty
Bui
ldin
g: b
undl
ed w
ith c
osts
of i
n-ho
use
trai
ning
s, a
bove
Cou
nty
Solid
Was
te:
$5,0
00 fo
r m
ater
ials
; col
labo
rate
with
sol
id w
aste
and
wat
er
prog
ram
new
slet
ters
Res
ourc
es: a
dver
tisem
ents
, web
mat
eria
ls, t
arge
ted
mai
lings
, and
pub
lic
pres
enta
tions
Infr
astr
uctu
re N
eeds
N/A
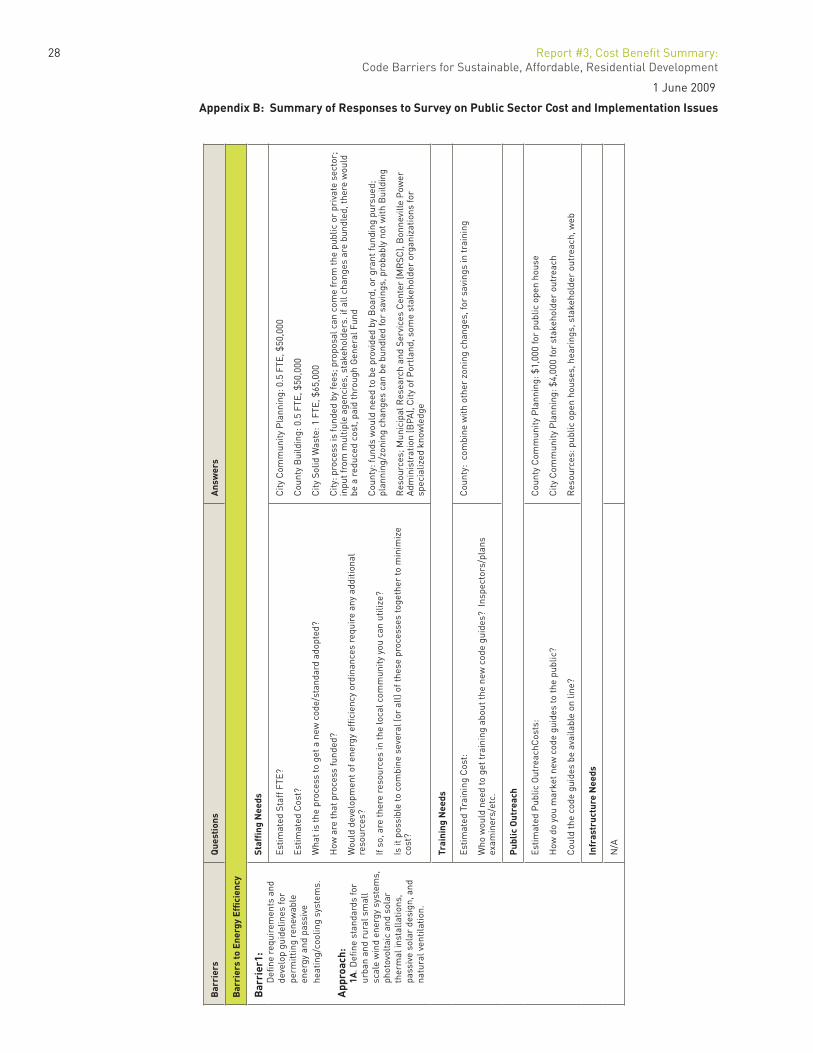
28 Report #3, Cost Benefi t Summary: Code Barriers for Sustainable, Affordable, Residential Development
1 June 2009
Appendix B: Summary of Responses to Survey on Public Sector Cost and Implementation Issues
Bar
rier
sQ
uest
ions
Ans
wer
s
Bar
rier
s to
Ene
rgy
Effi c
ienc
y
Bar
rier
1:
Defi
ne
requ
irem
ents
and
de
velo
p gu
idel
ines
for
perm
ittin
g re
new
able
en
ergy
and
pas
sive
he
atin
g/co
olin
g sy
stem
s.
App
roac
h:
1A
. Defi
ne
stan
dard
s fo
r ur
ban
and
rura
l sm
all
scal
e w
ind
ener
gy s
yste
ms,
ph
otov
olta
ic a
nd s
olar
th
erm
al in
stal
latio
ns,
pass
ive
sola
r de
sign
, and
na
tura
l ven
tilat
ion.
Staffi n
g N
eeds
Estim
ated
Sta
ff F
TE?
Estim
ated
Cos
t?
Wha
t is
the
proc
ess
to g
et a
new
cod
e/st
anda
rd a
dopt
ed?
How
are
that
pro
cess
fund
ed?
Wou
ld d
evel
opm
ent o
f ene
rgy
effi c
ienc
y or
dina
nces
req
uire
any
add
ition
al
reso
urce
s?
If so
, are
ther
e re
sour
ces
in th
e lo
cal c
omm
unity
you
can
util
ize?
Is it
pos
sibl
e to
com
bine
sev
eral
(or
all)
of th
ese
proc
esse
s to
geth
er to
min
imiz
e co
st?
City
Com
mun
ity P
lann
ing:
0.5
FTE
, $50
,000
Cou
nty
Bui
ldin
g: 0
.5 F
TE, $
50,0
00
City
Sol
id W
aste
: 1 F
TE, $
65,0
00
City
: pro
cess
is fu
nded
by
fees
; pro
posa
l can
com
e fr
om th
e pu
blic
or
priv
ate
sect
or;
inpu
t fro
m m
ultip
le a
genc
ies,
sta
keho
lder
s. if
all
chan
ges
are
bund
led,
ther
e w
ould
be
a r
educ
ed c
ost,
paid
thro
ugh
Gen
eral
Fun
d
Cou
nty:
fund
s w
ould
nee
d to
be
prov
ided
by
Boa
rd, o
r gr
ant f
undi
ng p
ursu
ed;
plan
ning
/zon
ing
chan
ges
can
be b
undl
ed fo
r sa
ving
s, p
roba
bly
not w
ith B
uild
ing
Res
ourc
es; M
unic
ipal
Res
earc
h an
d Se
rvic
es C
ente
r (M
RSC
), B
onne
ville
Pow
er
Adm
inis
trat
ion
(BPA
), C
ity o
f Por
tlan
d, s
ome
stak
ehol
der
orga
niza
tions
for
spec
ializ
ed k
now
ledg
e
Trai
ning
Nee
ds
Estim
ated
Tra
inin
g C
ost:
Who
wou
ld n
eed
to g
et tr
aini
ng a
bout
the
new
cod
e gu
ides
? In
spec
tors
/pla
ns
exam
iner
s/et
c.
Cou
nty:
com
bine
with
oth
er z
onin
g ch
ange
s, fo
r sa
ving
s in
trai
ning
Pub
lic O
utre
ach
Estim
ated
Pub
lic O
utre
achC
osts
:
How
do
you
mar
ket n
ew c
ode
guid
es to
the
publ
ic?
Cou
ld th
e co
de g
uide
s be
ava
ilabl
e on
line
?
Cou
nty
Com
mun
ity P
lann
ing:
$1,
000
for
publ
ic o
pen
hous
e
City
Com
mun
ity P
lann
ing:
$4,
000
for
stak
ehol
der
outr
each
Res
ourc
es: p
ublic
ope
n ho
uses
, hea
ring
s, s
take
hold
er o
utre
ach,
web
Infr
astr
uctu
re N
eeds
N/A
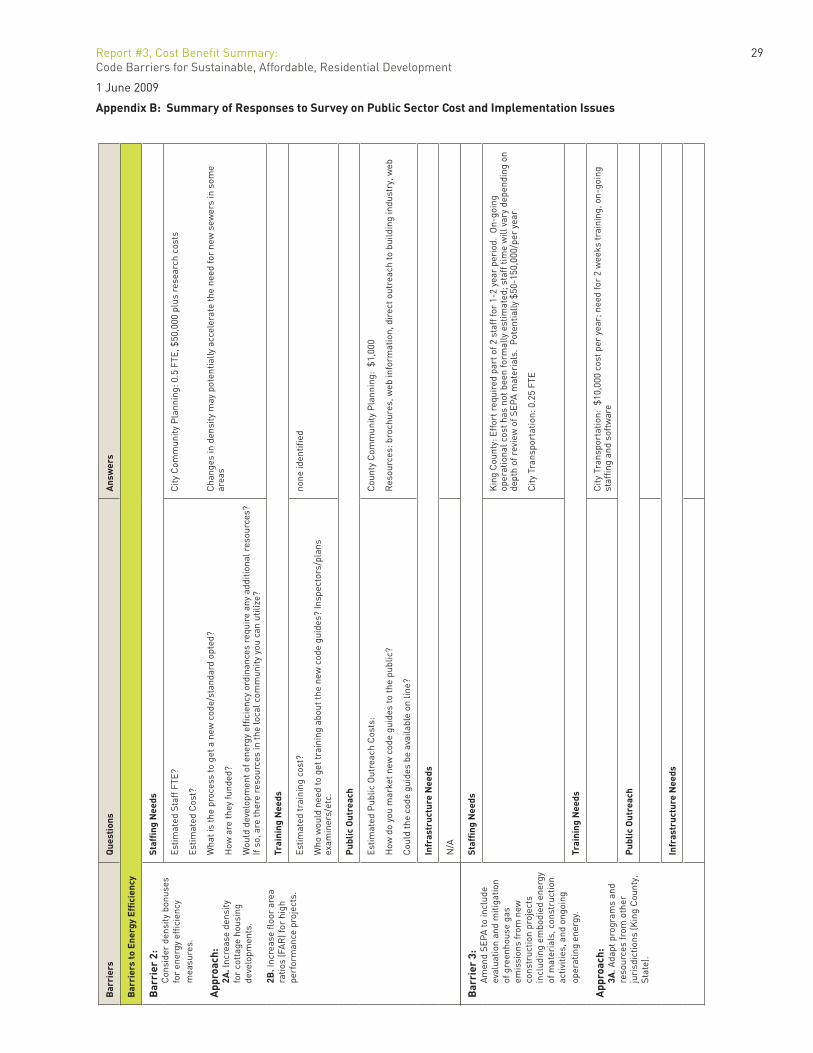
Report #3, Cost Benefi t Summary: 29Code Barriers for Sustainable, Affordable, Residential Development
1 June 2009
Appendix B: Summary of Responses to Survey on Public Sector Cost and Implementation IssuesB
arri
ers
Que
stio
nsA
nsw
ers
Bar
rier
s to
Ene
rgy
Effi c
ienc
y
Bar
rier
2:
C
onsi
der
dens
ity b
onus
es
for
ener
gy e
ffi ci
ency
m
easu
res.
App
roac
h:
2A
. Inc
reas
e de
nsity
fo
r co
ttag
e ho
usin
g de
velo
pmen
ts.
2B
. Inc
reas
e fl o
or a
rea
ratio
s (F
AR
) for
hig
h pe
rfor
man
ce p
roje
cts.
Staffi n
g N
eeds
Estim
ated
Sta
ff F
TE?
Estim
ated
Cos
t?
Wha
t is
the
proc
ess
to g
et a
new
cod
e/st
anda
rd o
pted
?
How
are
they
fund
ed?
Wou
ld d
evel
opm
ent o
f ene
rgy
effi c
ienc
y or
dina
nces
req
uire
any
add
ition
al r
esou
rces
? If
so, a
re th
ere
reso
urce
s in
the
loca
l com
mun
ity y
ou c
an u
tiliz
e?
City
Com
mun
ity P
lann
ing:
0.5
FTE
, $50
,000
plu
s re
sear
ch c
osts
Cha
nges
in d
ensi
ty m
ay p
oten
tially
acc
eler
ate
the
need
for
new
sew
ers
in s
ome
area
s
Trai
ning
Nee
ds
Estim
ated
trai
ning
cos
t?
Who
wou
ld n
eed
to g
et tr
aini
ng a
bout
the
new
cod
e gu
ides
? In
spec
tors
/pla
ns
exam
iner
s/et
c.
none
iden
tifi e
d
Pub
lic O
utre
ach
Estim
ated
Pub
lic O
utre
ach
Cos
ts:
How
do
you
mar
ket n
ew c
ode
guid
es to
the
publ
ic?
Cou
ld th
e co
de g
uide
s be
ava
ilabl
e on
line
?
Cou
nty
Com
mun
ity P
lann
ing:
$1,
000
Res
ourc
es: b
roch
ures
, web
info
rmat
ion,
dir
ect o
utre
ach
to b
uild
ing
indu
stry
, web
Infr
astr
uctu
re N
eeds
N/A
Bar
rier
3:
A
men
d SE
PA to
incl
ude
eval
uatio
n an
d m
itiga
tion
of g
reen
hous
e ga
s em
issi
ons
from
new
co
nstr
uctio
n pr
ojec
ts
incl
udin
g em
bodi
ed e
nerg
y of
mat
eria
ls, c
onst
ruct
ion
activ
ities
, and
ong
oing
op
erat
ing
ener
gy.
App
roac
h:
3A
. Ada
pt p
rogr
ams
and
reso
urce
s fr
om o
ther
ju
risd
ictio
ns (K
ing
Cou
nty,
St
ate)
.
Staffi n
g N
eeds
Kin
g C
ount
y: E
ffor
t req
uire
d pa
rt o
f 2 s
taff
for
1-2
year
per
iod.
On-
goin
g op
erat
iona
l cos
t has
not
bee
n fo
rmal
ly e
stim
ated
; sta
ff ti
me
will
var
y de
pend
ing
on
dept
h of
rev
iew
of S
EPA
mat
eria
ls.
Pot
entia
lly $
50-1
50,0
00/p
er y
ear
City
Tra
nspo
rtat
ion:
0.2
5 FT
E
Trai
ning
Nee
ds
City
Tra
nspo
rtat
ion:
$10
,000
cos
t per
yea
r; n
eed
for
2 w
eeks
trai
ning
, on-
goin
g st
affi n
g an
d so
ftw
are
Pub
lic O
utre
ach
Infr
astr
uctu
re N
eeds
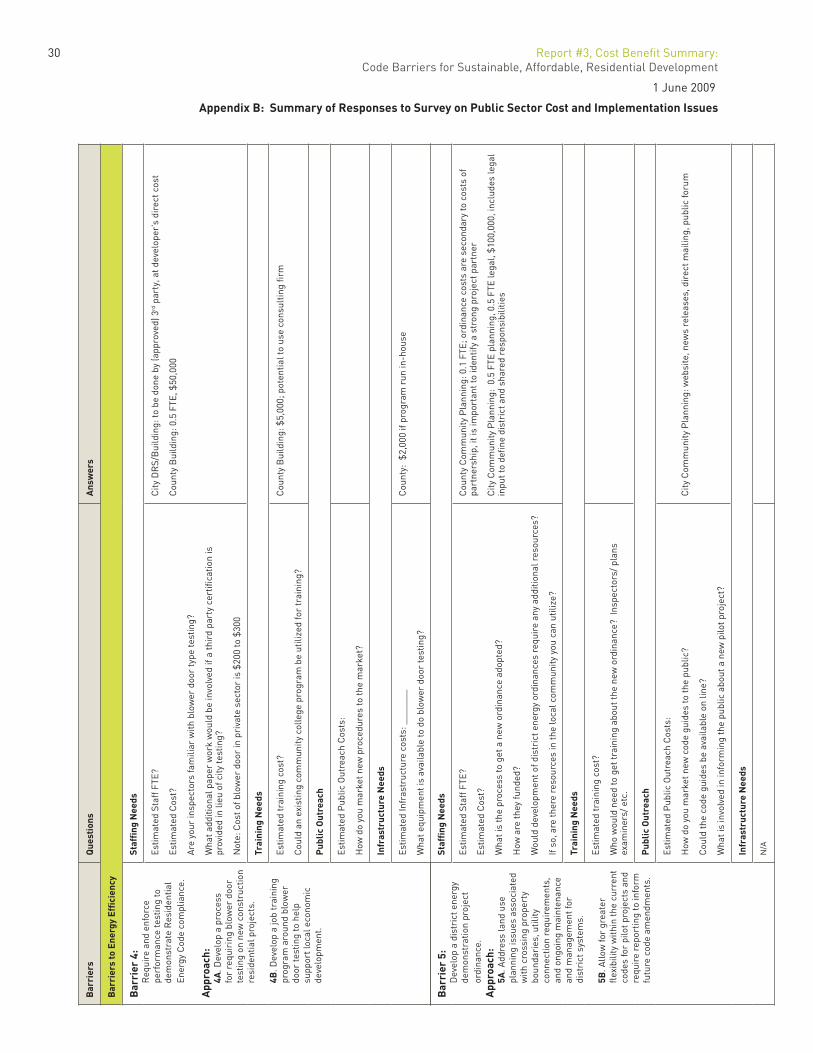
30 Report #3, Cost Benefi t Summary: Code Barriers for Sustainable, Affordable, Residential Development
1 June 2009
Appendix B: Summary of Responses to Survey on Public Sector Cost and Implementation Issues
Bar
rier
sQ
uest
ions
Ans
wer
s
Bar
rier
s to
Ene
rgy
Effi c
ienc
y
Bar
rier
4:
R
equi
re a
nd e
nfor
ce
perf
orm
ance
test
ing
to
dem
onst
rate
Res
iden
tial
Ener
gy C
ode
com
plia
nce.
App
roac
h:
4A
. Dev
elop
a p
roce
ss
for
requ
irin
g bl
ower
doo
r te
stin
g on
new
con
stru
ctio
n re
side
ntia
l pro
ject
s.
4B
. Dev
elop
a jo
b tr
aini
ng
prog
ram
aro
und
blow
er
door
test
ing
to h
elp
supp
ort l
ocal
eco
nom
ic
deve
lopm
ent.
Staffi n
g N
eeds
Estim
ated
Sta
ff F
TE?
Estim
ated
Cos
t?
Are
you
r in
spec
tors
fam
iliar
with
blo
wer
doo
r ty
pe te
stin
g?
Wha
t add
ition
al p
aper
wor
k w
ould
be
invo
lved
if a
thir
d pa
rty
cert
ifi ca
tion
is
prov
ided
in li
eu o
f city
test
ing?
Not
e: C
ost o
f blo
wer
doo
r in
pri
vate
sec
tor
is $
200
to $
300
City
DR
S/B
uild
ing:
to b
e do
ne b
y (a
ppro
ved)
3rd
par
ty, a
t dev
elop
er’s
dir
ect c
ost
Cou
nty
Bui
ldin
g: 0
.5 F
TE, $
50,0
00
Trai
ning
Nee
ds
Estim
ated
trai
ning
cos
t?
Cou
ld a
n ex
istin
g co
mm
unity
col
lege
pro
gram
be
utili
zed
for
trai
ning
?
Cou
nty
Bui
ldin
g: $
5,00
0; p
oten
tial t
o us
e co
nsul
ting fi r
m
Pub
lic O
utre
ach
Estim
ated
Pub
lic O
utre
ach
Cos
ts:
How
do
you
mar
ket n
ew p
roce
dure
s to
the
mar
ket?
Infr
astr
uctu
re N
eeds
Estim
ated
Infr
astr
uctu
re c
osts
: ___
____
Wha
t equ
ipm
ent i
s av
aila
ble
to d
o bl
ower
doo
r te
stin
g?
Cou
nty:
$2,
000
if pr
ogra
m r
un in
-hou
se
Bar
rier
5:
D
evel
op a
dis
tric
t ene
rgy
dem
onst
ratio
n pr
ojec
t or
dina
nce.
App
roac
h:
5A
. Add
ress
land
use
pl
anni
ng is
sues
ass
ocia
ted
with
cro
ssin
g pr
oper
ty
boun
dari
es, u
tility
co
nnec
tion
requ
irem
ents
, an
d on
goin
g m
aint
enan
ce
and
man
agem
ent f
or
dist
rict
sys
tem
s.
5B
. Allo
w fo
r gr
eate
r fl e
xibi
lity
with
in th
e cu
rren
t co
des
for
pilo
t pro
ject
s an
d re
quir
e re
port
ing
to in
form
fu
ture
cod
e am
endm
ents
.
Staffi n
g N
eeds
Estim
ated
Sta
ff F
TE?
Estim
ated
Cos
t?
Wha
t is
the
proc
ess
to g
et a
new
ord
inan
ce a
dopt
ed?
How
are
they
fund
ed?
Wou
ld d
evel
opm
ent o
f dis
tric
t ene
rgy
ordi
nanc
es r
equi
re a
ny a
dditi
onal
res
ourc
es?
If so
, are
ther
e re
sour
ces
in th
e lo
cal c
omm
unity
you
can
util
ize?
Cou
nty
Com
mun
ity P
lann
ing:
0.1
FTE
; ord
inan
ce c
osts
are
sec
onda
ry to
cos
ts o
f pa
rtne
rshi
p, it
is im
port
ant t
o id
entif
y a
stro
ng p
roje
ct p
artn
er
City
Com
mun
ity P
lann
ing:
0.5
FTE
pla
nnin
g, 0
.5 F
TE le
gal,
$100
,000
, inc
lude
s le
gal
inpu
t to
defi n
e di
stri
ct a
nd s
hare
d re
spon
sibi
litie
s
Trai
ning
Nee
ds
Estim
ated
trai
ning
cos
t?
Who
wou
ld n
eed
to g
et tr
aini
ng a
bout
the
new
ord
inan
ce?
Insp
ecto
rs/ p
lans
ex
amin
ers/
etc
.
Pub
lic O
utre
ach
Estim
ated
Pub
lic O
utre
ach
Cos
ts:
How
do
you
mar
ket n
ew c
ode
guid
es to
the
publ
ic?
Cou
ld th
e co
de g
uide
s be
ava
ilabl
e on
line
?
Wha
t is
invo
lved
in in
form
ing
the
publ
ic a
bout
a n
ew p
ilot p
roje
ct?
City
Com
mun
ity P
lann
ing:
web
site
, new
s re
leas
es, d
irec
t mai
ling,
pub
lic fo
rum
Infr
astr
uctu
re N
eeds
N/A
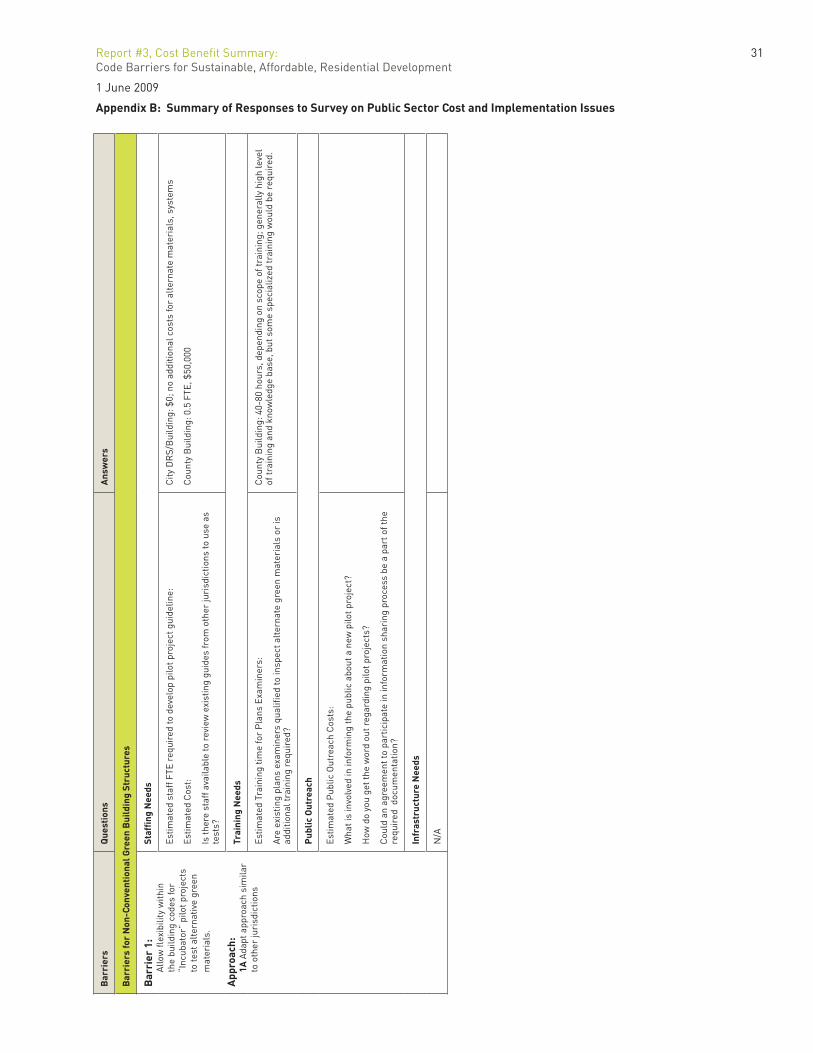
Report #3, Cost Benefi t Summary: 31Code Barriers for Sustainable, Affordable, Residential Development
1 June 2009
Appendix B: Summary of Responses to Survey on Public Sector Cost and Implementation IssuesB
arri
ers
Que
stio
nsA
nsw
ers
Bar
rier
s fo
r N
on-C
onve
ntio
nal G
reen
Bui
ldin
g St
ruct
ures
Bar
rier
1:
A
llow
fl ex
ibili
ty w
ithin
th
e bu
ildin
g co
des
for
“Inc
ubat
or”
pilo
t pro
ject
s to
test
alt
erna
tive
gree
n m
ater
ials
.
App
roac
h:
1A
Ada
pt a
ppro
ach
sim
ilar
to o
ther
juri
sdic
tions
Staffi n
g N
eeds
Estim
ated
sta
ff F
TE r
equi
red
to d
evel
op p
ilot p
roje
ct g
uide
line:
Estim
ated
Cos
t:
Is th
ere
staf
f ava
ilabl
e to
rev
iew
exi
stin
g gu
ides
from
oth
er ju
risd
ictio
ns to
use
as
test
s?
City
DR
S/B
uild
ing:
$0;
no
addi
tiona
l cos
ts fo
r al
tern
ate
mat
eria
ls, s
yste
ms
Cou
nty
Bui
ldin
g: 0
.5 F
TE, $
50,0
00
Trai
ning
Nee
ds
Estim
ated
Tra
inin
g tim
e fo
r P
lans
Exa
min
ers:
Are
exi
stin
g pl
ans
exam
iner
s qu
alifi
ed to
insp
ect a
lter
nate
gre
en m
ater
ials
or
is
addi
tiona
l tra
inin
g re
quir
ed?
Cou
nty
Bui
ldin
g: 4
0-80
hou
rs, d
epen
ding
on
scop
e of
trai
ning
; gen
eral
ly h
igh
leve
l of
trai
ning
and
kno
wle
dge
base
, but
som
e sp
ecia
lized
trai
ning
wou
ld b
e re
quir
ed.
Pub
lic O
utre
ach
Estim
ated
Pub
lic O
utre
ach
Cos
ts:
Wha
t is
invo
lved
in in
form
ing
the
publ
ic a
bout
a n
ew p
ilot p
roje
ct?
How
do
you
get t
he w
ord
out r
egar
ding
pilo
t pro
ject
s?
Cou
ld a
n ag
reem
ent t
o pa
rtic
ipat
e in
info
rmat
ion
shar
ing
proc
ess
be a
par
t of t
he
requ
ired
doc
umen
tatio
n?
Infr
astr
uctu
re N
eeds
N/A
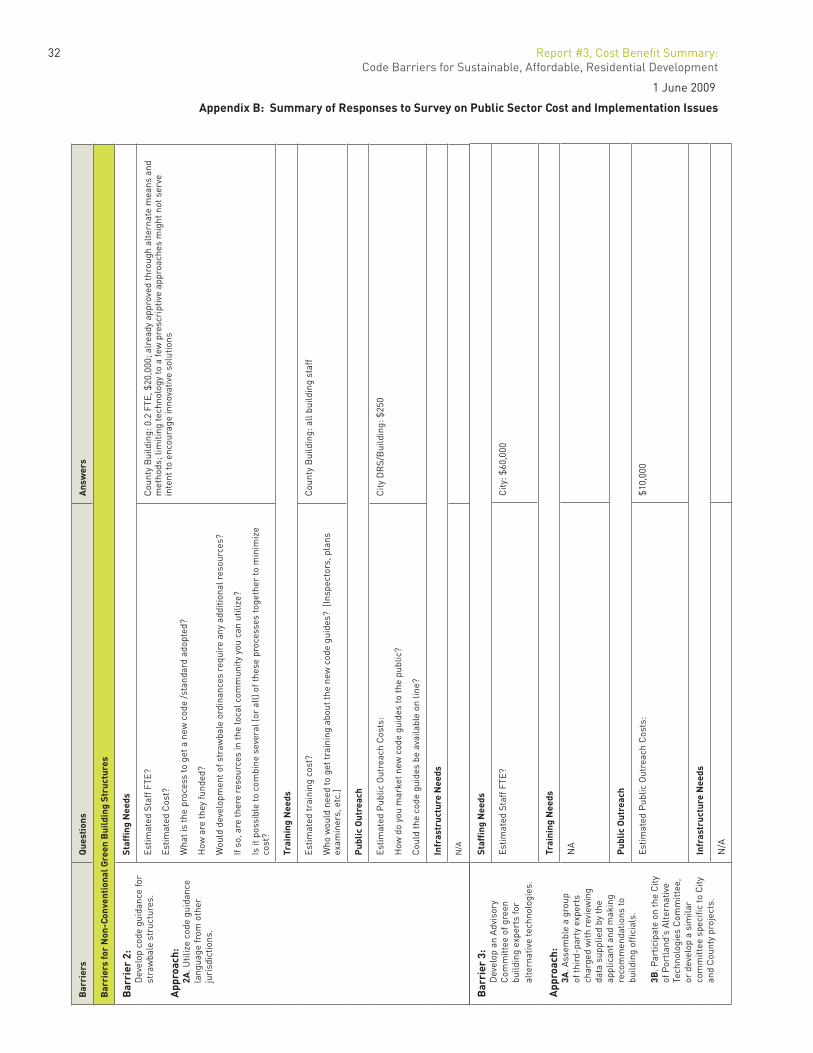
32 Report #3, Cost Benefi t Summary: Code Barriers for Sustainable, Affordable, Residential Development
1 June 2009
Appendix B: Summary of Responses to Survey on Public Sector Cost and Implementation Issues
Bar
rier
3:
D
evel
op a
n A
dvis
ory
Com
mitt
ee o
f gre
en
build
ing
expe
rts
for
alte
rnat
ive
tech
nolo
gies
.
App
roac
h:
3A
. Ass
embl
e a
grou
p of
thir
d-pa
rty
expe
rts
char
ged
with
rev
iew
ing
data
sup
plie
d by
the
appl
ican
t and
mak
ing
reco
mm
enda
tions
to
build
ing
offi c
ials
.
3B
. Par
ticip
ate
on th
e C
ity
of P
ortl
and’
s A
lter
nativ
e Te
chno
logi
es C
omm
ittee
, or
dev
elop
a s
imila
r co
mm
ittee
spe
cifi c
to C
ity
and
Cou
nty
proj
ects
.
Staffi n
g N
eeds
Estim
ated
Sta
ff F
TE?
City
: $60
,000
Trai
ning
Nee
ds
NA
Pub
lic O
utre
ach
Estim
ated
Pub
lic O
utre
ach
Cos
ts:
$10,
000
Infr
astr
uctu
re N
eeds
N/A
Bar
rier
sQ
uest
ions
Ans
wer
s
Bar
rier
s fo
r N
on-C
onve
ntio
nal G
reen
Bui
ldin
g St
ruct
ures
Bar
rier
2:
D
evel
op c
ode
guid
ance
for
stra
wba
le s
truc
ture
s.
App
roac
h:
2A
. Util
ize
code
gui
danc
e la
ngua
ge fr
om o
ther
ju
risd
ictio
ns.
Staffi n
g N
eeds
Estim
ated
Sta
ff F
TE?
Estim
ated
Cos
t?
Wha
t is
the
proc
ess
to g
et a
new
cod
e /s
tand
ard
adop
ted?
How
are
they
fund
ed?
Wou
ld d
evel
opm
ent o
f str
awba
le o
rdin
ance
s re
quir
e an
y ad
ditio
nal r
esou
rces
?
If so
, are
ther
e re
sour
ces
in th
e lo
cal c
omm
unity
you
can
util
ize?
Is it
pos
sibl
e to
com
bine
sev
eral
(or
all)
of th
ese
proc
esse
s to
geth
er to
min
imiz
e co
st?
Cou
nty
Bui
ldin
g: 0
.2 F
TE, $
20,0
00; a
lrea
dy a
ppro
ved
thro
ugh
alte
rnat
e m
eans
and
m
etho
ds; l
imiti
ng te
chno
logy
to a
few
pre
scri
ptiv
e ap
proa
ches
mig
ht n
ot s
erve
in
tent
to e
ncou
rage
inno
vativ
e so
lutio
ns
Trai
ning
Nee
ds
Estim
ated
trai
ning
cos
t?
Who
wou
ld n
eed
to g
et tr
aini
ng a
bout
the
new
cod
e gu
ides
? [I
nspe
ctor
s, p
lans
ex
amin
ers,
etc
.]
Cou
nty
Bui
ldin
g: a
ll bu
ildin
g st
aff
Pub
lic O
utre
ach
Estim
ated
Pub
lic O
utre
ach
Cos
ts:
How
do
you
mar
ket n
ew c
ode
guid
es to
the
publ
ic?
Cou
ld th
e co
de g
uide
s be
ava
ilabl
e on
line
?
City
DR
S/B
uild
ing:
$25
0
Infr
astr
uctu
re N
eeds
N/A
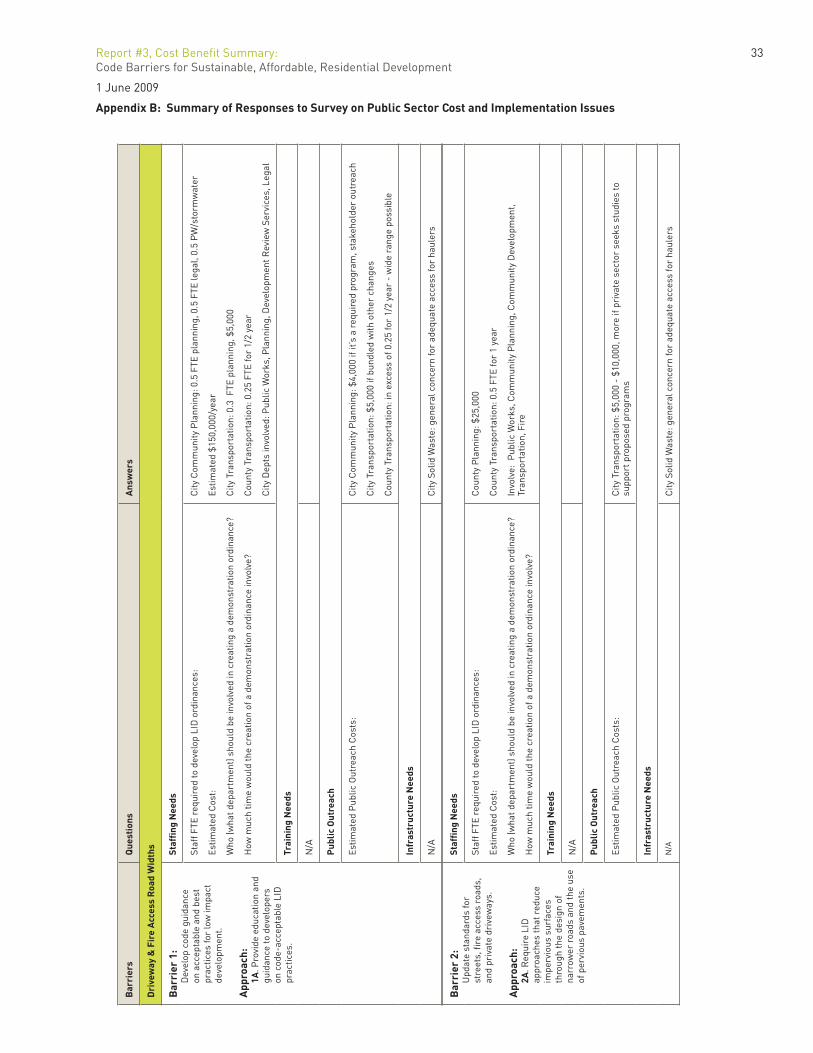
Report #3, Cost Benefi t Summary: 33Code Barriers for Sustainable, Affordable, Residential Development
1 June 2009
Appendix B: Summary of Responses to Survey on Public Sector Cost and Implementation Issues
Bar
rier
2:
U
pdat
e st
anda
rds
for
stre
ets,
fi re
acc
ess
road
s,
and
priv
ate
driv
eway
s.
App
roac
h:
2A
. Req
uire
LID
ap
proa
ches
that
red
uce
impe
rvio
us s
urfa
ces
thro
ugh
the
desi
gn o
f na
rrow
er r
oads
and
the
use
of p
ervi
ous
pave
men
ts.
Staffi n
g N
eeds
Staf
f FTE
req
uire
d to
dev
elop
LID
ord
inan
ces:
Estim
ated
Cos
t:
Who
(wha
t dep
artm
ent)
sho
uld
be in
volv
ed in
cre
atin
g a
dem
onst
ratio
n or
dina
nce?
How
muc
h tim
e w
ould
the
crea
tion
of a
dem
onst
ratio
n or
dina
nce
invo
lve?
Cou
nty
Pla
nnin
g: $
25,0
00
Cou
nty
Tran
spor
tatio
n: 0
.5 F
TE fo
r 1
year
Invo
lve:
Pub
lic W
orks
, Com
mun
ity P
lann
ing,
Com
mun
ity D
evel
opm
ent,
Tran
spor
tatio
n, F
ire
Trai
ning
Nee
ds
N/A
Pub
lic O
utre
ach
Estim
ated
Pub
lic O
utre
ach
Cos
ts:
City
Tra
nspo
rtat
ion:
$5,
000
- $1
0,00
0, m
ore
if pr
ivat
e se
ctor
see
ks s
tudi
es to
su
ppor
t pro
pose
d pr
ogra
ms
Infr
astr
uctu
re N
eeds
N/A
City
Sol
id W
aste
: gen
eral
con
cern
for
adeq
uate
acc
ess
for
haul
ers
Bar
rier
sQ
uest
ions
Ans
wer
s
Dri
vew
ay &
Fir
e A
cces
s R
oad
Wid
ths
Bar
rier
1:
D
evel
op c
ode
guid
ance
on
acc
epta
ble
and
best
pr
actic
es fo
r lo
w im
pact
de
velo
pmen
t.
App
roac
h:
1A
. Pro
vide
edu
catio
n an
d gu
idan
ce to
dev
elop
ers
on c
ode-
acce
ptab
le L
ID
prac
tices
.
Staffi n
g N
eeds
Staf
f FTE
req
uire
d to
dev
elop
LID
ord
inan
ces:
Estim
ated
Cos
t:
Who
(wha
t dep
artm
ent)
sho
uld
be in
volv
ed in
cre
atin
g a
dem
onst
ratio
n or
dina
nce?
How
muc
h tim
e w
ould
the
crea
tion
of a
dem
onst
ratio
n or
dina
nce
invo
lve?
City
Com
mun
ity P
lann
ing:
0.5
FTE
pla
nnin
g, 0
.5 F
TE le
gal,
0.5
PW
/sto
rmw
ater
Estim
ated
$15
0,00
0/ye
ar
City
Tra
nspo
rtat
ion:
0.3
FTE
pla
nnin
g, $
5,00
0
Cou
nty
Tran
spor
tatio
n: 0
.25
FTE
for
1/2
year
City
Dep
ts in
volv
ed: P
ublic
Wor
ks, P
lann
ing,
Dev
elop
men
t Rev
iew
Ser
vice
s, L
egal
Trai
ning
Nee
ds
N/A
Pub
lic O
utre
ach
Estim
ated
Pub
lic O
utre
ach
Cos
ts:
City
Com
mun
ity P
lann
ing:
$4,
000
if it’
s a
requ
ired
pro
gram
, sta
keho
lder
out
reac
h
City
Tra
nspo
rtat
ion:
$5,
000
if bu
ndle
d w
ith o
ther
cha
nges
Cou
nty
Tran
spor
tatio
n: in
exc
ess
of 0
.25
for
1/2
year
- w
ide
rang
e po
ssib
le
Infr
astr
uctu
re N
eeds
N/A
City
Sol
id W
aste
: gen
eral
con
cern
for
adeq
uate
acc
ess
for
haul
ers
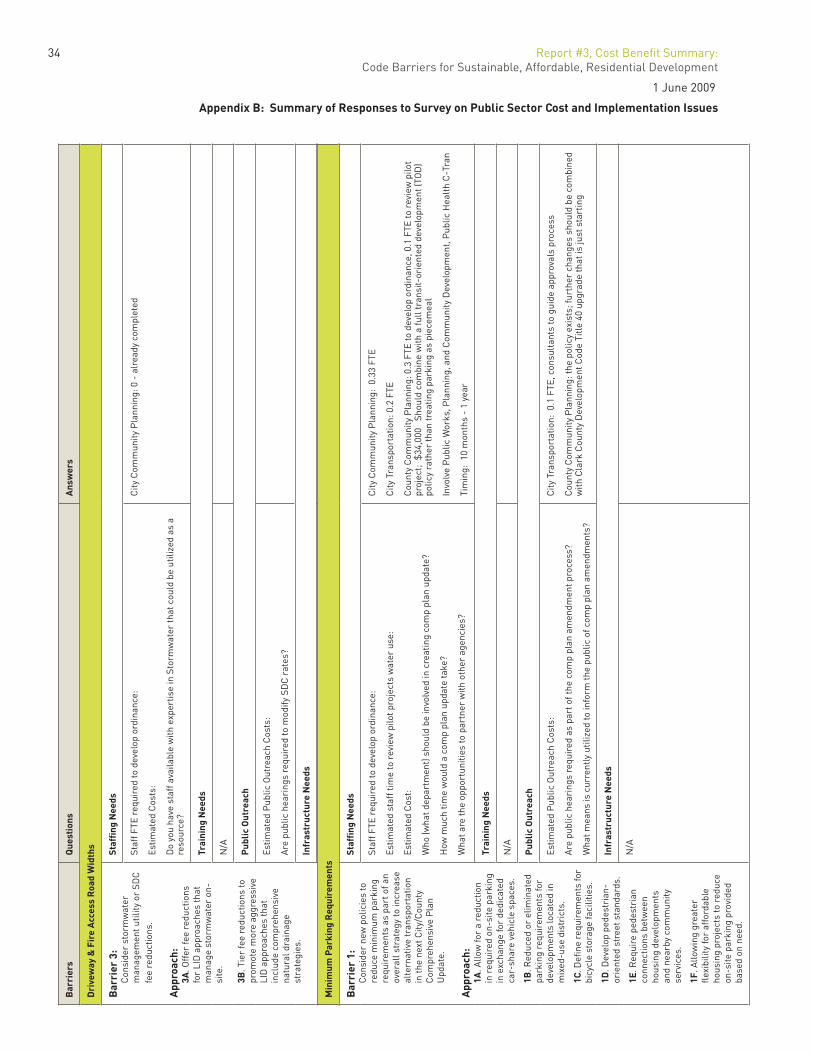
34 Report #3, Cost Benefi t Summary: Code Barriers for Sustainable, Affordable, Residential Development
1 June 2009
Appendix B: Summary of Responses to Survey on Public Sector Cost and Implementation Issues
Bar
rier
sQ
uest
ions
Ans
wer
s
Dri
vew
ay &
Fir
e A
cces
s R
oad
Wid
ths
Bar
rier
3:
C
onsi
der
stor
mw
ater
m
anag
emen
t util
ity o
r SD
C
fee
redu
ctio
ns.
App
roac
h:
3A
. Off
er fe
e re
duct
ions
fo
r LI
D a
ppro
ache
s th
at
man
age
stor
mw
ater
on-
site
.
3B
. Tie
r fe
e re
duct
ions
to
prom
ote
mor
e ag
gres
sive
LI
D a
ppro
ache
s th
at
incl
ude
com
preh
ensi
ve
natu
ral d
rain
age
stra
tegi
es.
Staffi n
g N
eeds
Staf
f FTE
req
uire
d to
dev
elop
ord
inan
ce:
Estim
ated
Cos
ts:
Do
you
have
sta
ff a
vaila
ble
with
exp
ertis
e in
Sto
rmw
ater
that
cou
ld b
e ut
ilize
d as
a
reso
urce
?
City
Com
mun
ity P
lann
ing:
0 -
alr
eady
com
plet
ed
Trai
ning
Nee
ds
N/A
Pub
lic O
utre
ach
Estim
ated
Pub
lic O
utre
ach
Cos
ts:
Are
pub
lic h
eari
ngs
requ
ired
to m
odify
SD
C r
ates
?
Infr
astr
uctu
re N
eeds
N/A
Min
imum
Par
king
Req
uire
men
ts
Bar
rier
1:
C
onsi
der
new
pol
icie
s to
re
duce
min
imum
par
king
re
quir
emen
ts a
s pa
rt o
f an
over
all s
trat
egy
to in
crea
se
alte
rnat
ive
tran
spor
tatio
n in
the
next
City
/Cou
nty
Com
preh
ensi
ve P
lan
Upd
ate.
App
roac
h:
1A
. Allo
w fo
r a
redu
ctio
n in
req
uire
d on
-site
par
king
in
exc
hang
e fo
r de
dica
ted
car-
shar
e ve
hicl
e sp
aces
.
1B
. Red
uced
or
elim
inat
ed
park
ing
requ
irem
ents
for
deve
lopm
ents
loca
ted
in
mix
ed-u
se d
istr
icts
.
1C
. Defi
ne
requ
irem
ents
for
bicy
cle
stor
age
faci
litie
s.
1D
. Dev
elop
ped
estr
ian-
orie
nted
str
eet s
tand
ards
.
1E
. Req
uire
ped
estr
ian
conn
ectio
ns b
etw
een
hous
ing
deve
lopm
ents
an
d ne
arby
com
mun
ity
serv
ices
.
1F
. Allo
win
g gr
eate
r fl e
xibi
lity
for
affo
rdab
le
hous
ing
proj
ects
to r
educ
e on
-site
par
king
pro
vide
d ba
sed
on n
eed.
Staffi n
g N
eeds
Staf
f FTE
req
uire
d to
dev
elop
ord
inan
ce:
Estim
ated
sta
ff ti
me
to r
evie
w p
ilot p
roje
cts
wat
er u
se:
Estim
ated
Cos
t:
Who
(wha
t dep
artm
ent)
sho
uld
be in
volv
ed in
cre
atin
g co
mp
plan
upd
ate?
How
muc
h tim
e w
ould
a c
omp
plan
upd
ate
take
?
Wha
t are
the
oppo
rtun
ities
to p
artn
er w
ith o
ther
age
ncie
s?
City
Com
mun
ity P
lann
ing:
0.3
3 FT
E
City
Tra
nspo
rtat
ion:
0.2
FTE
Cou
nty
Com
mun
ity P
lann
ing:
0.3
FTE
to d
evel
op o
rdin
ance
, 0.1
FTE
to r
evie
w p
ilot
proj
ect;
$34
,000
Sh
ould
com
bine
with
a fu
ll tr
ansi
t-or
ient
ed d
evel
opm
ent (
TOD
) po
licy
rath
er th
an tr
eatin
g pa
rkin
g as
pie
cem
eal
Invo
lve
Pub
lic W
orks
, Pla
nnin
g, a
nd C
omm
unity
Dev
elop
men
t, P
ublic
Hea
lth
C-T
ran
Tim
ing:
10
mon
ths
- 1
year
Trai
ning
Nee
ds
N/A
Pub
lic O
utre
ach
Estim
ated
Pub
lic O
utre
ach
Cos
ts:
Are
pub
lic h
eari
ngs
requ
ired
as
part
of t
he c
omp
plan
am
endm
ent p
roce
ss?
Wha
t mea
ns is
cur
rent
ly u
tiliz
ed to
info
rm th
e pu
blic
of c
omp
plan
am
endm
ents
?
City
Tra
nspo
rtat
ion:
0.1
FTE
, con
sult
ants
to g
uide
app
rova
ls p
roce
ss
Cou
nty
Com
mun
ity P
lann
ing:
the
polic
y ex
ists
; fur
ther
cha
nges
sho
uld
be c
ombi
ned
with
Cla
rk C
ount
y D
evel
opm
ent C
ode
Title
40
upgr
ade
that
is ju
st s
tart
ing
Infr
astr
uctu
re N
eeds
N/A
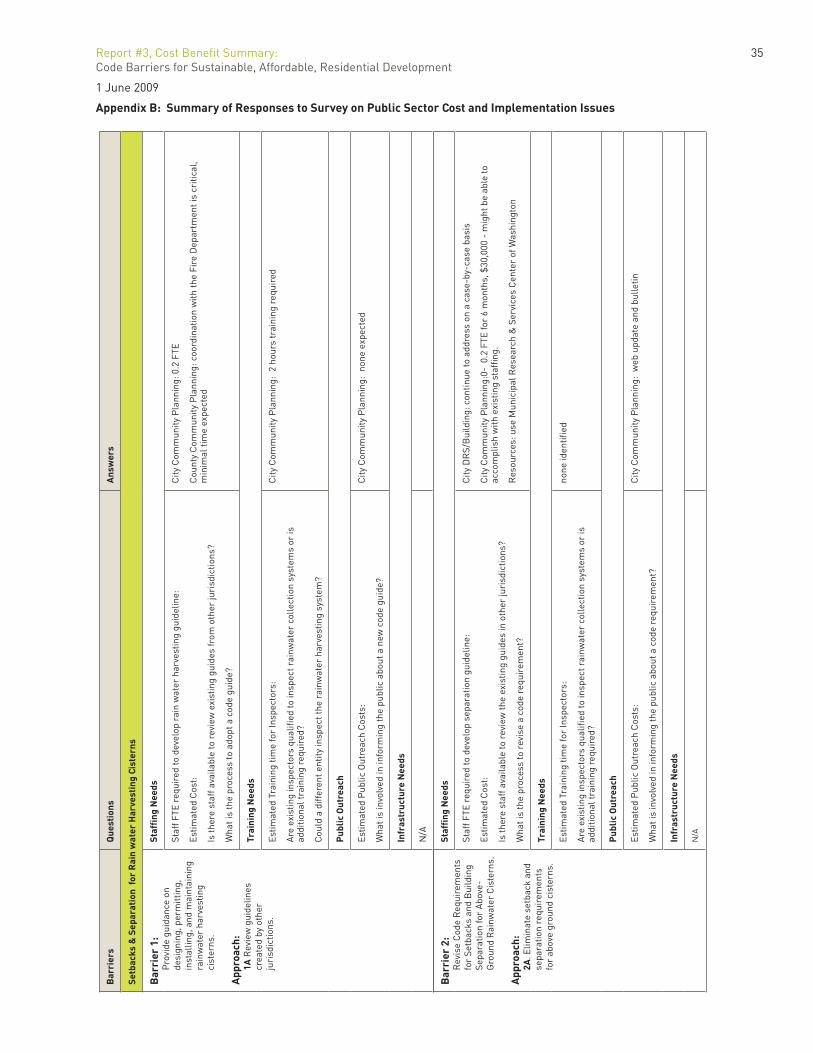
Report #3, Cost Benefi t Summary: 35Code Barriers for Sustainable, Affordable, Residential Development
1 June 2009
Appendix B: Summary of Responses to Survey on Public Sector Cost and Implementation IssuesB
arri
ers
Que
stio
nsA
nsw
ers
Setb
acks
& S
epar
atio
n fo
r R
ain
wat
er H
arve
stin
g Ci
ster
ns
Bar
rier
1:
P
rovi
de g
uida
nce
on
desi
gnin
g, p
erm
ittin
g,
inst
allin
g, a
nd m
aint
aini
ng
rain
wat
er h
arve
stin
g ci
ster
ns.
App
roac
h:
1A
Rev
iew
gui
delin
es
crea
ted
by o
ther
ju
risd
ictio
ns.
Staffi n
g N
eeds
Staf
f FTE
req
uire
d to
dev
elop
rai
n w
ater
har
vest
ing
guid
elin
e:
Estim
ated
Cos
t:
Is th
ere
staf
f ava
ilabl
e to
rev
iew
exi
stin
g gu
ides
from
oth
er ju
risd
ictio
ns?
Wha
t is
the
proc
ess
to a
dopt
a c
ode
guid
e?
City
Com
mun
ity P
lann
ing:
0.2
FTE
Cou
nty
Com
mun
ity P
lann
ing:
coo
rdin
atio
n w
ith th
e Fi
re D
epar
tmen
t is
criti
cal,
min
imal
tim
e ex
pect
ed
Trai
ning
Nee
ds
Estim
ated
Tra
inin
g tim
e fo
r In
spec
tors
:
Are
exi
stin
g in
spec
tors
qua
lifi e
d to
insp
ect r
ainw
ater
col
lect
ion
syst
ems
or is
ad
ditio
nal t
rain
ing
requ
ired
?
Cou
ld a
diff
eren
t ent
ity in
spec
t the
rai
nwat
er h
arve
stin
g sy
stem
?
City
Com
mun
ity P
lann
ing:
2 h
ours
trai
ning
req
uire
d
Pub
lic O
utre
ach
Estim
ated
Pub
lic O
utre
ach
Cos
ts:
Wha
t is
invo
lved
in in
form
ing
the
publ
ic a
bout
a n
ew c
ode
guid
e?
City
Com
mun
ity P
lann
ing:
non
e ex
pect
ed
Infr
astr
uctu
re N
eeds
N/A
Bar
rier
2:
R
evis
e C
ode
Req
uire
men
ts
for
Setb
acks
and
Bui
ldin
g Se
para
tion
for
Abo
ve-
Gro
und
Rai
nwat
er C
iste
rns.
App
roac
h:
2A
. Elim
inat
e se
tbac
k an
d se
para
tion
requ
irem
ents
fo
r ab
ove
grou
nd c
iste
rns.
Staffi n
g N
eeds
Staf
f FTE
req
uire
d to
dev
elop
sep
arat
ion
guid
elin
e:
Estim
ated
Cos
t:
Is th
ere
staf
f ava
ilabl
e to
rev
iew
the
exis
ting
guid
es in
oth
er ju
risd
ictio
ns?
Wha
t is
the
proc
ess
to r
evis
e a
code
req
uire
men
t?
City
DR
S/B
uild
ing:
con
tinue
to a
ddre
ss o
n a
case
-by-
case
bas
is
City
Com
mun
ity P
lann
ing:
0- 0
.2 F
TE fo
r 6
mon
ths,
$30
,000
- m
ight
be
able
to
acco
mpl
ish
with
exi
stin
g st
affi n
g.
Res
ourc
es: u
se M
unic
ipal
Res
earc
h &
Ser
vice
s C
ente
r of
Was
hing
ton
Trai
ning
Nee
ds
Estim
ated
Tra
inin
g tim
e fo
r In
spec
tors
:
Are
exi
stin
g in
spec
tors
qua
lifi e
d to
insp
ect r
ainw
ater
col
lect
ion
syst
ems
or is
ad
ditio
nal t
rain
ing
requ
ired
?
none
iden
tifi e
d
Pub
lic O
utre
ach
Estim
ated
Pub
lic O
utre
ach
Cos
ts:
Wha
t is
invo
lved
in in
form
ing
the
publ
ic a
bout
a c
ode
requ
irem
ent?
City
Com
mun
ity P
lann
ing:
web
upd
ate
and
bulle
tin
Infr
astr
uctu
re N
eeds
N/A
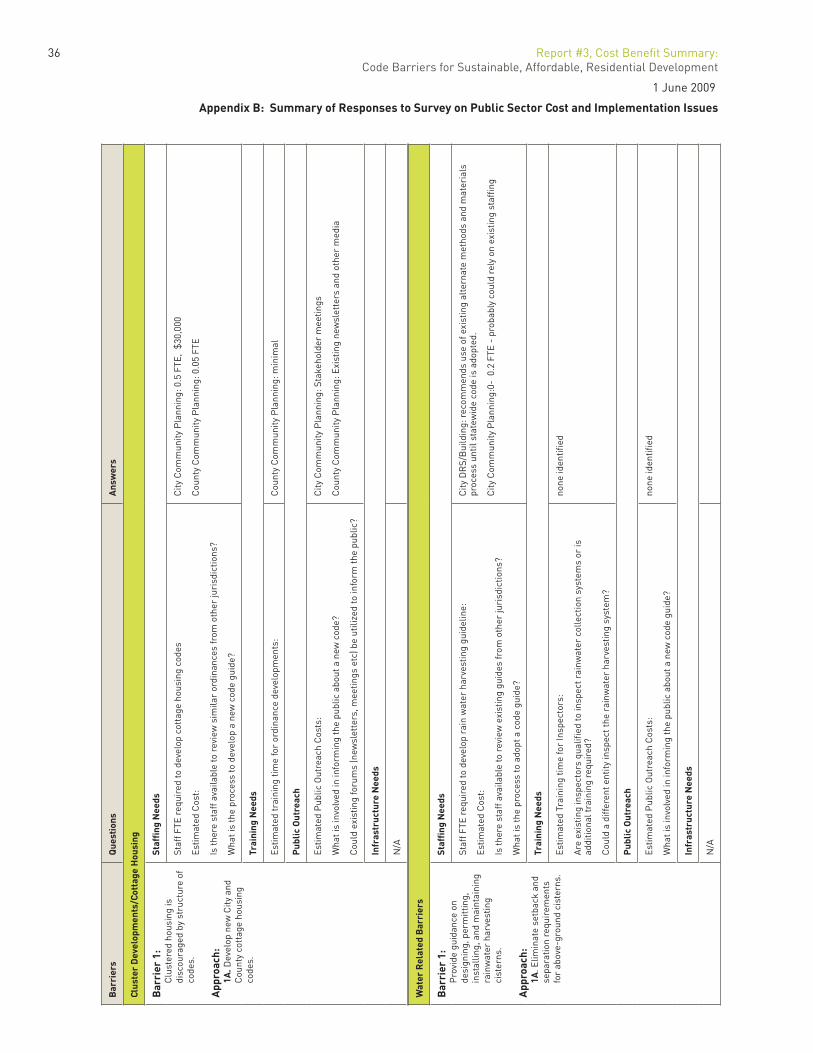
36 Report #3, Cost Benefi t Summary: Code Barriers for Sustainable, Affordable, Residential Development
1 June 2009
Appendix B: Summary of Responses to Survey on Public Sector Cost and Implementation Issues
Wat
er R
elat
ed B
arri
ers
Bar
rier
1:
P
rovi
de g
uida
nce
on
desi
gnin
g, p
erm
ittin
g,
inst
allin
g, a
nd m
aint
aini
ng
rain
wat
er h
arve
stin
g ci
ster
ns.
App
roac
h:
1A
. Elim
inat
e se
tbac
k an
d se
para
tion
requ
irem
ents
fo
r ab
ove-
grou
nd c
iste
rns.
Staffi n
g N
eeds
Staf
f FTE
req
uire
d to
dev
elop
rai
n w
ater
har
vest
ing
guid
elin
e:
Estim
ated
Cos
t:
Is th
ere
staf
f ava
ilabl
e to
rev
iew
exi
stin
g gu
ides
from
oth
er ju
risd
ictio
ns?
Wha
t is
the
proc
ess
to a
dopt
a c
ode
guid
e?
City
DR
S/B
uild
ing:
rec
omm
ends
use
of e
xist
ing
alte
rnat
e m
etho
ds a
nd m
ater
ials
pr
oces
s un
til s
tate
wid
e co
de is
ado
pted
.
City
Com
mun
ity P
lann
ing:
0- 0
.2 F
TE -
pro
babl
y co
uld
rely
on
exis
ting
staffi n
g
Trai
ning
Nee
ds
Estim
ated
Tra
inin
g tim
e fo
r In
spec
tors
:
Are
exi
stin
g in
spec
tors
qua
lifi e
d to
insp
ect r
ainw
ater
col
lect
ion
syst
ems
or is
ad
ditio
nal t
rain
ing
requ
ired
?
Cou
ld a
diff
eren
t ent
ity in
spec
t the
rai
nwat
er h
arve
stin
g sy
stem
?
none
iden
tifi e
d
Pub
lic O
utre
ach
Estim
ated
Pub
lic O
utre
ach
Cos
ts:
Wha
t is
invo
lved
in in
form
ing
the
publ
ic a
bout
a n
ew c
ode
guid
e?
none
iden
tifi e
d
Infr
astr
uctu
re N
eeds
N/A
Bar
rier
sQ
uest
ions
Ans
wer
s
Clus
ter
Dev
elop
men
ts/C
otta
ge H
ousi
ng
Bar
rier
1:
C
lust
ered
hou
sing
is
disc
oura
ged
by s
truc
ture
of
code
s.
App
roac
h:
1A
. Dev
elop
new
City
and
C
ount
y co
ttag
e ho
usin
g co
des.
Staffi n
g N
eeds
Staf
f FTE
req
uire
d to
dev
elop
cot
tage
hou
sing
cod
es
Estim
ated
Cos
t:
Is th
ere
staf
f ava
ilabl
e to
rev
iew
sim
ilar
ordi
nanc
es fr
om o
ther
juri
sdic
tions
?
Wha
t is
the
proc
ess
to d
evel
op a
new
cod
e gu
ide?
City
Com
mun
ity P
lann
ing:
0.5
FTE
, $3
0,00
0
Cou
nty
Com
mun
ity P
lann
ing:
0.0
5 FT
E
Trai
ning
Nee
ds
Estim
ated
trai
ning
tim
e fo
r or
dina
nce
deve
lopm
ents
: C
ount
y C
omm
unity
Pla
nnin
g: m
inim
al
Pub
lic O
utre
ach
Estim
ated
Pub
lic O
utre
ach
Cos
ts:
Wha
t is
invo
lved
in in
form
ing
the
publ
ic a
bout
a n
ew c
ode?
Cou
ld e
xist
ing
foru
ms
(new
slet
ters
, mee
tings
etc
) be
utili
zed
to in
form
the
publ
ic?
City
Com
mun
ity P
lann
ing:
Sta
keho
lder
mee
tings
Cou
nty
Com
mun
ity P
lann
ing:
Exi
stin
g ne
wsl
ette
rs a
nd o
ther
med
ia
Infr
astr
uctu
re N
eeds
N/A
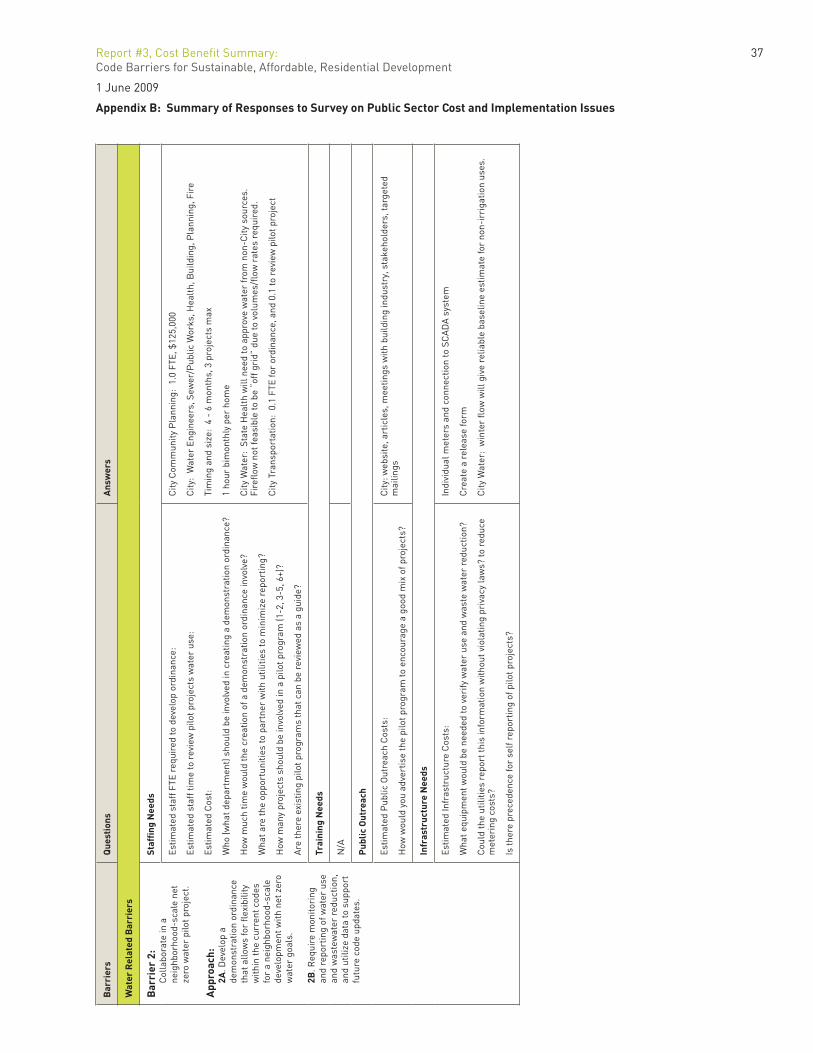
Report #3, Cost Benefi t Summary: 37Code Barriers for Sustainable, Affordable, Residential Development
1 June 2009
Appendix B: Summary of Responses to Survey on Public Sector Cost and Implementation IssuesB
arri
ers
Que
stio
nsA
nsw
ers
Wat
er R
elat
ed B
arri
ers
Bar
rier
2:
C
olla
bora
te in
a
neig
hbor
hood
-sca
le n
et
zero
wat
er p
ilot p
roje
ct.
App
roac
h:
2A
. Dev
elop
a
dem
onst
ratio
n or
dina
nce
that
allo
ws
for fl e
xibi
lity
with
in th
e cu
rren
t cod
es
for
a ne
ighb
orho
od-s
cale
de
velo
pmen
t with
net
zer
o w
ater
goa
ls.
2B
. Req
uire
mon
itori
ng
and
repo
rtin
g of
wat
er u
se
and
was
tew
ater
red
uctio
n,
and
utili
ze d
ata
to s
uppo
rt
futu
re c
ode
upda
tes.
Staffi n
g N
eeds
Estim
ated
sta
ff F
TE r
equi
red
to d
evel
op o
rdin
ance
:
Estim
ated
sta
ff ti
me
to r
evie
w p
ilot p
roje
cts
wat
er u
se:
Estim
ated
Cos
t:
Who
(wha
t dep
artm
ent)
sho
uld
be in
volv
ed in
cre
atin
g a
dem
onst
ratio
n or
dina
nce?
How
muc
h tim
e w
ould
the
crea
tion
of a
dem
onst
ratio
n or
dina
nce
invo
lve?
Wha
t are
the
oppo
rtun
ities
to p
artn
er w
ith u
tiliti
es to
min
imiz
e re
port
ing?
How
man
y pr
ojec
ts s
houl
d be
invo
lved
in a
pilo
t pro
gram
(1-2
, 3-5
, 6+)
?
Are
ther
e ex
istin
g pi
lot p
rogr
ams
that
can
be
revi
ewed
as
a gu
ide?
City
Com
mun
ity P
lann
ing:
1.0
FTE
, $12
5,00
0
City
: W
ater
Eng
inee
rs, S
ewer
/Pub
lic W
orks
, Hea
lth,
Bui
ldin
g, P
lann
ing,
Fir
e
Tim
ing
and
size
: 4
- 6
mon
ths,
3 p
roje
cts
max
1 ho
ur b
imon
thly
per
hom
e
City
Wat
er:
Stat
e H
ealt
h w
ill n
eed
to a
ppro
ve w
ater
from
non
-City
sou
rces
. Fi
refl o
w n
ot fe
asib
le to
be
“off
gri
d” d
ue to
vol
umes
/fl o
w r
ates
req
uire
d.
City
Tra
nspo
rtat
ion:
0.1
FTE
for
ordi
nanc
e, a
nd 0
.1 to
rev
iew
pilo
t pro
ject
Trai
ning
Nee
ds
N/A
Pub
lic O
utre
ach
Estim
ated
Pub
lic O
utre
ach
Cos
ts:
How
wou
ld y
ou a
dver
tise
the
pilo
t pro
gram
to e
ncou
rage
a g
ood
mix
of p
roje
cts?
City
: web
site
, art
icle
s, m
eetin
gs w
ith b
uild
ing
indu
stry
, sta
keho
lder
s, ta
rget
ed
mai
lings
Infr
astr
uctu
re N
eeds
Estim
ated
Infr
astr
uctu
re C
osts
:
Wha
t equ
ipm
ent w
ould
be
need
ed to
ver
ify w
ater
use
and
was
te w
ater
red
uctio
n?
Cou
ld th
e ut
ilitie
s re
port
this
info
rmat
ion
with
out v
iola
ting
priv
acy
law
s? to
red
uce
met
erin
g co
sts?
Is th
ere
prec
eden
ce fo
r se
lf r
epor
ting
of p
ilot p
roje
cts?
Indi
vidu
al m
eter
s an
d co
nnec
tion
to S
CA
DA
sys
tem
Cre
ate
a re
leas
e fo
rm
City
Wat
er:
win
ter fl o
w w
ill g
ive
relia
ble
base
line
estim
ate
for
non-
irri
gatio
n us
es.
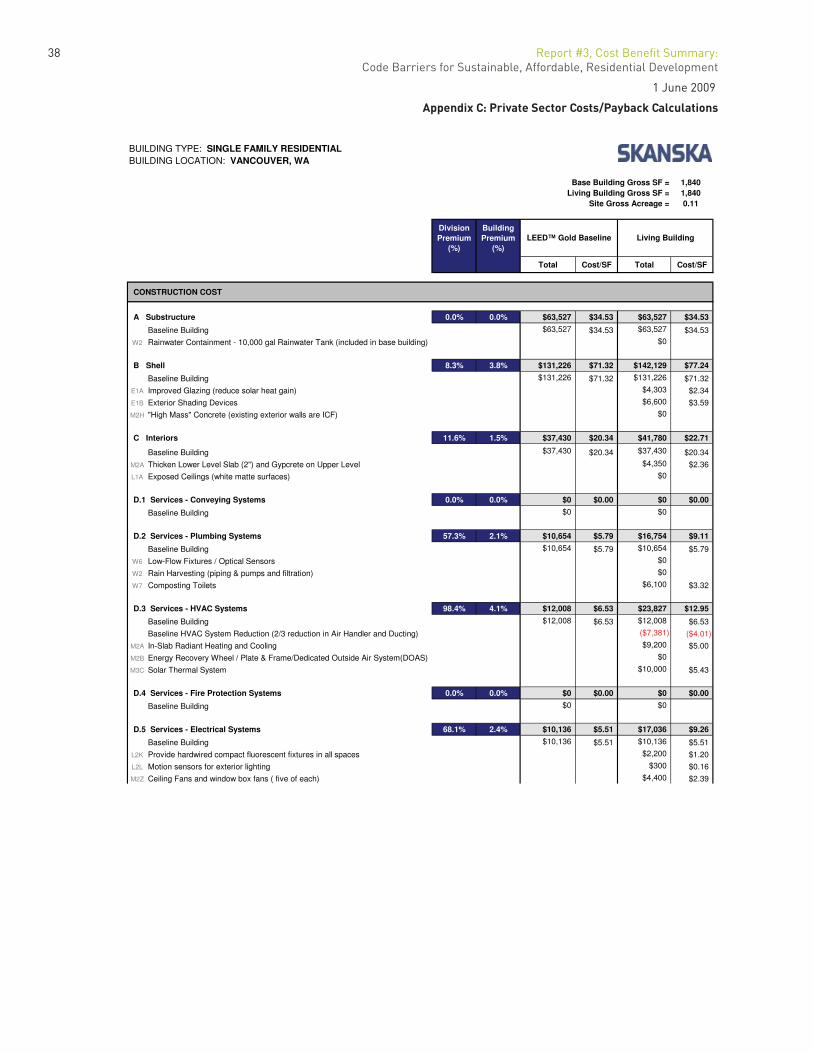
38 Report #3, Cost Benefi t Summary: Code Barriers for Sustainable, Affordable, Residential Development
1 June 2009
Appendix C: Private Sector Costs/Payback Calculations
BUILDING TYPE: SINGLE FAMILY RESIDENTIALBUILDING LOCATION: VANCOUVER, WA
Base Building Gross SF = 1,840Living Building Gross SF = 1,840
Site Gross Acreage = 0.11
Division Premium
(%)
Building Premium
(%)
Total Cost/SF Total Cost/SF
CONSTRUCTION COST
A Substructure 0.0% 0.0% $63,527 $34.53 $63,527 $34.53
Baseline Building $63,527 $34.53 $63,527 $34.53
W2 Rainwater Containment - 10,000 gal Rainwater Tank (included in base building) $0
B Shell 8.3% 3.8% $131,226 $71.32 $142,129 $77.24
Baseline Building $131,226 $71.32 $131,226 $71.32
E1A Improved Glazing (reduce solar heat gain) $4,303 $2.34
E1B Exterior Shading Devices $6,600 $3.59
M2H "High Mass" Concrete (existing exterior walls are ICF) $0
C Interiors 11.6% 1.5% $37,430 $20.34 $41,780 $22.71
Baseline Building $37,430 $20.34 $37,430 $20.34
M2A Thicken Lower Level Slab (2") and Gypcrete on Upper Level $4,350 $2.36
L1A Exposed Ceilings (white matte surfaces) $0
D.1 Services - Conveying Systems 0.0% 0.0% $0 $0.00 $0 $0.00
Baseline Building $0 $0
D.2 Services - Plumbing Systems 57.3% 2.1% $10,654 $5.79 $16,754 $9.11
Baseline Building $10,654 $5.79 $10,654 $5.79
W6 Low-Flow Fixtures / Optical Sensors $0
W2 Rain Harvesting (piping & pumps and filtration) $0
W7 Composting Toilets $6,100 $3.32
D.3 Services - HVAC Systems 98.4% 4.1% $12,008 $6.53 $23,827 $12.95
Baseline Building $12,008 $6.53 $12,008 $6.53
Baseline HVAC System Reduction (2/3 reduction in Air Handler and Ducting) ($7,381) ($4.01)
M2A In-Slab Radiant Heating and Cooling $9,200 $5.00
M2B Energy Recovery Wheel / Plate & Frame/Dedicated Outside Air System(DOAS) $0
M3C Solar Thermal System $10,000 $5.43
D.4 Services - Fire Protection Systems 0.0% 0.0% $0 $0.00 $0 $0.00
Baseline Building $0 $0
D.5 Services - Electrical Systems 68.1% 2.4% $10,136 $5.51 $17,036 $9.26
Baseline Building $10,136 $5.51 $10,136 $5.51
L2K Provide hardwired compact fluorescent fixtures in all spaces $2,200 $1.20
L2L Motion sensors for exterior lighting $300 $0.16
M2Z Ceiling Fans and window box fans ( five of each) $4,400 $2.39
LEED™ Gold Baseline Living Building
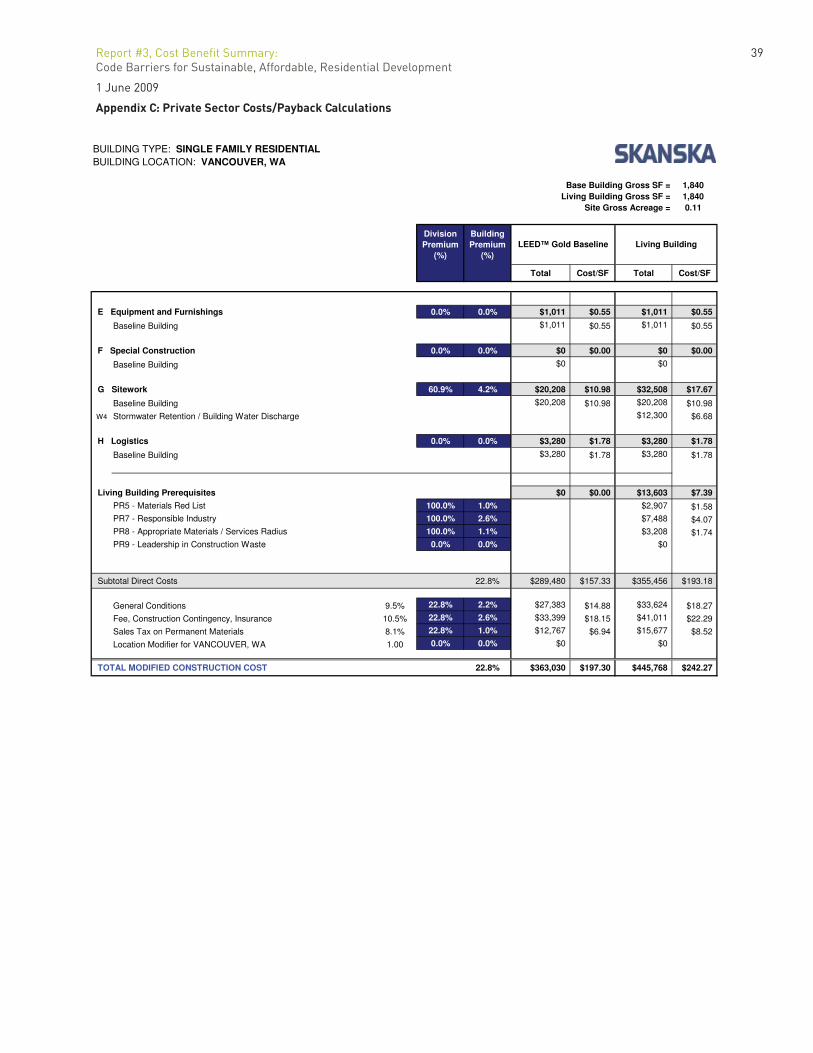
Report #3, Cost Benefi t Summary: 39Code Barriers for Sustainable, Affordable, Residential Development
1 June 2009
Appendix C: Private Sector Costs/Payback Calculations
BUILDING TYPE: SINGLE FAMILY RESIDENTIALBUILDING LOCATION: VANCOUVER, WA
Base Building Gross SF = 1,840Living Building Gross SF = 1,840
Site Gross Acreage = 0.11
Division Premium
(%)
Building Premium
(%)
Total Cost/SF Total Cost/SF
LEED™ Gold Baseline Living Building
E Equipment and Furnishings 0.0% 0.0% $1,011 $0.55 $1,011 $0.55
Baseline Building $1,011 $0.55 $1,011 $0.55
F Special Construction 0.0% 0.0% $0 $0.00 $0 $0.00
Baseline Building $0 $0
G Sitework 60.9% 4.2% $20,208 $10.98 $32,508 $17.67
Baseline Building $20,208 $10.98 $20,208 $10.98
W4 Stormwater Retention / Building Water Discharge $12,300 $6.68
H Logistics 0.0% 0.0% $3,280 $1.78 $3,280 $1.78
Baseline Building $3,280 $1.78 $3,280 $1.78
Living Building Prerequisites $0 $0.00 $13,603 $7.39
PR5 - Materials Red List 100.0% 1.0% $2,907 $1.58PR7 - Responsible Industry 100.0% 2.6% $7,488 $4.07PR8 - Appropriate Materials / Services Radius 100.0% 1.1% $3,208 $1.74PR9 - Leadership in Construction Waste 0.0% 0.0% $0
Subtotal Direct Costs 22.8% $289,480 $157.33 $355,456 $193.18
General Conditions 9.5% 22.8% 2.2% $27,383 $14.88 $33,624 $18.27
Fee, Construction Contingency, Insurance 10.5% 22.8% 2.6% $33,399 $18.15 $41,011 $22.29
Sales Tax on Permanent Materials 8.1% 22.8% 1.0% $12,767 $6.94 $15,677 $8.52
Location Modifier for VANCOUVER, WA 1.00 0.0% 0.0% $0 $0
TOTAL MODIFIED CONSTRUCTION COST 22.8% $363,030 $197.30 $445,768 $242.27
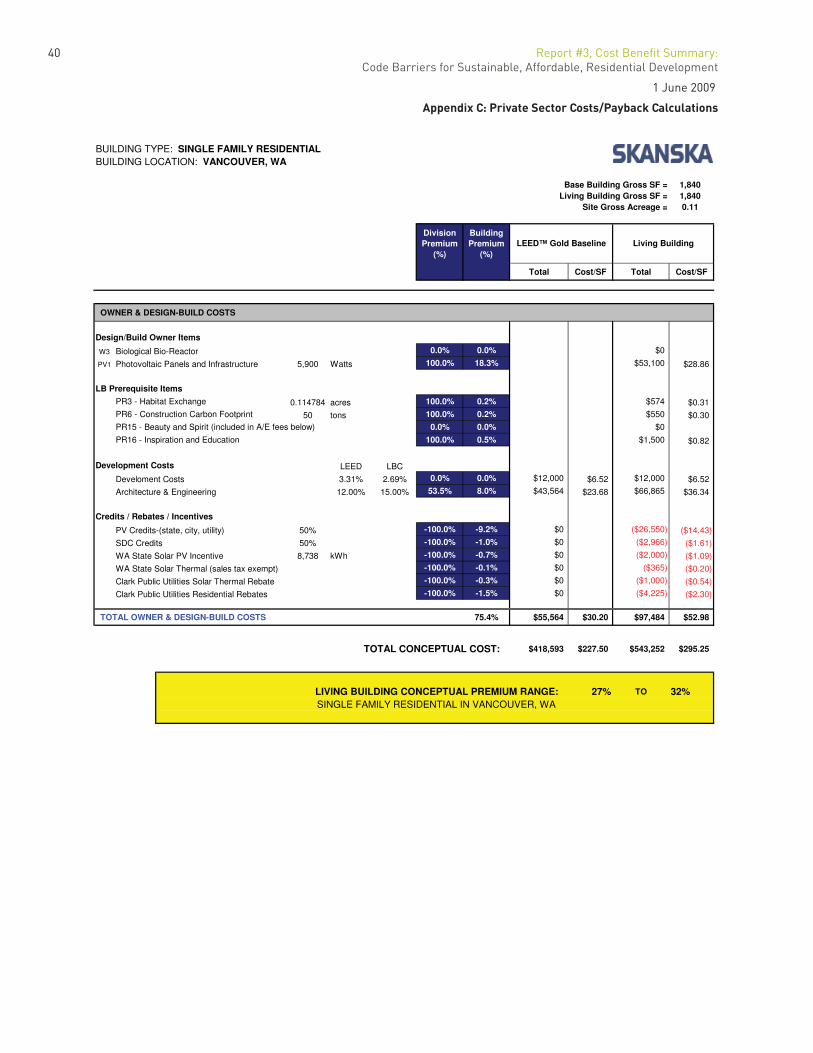
40 Report #3, Cost Benefi t Summary: Code Barriers for Sustainable, Affordable, Residential Development
1 June 2009
Appendix C: Private Sector Costs/Payback Calculations
BUILDING TYPE: SINGLE FAMILY RESIDENTIALBUILDING LOCATION: VANCOUVER, WA
Base Building Gross SF = 1,840Living Building Gross SF = 1,840
Site Gross Acreage = 0.11
Division Premium
(%)
Building Premium
(%)
Total Cost/SF Total Cost/SF
LEED™ Gold Baseline Living Building
OWNER & DESIGN-BUILD COSTS
Design/Build Owner Items
W3 Biological Bio-Reactor 0.0% 0.0% $0
PV1 Photovoltaic Panels and Infrastructure 5,900 Watts 100.0% 18.3% $53,100 $28.86
LB Prerequisite Items
PR3 - Habitat Exchange 0.114784 acres 100.0% 0.2% $574 $0.31PR6 - Construction Carbon Footprint 50 tons 100.0% 0.2% $550 $0.30PR15 - Beauty and Spirit (included in A/E fees below) 0.0% 0.0% $0
PR16 - Inspiration and Education 100.0% 0.5% $1,500 $0.82
Development Costs LEED LBC
Develoment Costs 3.31% 2.69% 0.0% 0.0% $12,000 $6.52 $12,000 $6.52
Architecture & Engineering 12.00% 15.00% 53.5% 8.0% $43,564 $23.68 $66,865 $36.34
Credits / Rebates / Incentives
PV Credits-(state, city, utility) 50% -100.0% -9.2% $0 ($26,550) ($14.43)
SDC Credits 50% -100.0% -1.0% $0 ($2,966) ($1.61)
WA State Solar PV Incentive 8,738 kWh -100.0% -0.7% $0 ($2,000) ($1.09)
WA State Solar Thermal (sales tax exempt) -100.0% -0.1% $0 ($365) ($0.20)
Clark Public Utilities Solar Thermal Rebate -100.0% -0.3% $0 ($1,000) ($0.54)
Clark Public Utilities Residential Rebates -100.0% -1.5% $0 ($4,225) ($2.30)
TOTAL OWNER & DESIGN-BUILD COSTS 75.4% $55,564 $30.20 $97,484 $52.98
TOTAL CONCEPTUAL COST: $418,593 $227.50 $543,252 $295.25
LIVING BUILDING CONCEPTUAL PREMIUM RANGE: 27% TO 32%SINGLE FAMILY RESIDENTIAL IN VANCOUVER, WA
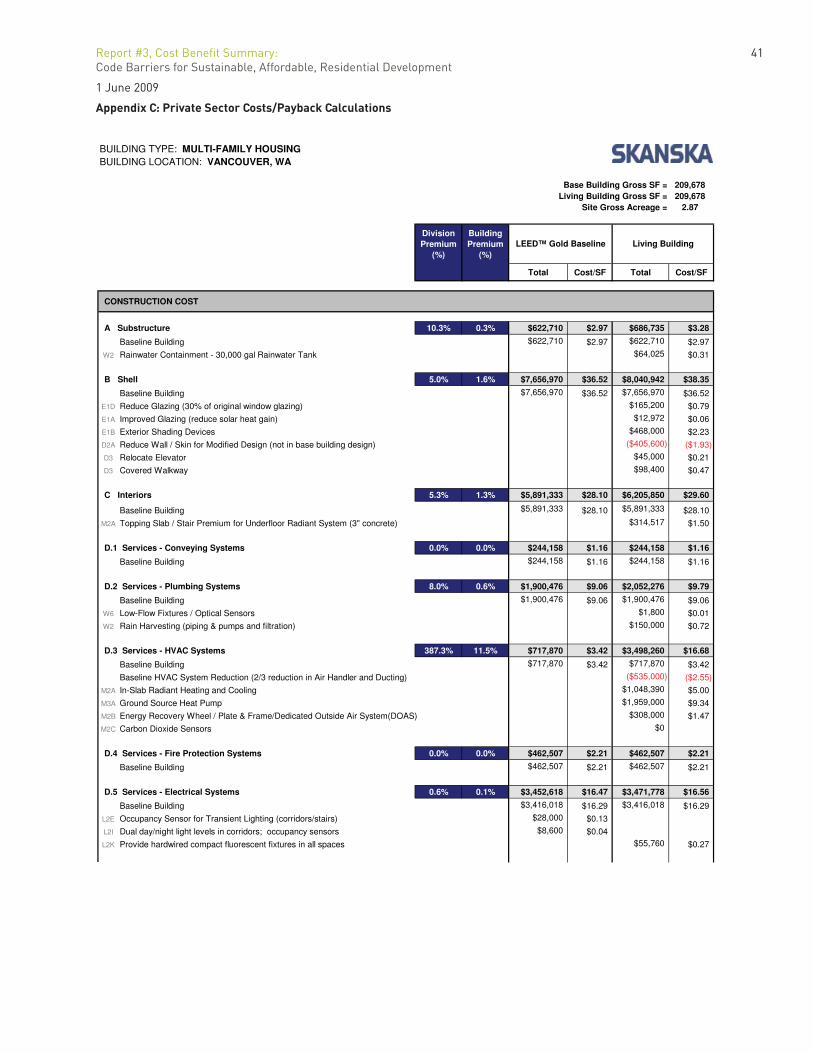
Report #3, Cost Benefi t Summary: 41Code Barriers for Sustainable, Affordable, Residential Development
1 June 2009
Appendix C: Private Sector Costs/Payback Calculations
BUILDING TYPE: MULTI-FAMILY HOUSINGBUILDING LOCATION: VANCOUVER, WA
Base Building Gross SF = 209,678Living Building Gross SF = 209,678
Site Gross Acreage = 2.87
Division Premium
(%)
Building Premium
(%)
Total Cost/SF Total Cost/SF
CONSTRUCTION COST
A Substructure 10.3% 0.3% $622,710 $2.97 $686,735 $3.28
Baseline Building $622,710 $2.97 $622,710 $2.97
W2 Rainwater Containment - 30,000 gal Rainwater Tank $64,025 $0.31
B Shell 5.0% 1.6% $7,656,970 $36.52 $8,040,942 $38.35
Baseline Building $7,656,970 $36.52 $7,656,970 $36.52
E1D Reduce Glazing (30% of original window glazing) $165,200 $0.79
E1A Improved Glazing (reduce solar heat gain) $12,972 $0.06
E1B Exterior Shading Devices $468,000 $2.23
D2A Reduce Wall / Skin for Modified Design (not in base building design) ($405,600) ($1.93)
D3 Relocate Elevator $45,000 $0.21
D3 Covered Walkway $98,400 $0.47
C Interiors 5.3% 1.3% $5,891,333 $28.10 $6,205,850 $29.60
Baseline Building $5,891,333 $28.10 $5,891,333 $28.10
M2A Topping Slab / Stair Premium for Underfloor Radiant System (3" concrete) $314,517 $1.50
D.1 Services - Conveying Systems 0.0% 0.0% $244,158 $1.16 $244,158 $1.16
Baseline Building $244,158 $1.16 $244,158 $1.16
D.2 Services - Plumbing Systems 8.0% 0.6% $1,900,476 $9.06 $2,052,276 $9.79
Baseline Building $1,900,476 $9.06 $1,900,476 $9.06
W6 Low-Flow Fixtures / Optical Sensors $1,800 $0.01
W2 Rain Harvesting (piping & pumps and filtration) $150,000 $0.72
D.3 Services - HVAC Systems 387.3% 11.5% $717,870 $3.42 $3,498,260 $16.68
Baseline Building $717,870 $3.42 $717,870 $3.42
Baseline HVAC System Reduction (2/3 reduction in Air Handler and Ducting) ($535,000) ($2.55)
M2A In-Slab Radiant Heating and Cooling $1,048,390 $5.00
M3A Ground Source Heat Pump $1,959,000 $9.34
M2B Energy Recovery Wheel / Plate & Frame/Dedicated Outside Air System(DOAS) $308,000 $1.47
M2C Carbon Dioxide Sensors $0
D.4 Services - Fire Protection Systems 0.0% 0.0% $462,507 $2.21 $462,507 $2.21
Baseline Building $462,507 $2.21 $462,507 $2.21
D.5 Services - Electrical Systems 0.6% 0.1% $3,452,618 $16.47 $3,471,778 $16.56
Baseline Building $3,416,018 $16.29 $3,416,018 $16.29
L2E Occupancy Sensor for Transient Lighting (corridors/stairs) $28,000 $0.13
L2I Dual day/night light levels in corridors; occupancy sensors $8,600 $0.04
L2K Provide hardwired compact fluorescent fixtures in all spaces $55,760 $0.27
LEED™ Gold Baseline Living Building
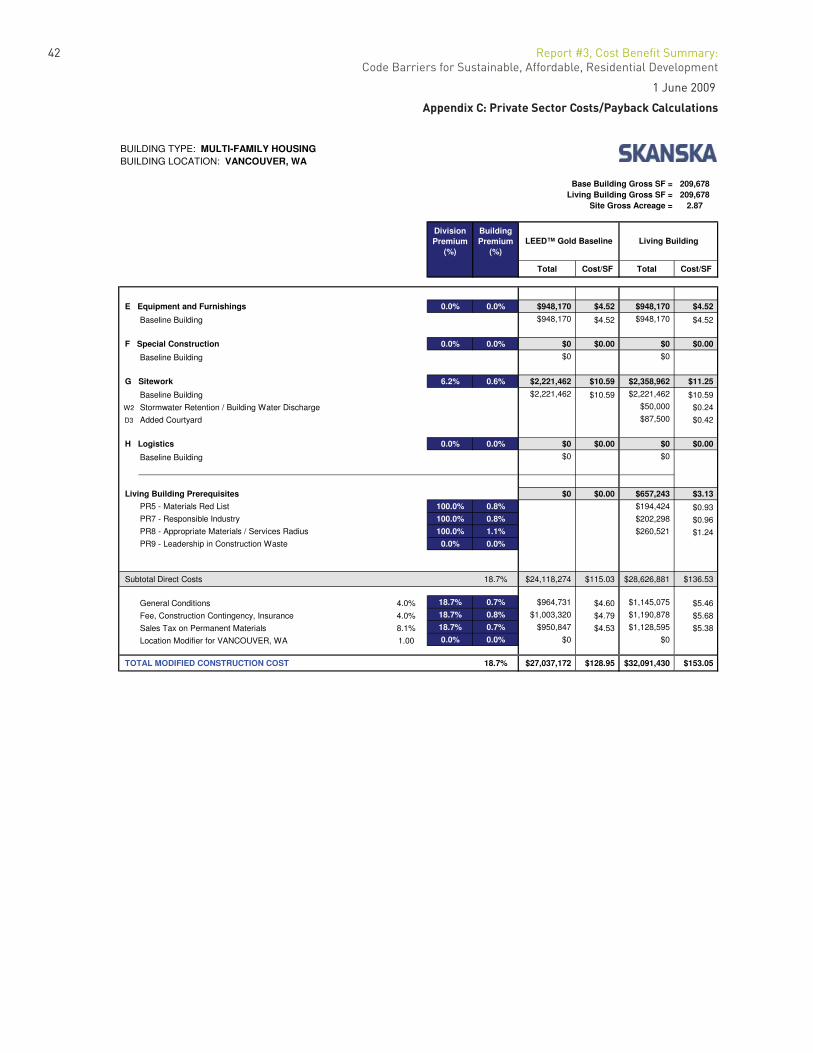
42 Report #3, Cost Benefi t Summary: Code Barriers for Sustainable, Affordable, Residential Development
1 June 2009
Appendix C: Private Sector Costs/Payback Calculations
BUILDING TYPE: MULTI-FAMILY HOUSINGBUILDING LOCATION: VANCOUVER, WA
Base Building Gross SF = 209,678Living Building Gross SF = 209,678
Site Gross Acreage = 2.87
Division Premium
(%)
Building Premium
(%)
Total Cost/SF Total Cost/SF
LEED™ Gold Baseline Living Building
E Equipment and Furnishings 0.0% 0.0% $948,170 $4.52 $948,170 $4.52
Baseline Building $948,170 $4.52 $948,170 $4.52
F Special Construction 0.0% 0.0% $0 $0.00 $0 $0.00
Baseline Building $0 $0
G Sitework 6.2% 0.6% $2,221,462 $10.59 $2,358,962 $11.25
Baseline Building $2,221,462 $10.59 $2,221,462 $10.59
W2 Stormwater Retention / Building Water Discharge $50,000 $0.24
D3 Added Courtyard $87,500 $0.42
H Logistics 0.0% 0.0% $0 $0.00 $0 $0.00
Baseline Building $0 $0
Living Building Prerequisites $0 $0.00 $657,243 $3.13
PR5 - Materials Red List 100.0% 0.8% $194,424 $0.93PR7 - Responsible Industry 100.0% 0.8% $202,298 $0.96PR8 - Appropriate Materials / Services Radius 100.0% 1.1% $260,521 $1.24PR9 - Leadership in Construction Waste 0.0% 0.0%
Subtotal Direct Costs 18.7% $24,118,274 $115.03 $28,626,881 $136.53
General Conditions 4.0% 18.7% 0.7% $964,731 $4.60 $1,145,075 $5.46
Fee, Construction Contingency, Insurance 4.0% 18.7% 0.8% $1,003,320 $4.79 $1,190,878 $5.68
Sales Tax on Permanent Materials 8.1% 18.7% 0.7% $950,847 $4.53 $1,128,595 $5.38
Location Modifier for VANCOUVER, WA 1.00 0.0% 0.0% $0 $0
TOTAL MODIFIED CONSTRUCTION COST 18.7% $27,037,172 $128.95 $32,091,430 $153.05
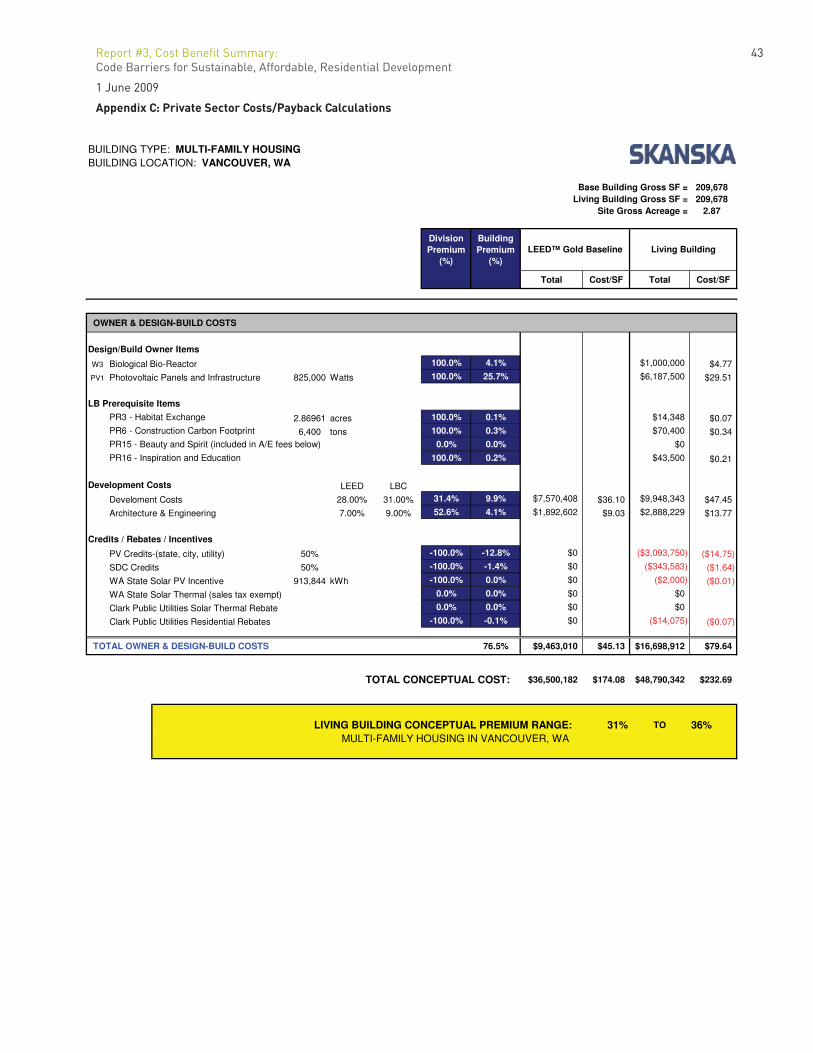
Report #3, Cost Benefi t Summary: 43Code Barriers for Sustainable, Affordable, Residential Development
1 June 2009
Appendix C: Private Sector Costs/Payback Calculations
BUILDING TYPE: MULTI-FAMILY HOUSINGBUILDING LOCATION: VANCOUVER, WA
Base Building Gross SF = 209,678Living Building Gross SF = 209,678
Site Gross Acreage = 2.87
Division Premium
(%)
Building Premium
(%)
Total Cost/SF Total Cost/SF
LEED™ Gold Baseline Living Building
OWNER & DESIGN-BUILD COSTS
Design/Build Owner Items
W3 Biological Bio-Reactor 100.0% 4.1% $1,000,000 $4.77
PV1 Photovoltaic Panels and Infrastructure 825,000 Watts 100.0% 25.7% $6,187,500 $29.51
LB Prerequisite Items
PR3 - Habitat Exchange 2.86961 acres 100.0% 0.1% $14,348 $0.07PR6 - Construction Carbon Footprint 6,400 tons 100.0% 0.3% $70,400 $0.34PR15 - Beauty and Spirit (included in A/E fees below) 0.0% 0.0% $0
PR16 - Inspiration and Education 100.0% 0.2% $43,500 $0.21
Development Costs LEED LBC
Develoment Costs 28.00% 31.00% 31.4% 9.9% $7,570,408 $36.10 $9,948,343 $47.45
Architecture & Engineering 7.00% 9.00% 52.6% 4.1% $1,892,602 $9.03 $2,888,229 $13.77
Credits / Rebates / Incentives
PV Credits-(state, city, utility) 50% -100.0% -12.8% $0 ($3,093,750) ($14.75)
SDC Credits 50% -100.0% -1.4% $0 ($343,583) ($1.64)
WA State Solar PV Incentive 913,844 kWh -100.0% 0.0% $0 ($2,000) ($0.01)
WA State Solar Thermal (sales tax exempt) 0.0% 0.0% $0 $0
Clark Public Utilities Solar Thermal Rebate 0.0% 0.0% $0 $0
Clark Public Utilities Residential Rebates -100.0% -0.1% $0 ($14,075) ($0.07)
TOTAL OWNER & DESIGN-BUILD COSTS 76.5% $9,463,010 $45.13 $16,698,912 $79.64
TOTAL CONCEPTUAL COST: $36,500,182 $174.08 $48,790,342 $232.69
LIVING BUILDING CONCEPTUAL PREMIUM RANGE: 31% TO 36%MULTI-FAMILY HOUSING IN VANCOUVER, WA
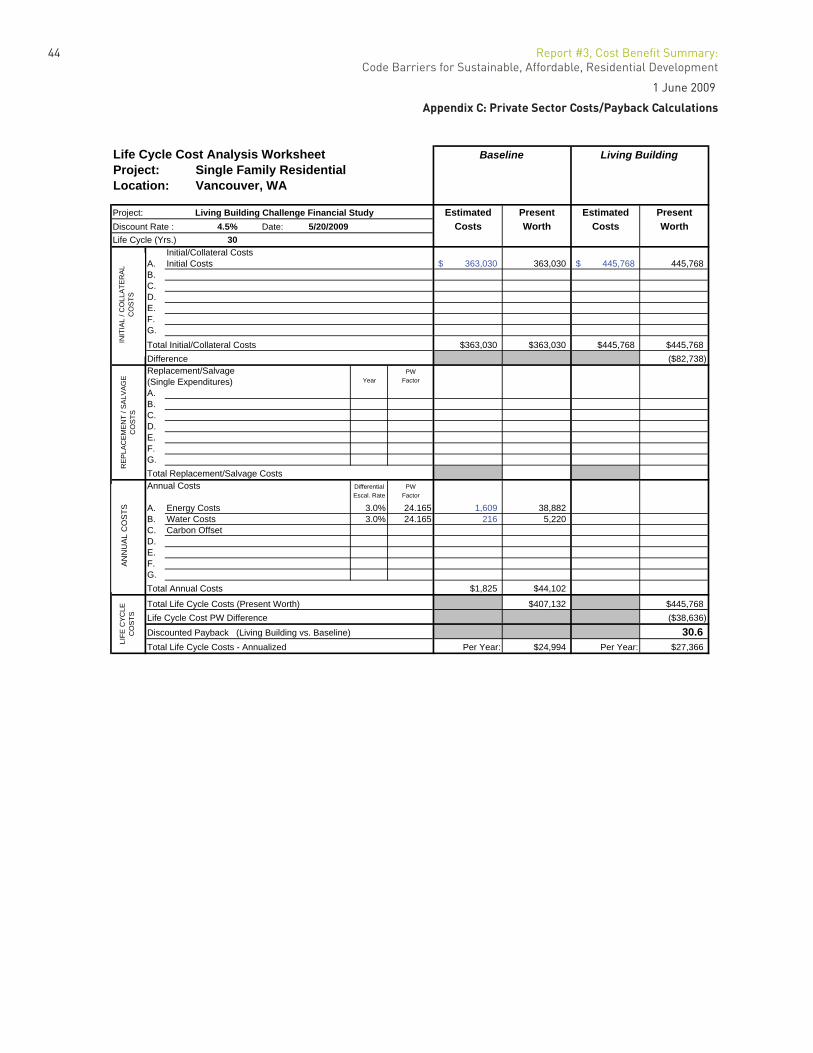
44 Report #3, Cost Benefi t Summary: Code Barriers for Sustainable, Affordable, Residential Development
1 June 2009
Appendix C: Private Sector Costs/Payback Calculations
Life Cycle Cost Analysis Worksheet Baseline Living BuildingProject: Single Family ResidentialLocation: Vancouver, WA
Project: Living Building Challenge Financial Study Estimated Present Estimated PresentDiscount Rate : 4.5% Date: 5/20/2009 Costs Worth Costs WorthLife Cycle (Yrs.) 30
Initial/Collateral CostsA. Initial Costs 363,030$ 363,030 445,768$ 445,768B.C.D.E.F.G.Total Initial/Collateral Costs $363,030 $363,030 $445,768 $445,768Difference ($82,738)Replacement/Salvage PW
(Single Expenditures) Year Factor
A.B.C.D.E.F.G.Total Replacement/Salvage CostsAnnual Costs Differential PW
Escal. Rate Factor
A. Energy Costs 3.0% 24.165 1,609 38,882B. Water Costs 3.0% 24.165 216 5,220C. Carbon OffsetD.E.F.G.Total Annual Costs $1,825 $44,102
Total Life Cycle Costs (Present Worth) $407,132 $445,768Life Cycle Cost PW Difference ($38,636)Discounted Payback (Living Building vs. Baseline) 30.6Total Life Cycle Costs - Annualized Per Year: $24,994 Per Year: $27,366
INIT
IAL
/CO
LLAT
ERAL
CO
STS
REP
LAC
EMEN
T / S
ALVA
GE
CO
STS
ANN
UAL
CO
STS
LIFE
CYC
LE
CO
STS
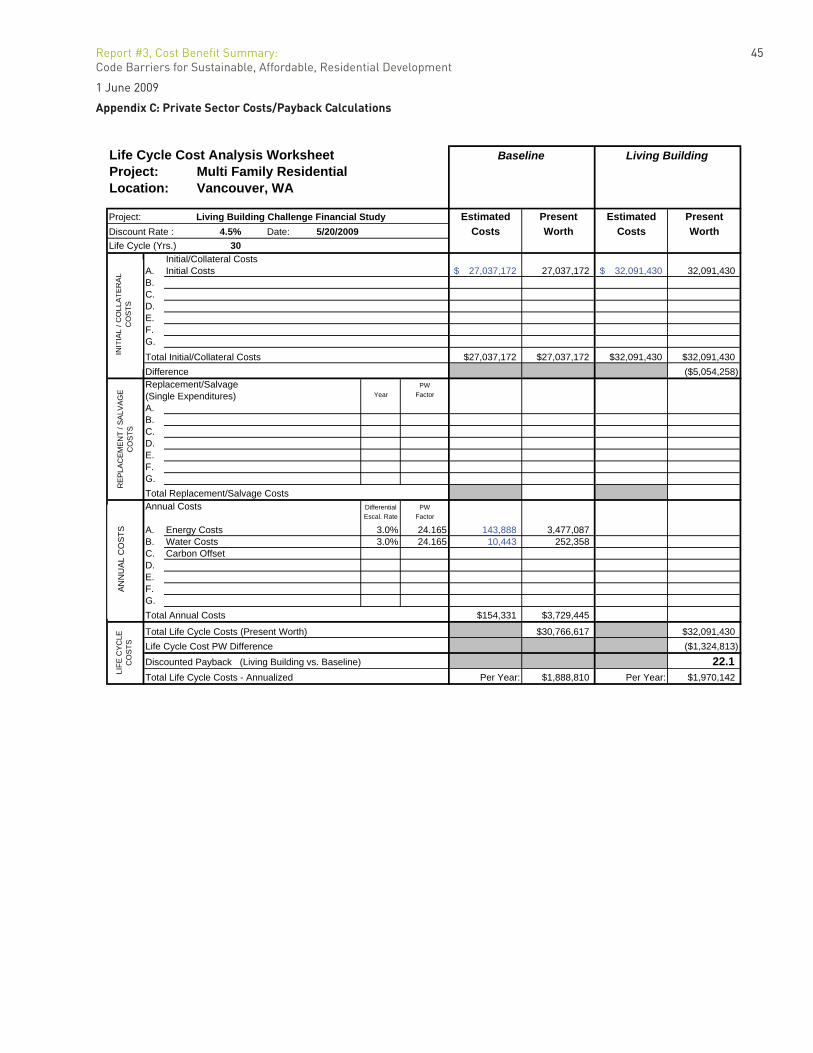
Report #3, Cost Benefi t Summary: 45Code Barriers for Sustainable, Affordable, Residential Development
1 June 2009
Appendix C: Private Sector Costs/Payback Calculations
Life Cycle Cost Analysis Worksheet Baseline Living BuildingProject: Multi Family ResidentialLocation: Vancouver, WA
Project: Living Building Challenge Financial Study Estimated Present Estimated PresentDiscount Rate : 4.5% Date: 5/20/2009 Costs Worth Costs WorthLife Cycle (Yrs.) 30
Initial/Collateral CostsA. Initial Costs 27,037,172$ 27,037,172 32,091,430$ 32,091,430B.C.D.E.F.G.Total Initial/Collateral Costs $27,037,172 $27,037,172 $32,091,430 $32,091,430Difference ($5,054,258)Replacement/Salvage PW
(Single Expenditures) Year Factor
A.B.C.D.E.F.G.Total Replacement/Salvage CostsAnnual Costs Differential PW
Escal. Rate Factor
A. Energy Costs 3.0% 24.165 143,888 3,477,087B. Water Costs 3.0% 24.165 10,443 252,358C. Carbon OffsetD.E.F.G.Total Annual Costs $154,331 $3,729,445
Total Life Cycle Costs (Present Worth) $30,766,617 $32,091,430Life Cycle Cost PW Difference ($1,324,813)Discounted Payback (Living Building vs. Baseline) 22.1Total Life Cycle Costs - Annualized Per Year: $1,888,810 Per Year: $1,970,142
INIT
IAL
/CO
LLAT
ERAL
CO
STS
REP
LAC
EMEN
T / S
ALVA
GE
CO
STS
ANN
UAL
CO
STS
LIFE
CYC
LE
CO
STS
Top Related