


Languages
Pages
Legal


NDOT Research Report
Report No. 224-14-803
Task Order 11
Cost and Ecological Feasibility of Using Ultra-
High Performance Concrete in Highway
Bridge Piers
November 2017
Nevada Department of Transportation
1263 South Stewart Street
Carson City, NV 89712

Disclaimer
This work was sponsored by the Nevada Department of Transportation. The contents of
this report reflect the views of the authors, who are responsible for the facts and the
accuracy of the data presented herein. The contents do not necessarily reflect the official
views or policies of the State of Nevada at the time of publication. This report does not
constitute a standard, specification, or regulation.
i
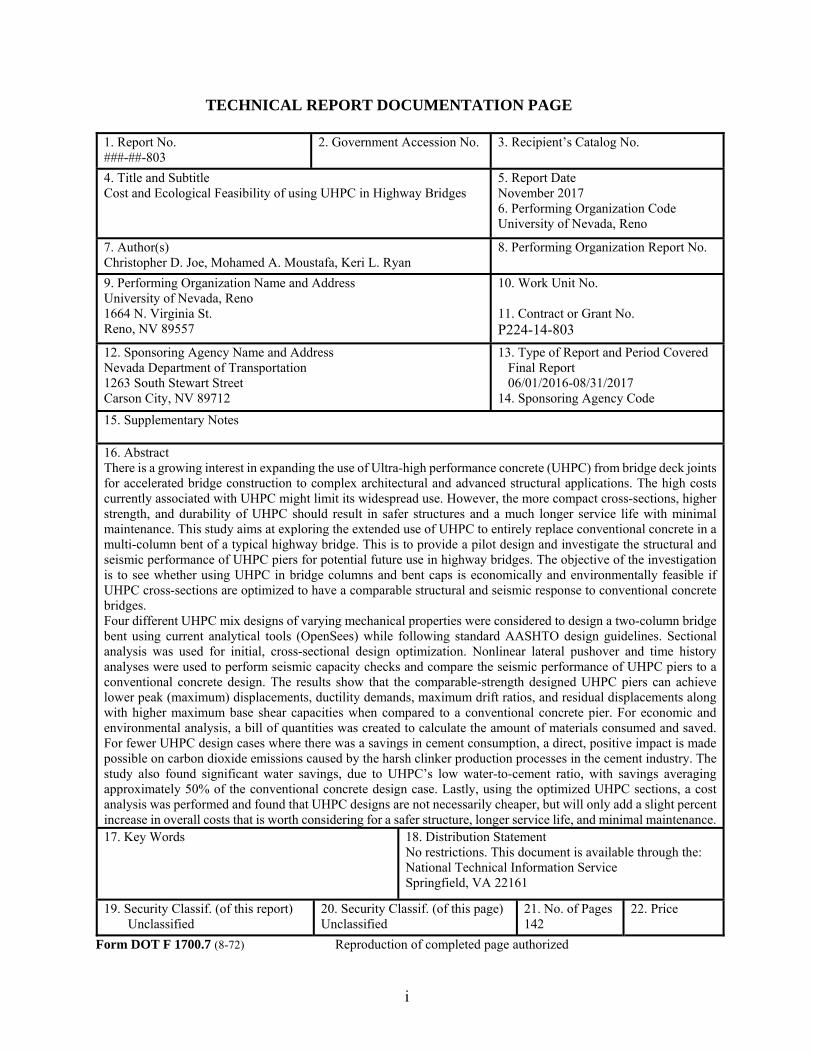
TECHNICAL REPORT DOCUMENTATION PAGE
1. Report No. ###-##-803
2. Government Accession No.
3. Recipient’s Catalog No.
4. Title and Subtitle Cost and Ecological Feasibility of using UHPC in Highway Bridges
5. Report Date November 2017 6. Performing Organization Code University of Nevada, Reno
7. Author(s) Christopher D. Joe, Mohamed A. Moustafa, Keri L. Ryan
8. Performing Organization Report No.
9. Performing Organization Name and Address University of Nevada, Reno 1664 N. Virginia St. Reno, NV 89557
10. Work Unit No. 11. Contract or Grant No. P224-14-803
12. Sponsoring Agency Name and Address Nevada Department of Transportation 1263 South Stewart Street Carson City, NV 89712
13. Type of Report and Period Covered Final Report 06/01/2016-08/31/2017 14. Sponsoring Agency Code
15. Supplementary Notes 16. Abstract There is a growing interest in expanding the use of Ultra-high performance concrete (UHPC) from bridge deck joints for accelerated bridge construction to complex architectural and advanced structural applications. The high costs currently associated with UHPC might limit its widespread use. However, the more compact cross-sections, higher strength, and durability of UHPC should result in safer structures and a much longer service life with minimal maintenance. This study aims at exploring the extended use of UHPC to entirely replace conventional concrete in a multi-column bent of a typical highway bridge. This is to provide a pilot design and investigate the structural and seismic performance of UHPC piers for potential future use in highway bridges. The objective of the investigation is to see whether using UHPC in bridge columns and bent caps is economically and environmentally feasible if UHPC cross-sections are optimized to have a comparable structural and seismic response to conventional concrete bridges. Four different UHPC mix designs of varying mechanical properties were considered to design a two-column bridge bent using current analytical tools (OpenSees) while following standard AASHTO design guidelines. Sectional analysis was used for initial, cross-sectional design optimization. Nonlinear lateral pushover and time history analyses were used to perform seismic capacity checks and compare the seismic performance of UHPC piers to a conventional concrete design. The results show that the comparable-strength designed UHPC piers can achieve lower peak (maximum) displacements, ductility demands, maximum drift ratios, and residual displacements along with higher maximum base shear capacities when compared to a conventional concrete pier. For economic and environmental analysis, a bill of quantities was created to calculate the amount of materials consumed and saved. For fewer UHPC design cases where there was a savings in cement consumption, a direct, positive impact is made possible on carbon dioxide emissions caused by the harsh clinker production processes in the cement industry. The study also found significant water savings, due to UHPC’s low water-to-cement ratio, with savings averaging approximately 50% of the conventional concrete design case. Lastly, using the optimized UHPC sections, a cost analysis was performed and found that UHPC designs are not necessarily cheaper, but will only add a slight percent increase in overall costs that is worth considering for a safer structure, longer service life, and minimal maintenance. 17. Key Words
18. Distribution Statement No restrictions. This document is available through the: National Technical Information Service Springfield, VA 22161
19. Security Classif. (of this report) Unclassified
20. Security Classif. (of this page) Unclassified
21. No. of Pages 142
22. Price
Form DOT F 1700.7 (8-72) Reproduction of completed page authorized

University of Nevada, Reno College of Engineering
Department of Civil and Environmental Engineering
Final Report
COST AND ECOLOGICAL FEASIBILITY OF USING ULTRA-HIGH PERFORMANCE CONCRETE IN HIGHWAY BRIDGE PIERS
Christopher D. Joe Mohamed A. Moustafa
Keri L. Ryan
Funded by:
November 2017

ii
ABSTRACT
There is a growing interest in expanding the use of Ultra-high performance concrete (UHPC) from
bridge deck joints for accelerated bridge construction to complex architectural and advanced
structural applications. The high costs currently associated with UHPC might limit its widespread
use. However, the more compact cross-sections, higher strength, and durability of UHPC should
result in safer structures and a much longer service life with minimal maintenance. This study aims
at exploring the extended use of UHPC to entirely replace conventional concrete in a multi-column
bent of a typical highway bridge. This is to provide a pilot design and investigate the structural
and seismic performance of UHPC piers for potential future use in highway bridges. The objective
of the investigation is to see whether using UHPC in bridge columns and bent caps is economically
and environmentally feasible if UHPC cross-sections are optimized to have a comparable
structural and seismic response to conventional concrete bridges.
Four different UHPC mix designs of varying mechanical properties were considered to design a
two-column bridge bent using current analytical tools (OpenSees) while following standard
AASHTO design guidelines. Sectional analysis was used for initial, cross-sectional design
optimization. Nonlinear lateral pushover and time history analyses were used to perform seismic
capacity checks and compare the seismic performance of UHPC piers to a conventional concrete
design. The results show that the comparable-strength designed UHPC piers can achieve lower
peak (maximum) displacements, ductility demands, maximum drift ratios, and residual
displacements along with higher maximum base shear capacities when compared to a conventional
concrete pier. For economic and environmental analysis, a bill of quantities was created to
calculate the amount of materials consumed and saved. For fewer UHPC design cases where there
was a savings in cement consumption, a direct, positive impact is made possible on carbon dioxide
emissions caused by the harsh clinker production processes in the cement industry. The study also
found significant water savings, due to UHPC’s low water-to-cement ratio, with savings averaging
approximately 50% of the conventional concrete design case. Lastly, using the optimized UHPC
sections, a cost analysis was performed and found that UHPC designs are not necessarily cheaper,
but will only add a slight percent increase in overall costs that is worth considering for a safer
structure, longer service life, and minimal maintenance.

iii
Table of Contents
ABSTRACT .................................................................................................................................. II
TABLE OF CONTENTS ........................................................................................................... III
LIST OF TABLES ........................................................................................................................ V
LIST OF FIGURES ...................................................................................................................VII
1 INTRODUCTION..............................................................................................................1
1.1 Motivation ................................................................................................................1
1.2 Problem Statement and Objectives ..........................................................................2
1.3 Methodology ............................................................................................................2
1.4 Organization of REPORT ........................................................................................4
2 LITERATURE REVIEW .................................................................................................5
2.1 Innovative Materials ................................................................................................5
2.2 Ultra-High Performance Concrete ...........................................................................7
2.3 Life Cycle Assessment ...........................................................................................23
2.4 Cost Assessment ....................................................................................................25
3 MIX DESIGN ANALYSIS ..............................................................................................26
3.1 Effects of Cement Content .....................................................................................26
3.2 Effects of Silica Fume ............................................................................................28
3.3 Effects of W/C Ratio ..............................................................................................30
3.4 Effects of Steel Fibers ............................................................................................33
3.5 Effects of Heat Curing (Water) ..............................................................................34
3.6 Effects of Heat Curing (Steam) ..............................................................................35
3.7 Modulus of Elasticity .............................................................................................39
3.8 Tensile Strength .....................................................................................................43
4 DESIGN OF UHPC PIERS USING COMPUTATIONAL METHODS ....................45
4.1 Prototype Bridge ....................................................................................................45
4.2 Computational Modeling .......................................................................................46
4.3 UHPC Cross-Sectional Analysis............................................................................50
5 SEISMIC ANALYSIS OF UHPC SUBSTRUCTURE .................................................59
5.1 Design Philosophy of Bridges ...............................................................................59
5.2 Nonlinear Pushover Analysis .................................................................................60
5.3 Nonlinear Time History Analysis ..........................................................................62

iv
6 COST ANALYSIS ...........................................................................................................89
6.1 Bills of Quantities ..................................................................................................89
6.2 Monetary cost estimates .........................................................................................94
7 ECOLOGICAL ASSESSMENT...................................................................................100
7.1 Energy Consumption and Global Warming Potential .........................................100
7.2 Water Savings TO COMBAT DROUGHT CONCERNS ...................................108
8 SUMMARY AND CONCLUSIONS ............................................................................110
REFERENCES ...........................................................................................................................113
APPENDIX A HIGH VOLUME FLY ASH CONCRETE ....................................................118
A.1 Definition ..................................................................................................................118
A.2 Mix Design ................................................................................................................122
A.3 Curing Methods.........................................................................................................124
A.4 Mechanical Properties ...............................................................................................124
A.5 Applications ..............................................................................................................126
APPENDIX B UHPC MIX DESIGNS AND MECHANICAL PROPERTIES ....................129
v
List of Tables
Table 2-1 Chronological Advances in Concrete and Fibers (Naaman et al., 2012) ....................... 8
Table 2-2 UHPC Mix Designs from Various Sources .................................................................. 10
Table 2-3 Chemical Composition of Steel Fibers Used in UHPC (FHWA 2006) ....................... 12
Table 2-4 UHPC vs. NSC Equations (FHWA, 2014) ................................................................... 14
Table 2-5 Mechanical Properties of UHPC Mix Designs from Various Sources......................... 15
Table 2-6 Compressive vs. Tensile Strength of UHPC ............................................................... 17
Table 2-7 Cost comparison between NSC, UHPC, and steel (Voort et al., 2008) ....................... 25
Table 3-1 Mix Designs Utilized by Talebinejad et al. (2004) ...................................................... 29
Table 3-2 Summary of f’c28 versus [1/(W/C)] best fit equations .................................................. 31
Table 3-3 Curing Methods Utilized by Talebinejad et al. (2004) ................................................. 34
Table 3-4 Variation of UHPC Highest Compressive Strength Obtained for Different Curing Methods Utilized by Talebinejad et al. (2004) ............................................................................. 35
Table 3-5 Mix Design Utilized by Graybeal et al. (2003) ............................................................ 35
Table 3-6 Average Compressive Strengths for Varying Curing Methods by ............................... 36
Table 3-7 Cylinder Direction Tension Testing Results Under Various Curing Methods (Graybeal et al., 2003) ................................................................................................................................... 39
Table 3-8 Comparison of Actual Ec vs. Theoretical Ec ................................................................. 41
Table 3-9 Comparison of Actual f’ct vs. theoretical f’ct from Graybeal (2013) ............................ 43
Table 4-1 Caltrans Academy Bridge (prototype) specifications ................................................... 46
Table 4-2 Original Column Design for Bent 2 ............................................................................. 46
Table 4-3 Summary of the Mechanical Properties of the UHPC Considered in this Study ......... 46
Table 4-4 Sectional Analysis Results Using Conventional Concrete ........................................... 51
Table 4-5 Optimized Concrete02 Column Design and Section Analysis Results ........................ 53
Table 4-6 Optimized Concrete04 Column Design and Section Analysis Results ........................ 55
Table 4-7 Optimized Concrete02 Bent Cap Design and Section Analysis Results ...................... 57
Table 4-8 Optimized Concrete04 Bent Cap Design and Section Analysis Results ...................... 58
Table 5-1 Final cross-sections and OpenSees pushover results using Concrete02 (Ast≅3.0-3.5%)....................................................................................................................................................... 61
Table 5-2 Selected Ground Motion Records for NTHAs ............................................................. 63
Table 5-3 Summary of NTHA Maximum Displacements (in.) .................................................... 65
Table 5-4 Summary of NTHA Ductility Demands ....................................................................... 65
Table 5-5 Summary of NTHA Maximum Drift Ratios ................................................................ 65
Table 5-6 Summary of NTHA Residual Displacements (in.) ....................................................... 66
Table 5-7 Summary of NTHA Maximum Base Shears (kip) ....................................................... 66
Table 6-1 Total Concrete and Steel Volumes for Concrete02-Based Designs ............................. 90

vi
Table 6-2 Total Concrete and Steel Volumes for Concrete04-Based Designs ............................. 91
Table 6-3 Total Material Consumption for Concrete02-Based Designs ...................................... 92
Table 6-4 Total Material Consumption for Concrete04-Based Designs ...................................... 93
Table 6-5 Cost of Optimized Concrete02-Based Pier Design ...................................................... 96
Table 6-6 Cost of Optimized Concrete04-Based Pier Design ...................................................... 98
Table 7-1 Fuel and Electricity Input by Cement Process Type (Portland Cement Association, 2006) ........................................................................................................................................... 101
Table 7-2 Energy Input by Cement Process Type (Portland Cement Association, 2006) .......... 101
Table 7-3 Pyroprocess Emissions from Fuel Combustion and Calcination (Portland Cement Association, 2006) ...................................................................................................................... 102
Table 7-4 Total Emissions to the Air (Portland Cement Association, 2006) ............................. 103
Table 7-5 Unit CO2 Emissions for Clinker and Various Cement Products (Feiz et al., 2015) ... 104
Table 7-6 Life Cycle of Clinker in the Kollenbach Plant (Feiz et al., 2015) .............................. 104
Table 7-7 Embodied Carbon Dioxide Metrics per Material (Purnell et al., 2012) ..................... 105
Table 7-8 Embodied Carbon Dioxide for Concrete02-Based Designs ....................................... 106
Table 7-9 Embodied Carbon Dioxide for Concrete04-Based Designs ....................................... 107
Table 7-10 Percent Difference of Total eCO2 of Conventional Concrete Design with Total eCO2 of UHPC...................................................................................................................................... 108
Table 7-11 Total Water Consumption and Savings for Concrete02-Based Designs .................. 109
Table 7-12 Total Water Consumption and Savings for Concrete04-Based Designs .................. 109

vii
List of Figures
Figure 2.1 Scanning electron microscopic image of cast UHPC at 28 days (Wiss, Janney, and Elstner Associates, 2011). ............................................................................................................... 7
Figure 2.2 Tensile behavior of FRC and UHPC (Naaman, 2002). ............................................... 18
Figure 2.3 Environmental impact assessment of the production (left) and the percent contribution of each material (right) used in the Sherbrooke Pedestrian Bridge (Stengel et al., 2009). ........... 24
Figure 2.4 Environmental impact assessment of the production (left) and the percent contribution of each material (right) used in the Gärtnerplatz Bridge (Stengel et al., 2009). ........................... 24
Figure 2.5 Environmental impact assessment of the production (left) and the percent contribution of each material (right) used in the Mars Hill Bridge (Stengel et al., 2009). ............................... 24
Figure 3.1 UHPC f'c at 28 days versus cement content. ............................................................... 27
Figure 3.2 Temperature versus time with and without accelerator (Graybeal et al., 2003). ......... 27
Figure 3.3 Temperature vs. time from casting through steam curing (Graybeal et al., 2003). ..... 27
Figure 3.4 CO2 produced versus UHPC compressive strength. .................................................... 28
Figure 3.5 f'c at 28 days versus silica fume content (Talebinejad et al., 2004). ........................... 30
Figure 3.6 f'c28 vs. W/C ratio for different UHPC mixes. ............................................................ 31
Figure 3.7 f'c28 vs. [1/(W/C)] with a linear best fit. ....................................................................... 32
Figure 3.8 f'c28 vs. [1/(W/C)] with an exponential best fit. ........................................................... 32
Figure 3.9 f'c28 vs. [1/(W/C)] with a 2nd degree polynomial best fit. ............................................ 33
Figure 3.10 Failure modes of UHPC test cylinders from split cylinder tests (Khayat et al., 2014)........................................................................................................................................................ 34
Figure 3.11 Tensile cracking results for mortar briquette tension tests ........................................ 37
Figure 3.12 Load-displacement response for steam cured mortar specimens .............................. 37
Figure 3.13 Tensile Cracking Results for Split Cylinder Tests (Graybeal et al., 2003). .............. 38
Figure 3.14 Load Displacement Response for Steam Cured, Split Cylinder Test Specimens (Graybeal et al., 2003). ................................................................................................................. 38
Figure 3.15 Theoretical E (from Equations 3-1, 3-2, and 3-3) vs. actual E from experimental tests. .............................................................................................................................................. 40
Figure 3.16 Modulus of Elasticity vs. (f'c28)^0.5 .......................................................................... 42
Figure 3.17 Modulus of Elasticity vs. (f'c28/10)(1/3) ...................................................................... 42
Figure 4.1 Typical Stress-Strain Relationship for Concrete01 (OpenSees Command Manual, 2013). ............................................................................................................................................ 49
Figure 4.2 Typical Stress-Strain Relationship for Concrete02 (OpenSees Command Manual, 2013). ............................................................................................................................................ 49
Figure 4.3 Moment-curvature results for XTRACT and OpenSees for the original conventional concrete design.............................................................................................................................. 51

viii
Figure 4.4 Concrete02-Based Moment Curvature Relationships for all UHPC Cases Along with Different Longitudinal Steel Ratios: (a) Ast≅1.5% (b) Ast≅2.0-2.5% (c) Ast≅3.0-3.5% (d) Ast≅5.0-6.0%. ............................................................................................................................... 54
Figure 4.5 Concrete04-Based Moment Curvature Relationships for all UHPC Cases Along with Different Longitudinal Steel Ratios: (a) Ast≅1.5% (b) Ast≅2.0-2.5% (c) Ast≅3.0-3.5% (d) Ast≅5.0-6.0%. ............................................................................................................................... 56
Figure 5.1 Pushover curve for NSC and UHPC bents with column reinforcement Ast ≅ 3.0-3.5%........................................................................................................................................................ 61
Figure 5.2 Sample moment-curvature relationship for UHPC 3 bent columns (Ast ≅3.0-3.5%) as obtained from the OpenSees pushover and sectional analysis using Concrete02. ....................... 62
Figure 5.3 Sample moment-curvature relationship for UHPC 3 bent cap beam as obtained from the OpenSees pushover analysis using Concrete02. ..................................................................... 62
Figure 5.4 Response spectra of the selected records and Caltrans design spectrum (5% damping)........................................................................................................................................................ 63
Figure 5.5 Excerpt from Caltrans SDC (2013) specifying limits of the target displacement ductility demands with the considered component type identified. .............................................. 64
Figure 5.6 Displacement history for RSN 6 (Design Level) for (a) UHPC 1, (b) UHPC 2, (c) UHPC 3, and (d) UHPC 4 ............................................................................................................. 67
Figure 5.7 Displacement history for RSN 68 (Design Level) for (a) UHPC 1, (b) UHPC 2, (c) UHPC 3, and (d) UHPC 4 ............................................................................................................. 68
Figure 5.8 Displacement history for RSN 77 (Design Level) for (a) UHPC 1, (b) UHPC 2, (c) UHPC 3, and (d) UHPC 4 ............................................................................................................. 69
Figure 5.9 Displacement history for RSN9 6 (Design Level) for (a) UHPC 1, (b) UHPC 2, (c) UHPC 3, and (d) UHPC 4. ............................................................................................................ 70
Figure 5.10 Force-displacement (hysteresis) relationship for (a) UHPC 1, (b) UHPC 2, (c) UHPC 3, and (d) UHPC 4 piers under RSN 6 (Design Level) ground motion. ....................................... 71
Figure 5.11 Force-displacement (hysteresis) relationship for (a) UHPC 1, (b) UHPC 2, (c) UHPC 3, and (d) UHPC 4 piers under RSN 68 (Design Level) ground motion. ..................................... 72
Figure 5.12 Force-displacement (hysteresis) relationship for (a) UHPC 1, (b) UHPC 2, (c) UHPC 3, and (d) UHPC 4 piers under RSN 77 (Design Level) ground motion. ..................................... 73
Figure 5.13 Force-displacement (hysteresis) relationship for (a) UHPC 1, (b) UHPC 2, (c) UHPC 3, and (d) UHPC 4 piers under RSN 96 (Design Level) ground motion. ..................................... 74
Figure 5.14 Moment-curvature response of the two pier columns for RSN 6 (Design Level) using (a) UHPC 1, (b) UHPC 2, (c) UHPC 3, and (d) UHPC 4. ............................................................ 76
Figure 5.15 Sample moment-curvature response of the bent cap beam under RSN 6 (Design Level) for both conventional concrete and UHPC 3 bridge piers. ................................................ 77
Figure 5.16 Maximum displacements for each ground motion case at the Design Level. ........... 77
Figure 5.17 Residual displacements for each ground motion case at the Design Level. .............. 78
Figure 5.18 Maximum base shear for each ground motion case at the Design Level. ................. 78
Figure 5.19 Displacement history for RSN 6 (MCE) for (a) UHPC 1, (b) UHPC 2, (c) UHPC 3, and (d) UHPC 4. ........................................................................................................................... 79

ix
Figure 5.20 Displacement history for RSN 68 (MCE) for (a) UHPC 1, (b) UHPC 2, (c) UHPC 3, and (d) UHPC 4. ........................................................................................................................... 80
Figure 5.21 Displacement history for RSN 77 (MCE) for (a) UHPC 1, (b) UHPC 2, (c) UHPC 3, and (d) UHPC 4. ........................................................................................................................... 81
Figure 5.22 Displacement history for RSN 96 (MCE) for (a) UHPC 1, (b) UHPC 2, (c) UHPC 3, and (d) UHPC 4. ........................................................................................................................... 82
Figure 5.23 Force-displacement (hysteresis) relationship for (a) UHPC 1, (b) UHPC 2, (c) UHPC 3, and (d) UHPC 4 piers under RSN 6 (MCE level) ground motion. ........................................... 83
Figure 5.24 Force-displacement (hysteresis) relationship for (a) UHPC 1, (b) UHPC 2, (c) UHPC 3, and (d) UHPC 4 piers under RSN 68 (MCE level) ground motion. ......................................... 84
Figure 5.25 Force-displacement (hysteresis) relationship for (a) UHPC 1, (b) UHPC 2, (c) UHPC 3, and (d) UHPC 4 piers under RSN 77 (MCE level) ground motion. ......................................... 85
Figure 5.26 Force-displacement (hysteresis) relationship for (a) UHPC 1, (b) UHPC 2, (c) UHPC 3, and (d) UHPC 4 piers under RSN 96 (MCE level) ground motion. ......................................... 86
Figure 5.27 Moment-curvature response of the two pier columns for RSN 6 (MCE) using (a) UHPC 1, (b) UHPC 2, (c) UHPC 3, and (d) UHPC 4. ................................................................. 87
Figure 5.28 Maximum displacements for each ground motion at the MCE level. ....................... 88
Figure 5.29 Residual displacements for each ground motion at the MCE level. .......................... 88
Figure 5.30 Maximum base shear for each ground motion at the MCE level. ............................. 88
1
1 Introduction
Over the past century, building materials and construction methods have evolved immensely
opening doors to new design potentials. The availability of new research and testing methods have
allowed for many new practical structural and architectural applications of concrete. Ultra-high
performance concrete (UHPC) is an advanced concrete making quick strides in the industry due
to its high strength, exceptional durability, and ductile behavior. Unfortunately, applications of
UHPC have been limited and is lacking in large scale structural application or an in-depth
ecological assessment.
1.1 MOTIVATION
As of today, UHPC is still an expensive product in North America due to the limited number of
UHPC manufacturers and minute amount of actual industry application. As more research is
performed on UHPC at a larger scale, more engineering and architectural firms will gain interest
and confidence in utilizing UHPC for their projects. Theoretically, with more interests and
applications of UHPC, more UHPC manufacturers and vendors will become available. This will
eventually lead to reducing UHPC material and production costs for different manufacturers to
remain competitive in the industry. The motivation of this study is to demonstrate that UHPC can
generate smaller structural cross sections (e.g. bridge columns and bent caps), and in turn, reduce
the footprint of the bridge. Smaller columns can make more room for additional lanes or shoulder
space for traffic below the bridge and ease the constructability of the bridge itself. Due to the nature
of cementitious materials in general, and UHPC in particular, as smaller cross sections are
achieved, less cement, water, and steel can be consumed, which makes UHPC a potentially
environmental-friendly material. Drought stricken states such as California, Nevada, and Texas
will benefit immensely from the reduced water consumption. The carbon footprint of UHPC
structural members can be reduced if overall less cement is consumed. From another structural
perspective, structures with less materials consumed and lighter mass could have a favorable
seismic performance in earthquake prone zones such as California. Thus, expanding the use of
UHPC to bridge structural members can enhance its structural behavior and durability, minimize
maintenance throughout the lifespan of the bridge, and minimize negative ecological effects.

2
1.2 PROBLEM STATEMENT AND OBJECTIVES
Bridge piers consist of large volumes of concrete and reinforcing steel. Naturally, where concrete
is used, cement, water, and steel is consumed. The cement production process consumes vast
amounts of energy and fuel and creates large quantities of carbon dioxide gases. UHPC is an
advanced material with exceptional mechanical properties and very low water-to-cement ratios.
Although UHPC used more cement per cubic yard than conventional concrete, it requires smaller
cross-sections and overall less quantities, which might require overall less cement as well. A big
drawback of expanding the use of UHPC at larger scales is the high UHPC per-cubic-yard material
cost, which can be 15 or 20 times higher than conventional concrete. Thus, the problem statement
of this study is assessing whether using UHPC in bridge piers is economically and environmentally
feasible if UHPC cross-sections are optimized to have a comparable structural and seismic
response to conventional concrete bridges.
The overall goal of this report is to study the feasibility and effects of UHPC as an alternative
material to conventional concrete for a substructure of a typical California highway bridge. The
specific objectives are: (1) conduct a literature review of available UHPC mixes and analyze such
mixes to select four different mixes to use for this study; (2) optimize a prototype bridge pier
design using the selected different UHPC mixes and using different reinforcement ratios; (3) check
and compare the structural and seismic performance of the different UHPC bridge piers against a
conventional concrete pier; (4) compile bills of quantities for the UHPC and conventional concrete
piers with focus on environmentally sensitive components such as cement, water, and
reinforcement; (5) carry out a monetary cost analysis and environmental assessment of the
different UHPC piers as compared to the conventional concrete case.
1.3 METHODOLOGY
To achieve the study objectives listed above, an extensive computational framework is used. Four
UHPC mix designs are selected from the literature and utilized to design a full prototype bridge
pier, which is commonly referred to as a bridge bent. The prototype bridge used in this study is a
typical three-span California highway bridge with a prestressed reinforced concrete box-girder
superstructure and two bents. Each bent consists of two columns and an integral bent cap beam
3
that is monolithically attached to the box-girder superstructure. The conventional concrete and
UHPC piers are designed in accordance to the California Department of Transportation (Caltrans)
latest Seismic Design Criteria (SDC 1.7, 2013) and AASHTO LRFD Bridge Design Specifications
(2012).
Four different UHPC mixes with varying mechanical strength are considered along with four
different column reinforcement ratios to optimize the UHPC cross-sections. Existing
computational tools are utilized to do sectional analysis to estimate the flexural moment capacity
and optimize the design of UHPC cross-sections. The improved mechanical properties of UHPC
are expected to result in smaller column and bent cap beam cross-sections. To verify that the
compact UHPC sections do not compromise the bridge structural or seismic performance, detailed
nonlinear pushover and time history analyses are conducted for the conventional concrete and
different UHPC bridge piers using the finite element platform OpenSees (Open System for
Earthquake Engineering Simulation). Readily available concrete constitutive models in OpenSees,
are altered to approximately represent the UHPC behavior.
After the UHPC pier cross-sections are optimized and satisfactory seismic performance is
verified, bills of quantities are compiled for the full conventional and UHPC bridge piers. The
estimated quantities are used along with the different mix designs and ingredients break down to
carry out a cost analysis and environmental (ecological) impact assessment. The cost study uses
different estimates for unit UHPC material costs to compare an estimated overall construction cost
for the prototype bridge with conventional concrete and UHPC piers. For the environmental impact
assessment, this study estimates and compares carbon dioxide (CO2) emissions and energy
consumption associated with consumed cement and reinforcement in the different conventional
and UHPC bridge piers. Another important environmental metric that is considered here is the
potential savings in water consumption when using UHPC as a result of its low water-to-cement
ratio. The seismic analysis along with the cost and ecological analyses considered in this study can
then demonstrate whether UHPC has potential structural and/or ecological benefits as compared
to conventional concrete.

4
1.4 ORGANIZATION OF REPORT
This report is divided into eight chapters and two appendices. The first chapter is an introduction
of the study objectives and methodology. Chapter 2 presents a literature review of UHPC research
studies, available mix designs, and real life applications. Chapter 3 presents a preliminary analysis
of the different UHPC mixes mechanical properties. The sectional analysis and design
optimization of bridge piers using selected UHPC mixes is discussed in Chapter 4, while Chapter
5 focuses on the seismic pushover and time history analysis. The cost analysis and environmental
assessment of the different UHPC piers as compared to conventional concrete piers are presented
in Chapters 6 and 7, respectively. Finally, a summary of the conclusions drawn from this study
and recommendations for future work is presented in Chapter 8.
5
2 Literature Review
This chapter briefly introduces different types of advanced concrete including ultra-high
performance concrete (UHPC). Then, a more detailed discussion focuses on UHPC including
material and mechanical properties, mix designs, architectural applications, structural applications,
life cycle assessment, cost assessment, and global warming potential.
2.1 INNOVATIVE MATERIALS
There are many types of advanced concrete used today to conform to specific conditions such as
physical or environmental impact conditions. Some examples include: self-consolidating concrete,
pervious concrete, lightweight concrete fiber-reinforced concrete, rubberized asphalt concrete,
green concrete, UHPC, and High Volume Fly Ash (HVFA) concrete. Each of these contribute to
both an increased life cycle and/or improved global warming potential making it the ideal
alternative to normal strength concrete.
Self-Consolidating Concrete: Self-consolidating concrete (SCC) is a low viscosity, self-
compacting concrete used when mechanical consolidation is not desired or available. SCC is also
used in architectural settings when a high quality surface finish is required for complex shapes not
normally attainable with normal strength concrete. SCC pumps quickly and saves time in both
transportation and labor costs (NRMCA 2004).
Pervious Concrete: Pervious concrete is a porous, large aggregate concrete used when drainage
of water is desired. This allows runoff to be decreased significantly and filters the runoff before it
enters back into the ground water. By reducing runoff significantly, the need for retention basins
and large storm sewers are no longer required (NRMCA 2004).
Lightweight Concrete: Lightweight concrete is used to decrease the dead load of a structure,
allowing for more efficiently sized members. Lightweight concrete has a unit weight between 90
lb/ft3 and 115 lb/ft3 (compared to 150 lb/ft3 for typical conventional concrete) and provides
excellent insulation with improved fire protection. The lightness is achieved through lightweight
aggregate and increased air voids in the cement paste and should generally have a compressive
strength of 2500 psi before it is used for a structural application (NRMCA 2003).
Fiber-Reinforced Concrete: Fiber-reinforced concrete (FRC) is concrete created with thin fibers
as a substitute for reinforcing steel. Fiber materials can vary from steel, glass, natural or synthetic
6
materials such as acrylic, aramid, nylon, and polyester. FRC applications include slabs and
flooring, tunnel lining, blast resistant structures, and thin shells (Pike 2009).
Rubberized Asphalt Concrete: Rubberized asphalt concrete (RAC) is a paving material for roads
created by compacting recycled tires and asphalt. The materials are then bound together with
asphalt-rubber and terminal blends. Asphalt-rubber is “…a blend of paving grade asphalt cement,
ground recycled tire (that is, vulcanized) rubber and other additives, as needed, for use as binder
in pavement construction. The rubber shall be blended and interacted in the hot asphalt cement
sufficiently to cause swelling of the rubber particles prior to use” (ASTM D6114, 2009). Terminal
blend is another binder made of scrap tire rubber finely ground into an irregular shape (Gauff
2012).
Green Concrete: Green concrete, or Novacem Concrete, is a magnesium oxide substitute for
cement. When combined with water, the magnesium reacts to the surrounding carbon dioxide
gases creating carbonates that strengthen the cement. Carbon dioxide gases are absorbed during
mixing, which makes this a very environmental-friendly alternative. The final product is very
comparable to normal strength concrete with little to no differences in mechanical properties
(Bradley 2010). As more attention is being placed on carbon dioxide emissions and environmental-
friendly options, many companies are beginning to develop their own green cement and mixing
processes. These companies include, Celera Corporation, Lafarge, CarbonCure, and Solidia
Technologies.
Ultra-High Performance Concrete: The next sections discuss in full details the definition and
characteristics of UHPC, which is the main focus of this study.
High Volume Fly Ash Concrete (HVFA): This is a family of concrete materials where a large
portion of the cement is replaced with fly ash to minimize the negative environmental impacts
associated with cement. Thus, this type is a promising “green concrete” that has been extensively
considered in previous and ongoing studies. Due to the high potential for environmental benefits
that this type of concrete has, Appendix A of this study provides more details regarding typical
HVFA concrete mixes and different mix designs for interested readers to acquire more
information.

7
2.2 ULTRA-HIGH PERFORMANCE CONCRETE
2.2.1 Definition
UHPC is a new and commercially available concrete unique for its high strength, ductile behavior,
and long-term stability (FHWA, 2013). UHPC is a combination of portland cement, silica fume,
ground quartz, fine sand, superplasticizers (high range water reducers), steel fibers, and water
(Portland Cement Association, n.d.). Use of UHPC in some applications might reduce the need for
reinforcing steel and allows for uniquely cast shapes. While UHPC is still a fairly new material,
major advances have been made in the past five decades. Table 2-1 shows a history of advances
of the concrete matrix (binding substance) and fibers by Naaman et al. (2002). These advances
ultimately lead to the development of UHPC with its modern definition.
Because of the minute amount of water used in the mix design (UHPC features very low water-to-
cement ratios), not all cement particles are hydrated completely. These un-hydrated cement
particles will act as the aggregate in the mix design, making the method of mixing particularly
crucial (ChunPing et al., 2015). Figure 2.1 shows a scanning electron microscopic image of cast
UHPC at 28 days. The white particles labeled “A” are the un-hydrated cement particles acting as
aggregate.
Figure 2.1 Scanning electron microscopic image of cast UHPC at 28 days (Wiss, Janney, and Elstner Associates, 2011).

8
Table 2-1 Chronological Advances in Concrete and Fibers (Naaman et al., 2012)
Decade Cementitious Matrix and Concrete Fiber
1970’s
Better understanding of hydration reactions and gel structure
Better understanding of shrinkage, creek, and porosity High strength concrete reaches 7250 psi in practice Development of water reduces Advances in concrete treatment and curing conditions
Smooth steel fibers Glass fibers Some synthetic fibers
1980’s
Increased development of chemical additives such as high range water reducers
Increased utilization of fly ash, silica fume, and other mineral additives
Increased flowability Reduced water to cement ratio
Deformed steel fibers: normal and high strength
1980’s
Redefined concrete strength terminology High Strength Concrete – 9000 psi Special High Strength – 12000 psi Exotic High Strength – 17000 psi
High Performance Concrete defined: high strength concrete with improved durability properties
Low-modulus synthetic fibers Micro fibers High performance polymer
fibers
1990’s
Increased development of chemical additives such as superplasticizers and viscosity agents
Increased use of supplementary cementitious materials as cement replacement
UHPC: application of concept of high packing density, addition of fine particles, low porosity, lower water to cementitious material ratio
Self-consolidating concrete Self-compacting concrete First UHPC bridge constructed (Sherbrooke
Pedestrian Bridge – Quebec, Canada)
Twisted steel fibers introduced PVA fibers with chemical
bond to concrete Improved availability of
synthetic fibers
2000’s
Increased developments of proprietary and non-proprietary UHPC
UHPC: Improved understanding of high packing density and applications of nanotechnology concepts
UHPC made commercially available by DUCTAL® First application of UHPC waffle deck panels on a
bridge (Little Cedar Creek Bridge, Wapello County, Iowa)
First architectural application of UHPC shells for a train station canopy (Shawnessy Light Rail Transit Station – Calgary, Canada)
First field deployment of UHPC in the United States highway transportation infrastructure (FHWA, 2013)
Ultra high strength steel fibers (smooth or deformed with diameters as low as 0.005 in with strengths up to 490 ksi)
Carbon nano-tubes/fibers
2010’s Increased understanding of the cementitious matrix at
the nano-scale First ACI UHPC Committee 239 meeting.
Carbon nano-fibers and grapheme.
9
2.2.2 Mix Design
In order to identify the most efficient and eco-friendly UHPC mix design, this literature review
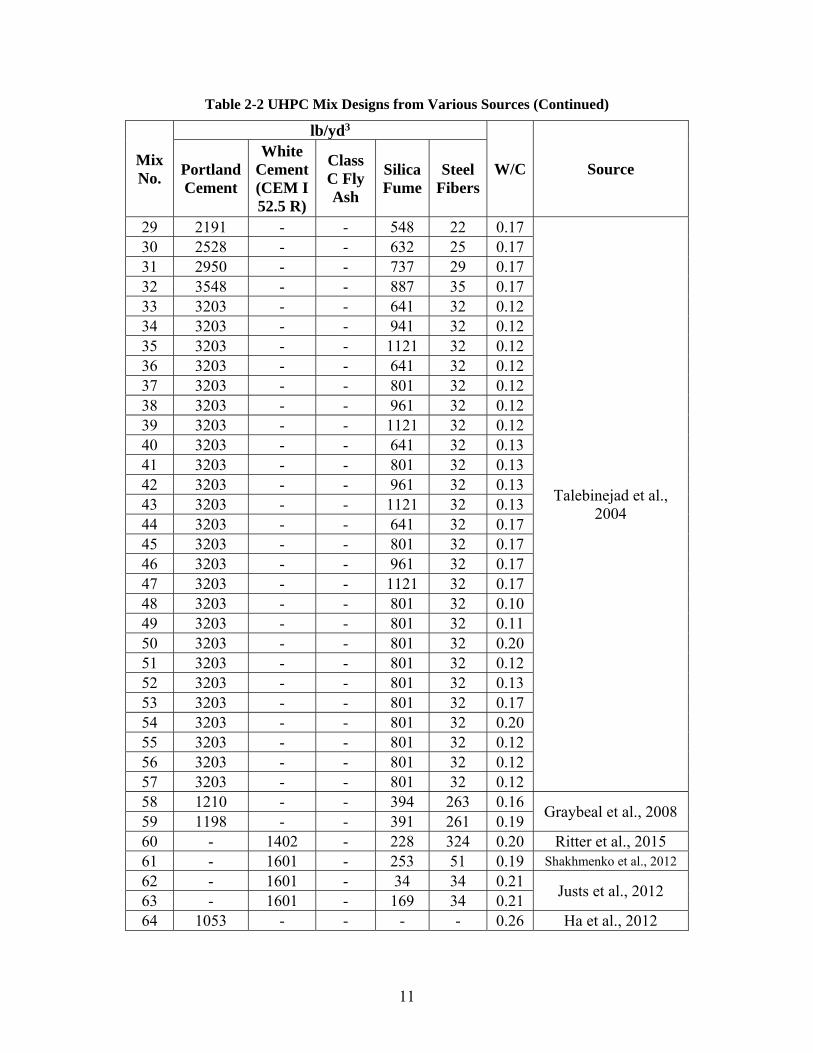
compiles over 70 different mix designs from various sources across the world. Table 2-2 shows
some components of each mix design (see Appendix B for a complete table). From the shown mix
designs, typical components of UHPC include fine sand, ground quartz, cement, and steel fibers.
According to the Federal Highway Administration (FHWA), the largest granular material used in
their test program for their UHPC mix designs is the fine sand which measures between 150-600
micrometers (µm) in diameter. The next two largest particles are the Portland cement and ground
quartz, which measure at approximately 15 µm and 10 µm, respectively. The smallest particle is
the silica fume, which is small enough to fill any voids between the cement and crushed quartz
(FHWA, 2006).
The steel fibers play a major role in UHPC’s ductile behavior in structural applications. The size
of the steel fibers is typically proportional to the size of the finer particles. For the mix and particle
sizes stated above, the steel fibers are typically 0.2 millimeters (mm) in diameter and 12.7 mm in
length (FHWA, 2006). The typical steel fibers used in the FHWA’s test program had a minimum
tensile strength of 377 kips/in2 (ksi), an average yield stress of 458 ksi, a modulus of elasticity of
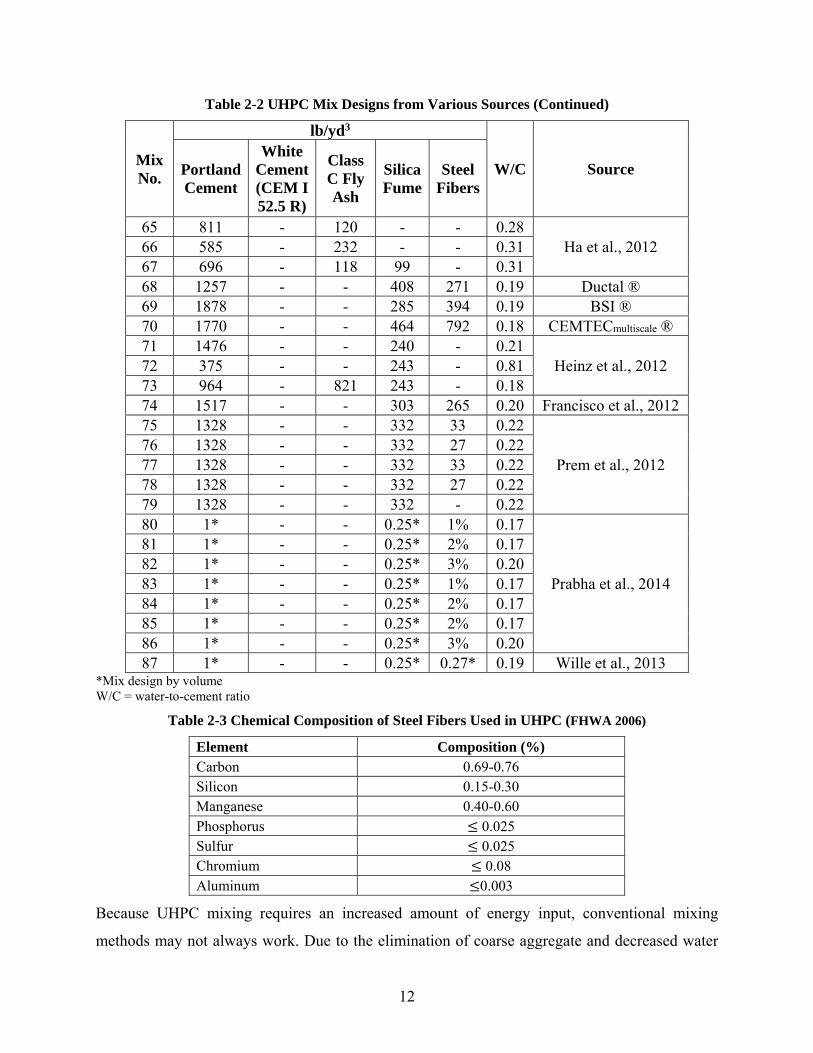
29700 ksi, and an average ultimate strength of 474 ksi (FHWA, 2006). The chemical composition
of the steel fibers is shown in Table 2-3.
Mixing times for UHPC can range from 7 to 18 minutes and can be further reduced by improving
the particle size distribution, replacing cement and quartz flower with silica fume, choosing the
right high-range water reducer for the specific cement used, and increasing mixer speeds. To
further decrease mixing times, the mixing procedures can be split into two parts, high-speed
mixing for 40 seconds and low-speed mixing for 70 seconds immediately after.

10
Table 2-2 UHPC Mix Designs from Various Sources
Mix No.
lb/yd3
W/C Source Portland Cement
White Cement (CEM I 52.5 R)
Class C Fly Ash
Silica Fume
Steel Fibers
1 1200 - - 390 263 0.15 Graybeal, 2006 2 924 - - 70 263 0.27
Khayat et al., 2014 3 1000 - - - 263 0.29 4 1118 - 619 71 263 0.15 5 819 - 937 - 263 0.17 6 - 1475 - 74 82 0.23
Yu et al., 2014 7 - 1032 - 74 82 0.33 8 - 1180 - 74 82 0.29 9 1601 - - 401 46 0.20 Yang, 2009 10 1107 - - 201 44 0.17 Hassan, 2012 11 1107 - - 201 44 0.15 Yang, 2010 12 1704 - - 98 41 0.15 Toledo Filho, 2012 13 1618 - - 405 57 0.16 Corinaldesi, 2012 14 1770 - - 464 149 0.14 Habel 2006 15 - 1229 - 209 261 0.27
Randl et al., 2014 16 - 676 553 209 261 0.27 17 - 676 - 209 261 0.50 18 - 676 - 209 261 0.50 19 1878 - - 285 394 0.19 Hajar et al., 2004 20 2191 - - 548 22 0.12
Talebinejad et al., 2004
21 2528 - - 632 25 0.12 22 2950 - - 737 29 0.12 23 3203 - - 801 32 0.12 24 3548 - - 887 35 0.12 25 2191 - - 548 22 0.13 26 2528 - - 632 25 0.13 27 2950 - - 737 29 0.13 28 3548 - - 887 35 0.13
11
Table 2-2 UHPC Mix Designs from Various Sources (Continued)
Mix No.
lb/yd3
W/C Source Portland Cement
White Cement (CEM I 52.5 R)
Class C Fly Ash
Silica Fume
Steel Fibers
29 2191 - - 548 22 0.17
Talebinejad et al., 2004
30 2528 - - 632 25 0.17 31 2950 - - 737 29 0.17 32 3548 - - 887 35 0.17 33 3203 - - 641 32 0.12 34 3203 - - 941 32 0.12 35 3203 - - 1121 32 0.12 36 3203 - - 641 32 0.12 37 3203 - - 801 32 0.12 38 3203 - - 961 32 0.12 39 3203 - - 1121 32 0.12 40 3203 - - 641 32 0.13 41 3203 - - 801 32 0.13 42 3203 - - 961 32 0.13 43 3203 - - 1121 32 0.13 44 3203 - - 641 32 0.17 45 3203 - - 801 32 0.17 46 3203 - - 961 32 0.17 47 3203 - - 1121 32 0.17 48 3203 - - 801 32 0.10 49 3203 - - 801 32 0.11 50 3203 - - 801 32 0.20 51 3203 - - 801 32 0.12 52 3203 - - 801 32 0.13 53 3203 - - 801 32 0.17 54 3203 - - 801 32 0.20 55 3203 - - 801 32 0.12 56 3203 - - 801 32 0.12 57 3203 - - 801 32 0.12 58 1210 - - 394 263 0.16
Graybeal et al., 2008 59 1198 - - 391 261 0.19 60 - 1402 - 228 324 0.20 Ritter et al., 2015 61 - 1601 - 253 51 0.19 Shakhmenko et al., 2012
62 - 1601 - 34 34 0.21 Justs et al., 2012
63 - 1601 - 169 34 0.21 64 1053 - - - - 0.26 Ha et al., 2012
12
Table 2-2 UHPC Mix Designs from Various Sources (Continued)
Mix No.
lb/yd3
W/C Source Portland Cement
White Cement (CEM I 52.5 R)
Class C Fly Ash
Silica Fume
Steel Fibers
65 811 - 120 - - 0.28 Ha et al., 2012 66 585 - 232 - - 0.31
67 696 - 118 99 - 0.31 68 1257 - - 408 271 0.19 Ductal ® 69 1878 - - 285 394 0.19 BSI ® 70 1770 - - 464 792 0.18 CEMTECmultiscale ® 71 1476 - - 240 - 0.21
Heinz et al., 2012 72 375 - - 243 - 0.81 73 964 - 821 243 - 0.18 74 1517 - - 303 265 0.20 Francisco et al., 2012 75 1328 - - 332 33 0.22
Prem et al., 2012 76 1328 - - 332 27 0.22 77 1328 - - 332 33 0.22 78 1328 - - 332 27 0.22 79 1328 - - 332 - 0.22 80 1* - - 0.25* 1% 0.17
Prabha et al., 2014
81 1* - - 0.25* 2% 0.17 82 1* - - 0.25* 3% 0.20 83 1* - - 0.25* 1% 0.17 84 1* - - 0.25* 2% 0.17 85 1* - - 0.25* 2% 0.17 86 1* - - 0.25* 3% 0.20 87 1* - - 0.25* 0.27* 0.19 Wille et al., 2013
*Mix design by volume W/C = water-to-cement ratio
Table 2-3 Chemical Composition of Steel Fibers Used in UHPC (FHWA 2006)
Element Composition (%) Carbon 0.69-0.76 Silicon 0.15-0.30 Manganese 0.40-0.60 Phosphorus 0.025 Sulfur 0.025 Chromium 0.08 Aluminum 0.003
Because UHPC mixing requires an increased amount of energy input, conventional mixing
methods may not always work. Due to the elimination of coarse aggregate and decreased water

13
content, the mixture should not overheat during the mixing process. This can be avoided if a high-
energy mixer such as a high shear mixer is used (FHWA, 2013). A high shear mixer will evenly
release water and admixtures onto the cement particles without heating the mixture through kinetic
energy produced by the mixing process. Another method used to avoid overheating the mixture is
to add water in the form of ice. While much less efficient and more time consuming, mortars,
horizontal shaft mixers, and pan mixers have also been used to mix UHPC (NPCA, 2013).
2.2.3 Curing Methods
Curing methods for UHPC vary for different circumstances and rely on two components,
temperature and moisture (FHWA, 2013). Curing UHPC in its early stages in room temperature
water leads to stronger formations of silicate hydrates. To continue this process, a high temperature
cure either through steam or another heat source is applied to accelerate the silicate hydrate
formation (Neville, 1995). Various methods of curing include steam curing at 140 oF or 194oF for
48 hours, 24 hours post-casting, and steam curing at 194 oF 15 days post-casting, and curing at
standard, controlled temperatures in a laboratory until satisfactory results are achieved. According
to Heinz et al., 2012, curing UPHC at 194 oF: “accelerates the hydration of clinker phases and the
reaction of silica fume and quartz flour completely binding portlandite while increasing the amount
of C-S-H (calcium silicate hydrate) and their chain length”. By curing UHPC with heat or steam,
there is a noticeable decrease in chloride ion penetrability, increased abrasion resistance, and a
near elimination of dry shrinkage effects (FHWA, 2013).
A study by Heinz et al. (2012) revealed that storage periods also contribute to the general strength
of UHPC in addition to temperature and time of curing methods. Specimens immediately cured
after setting for eight hours at 194 oF, achieved compressive strengths greater than 29,000 psi when
tested 30 hours post-cure. Other specimens that were 24 hours old were heat treated for eight hours
in an autoclave at 300 oF, cooled down to room temperature within 11 hours, and stored at 68 oF
and 65% relative humidity until tested. These specimens achieved compressive strengths up to
38000 psi (Heinz et al., 2012).
2.2.4 Mechanical Properties
UHPC is known for its high compressive and flexural strength. Because of the fine composition
in the mix design, the concrete is nearly impermeable and quite compact. The particularly low

14
porosity increases the uniformity of the mix design which allows the concrete to attain its extreme
properties and a more uniform stress distribution (NPCA, 2014). UHPC can achieve high
compressive strengths regardless of the addition of steel fibers as shown in Mix No. 71-73 from
Table 2-2. The addition of steel fibers simply provides additional flexural and tensile strength
(ChunPing et al., 2015).
While there are published methods of calculating estimated values of various mechanical
properties, they can vary based on different curing methods, admixtures, types of silica fume, and
steel fibers used. Reported in a study conducted by FHWA on the behavior of typical UHPC,
Graybeal (2014) found a direct relationship between UHPC’s tensile strength, compressive
strength, and modulus elasticity. These relationships are presented and discussed in more details
in the next chapter of this report. However, a quick comparison between Graybeal’s equations
(2014) and the American Concrete Institute’s (ACI) equations (ACI 318, 2011) on normal strength
concrete (NSC) are shown in Table 2-4.
Table 2-4 UHPC vs. NSC Equations (FHWA, 2014)
Mechanical Property UHPC (psi) NSC (psi) Tensile Strength, fct
For untreated UHPC 6.7 ′ 6.7 ′
(ACI 318-11 R8.6.1) Tensile Strength, fct
Depending on method of steam curing
7.8 ′
or 8.3 ′ -
Modulus of Elasticity, E For f’c values between 4000-28000 psi
46,200 ′
. 33 ′ where is the unit weight of NSC between 90-155 lb/ft3 (ACI 318-11 8.5.1)
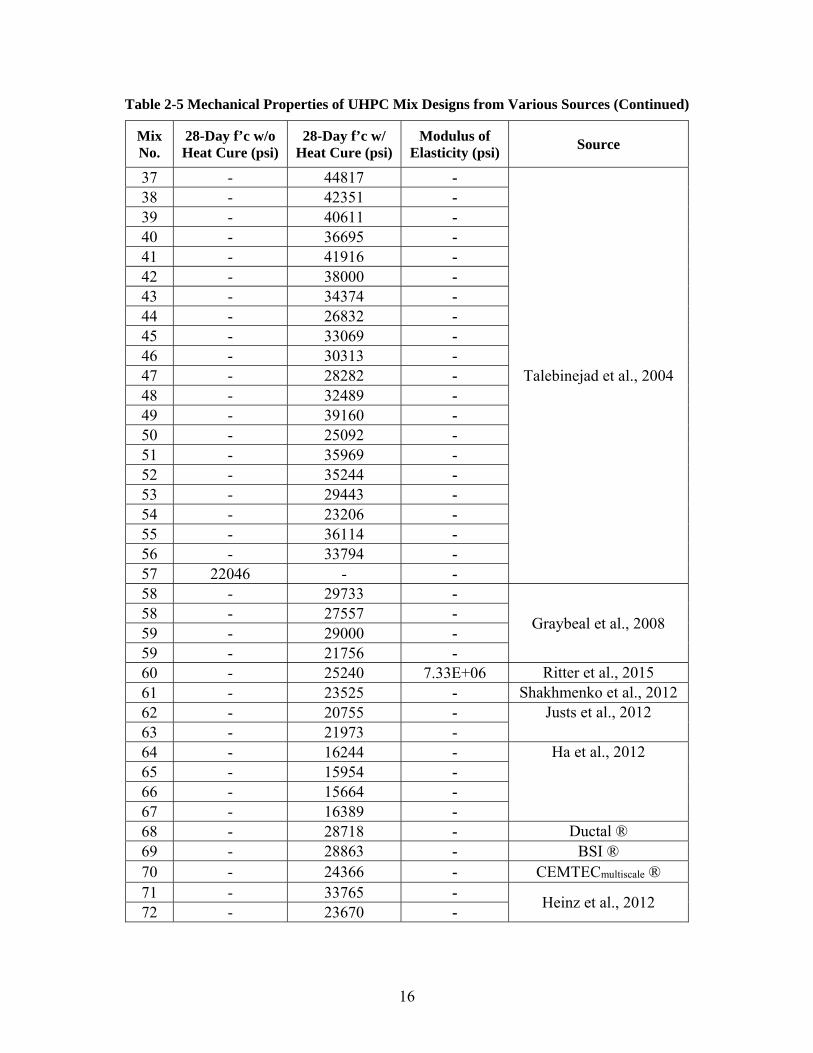
A summary of the reported mechanical proprieties (mainly 28-day compressive strength and
modulus of elasticity) for the compiled UHPC mix designs from Table 2-2 is shown in Table 2-5.
Note that because this mix design literature review compiles various mixes and its respective
mechanical properties from different published sources, some values were not reported or made
available. However, more details can be still found in Appendix B. For some of the mixes, the 28-
day tensile strength was reported as well. Table 2-6 compares the compressive and tensile strengths
for those mixes that had its mechanical strength measured in compression and tension. Because of
the use of steel fibers, higher tensile-to-compression strength ratio is obtained from UHPC as
compared to conventional or NSC. Table 2-6 shows that this ratio can reach as high as 13%.

15
Table 2-5 Mechanical Properties of UHPC Mix Designs from Various Sources
Mix No.
28-Day f’c w/o Heat Cure (psi)
28-Day f’c w/ Heat Cure (psi)
Modulus of Elasticity (psi) Source
1 17200 - 6.07E+06 Graybeal, 2006 1 28900 7.46E+06 2 18130 - 7.27E+06
Khayat et al., 2014 3 17985 - 7.18E+06 4 17985 - 7.48E+06 5 15519 - 6.64E+06 6 22626 - -
Yu et al., 2014 7 20595 - - 8 21611 - - 9 27557 - - Yang, 2009 10 21756 - - Hassan, 2012 11 17405 - - Yang, 2010 12 23206 - - Toledo Filho, 2012 13 22481 - - Corinaldesi, 2012 14 23207 - - Habel 2006 15 24091 - -
Randl et al., 2014 16 18086 - - 17 20218 - - 18 23714 - - 19 25382 - 9.28E+06 Hajar et al., 2004 20 - 37855 -
Talebinejad et al., 2004
21 - 39740 - 22 - 44527 - 23 - 47137 - 24 - 34954 - 25 - 33359 - 26 - 36985 - 27 - 42786 - 28 - 30748 - 29 - 23641 - 30 - 27122 - 31 - 33359 - 32 - 22626 - 33 - 41771 - 34 - 44672 - 35 - 42206 - 36 - 39160 -
16
Table 2-5 Mechanical Properties of UHPC Mix Designs from Various Sources (Continued)
Mix No.
28-Day f’c w/o Heat Cure (psi)
28-Day f’c w/ Heat Cure (psi)
Modulus of Elasticity (psi)
Source
37 - 44817 -
Talebinejad et al., 2004
38 - 42351 - 39 - 40611 - 40 - 36695 - 41 - 41916 - 42 - 38000 - 43 - 34374 - 44 - 26832 - 45 - 33069 - 46 - 30313 - 47 - 28282 - 48 - 32489 - 49 - 39160 - 50 - 25092 - 51 - 35969 - 52 - 35244 - 53 - 29443 - 54 - 23206 - 55 - 36114 - 56 - 33794 - 57 22046 - - 58 - 29733 -
Graybeal et al., 2008 58 - 27557 - 59 - 29000 - 59 - 21756 - 60 - 25240 7.33E+06 Ritter et al., 2015 61 - 23525 - Shakhmenko et al., 2012 62 - 20755 - Justs et al., 2012 63 - 21973 - 64 - 16244 - Ha et al., 2012 65 - 15954 - 66 - 15664 - 67 - 16389 - 68 - 28718 - Ductal ® 69 - 28863 - BSI ® 70 - 24366 - CEMTECmultiscale ® 71 - 33765 -
Heinz et al., 2012 72 - 23670 -

17
Table 2-5 Mechanical Properties of UHPC Mix Designs from Various Sources (Continued)
Mix No.
28-Day f’c w/o Heat Cure (psi)
28-Day f’c w/ Heat Cure (psi)
Modulus of Elasticity (psi)
Source
73 - 28877 - 74 - 27267 - Francisco et al., 2012 75 - 26147 5.80E+06
Prem et al., 2012 76 - 24698 5.66E+06 77 - 25919 6.38E+06 78 - 23786 5.80E+06 79 - 19145 4.64E+06 80 - 17796 5.66E+06
Prabha et al., 2014
81 - 21147 6.09E+06 82 - 23467 6.38E+06 83 - 19856 5.95E+06 84 - 24845 6.50E+06 85 - 22640 5.51E+06 86 - 22669 6.09E+06 87 - 36260 8.85E+06 Wille et al., 2013
Table 2-6 Compressive vs. Tensile Strength of UHPC
Mix No.
28-Day Compressive Strength
28-Day Tensile Strength ft/f'c Source
f’c w/o Heat Cure (psi)
f’c w/ Heat Cure (psi)
ft w/o Heat Cure (psi)
ft w/ Heat Cure (psi)
2 18130 - 2031 11.20 Khayat et al.,
2014 3 17985 - 1595 8.87 4 17985 - 1740 9.67 5 15519 - 1450 9.34 19 25382 - 1160 4.57 Hajar et al., 2004 60 - 25240 - 1160 4.60 Ritter et al., 2015 68 - 28718 - 1160 4.04 Ductal ® 69 - 28863 - 1276 4.42 BSI ® 75 - 26147 - 3452 13.20
Prem et al., 2012 76 - 24698 - 3278 13.27 77 - 25919 - 2930 11.30 78 - 23786 - 2611 10.98 79 - 19145 - 1639 8.56 87 - 36260 - 2611 7.20 Wille et al., 2013
A notable feature of UHPC tensile behavior is strain hardening. Figure 2.2 illustrates the tensile
behavior of strain-hardening UHPC and conventional fiber reinforced concrete (FRC). The UHPC
experiences three stages in the stress-strain curve. Stage I exhibits linear-elastic behavior until its
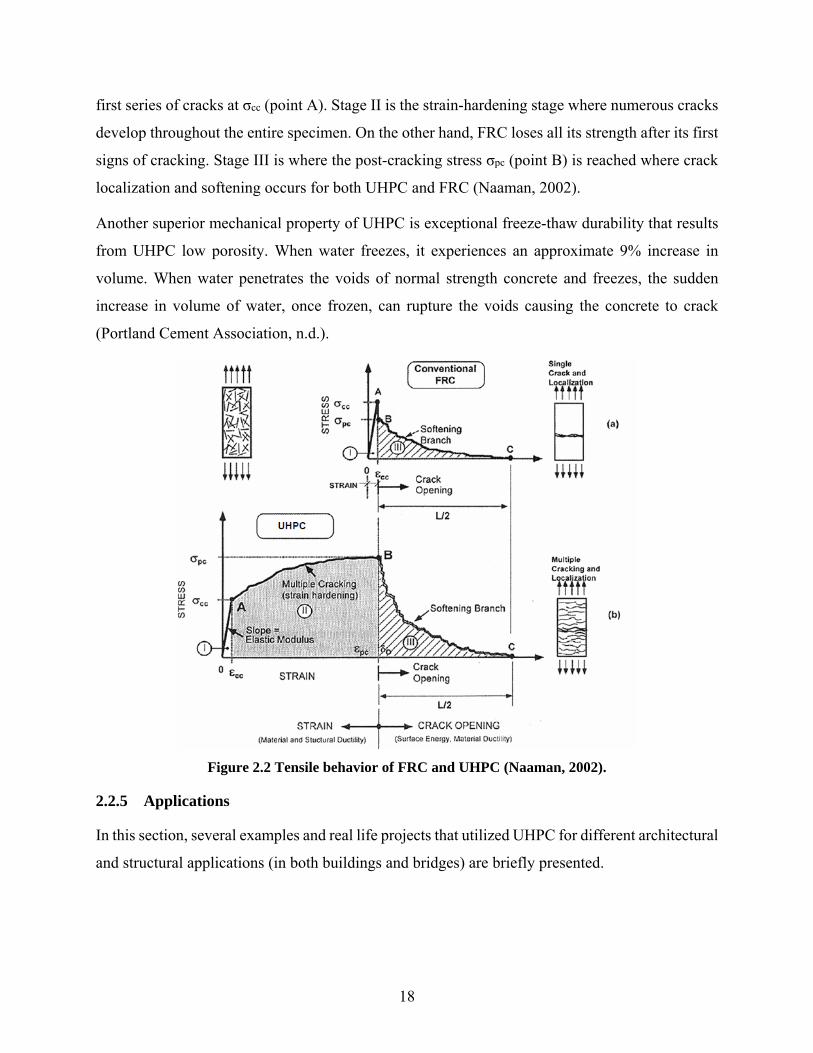
18
first series of cracks at σcc (point A). Stage II is the strain-hardening stage where numerous cracks
develop throughout the entire specimen. On the other hand, FRC loses all its strength after its first
signs of cracking. Stage III is where the post-cracking stress σpc (point B) is reached where crack
localization and softening occurs for both UHPC and FRC (Naaman, 2002).
Another superior mechanical property of UHPC is exceptional freeze-thaw durability that results
from UHPC low porosity. When water freezes, it experiences an approximate 9% increase in
volume. When water penetrates the voids of normal strength concrete and freezes, the sudden
increase in volume of water, once frozen, can rupture the voids causing the concrete to crack
(Portland Cement Association, n.d.).
Figure 2.2 Tensile behavior of FRC and UHPC (Naaman, 2002).
2.2.5 Applications
In this section, several examples and real life projects that utilized UHPC for different architectural
and structural applications (in both buildings and bridges) are briefly presented.
19
2.2.5.1 Architectural Applications
Shawnessy Light Rail Transit Station (Calgary, Canada): The Shawnessy Light Rail Transit
Station utilizes the first architectural application of UHPC. Completed in 2004, this was the first
station to utilize thin-shelled UHPC canopies on single column supports. The Shawnessy Light
Rail Transit Station has 24 thin-shelled canopies measuring 16.7 ft x 19.7 ft x 0.79 in and was cast
through an injection process into steel forms. UHPC was used for this architectural application for
its high compressive and tensile strength, ease of fabrication, and high quality surface finish (Perry
et al., 2004).
Fondation Louis Vuitton (Paris, France): Designed by Frank Gehry, the Fondation Louis
Vuitton stands tall at 150 ft and covers approximately 130,000 sq. ft. In collaboration with the
precast concrete manufacturer, Bonna Sabla, the team used Lafarge’s Ductal UHPC mix design to
fabricate and erect 16,000 exterior UHPC wall panels each measuring approximately 5 ft long, 1.3
ft high, and 1 in thick. Since each panel has its own curvature and unique geometry, they were cast
using a combination of vacuum processes and flexible molds that can take form of any 3-D
curvature. This process, RFR/teSS, was devised by Lafarge and Cogitech Design as a result of two
years of research and later patented by Lafarge in 2008. The panels are then heat cured for 20 hours
and scanned to produce a 3-D model for a quality check to ensure it is within a one millimeter
tolerance. Because of the immense number of panels, to avoid confusion during fabrication, each
panel is assigned a number and a radio frequency ID chip for tracking purposes (Ductal®
Solutions, 2011).
The Atrium (Victoria, Canada): With thermal insulation, shading from the sun, and impact
resistance in mind, the Atrium utilizes approximately 690 UHPC panels to form a complex façade
surrounding a seven story structure. Because of the tight radial curves in the façade design, a flat
panel system was originally planned. Unfortunately, this would require unwanted cuts around the
curves creating undesirable seams that were unpleasant to the eye. As a solution, Ductal was
contracted for the spandrel panel section of the curtain wall system to create all 690 panels from
three different molds. Because of UHPC’s absence of rebar, tighter radial curves were achieved
without gaps or unpleasant seams all while keeping the panels thin and lightweight. The 204,000
sq. ft structure earned a LEED Gold rating through the Canada Green Building Council for its use
of UHPC (Ductal® Solutions, 2011).

20
The Rotman School of Management Expansion (Toronto, Canada): Designed by the
architects, Kuwabara Payne McKenna Blumberg, the Rotman School of Management required a
panel design with a specific color and texture quality. To add to that, the university required a long
span façade panel that was thin, lightweight, and strong with little to no wear from weather.
Conventional materials such as stone panels had severe limitations in size and weight and
aluminum panels just simply did not fit the desired finish. UHPC was eventually selected as the
panel material because it provided a thin, monolithic-plate, slab-type design that provided the
desired color and surface finish. More than 350 precast Ductal® panels were used with sizes
ranging from 1.6 ft – 3.3 ft wide to 11.5ft – 17ft high with a thickness of 1.2 in. The structural
received a LEED Silver rating for its use of UHPC (Ductal®, n.d.).
Cap Cinéma (Rodez, France): The entrance of the multiplex cinema, Cap Cinéma, utilizes an
overhanging UHPC canopy measuring 47 ft x 57 ft x 1.6 in that can shelter up to 300 people from
various elements. Composed of 12 thin, precast UHPC panels, the uniqueness of this architectural
canopy comes from its ability to accept LED lighting within the structure. cast by Bonna Sabla,
block-outs were placed into the molds so that LED lighting systems can later be installed in the
canopy. With the use of UHPC, the color and texture of the canopy present a seamless, and
attractive appearance (Ductal®, n.d.).
Museum of European and Mediterranean Civilizations (Marseille, France): Designed by the
architect, Rudy Ricciotti, the Museum of European and Mediterranean Civilizations features some
of the most intriguing applications of UHPC. The museum is linked to the City of Marseille
through two slender concrete pathways measuring 138 ft in length and 2.2 ft in height. The museum
is also encased with a UHPC mesh that allows light to permeate through the structure as well as
the aromas of the surrounding Mediterranean Sea. 384 panels were cast for two façades and the
roof of the museum. A long 981 ft walkway suspended between the inside of the museum to the
outside was made possible with the use of UHPC (Ductal®, n.d.).
2.2.5.2 Structural Applications in Bridges
Sherbrooke Pedestrian Bridge (Quebec, Canada): Constructed in 1997, the Sherbrooke
Pedestrian Bridge was the first pedestrian/bikeway bridge to incorporate UHPC in Canada. The
Sherbrooke Pedestrian Bridge illustrates a very innovative composite use between steel and
UHPC. The bridge spans a little under 200 ft and is constructed with six 1.2 in deep precast

21
segments. An underside space truss design was also utilized with the truss members formed with
stainless steel tubes filled with tri-axially confirmed, post-tensioned UHPC (Perry et al., n.d.).
Little Cedar Creek Bridge (Wapello County, Iowa): Completed in May 2007, the Little Cedar
Creek Bridge is the first bridge to utilize UHPC waffle deck panels, girders, and field-cast joints
in North America. The 63 ft long x 32 ft wide bridge utilizes five Iowa bulb-tee precast, prestressed
concrete girders in conjunction with fourteen 8 in deep waffle slabs that are 15 ft long x 8 ft wide.
The waffle slabs are connected through short extended rebar with field-cast UHPC closures. Due
to the use of UHPC in the Iowa bulb-tee girders and panels, each girder has a reduced section size
with no non-prestressed reinforcements leading to a less invasive structure with lower applied
loads. Since each panel was installed individually, repairs are especially convenient. Lanes can be
replaced one at a time without disturbing the flow of traffic; an ideal concept for future highway
design (Moore, 2012).
Mission Bridge (British Columbia, Canada): Completed in 1973, the old Mission Bridge was
in need of seismic retrofit to account for today’s seismic standards. Original plans of compaction
piles (which was deemed too expensive) and conventional concrete jackets (which would be too
invasive) were scraped and Ductal® jacketing was eventually chosen for the piers. UHPC provides
high seismic deformation capacities making it the ideal material for this retrofit. The retrofit design
called for tapered, rectangular columns measuring 7 ft x 8.5 ft with a height of approximately 10.5
ft. Dowels one inch in diameter were installed into the existing concrete with rebar spaced at 9 in
in both directions. A strong formwork was then installed around the column and a 9 in thick UHPC
jacket was cast using a standard hopper. To avoid cold joints, Lafarge used their ready-mix
concrete plant in Abbotsford, British Columbia with two ready-mix trucks making two trips each.
The casting was completed in one day with approximately $1.5 Million Canadian Dollars saved
(Ductal®, n.d.).
Mackenzie River Twin Bridges (Ontario, Canada): Part of the TransCanada Highway
realignment, the project consisted of two, two-lane, three-span bridges spanning 591 ft over the
Mackenzie River. The bridges utilize steel plate girders of varying depths with 130 lightly
prestressed, precast concrete deck panels that run the entire length of the bridge. Each panel is
approximately 10 ft. x 48 ft. x 9 in. and is connected by Ductal® field-cast between the transverse
joints, shear pockets, and haunches of each panel. This project is currently the largest field-cast
22
Ductal® project in North America and was completed by an 18-man crew over 10 days (Ductal®,
n.d.).
Chukuni River Bridge (Ontario, Canada): The Chukuni River Bridge spans 274 ft and is
currently the longest single span bridge in Canada. The elimination of pier construction in the
water allows for a less invasive erection of the bridge ultimately leaving a smaller environmental
footprint. Constructed with four 12-ft deep steel beams and 54 precast concrete deck panels, UHPC
field-cast connections were used to connect each panel to one another with shear pockets to
connect the deck to the steel girders. UHPC field-cast connections were used because it is
significantly stronger than the precast concrete deck panel itself and has a very short bond
development length. This allows for smaller field connections which in return reduces the
manufacturing costs of the precast concrete panels (Ductal®, n.d.).
Gärtnerplatz Bridge (Kassel, Germany): The Gärtnerplatz Bridge is a 437 ft hybrid bridge
constructed for pedestrians and cyclists and was one of the first structures in Germany to utilize
UHPC. The bridge is made up of a steel and UHPC composite space frame design and consists of
UHPC precast, prestressed upper chords, tubular steel for the lower chords, and UHPC precast
prestressed bridge deck panels that span across the entire length of the bridge. The deck panels are
unusually glued to the upper chords without any mechanical connections (Stengel et al., 2009).
2.2.5.3 Structural Applications in Buildings
Haneda Airport (Tokyo, Japan): With an increasing amount of flights arriving and departing
from the Haneda Airport, a new runway was proposed to meet these demands. However, due to
the limitations of space, the runway had to be constructed into the neighboring sea stretching over
an area of 620,000 yd2 and divided into two structures. The first structure consists of 230 ft steel
pillars with special coatings submerged underwater. The second structure is a concrete slab with
an area of 230,000 yd2 attached to steel girders. Because of UHPC’s extreme resistance to salt
corrosion, it was selected as the material of choice for the concrete slabs. The final product
contained 6,139 pre-tensioned, lightweight UHPC slabs joined together to form the entire structure
(Ductal®, n.d.).
Renovation of a Pool (Amiens, France): Contracted by the City of Amiens, 15 reinforced
concrete columns surrounding an indoor swimming pool were in desperate need of repairs due to
corrosion caused by the pool’s chlorine. UHPC was selected to rebuild the columns because the
23
diffusion of chlorine ions is 100 times slower in UHPC compared to conventional concrete
(Ductal®, n.d.).
2.3 LIFE CYCLE ASSESSMENT
To help understand and quantify its environmental impacts, this section briefly discusses UHPC
contribution to the life cycle assessment of three actual bridges from a previous study. A life cycle
assessment is defined as an analysis of a structure’s environmental impact from construction to
demolition. This includes many stages before, in-between, and after the structure’s life including
raw material extraction, manufacturing, normal use, repairs, and maintenance (Environment
Protection Agency, EPA n.d.). Thorsten Stengel and Peter Schieβl (2009) performed a life cycle
assessment on the materials used on three bridges where UHPC was an essential component of the
structure. The three bridges they analyzed are the Sherbrooke Pedestrian Bridge (Quebec, Canada),
the Gärtnerplatz Bridge (Kassel, Germany), and the Mars Hill Bridge (Wapello County, Iowa).
Stengel and Schieβl (2009) measured the ecological effects of global warming (GWP100), the
depletion of the stratospheric ozone (ODP), the photo-oxidant formation (POCP), acidification
(AP), and eutrophication (NP). While UHPC is considered a sustainable product for its durability,
its cement content, unusual amount of superplasticizer, and use of micro steel fibers slightly offset
the advantages of UHPC (Stengel et al., 2009).
The three aforementioned bridges life cycle (or environmental impact) assessment is shown in
Figures 2.3, 2.4, and 2.5. The first (left hand side) part of each of Figure 2.3, 2.4, and 2.5 shows
the results of the environmental impact assessment of the production of the materials used for the
construction of the Sherbrooke Pedestrian Bridge, Gärtnerplatz Bridge, and Mars Hill Bridge,
respectively. For example, the materials used for the Sherbrooke Pedestrian Bridge produced an
environmental impact, using the metrics previously defined, of the following: GWP100: 4.45×10⁴
kg CO2 -eq, ODP: 1.85×10⁻³ kg CFC11 -eq, POCP: 21.6 kg C2H4 -eq, AP: 161.5 kg SO2 -eq, and
NP: 18.7 kg PO43 -eq. The second part (right hand side) of Figures 2.5, 2.6, and 2.7 shows the
percent contribution of each of the consumed materials to the environmental impact for the
Sherbrooke Pedestrian Bridge, Gärtnerplatz Bridge, and Mars Hill Bridge, respectively.
Stengel and Schieβl (2009) concluded that even with reduced cross-sectional areas due to UHPC’s
high load bearing capacity (which implies less materials used), many other components are energy-
intensive and are increased to guarantee its unique mechanical properties. Results show that UHPC

24
in the Sherbrooke Pedestrian Bridge contribute about 60 – 85% of the environmental impact and
44 – 74% for the Mars Hill Bridge. Accordingly, Stengel and Schieβl (2009) recommended to
keep the use of cement, superplasticizers, and steel fibers to a minimum to reduce its environmental
impact. This study conducted here and presented in this report uses the GWP environmental metric
to compare the environmental impact of UHPC bridge piers against conventional NSC piers.
Figure 2.3 Environmental impact assessment of the production (left) and the percent contribution of each material (right) used in the Sherbrooke Pedestrian Bridge (Stengel et al., 2009).
Figure 2.4 Environmental impact assessment of the production (left) and the percent contribution
of each material (right) used in the Gärtnerplatz Bridge (Stengel et al., 2009).
Figure 2.5 Environmental impact assessment of the production (left) and the percent contribution
of each material (right) used in the Mars Hill Bridge (Stengel et al., 2009).
25
2.4 COST ASSESSMENT
As monetary cost analysis is an important part of this study, this section presents a brief summary
of structural materials (including UHPC) cost comparisons over time. A comprehensive summary
is provided by Voort et al. (2008) as follows: “UHPC is much more expensive than normal
concrete. Much of the cost of UHPC comes from its steel fiber reinforcement, so the cost of the
material is largely contingent on the cost of this component. In 1996, Bonneau et al. (1996)
estimated the price of UHPC with fibers in Europe as $1070/yd3. Aïtcin (2000) reported a lower
1996 price of UHPC in Europe at $760/yd3. Aïtcin reported the price had decreased to $570/yd3
by the year 2000, which agrees fairly closely with Blais and Couture (1999) who reported a price
of $250/ton or $520/yd3 in 1999. As usage of UHPC becomes more common, the cost per cubic
yard is expected to decrease significantly. Aïtcin (2000) predicts the cost of UHPC will soon
reduce to $460/yd3 to $500/yd3 in Europe. The cost of UHPC in North America as of the year 2007
was comparatively high at approximately $2000/yd3 but is also expected to reduce with increased
application in North America.”If we compare $570/yd3 UHPC to a typical cost of 5000 psi NSC,
UHPC is about 5.8 times more expensive based on volumetric values. While initial cost analyses
may show UHPC to be an unnecessarily expensive alternative, overall reduced construction times,
increased available floor space and clearances, longer service life, and minimal maintenance
contribute to the cost savings significantly (Voort et al., 2008). Voort et al. (2008) also showed a
cost per unit weight comparison between normal concrete, UHPC, and structural steel (Table 2-
7), where the value used for UHPC is just an estimated value based on what has been achieved in
Europe. The cost of UHPC is still high across North America due to the fact that there are not
many UHPC manufacturers. Therefore, for the cost analysis conducted in this study (Chapter 6),
different values are used for the UHPC cost per unit that range from current US market price
(~$2000/yd3) to a hopeful reduced price when UHPC gets more common as in Europe (~$550/yd3
). It is worth noting that for other materials such as HVFA concrete, fly ash replacement is more
cost effective as it is approximately half the cost of cement (Voltz et al. 2012). Therefore, one way
to reduce monetary and ecological costs of UHPC is natural replacements such as fly ash.
Table 2-7 Cost comparison between NSC, UHPC, and steel (Voort et al., 2008)
Material Cost Ratio to UHPC Normal Strength Concrete $49/ton 1:5.6 UHPC $270/ton 1:1 Structural Steel $810/ton 3:1
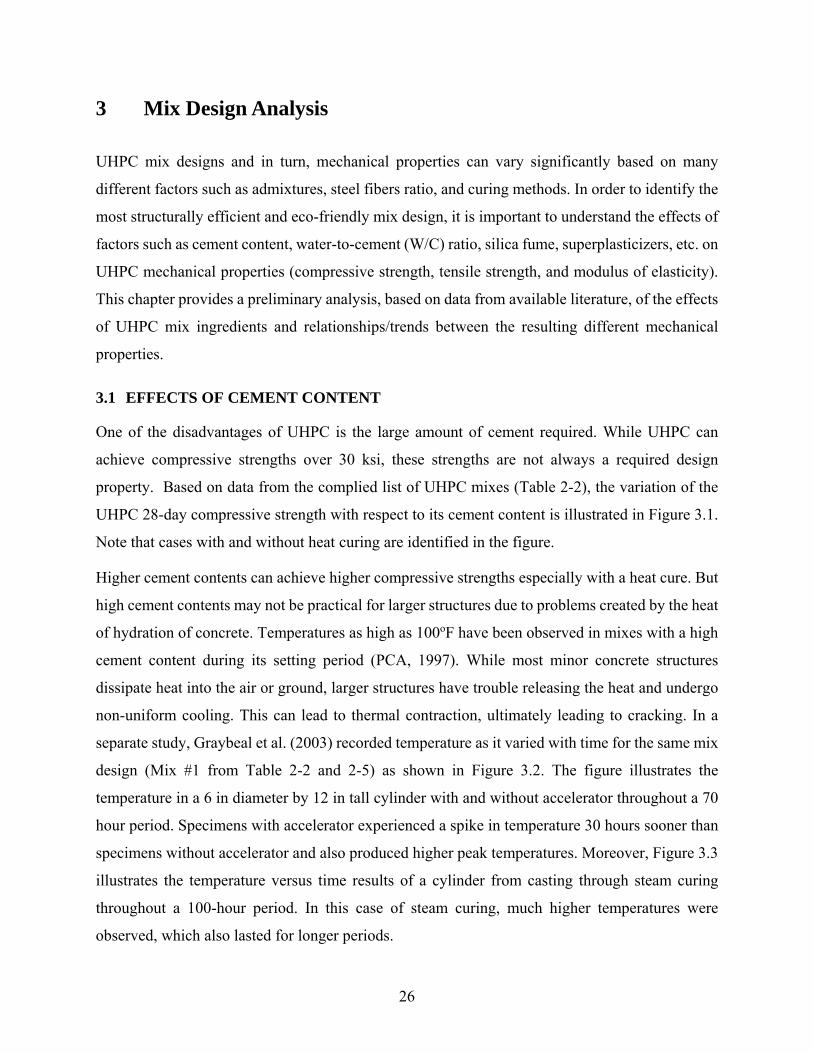
26
3 Mix Design Analysis
UHPC mix designs and in turn, mechanical properties can vary significantly based on many
different factors such as admixtures, steel fibers ratio, and curing methods. In order to identify the
most structurally efficient and eco-friendly mix design, it is important to understand the effects of
factors such as cement content, water-to-cement (W/C) ratio, silica fume, superplasticizers, etc. on
UHPC mechanical properties (compressive strength, tensile strength, and modulus of elasticity).
This chapter provides a preliminary analysis, based on data from available literature, of the effects
of UHPC mix ingredients and relationships/trends between the resulting different mechanical
properties.
3.1 EFFECTS OF CEMENT CONTENT
One of the disadvantages of UHPC is the large amount of cement required. While UHPC can
achieve compressive strengths over 30 ksi, these strengths are not always a required design
property. Based on data from the complied list of UHPC mixes (Table 2-2), the variation of the
UHPC 28-day compressive strength with respect to its cement content is illustrated in Figure 3.1.
Note that cases with and without heat curing are identified in the figure.
Higher cement contents can achieve higher compressive strengths especially with a heat cure. But
high cement contents may not be practical for larger structures due to problems created by the heat
of hydration of concrete. Temperatures as high as 100oF have been observed in mixes with a high
cement content during its setting period (PCA, 1997). While most minor concrete structures
dissipate heat into the air or ground, larger structures have trouble releasing the heat and undergo
non-uniform cooling. This can lead to thermal contraction, ultimately leading to cracking. In a
separate study, Graybeal et al. (2003) recorded temperature as it varied with time for the same mix
design (Mix #1 from Table 2-2 and 2-5) as shown in Figure 3.2. The figure illustrates the
temperature in a 6 in diameter by 12 in tall cylinder with and without accelerator throughout a 70
hour period. Specimens with accelerator experienced a spike in temperature 30 hours sooner than
specimens without accelerator and also produced higher peak temperatures. Moreover, Figure 3.3
illustrates the temperature versus time results of a cylinder from casting through steam curing
throughout a 100-hour period. In this case of steam curing, much higher temperatures were
observed, which also lasted for longer periods.
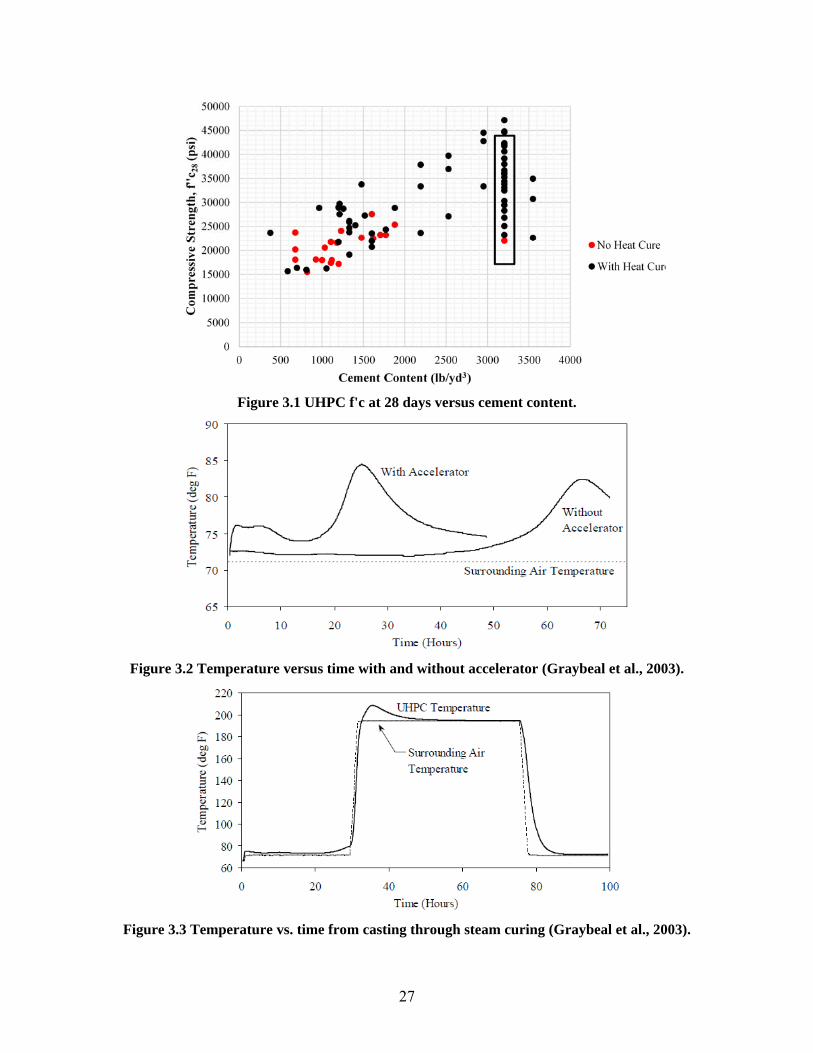
27
Figure 3.1 UHPC f'c at 28 days versus cement content.
Figure 3.2 Temperature versus time with and without accelerator (Graybeal et al., 2003).
Figure 3.3 Temperature vs. time from casting through steam curing (Graybeal et al., 2003).

28
By identifying a mix design with a practical compressive strength and optimal cement content, the
chances of a high exothermic reaction can be lowered, along with the amount of CO2 produced.
Using approximated metrics from the Portland Cement Association (1 lb of CO2 is emitted for
every 1.08 lb of portland cement produced), Figure 3.4 was produced to show the various CO2
emissions for each mix design compared to its compression strength. Compressive strengths
between 25-30 ksi can still be achieved while producing the equivalent CO2 to mix designs below
20 ksi.
Figure 3.4 CO2 produced versus UHPC compressive strength.
3.2 EFFECTS OF SILICA FUME
Silica fume, or microsilica, is a byproduct of silicon metal or ferrosilicon alloys. Because of the
fine composition of noncrystalline silica, large surface area, and high silicon dioxide (SiO2)
content, silica fume is a very effective pozzolanic additive for UHPC (ACI 116R-00; SFA, n.d.).
UHPC mix design numbers #23 and #33-#56 from Table 2-2 (also marked on Figure 3.1 with a
box) all have the same 3203 lb/yd3 of cement but each vary in compressive strength and silica
fume content. Talebinejad et al. (2004) performed laboratory tests on those mixes (#23 and #33-
#56 which are summarized again in more details in Table 3-1 below) and considered the following:
sieve analysis, cement and silica fume grounding, and curing methods. The quartzite used in the
mix designs were ground to a maximum size of 0.0393 in and mixed with micro steel fibers with
a diameter and length of 0.00393 in and 0.47 in, respectively. Talebinejad et al. (2004) utilized

29
type 5 cement because of its absence of tricalcium aluminate (C3A). The lack of C3A allows for
the superplasticizers to be more effective and therefore requiring a smaller water-to-cement (W/C)
ratio. The mix was compressed in a 3-cell 2x2x2 in mold and pressed with a 2-ton load to remove
any entrained air. Four different curing processes were then used on each mix design.
In order to compare the effects of silica fume on W/C ratio, the study by Talebinejad et al. (2004)
focused on Type-4 curing only (seven days in 68 oF water, two days in 194 oF water, two days in
392 oF dry air, and the remaining 17 days in 68 oF water). Figure 3.5 shows that silica fume is most
effective when its weight is 800 lb/yd3, i.e. 25% of the given 3203 lb/yd3 cement content. The
addition of this amount of silica fume produces the highest compressive strengths with lowest W/C
ratio at 11.5%.
Table 3-1 Mix Designs Utilized by Talebinejad et al. (2004)
Mix No.
lb/yd3 W/C
Cure Type
psi
Cement Silica Fume
Steel Fibers
Water f’c28
23 3203 801 32 368 0.115 4 47137 33 3203 641 32 368 0.115 4 41771 34 3203 961 32 368 0.115 4 44672 35 3203 1121 32 368 0.115 4 42206 36 3203 641 32 384 0.120 4 39160 37 3203 801 32 384 0.120 4 44817 38 3203 961 32 384 0.120 4 42351 39 3203 1121 32 384 0.120 4 40611 40 3203 641 32 416 0.130 4 36695 41 3203 801 32 416 0.130 4 41916 42 3203 961 32 416 0.130 4 38000 43 3203 1121 32 416 0.130 4 34374 44 3203 641 32 544 0.170 4 26832 45 3203 801 32 544 0.170 4 33069 46 3203 961 32 544 0.170 4 30313 47 3203 1121 32 544 0.170 4 28282 48 3203 801 32 320 0.100 4 32489 49 3203 801 32 352 0.110 4 39160 50 3203 801 32 641 0.200 4 25092 51 3203 801 32 368 0.115 4 35969 52 3203 801 32 416 0.130 4 35244 53 3203 801 32 544 0.170 4 29443 54 3203 801 32 641 0.200 4 23206
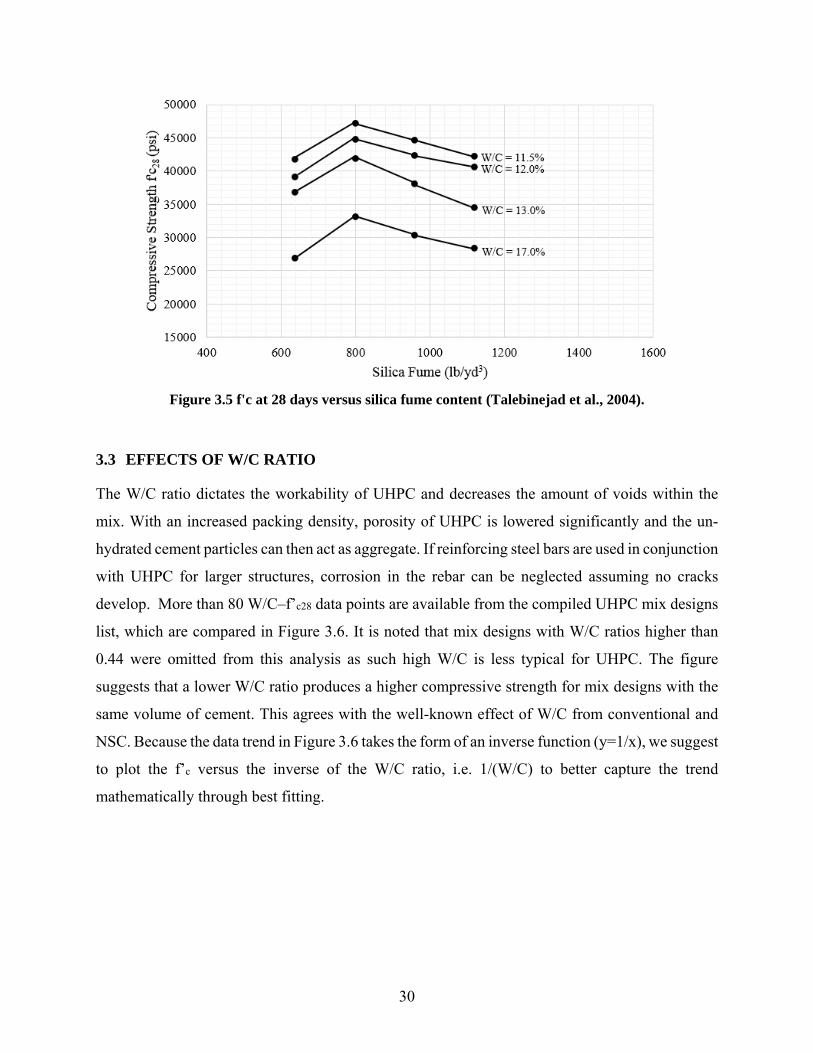
30
Figure 3.5 f'c at 28 days versus silica fume content (Talebinejad et al., 2004).
3.3 EFFECTS OF W/C RATIO
The W/C ratio dictates the workability of UHPC and decreases the amount of voids within the
mix. With an increased packing density, porosity of UHPC is lowered significantly and the un-
hydrated cement particles can then act as aggregate. If reinforcing steel bars are used in conjunction
with UHPC for larger structures, corrosion in the rebar can be neglected assuming no cracks
develop. More than 80 W/C–f’c28 data points are available from the compiled UHPC mix designs
list, which are compared in Figure 3.6. It is noted that mix designs with W/C ratios higher than
0.44 were omitted from this analysis as such high W/C is less typical for UHPC. The figure
suggests that a lower W/C ratio produces a higher compressive strength for mix designs with the
same volume of cement. This agrees with the well-known effect of W/C from conventional and
NSC. Because the data trend in Figure 3.6 takes the form of an inverse function (y=1/x), we suggest
to plot the f’c versus the inverse of the W/C ratio, i.e. 1/(W/C) to better capture the trend
mathematically through best fitting.
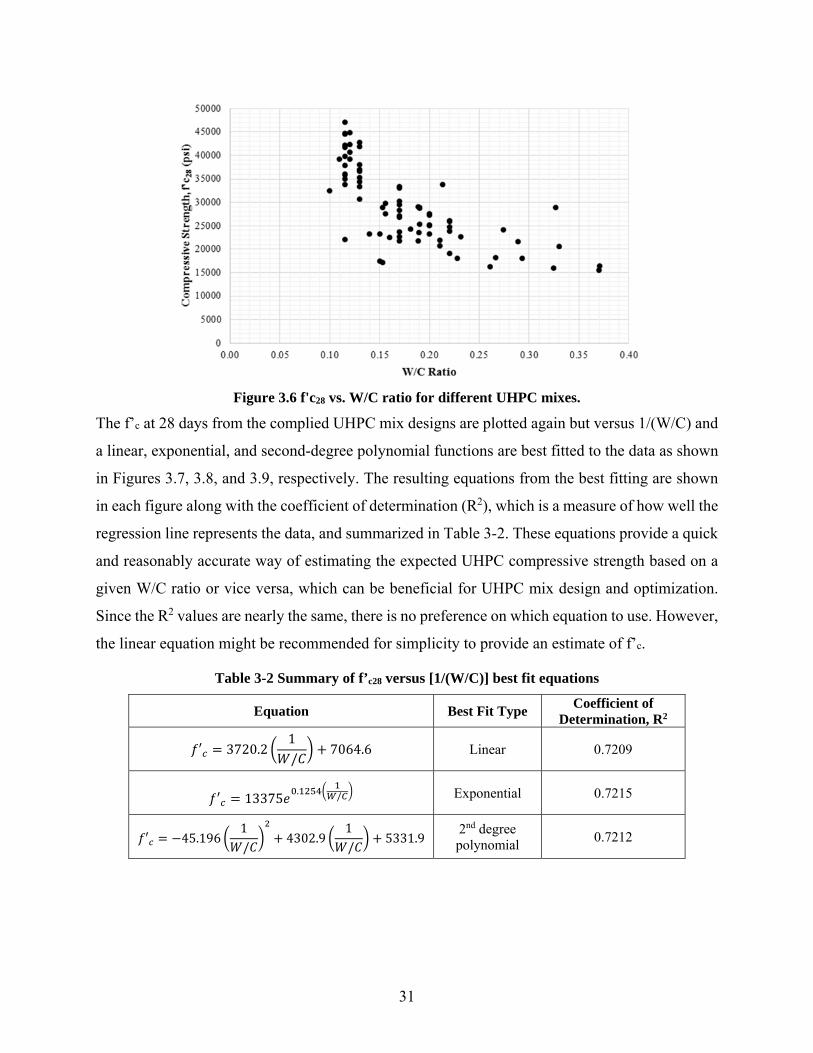
31
Figure 3.6 f'c28 vs. W/C ratio for different UHPC mixes.
The f’c at 28 days from the complied UHPC mix designs are plotted again but versus 1/(W/C) and
a linear, exponential, and second-degree polynomial functions are best fitted to the data as shown
in Figures 3.7, 3.8, and 3.9, respectively. The resulting equations from the best fitting are shown
in each figure along with the coefficient of determination (R2), which is a measure of how well the
regression line represents the data, and summarized in Table 3-2. These equations provide a quick
and reasonably accurate way of estimating the expected UHPC compressive strength based on a
given W/C ratio or vice versa, which can be beneficial for UHPC mix design and optimization.
Since the R2 values are nearly the same, there is no preference on which equation to use. However,
the linear equation might be recommended for simplicity to provide an estimate of f’c.
Table 3-2 Summary of f’c28 versus [1/(W/C)] best fit equations
Equation Best Fit Type Coefficient of
Determination, R2
′ 3720.21/
7064.6 Linear 0.7209
′ 13375. / Exponential 0.7215
′ 45.1961/
4302.91/
5331.9 2nd degree polynomial
0.7212

32
Figure 3.7 f'c28 vs. [1/(W/C)] with a linear best fit.
Figure 3.8 f'c28 vs. [1/(W/C)] with an exponential best fit.
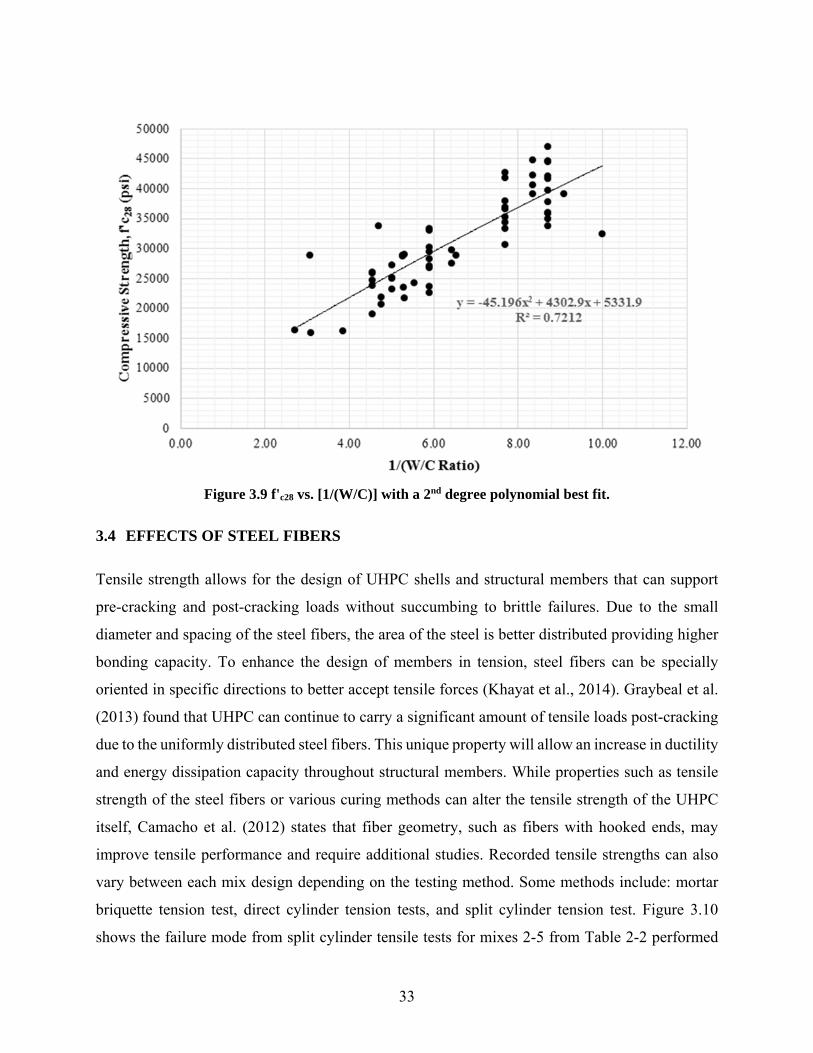
33
Figure 3.9 f'c28 vs. [1/(W/C)] with a 2nd degree polynomial best fit.
3.4 EFFECTS OF STEEL FIBERS
Tensile strength allows for the design of UHPC shells and structural members that can support
pre-cracking and post-cracking loads without succumbing to brittle failures. Due to the small
diameter and spacing of the steel fibers, the area of the steel is better distributed providing higher
bonding capacity. To enhance the design of members in tension, steel fibers can be specially
oriented in specific directions to better accept tensile forces (Khayat et al., 2014). Graybeal et al.
(2013) found that UHPC can continue to carry a significant amount of tensile loads post-cracking
due to the uniformly distributed steel fibers. This unique property will allow an increase in ductility
and energy dissipation capacity throughout structural members. While properties such as tensile
strength of the steel fibers or various curing methods can alter the tensile strength of the UHPC
itself, Camacho et al. (2012) states that fiber geometry, such as fibers with hooked ends, may
improve tensile performance and require additional studies. Recorded tensile strengths can also
vary between each mix design depending on the testing method. Some methods include: mortar
briquette tension test, direct cylinder tension tests, and split cylinder tension test. Figure 3.10
shows the failure mode from split cylinder tensile tests for mixes 2-5 from Table 2-2 performed
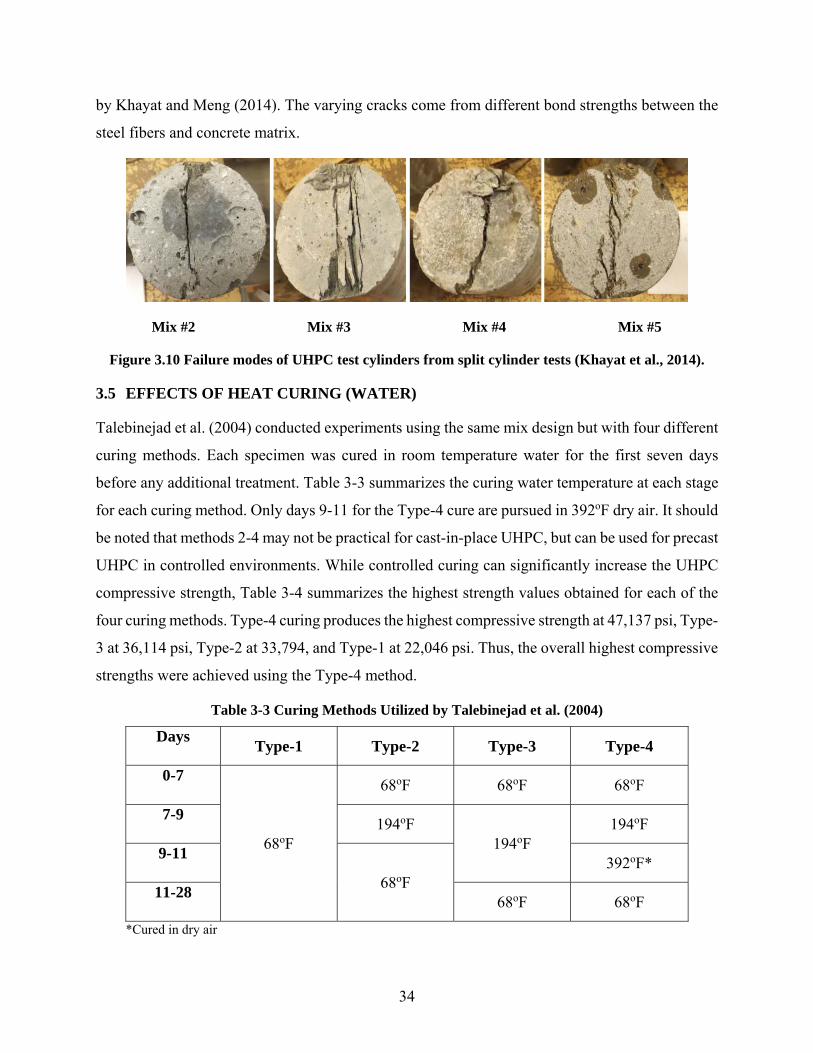
34
by Khayat and Meng (2014). The varying cracks come from different bond strengths between the
steel fibers and concrete matrix.
Mix #2 Mix #3 Mix #4 Mix #5
Figure 3.10 Failure modes of UHPC test cylinders from split cylinder tests (Khayat et al., 2014).
3.5 EFFECTS OF HEAT CURING (WATER)
Talebinejad et al. (2004) conducted experiments using the same mix design but with four different
curing methods. Each specimen was cured in room temperature water for the first seven days
before any additional treatment. Table 3-3 summarizes the curing water temperature at each stage
for each curing method. Only days 9-11 for the Type-4 cure are pursued in 392oF dry air. It should
be noted that methods 2-4 may not be practical for cast-in-place UHPC, but can be used for precast
UHPC in controlled environments. While controlled curing can significantly increase the UHPC
compressive strength, Table 3-4 summarizes the highest strength values obtained for each of the
four curing methods. Type-4 curing produces the highest compressive strength at 47,137 psi, Type-
3 at 36,114 psi, Type-2 at 33,794, and Type-1 at 22,046 psi. Thus, the overall highest compressive
strengths were achieved using the Type-4 method.
Table 3-3 Curing Methods Utilized by Talebinejad et al. (2004)
Days Type-1 Type-2 Type-3 Type-4
0-7
68oF
68oF 68oF 68oF
7-9 194oF
194oF 194oF
9-11
68oF 392oF*
11-28 68oF 68oF
*Cured in dry air

35
Table 3-4 Variation of UHPC Highest Compressive Strength Obtained for Different Curing Methods Utilized by Talebinejad et al. (2004)
Mix No. lb/yd3
W/C Cure Type
psi
Cement Silica Fume
Steel Fibers
Water f’c28
23 3203 801 32 368 0.115 4 47137
55 3203 801 32 368 0.115 3 36114
56 3203 801 32 368 0.115 2 33794
57 3203 801 32 368 0.115 1 22046
3.6 EFFECTS OF HEAT CURING (STEAM)
Rather than using varying temperatures of water, Graybeal et al. (2003) performed a study on mix
#1 (Table 2-2, and summarized again in Table 3-5 for convenience) using different steaming
methods. The specimens were processed through four different curing methods. The first method
(steam) is a steam cure at 194oF / 95% relative humidity for 48 hours, 24 hours after removing the
specimen from the mold. The second method (ambient air) is to allow the specimen to remain at
laboratory temperatures until it is ready for testing. The third method (tempered steam) is a lower
temperature steam cure applied at 140oF / 95% relative humidity for 48 hours, 24 hours after
removing the specimen from the mold. The fourth and final method (delayed steam) is a delayed
steaming method where the specimens are allowed to sit in laboratory temperatures for 15 days
until it is finally cured at 194oF / 95% relative humidity for 48 hours. Graybeal et al. (2003)
performed various tests on many specimens including compressive testing of cylinders, mortar
briquette tension tests, direct cylinder tension tests, and split cylinder tension tests to compare the
effect of the four aforementioned steam curing methods. Table 3-6 summarizes the results for the
compression tests for each curing method.
Table 3-5 Mix Design Utilized by Graybeal et al. (2003)
Mix No.
lb/yd3
W/C Cement
Fine Sand
Silica Fume
Ground Quartz
Steel Fibers
Water
1 1200 1720 390 355 263 184 0.153

36
Table 3-6 Average Compressive Strengths for Varying Curing Methods by Graybeal et al. (2003)
Curing Method # of Samples f’c28 (ksi) Standard Deviation (ksi)
Steam 96 28.0 2.1
Ambient Air 44 18.0 1.8
Tempered Steam 18 25.2 1.3
Delayed Steam 18 24.9 1.5
Graybeal et al. (2003) performed mortar briquette tension tests for samples cured by steam,
ambient air, tempered steam, and delayed steam for various time intervals, according to AASHTO
T132 with slight modifications. Figure 3.11 illustrates the tensile cracking results from the mortar
briquette tension tests and the number of days after casting until testing for the different curing
methods. As expected, steam curing has positive effects on tensile properties while specimens
cured in ambient air for 28 days produced the lowest tensile strengths at an average of 0.9 ksi.
Graybeal et al. (2003) also recorded the load-displacement relationship within the mortar briquette
tension tests. They observed that the concrete sections continuously carried tensile loads after
initial cracking. The load capacity finally reached zero when the steel fibers gradually pulled out
and the entire section split. Figure 3.12 shows the load-displacement response for a steam cured
mortar briquette and a circle marking where the UHPC begins to crack. They observed that the
steam cured specimens demonstrated the best post-cracking behavior and had approximately twice
the toughness of ambient air cured specimens. The tempered steam and delayed steam cured
specimens had 1.5 times the toughness of ambient air cured specimens.

37
Figure 3.11 Tensile cracking results for mortar briquette tension tests (Graybeal et al., 2003).
Figure 3.12 Load-displacement response for steam cured mortar specimens (Graybeal et al., 2003).
Spilt cylinder tests were also performed to estimate the tensile strength of UHPC indirectly through
standard compression tests. Graybeal et al. (2003) used ASTM C496 testing standards with slight
modifications. Figure 3.13 illustrates the tensile cracking results from the split cylinder tension
tests and the number of days after casting before the tests were performed. Again, steam cured
specimens produced the highest tensile cracking strengths at an average of 1.7 ksi. Tempered steam
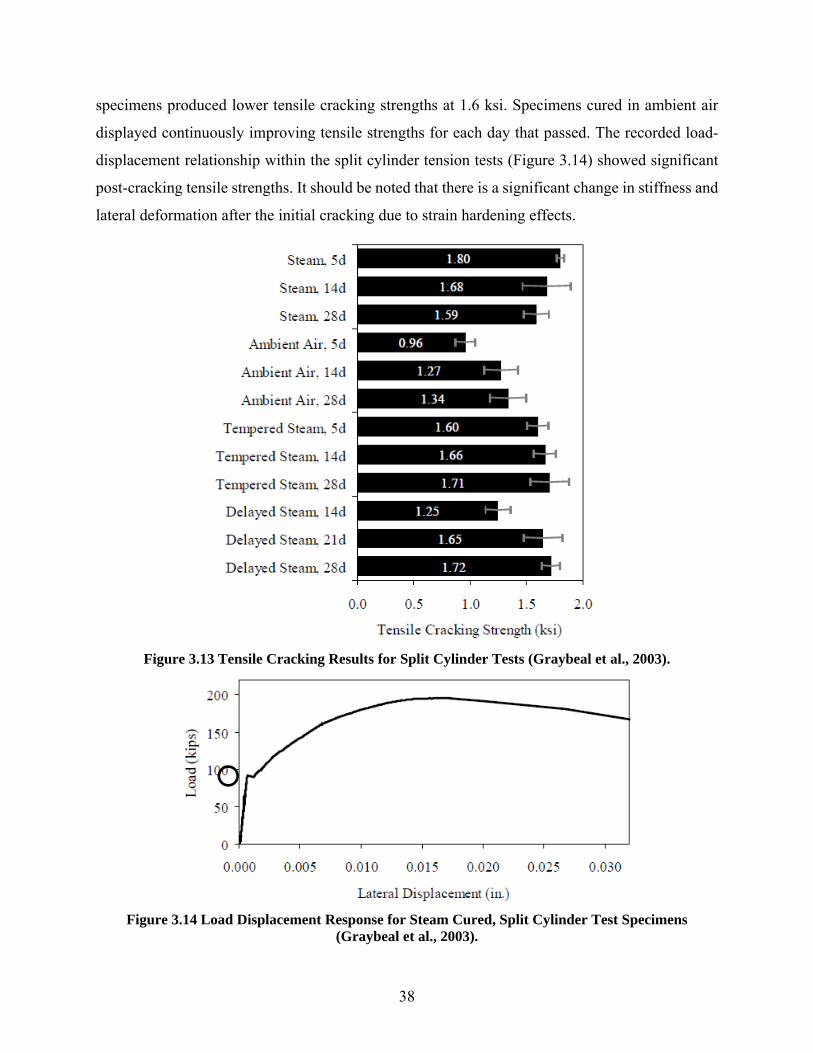
38
specimens produced lower tensile cracking strengths at 1.6 ksi. Specimens cured in ambient air
displayed continuously improving tensile strengths for each day that passed. The recorded load-
displacement relationship within the split cylinder tension tests (Figure 3.14) showed significant
post-cracking tensile strengths. It should be noted that there is a significant change in stiffness and
lateral deformation after the initial cracking due to strain hardening effects.
Figure 3.13 Tensile Cracking Results for Split Cylinder Tests (Graybeal et al., 2003).
Figure 3.14 Load Displacement Response for Steam Cured, Split Cylinder Test Specimens (Graybeal et al., 2003).

39
The last type of tests conducted by Graybeal et al. (2003) to study how UHPC mechanical
properties vary with curing types is direct cylinder tension tests, where the ends of the cylinder are
adhered to the heads of the testing device. The cylinder direction tension test is based on the
RILEM uniaxial tension test for steel fiber reinforced concrete and USBR 4914. Due to limited
time constraints, tests were performed, at minimum, 50 days after casting. Table 3-7 summarizes
the cylinder direction tension test results. Steam and delayed steam curing methods observed the
highest average cracking strengths at 1.60 ksi and 1.62 ksi, respectively while specimens cured in
ambient air had the lowest cracking strength at 0.82 ksi.
Table 3-7 Cylinder Direction Tension Testing Results Under Various Curing Methods (Graybeal et al., 2003)
Curing Method # of Samples Cracking Strength (ksi) Standard Deviation (ksi)
Steam 3 1.60 0.13
Ambient Air 1 0.82 -
Tempered Steam 3 1.14 0.13
Delayed Steam 2 1.62 0.07
3.7 MODULUS OF ELASTICITY
All the previous sections in this chapter focused on summarizing the effects of UHPC mix
ingredients or curing methods on its mechanical properties. In this section, and the subsequent one,
the relation between the different mechanical properties are investigated. In one study performed
by Graybeal (2006), an equation was proposed to estimate the modulus of elasticity (Ec) of UHPC
using its compressive strength (f’c) as follows:
46,200 ′ (3-1)
Graybeal found that the above equation is not appropriate for UHPC mix designs with
compressive strengths between 14 to 26 ksi, but also found that the modulus of elasticity is not
dependent to the curing temperature of the specimen. More recently, Graybeal (2013) developed
an updated equation to estimate the modulus of elasticity for all compressive strengths as follows:
49,000 ′ (3-2)
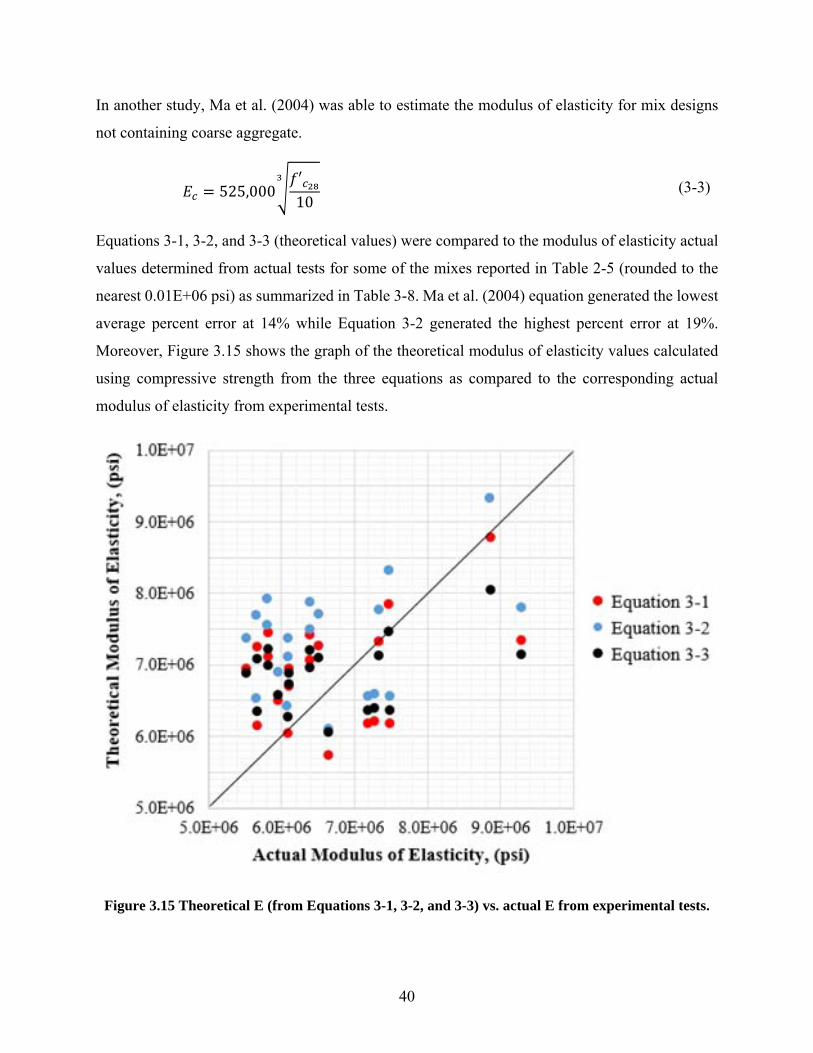
40
In another study, Ma et al. (2004) was able to estimate the modulus of elasticity for mix designs
not containing coarse aggregate.
525,000′
10 (3-3)
Equations 3-1, 3-2, and 3-3 (theoretical values) were compared to the modulus of elasticity actual
values determined from actual tests for some of the mixes reported in Table 2-5 (rounded to the
nearest 0.01E+06 psi) as summarized in Table 3-8. Ma et al. (2004) equation generated the lowest
average percent error at 14% while Equation 3-2 generated the highest percent error at 19%.
Moreover, Figure 3.15 shows the graph of the theoretical modulus of elasticity values calculated
using compressive strength from the three equations as compared to the corresponding actual
modulus of elasticity from experimental tests.
Figure 3.15 Theoretical E (from Equations 3-1, 3-2, and 3-3) vs. actual E from experimental tests.
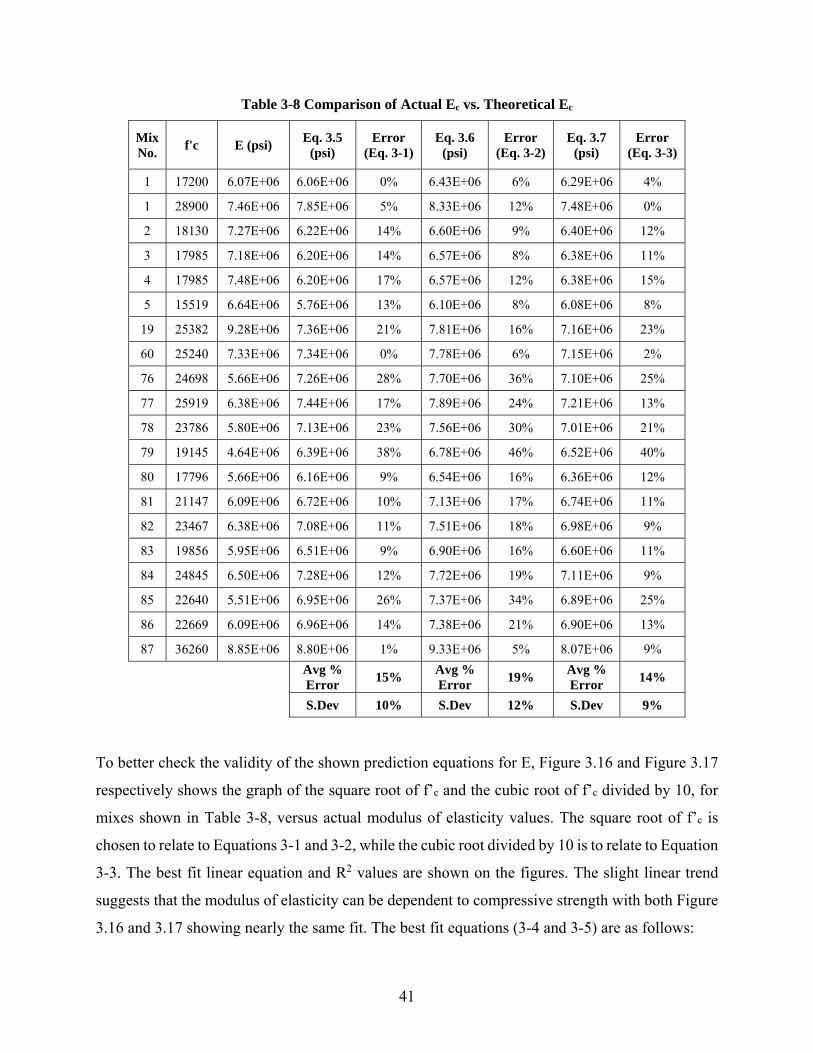
41
Table 3-8 Comparison of Actual Ec vs. Theoretical Ec
Mix No.
f'c E (psi) Eq. 3.5
(psi) Error
(Eq. 3-1) Eq. 3.6
(psi) Error
(Eq. 3-2) Eq. 3.7
(psi) Error
(Eq. 3-3)
1 17200 6.07E+06 6.06E+06 0% 6.43E+06 6% 6.29E+06 4%
1 28900 7.46E+06 7.85E+06 5% 8.33E+06 12% 7.48E+06 0%
2 18130 7.27E+06 6.22E+06 14% 6.60E+06 9% 6.40E+06 12%
3 17985 7.18E+06 6.20E+06 14% 6.57E+06 8% 6.38E+06 11%
4 17985 7.48E+06 6.20E+06 17% 6.57E+06 12% 6.38E+06 15%
5 15519 6.64E+06 5.76E+06 13% 6.10E+06 8% 6.08E+06 8%
19 25382 9.28E+06 7.36E+06 21% 7.81E+06 16% 7.16E+06 23%
60 25240 7.33E+06 7.34E+06 0% 7.78E+06 6% 7.15E+06 2%
76 24698 5.66E+06 7.26E+06 28% 7.70E+06 36% 7.10E+06 25%
77 25919 6.38E+06 7.44E+06 17% 7.89E+06 24% 7.21E+06 13%
78 23786 5.80E+06 7.13E+06 23% 7.56E+06 30% 7.01E+06 21%
79 19145 4.64E+06 6.39E+06 38% 6.78E+06 46% 6.52E+06 40%
80 17796 5.66E+06 6.16E+06 9% 6.54E+06 16% 6.36E+06 12%
81 21147 6.09E+06 6.72E+06 10% 7.13E+06 17% 6.74E+06 11%
82 23467 6.38E+06 7.08E+06 11% 7.51E+06 18% 6.98E+06 9%
83 19856 5.95E+06 6.51E+06 9% 6.90E+06 16% 6.60E+06 11%
84 24845 6.50E+06 7.28E+06 12% 7.72E+06 19% 7.11E+06 9%
85 22640 5.51E+06 6.95E+06 26% 7.37E+06 34% 6.89E+06 25%
86 22669 6.09E+06 6.96E+06 14% 7.38E+06 21% 6.90E+06 13%
87 36260 8.85E+06 8.80E+06 1% 9.33E+06 5% 8.07E+06 9%
Avg % Error
15% Avg % Error
19% Avg % Error
14%
S.Dev 10% S.Dev 12% S.Dev 9%
To better check the validity of the shown prediction equations for E, Figure 3.16 and Figure 3.17
respectively shows the graph of the square root of f’c and the cubic root of f’c divided by 10, for
mixes shown in Table 3-8, versus actual modulus of elasticity values. The square root of f’c is
chosen to relate to Equations 3-1 and 3-2, while the cubic root divided by 10 is to relate to Equation
3-3. The best fit linear equation and R2 values are shown on the figures. The slight linear trend
suggests that the modulus of elasticity can be dependent to compressive strength with both Figure
3.16 and 3.17 showing nearly the same fit. The best fit equations (3-4 and 3-5) are as follows:
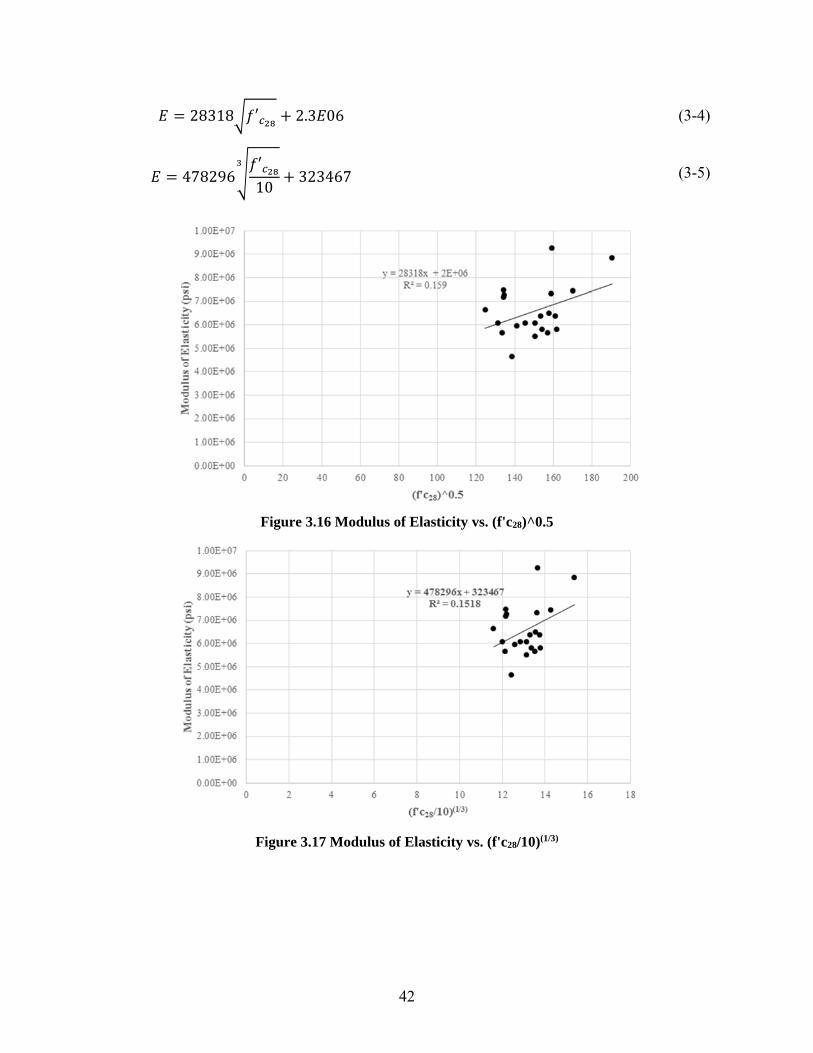
42
28318 ′ 2.3 06 (3-4)
478296′10
323467 (3-5)
Figure 3.16 Modulus of Elasticity vs. (f'c28)^0.5
Figure 3.17 Modulus of Elasticity vs. (f'c28/10)(1/3)
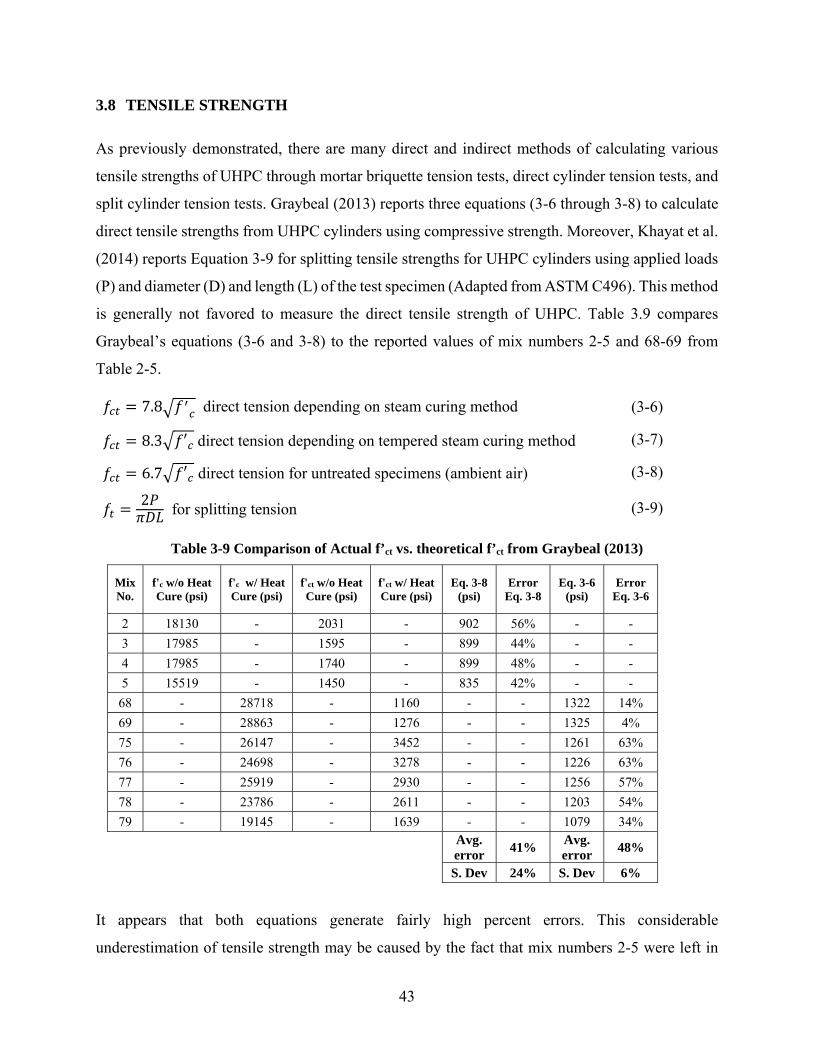
43
3.8 TENSILE STRENGTH
As previously demonstrated, there are many direct and indirect methods of calculating various
tensile strengths of UHPC through mortar briquette tension tests, direct cylinder tension tests, and
split cylinder tension tests. Graybeal (2013) reports three equations (3-6 through 3-8) to calculate
direct tensile strengths from UHPC cylinders using compressive strength. Moreover, Khayat et al.
(2014) reports Equation 3-9 for splitting tensile strengths for UHPC cylinders using applied loads
(P) and diameter (D) and length (L) of the test specimen (Adapted from ASTM C496). This method
is generally not favored to measure the direct tensile strength of UHPC. Table 3.9 compares
Graybeal’s equations (3-6 and 3-8) to the reported values of mix numbers 2-5 and 68-69 from
Table 2-5.
7.8 direct tension depending on steam curing method (3-6)
8.3 ′ direct tension depending on tempered steam curing method (3-7)
6.7 ′ direct tension for untreated specimens (ambient air) (3-8)
2 for splitting tension (3-9)
Table 3-9 Comparison of Actual f’ct vs. theoretical f’ct from Graybeal (2013)
Mix No.
f'c w/o Heat Cure (psi)
f'c w/ Heat Cure (psi)
f'ct w/o Heat Cure (psi)
f'ct w/ Heat Cure (psi)
Eq. 3-8 (psi)
Error Eq. 3-8
Eq. 3-6 (psi)
Error Eq. 3-6
2 18130 - 2031 - 902 56% - -
3 17985 - 1595 - 899 44% - -
4 17985 - 1740 - 899 48% - -
5 15519 - 1450 - 835 42% - -
68 - 28718 - 1160 - - 1322 14%
69 - 28863 - 1276 - - 1325 4%
75 - 26147 - 3452 - - 1261 63%
76 - 24698 - 3278 - - 1226 63%
77 - 25919 - 2930 - - 1256 57%
78 - 23786 - 2611 - - 1203 54%
79 - 19145 - 1639 - - 1079 34%
Avg. error
41% Avg. error
48%
S. Dev 24% S. Dev 6%
It appears that both equations generate fairly high percent errors. This considerable
underestimation of tensile strength may be caused by the fact that mix numbers 2-5 were left in

44
room temperature lime water until one hour before its tests. These effects are similar to Graybeal’s
results from his mortar briquette tension test and split cylinder test specimens left in ambient air,
which increased in strength over time (Graybeal, 2003). Mix numbers 68-79 could have also been
underestimated due to different heat curing methods or mix designs. Graybeal’s Equation 3-6
through 3-8 are not accurate estimations of tensile strength in a universal setting, but may only
serve for his mix designs and curing method only. Mortar briquette and direct cylinder tension
tests should be performed to best estimate the tensile strength of the specimen.

45
4 Design of UHPC Piers using Computational Methods
This chapter focuses on the design of the substructure (bridge pier) of a prototype bridge using
four different UHPC mixes with different mechanical properties. The selected prototype is the
Caltrans Academy Bridge, for which the full cross-sections design and bridge detailing are
available using conventional NSC. Thus, the new design achieved here using UHPC can be
compared to the NSC baseline case. The chapter presents the design details of the original
prototype NSC bridge pier, the modeling assumptions considered, and the sectional analysis used
to design/optimize the UHPC piers.
4.1 PROTOTYPE BRIDGE
The prototype bridge considered in this study, designated as the Caltrans Academy Bridge, is a
typical three-span California highway bridge with a prestressed reinforced concrete box-girder
superstructure. The prototype bridge pier is redesigned using UHPC such that a bridge pier consists
of two UHPC columns and a UHPC bent cap with a capacity controlled foundation. All design is
made in accordance to the Caltrans Seismic Design Criteria (SDC 1.7, 2013) and AASHTO LRFD
Bridge Design Specifications (2012). Table 4-1 displays a summary of the prototype bridge design
specifications. The design of the superstructure is not considered in this study, and only the bridge
piers are redesigned using UHPC, i.e. the new changes are on the column diameter and bent cap
dimensions, and their reinforcing steel.
The UHPC columns are designed using four of the published UHPC mix designs, (summarized in
Table 4-3) each selected with increasing strength from the comprehensive compiled list in Chapter
2. Actual values (based on experimental testing) of compressive strength, tensile strength, ultimate
strain, strains at peak stress, and modulus of elasticity are used for the computational modeling as
discussed in the following sections. By selecting a wide spectrum of mix designs with varying
strengths, the most ecological and cost-friendly mix design can be discovered to create the most
efficient multi-column bridge pier. Columns include longitudinal and transverse steel
reinforcement with an expected yield strength (fye) and expected tensile strength (fue) of 66 ksi and
92 ksi, respectively. The gross area (Ag) of the columns is reduced to determine if the amount of
cement consumed can ultimately be reduced and impact the amount of CO2 produced. The design
procedure is based on the Caltrans LRFD Bridge Design Example B (2004) from the Caltrans
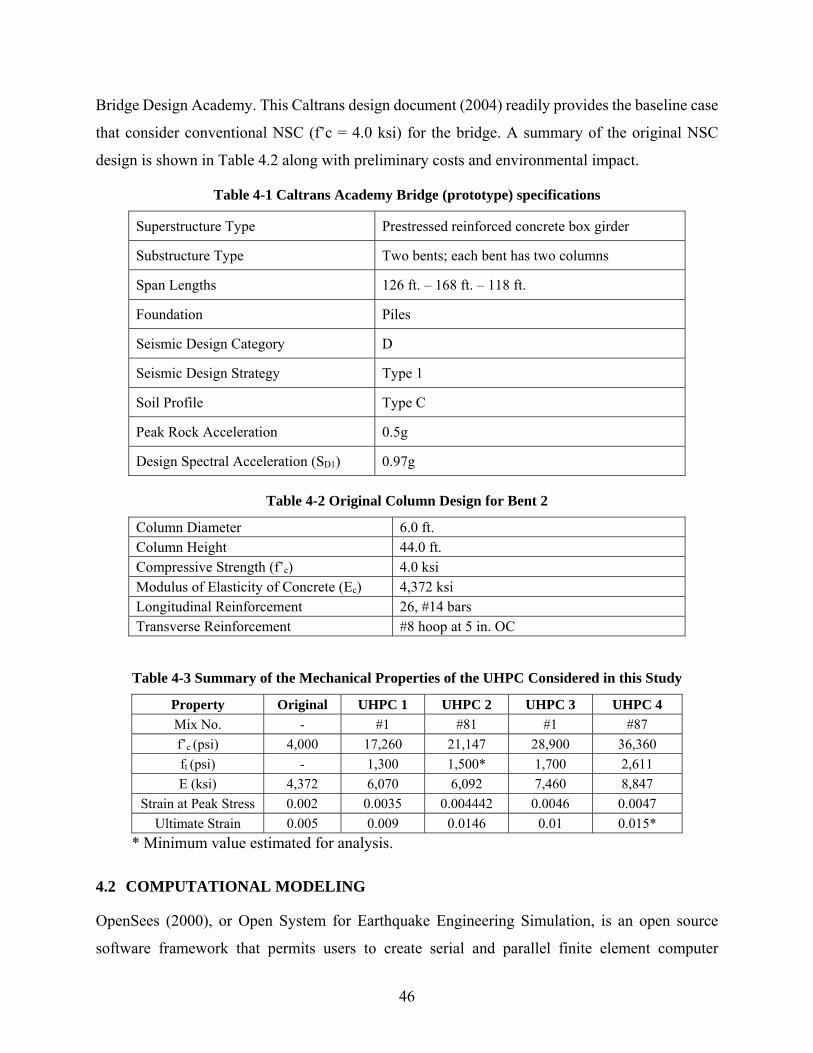
46
Bridge Design Academy. This Caltrans design document (2004) readily provides the baseline case
that consider conventional NSC (f’c = 4.0 ksi) for the bridge. A summary of the original NSC
design is shown in Table 4.2 along with preliminary costs and environmental impact.
Table 4-1 Caltrans Academy Bridge (prototype) specifications
Superstructure Type Prestressed reinforced concrete box girder
Substructure Type Two bents; each bent has two columns
Span Lengths 126 ft. – 168 ft. – 118 ft.
Foundation Piles
Seismic Design Category D
Seismic Design Strategy Type 1
Soil Profile Type C
Peak Rock Acceleration 0.5g
Design Spectral Acceleration (SD1) 0.97g
Table 4-2 Original Column Design for Bent 2
Column Diameter 6.0 ft. Column Height 44.0 ft. Compressive Strength (f’c) 4.0 ksi Modulus of Elasticity of Concrete (Ec) 4,372 ksi Longitudinal Reinforcement 26, #14 bars Transverse Reinforcement #8 hoop at 5 in. OC
Table 4-3 Summary of the Mechanical Properties of the UHPC Considered in this Study
Property Original UHPC 1 UHPC 2 UHPC 3 UHPC 4
Mix No. - #1 #81 #1 #87
f’c (psi) 4,000 17,260 21,147 28,900 36,360
ft (psi) - 1,300 1,500* 1,700 2,611
E (ksi) 4,372 6,070 6,092 7,460 8,847
Strain at Peak Stress 0.002 0.0035 0.004442 0.0046 0.0047
Ultimate Strain 0.005 0.009 0.0146 0.01 0.015*
* Minimum value estimated for analysis.
4.2 COMPUTATIONAL MODELING
OpenSees (2000), or Open System for Earthquake Engineering Simulation, is an open source
software framework that permits users to create serial and parallel finite element computer

47
applications used to simulate the response of structural and geotechnical systems subjected to
various events such as earthquakes. Simulation applications for earthquake engineering through
finite element methods can be produced using OpenSees, which ultimately focuses on capabilities
used for performance-based design. Unlike many typical programs used in engineering, OpenSees
remains an open source software framework to promote the research community to excel and allow
for user experimentation and sharing. (OpenSeesWiki, n.d.)
In this study, the OpenSees platform is used to perform first column and beam cross-sectional
analysis, then a nonlinear lateral pushover analysis on two-column bents, and ultimately, nonlinear
time history analysis using several ground motions on two-column bents. All the analysis sets are
conducted for five cases: normal strength concrete (NSC) and four UHPC mix designs each with
increasing compressive strengths and added tensile properties. Due to the lack of previous research
in UHPC modeling within OpenSees, the current existing concrete material models are
investigated to check which model can better approximate the UHPC mechanical properties
(especially tensile behavior). This investigation include analyses from OpenSees using Concrete02
and Concrete04 as well as the classical cross-sectional analysis platform XTRACT (Chadwell and
Imbsen, 2004). Four UHPC mix designs are analyzed and compared to NSC in order to optimize
the column and bent cap design. The following defines examples for the reinforcing steel and
concrete uniaxial material models available in OpenSees.
ReinforcingSteel: “This command is used to construct a ReinforcingSteel uniaxial material
object. This object is intended to be used in a reinforced concrete fiber section as the steel
reinforcing material.” (OpenSees Command Manual, 2003). The typical Code Line:
“uniaxialMaterial ReinforcingSteel $matTag $fy $fu $Es $Esh $esh $eult”
where,
$fy Yield stress in tension $fu Ultimate stress in tension $Es Initial elastic tangent $Esh Tangent at initial strain hardening $esh Strain corresponding to initial strain hardening $eult Strain at peak stress
Concrete01: “This command is used to construct a uniaxial Kent-Scott-Park concrete material
object with degraded linear unloading/reloading stiffness according to the work of Karsan-Jirsa
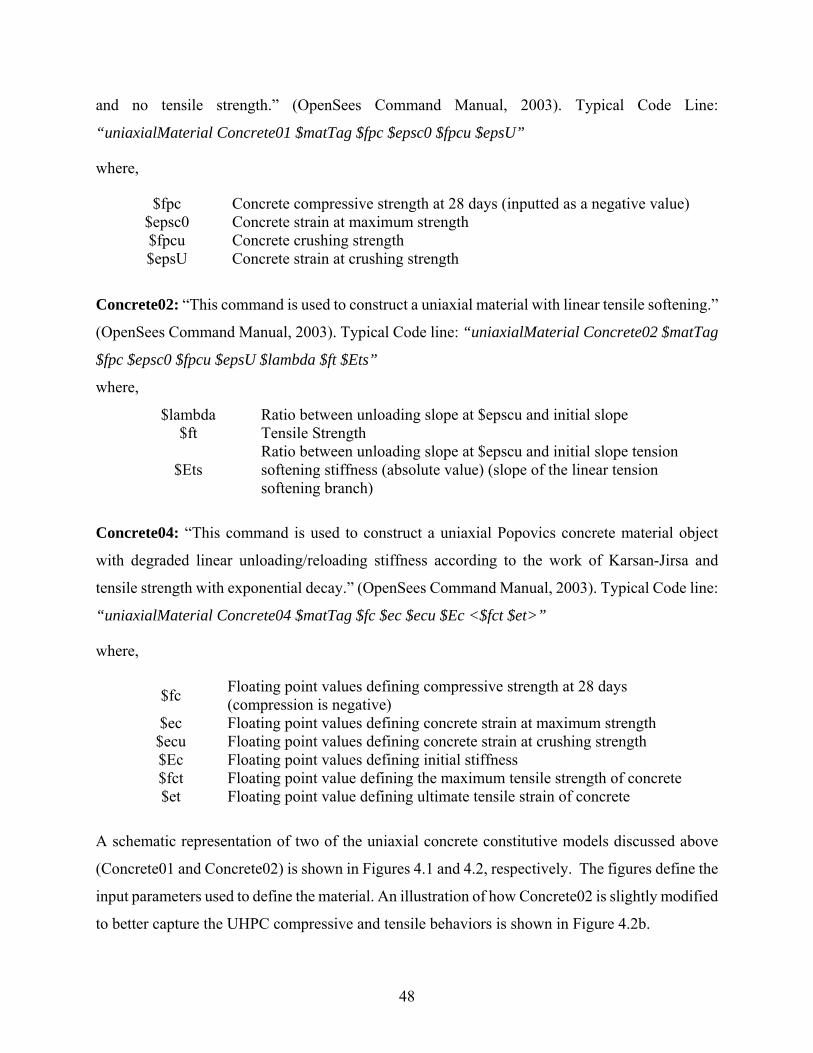
48
and no tensile strength.” (OpenSees Command Manual, 2003). Typical Code Line:
“uniaxialMaterial Concrete01 $matTag $fpc $epsc0 $fpcu $epsU”
where,
$fpc Concrete compressive strength at 28 days (inputted as a negative value) $epsc0 Concrete strain at maximum strength $fpcu Concrete crushing strength $epsU Concrete strain at crushing strength
Concrete02: “This command is used to construct a uniaxial material with linear tensile softening.”
(OpenSees Command Manual, 2003). Typical Code line: “uniaxialMaterial Concrete02 $matTag
$fpc $epsc0 $fpcu $epsU $lambda $ft $Ets”
where,
$lambda Ratio between unloading slope at $epscu and initial slope $ft Tensile Strength
$Ets Ratio between unloading slope at $epscu and initial slope tension softening stiffness (absolute value) (slope of the linear tension softening branch)
Concrete04: “This command is used to construct a uniaxial Popovics concrete material object
with degraded linear unloading/reloading stiffness according to the work of Karsan-Jirsa and
tensile strength with exponential decay.” (OpenSees Command Manual, 2003). Typical Code line:
“uniaxialMaterial Concrete04 $matTag $fc $ec $ecu $Ec <$fct $et>”
where,
$fc Floating point values defining compressive strength at 28 days (compression is negative)
$ec Floating point values defining concrete strain at maximum strength $ecu Floating point values defining concrete strain at crushing strength $Ec Floating point values defining initial stiffness $fct Floating point value defining the maximum tensile strength of concrete $et Floating point value defining ultimate tensile strain of concrete
A schematic representation of two of the uniaxial concrete constitutive models discussed above
(Concrete01 and Concrete02) is shown in Figures 4.1 and 4.2, respectively. The figures define the
input parameters used to define the material. An illustration of how Concrete02 is slightly modified
to better capture the UHPC compressive and tensile behaviors is shown in Figure 4.2b.
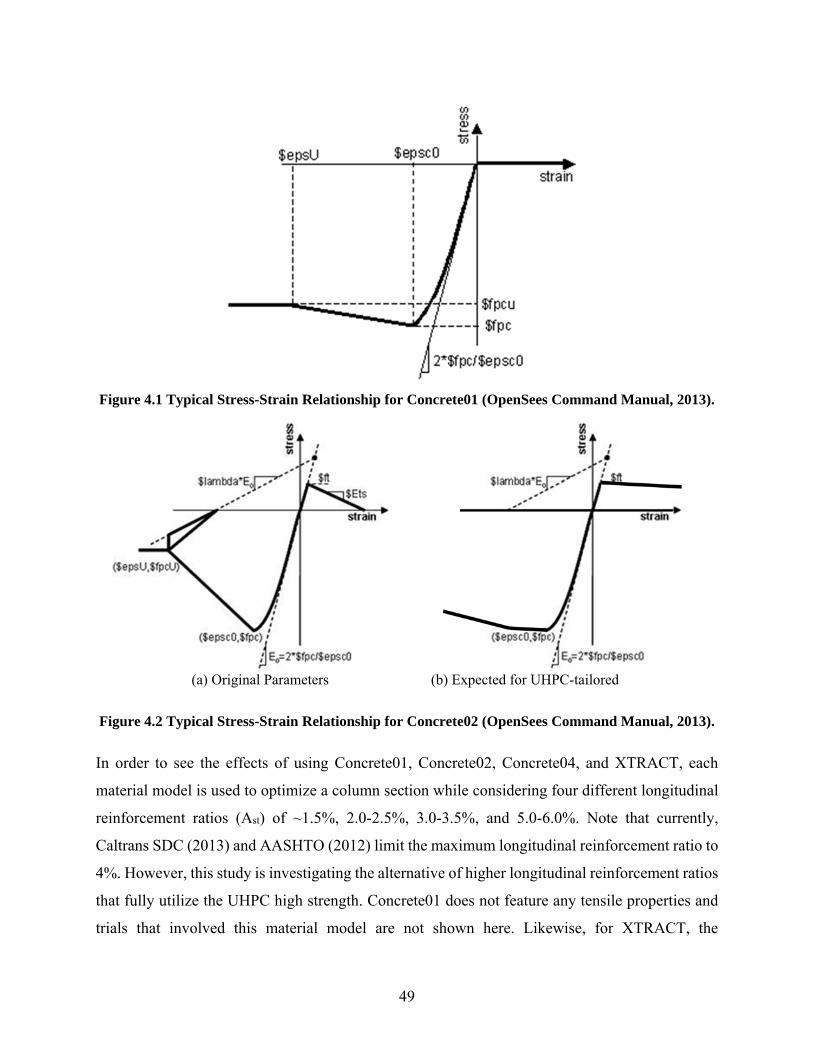
49
Figure 4.1 Typical Stress-Strain Relationship for Concrete01 (OpenSees Command Manual, 2013).
(a) Original Parameters (b) Expected for UHPC-tailored
Figure 4.2 Typical Stress-Strain Relationship for Concrete02 (OpenSees Command Manual, 2013).
In order to see the effects of using Concrete01, Concrete02, Concrete04, and XTRACT, each
material model is used to optimize a column section while considering four different longitudinal
reinforcement ratios (Ast) of ~1.5%, 2.0-2.5%, 3.0-3.5%, and 5.0-6.0%. Note that currently,
Caltrans SDC (2013) and AASHTO (2012) limit the maximum longitudinal reinforcement ratio to
4%. However, this study is investigating the alternative of higher longitudinal reinforcement ratios
that fully utilize the UHPC high strength. Concrete01 does not feature any tensile properties and
trials that involved this material model are not shown here. Likewise, for XTRACT, the
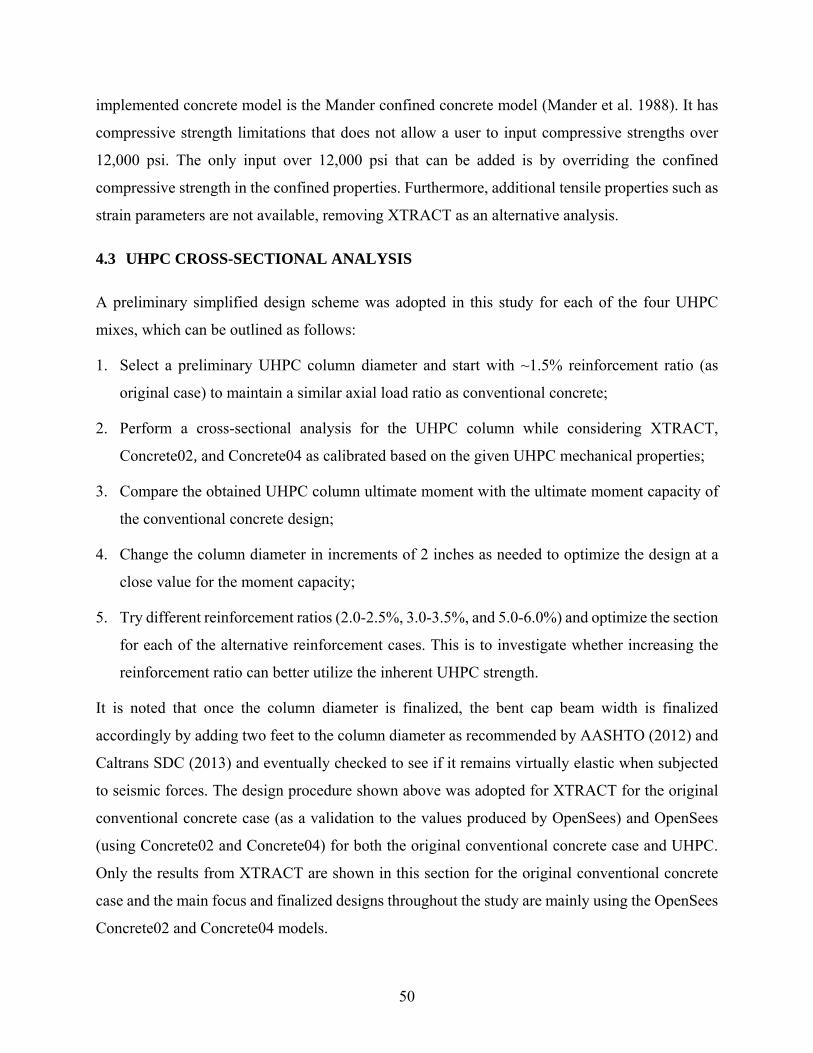
50
implemented concrete model is the Mander confined concrete model (Mander et al. 1988). It has
compressive strength limitations that does not allow a user to input compressive strengths over
12,000 psi. The only input over 12,000 psi that can be added is by overriding the confined
compressive strength in the confined properties. Furthermore, additional tensile properties such as
strain parameters are not available, removing XTRACT as an alternative analysis.
4.3 UHPC CROSS-SECTIONAL ANALYSIS
A preliminary simplified design scheme was adopted in this study for each of the four UHPC
mixes, which can be outlined as follows:
1. Select a preliminary UHPC column diameter and start with ~1.5% reinforcement ratio (as
original case) to maintain a similar axial load ratio as conventional concrete;
2. Perform a cross-sectional analysis for the UHPC column while considering XTRACT,
Concrete02, and Concrete04 as calibrated based on the given UHPC mechanical properties;
3. Compare the obtained UHPC column ultimate moment with the ultimate moment capacity of
the conventional concrete design;
4. Change the column diameter in increments of 2 inches as needed to optimize the design at a
close value for the moment capacity;
5. Try different reinforcement ratios (2.0-2.5%, 3.0-3.5%, and 5.0-6.0%) and optimize the section
for each of the alternative reinforcement cases. This is to investigate whether increasing the
reinforcement ratio can better utilize the inherent UHPC strength.
It is noted that once the column diameter is finalized, the bent cap beam width is finalized
accordingly by adding two feet to the column diameter as recommended by AASHTO (2012) and
Caltrans SDC (2013) and eventually checked to see if it remains virtually elastic when subjected
to seismic forces. The design procedure shown above was adopted for XTRACT for the original
conventional concrete case (as a validation to the values produced by OpenSees) and OpenSees
(using Concrete02 and Concrete04) for both the original conventional concrete case and UHPC.
Only the results from XTRACT are shown in this section for the original conventional concrete
case and the main focus and finalized designs throughout the study are mainly using the OpenSees
Concrete02 and Concrete04 models.
51
As discussed before, four UHPC mixes are selected and used throughout this study (Table 4-3).
Mixes with full prescribed mechanical properties are selected so that the computational
constitutive models can be defined accurately. The original NSC prototype bridge column (6 ft.
diameter with ~1.5% reinforcement ratio) is also considered for the sectional analysis to determine
its ultimate moment capacity from XTRACT and OpenSees and check it against the readily
available value from the original design document (Caltrans 2006). The obtained ultimate moment
capacity is the target for the UHPC design optimization trials. Table 4-4 tabulates the axial load
applied, reinforcing steel, ultimate moment, and curvature at the ultimate moment as obtained from
XTRACT and OpenSees. Moreover, Figure 4.3 compares the moment-curvature relationship from
both XTRACT and OpenSees.
Table 4-4 Sectional Analysis Results Using Conventional Concrete
Column Diameter 6’-0” Axial Load 1,694 kips
Longitudinal Reinforcement 26 #14
Transverse Reinforcement #8 at 5”
Ultimate Moment XTRACT: 173,700 kip-in. OpenSees: 175,905 kip-in
Curvature at Ultimate Moment XTRACT: 0.001116 1/in. OpenSees: 0.0011 1/in.
Figure 4.3 Moment-curvature results for XTRACT and OpenSees for the original conventional concrete design.
4.3.1 COLUMN DESIGN OPTIMIZATION
Using the design scheme explained before, the final optimized results of the sectional analysis for
each UHPC mix design and for each varying longitudinal steel ratio when Concrete02 is used is
listed in Table 4-5. Moreover, Figure 4.4 illustrates the obtained moment-curvature relationships
52
for all optimized UHPC sections as compared to the NSC original design (that used a nominal
4,000 psi concrete compressive strength). Four different ranges for the longitudinal steel ratios are
considered as mentioned before (~1.5%, 2.0-2.5%, 3.0-3.5%, and 5.0-6.0%) and shown in the
results. Similarly, Concrete04 was used to define the UHPC concrete material model and optimize
the design cases for different UHPC mixes and varying reinforcement ratios. Table 4-6
summarizes the Concrete04-based designs and Figure 4.5 shows all its corresponding moment-
curvature relationships. It should be noted that the different UHPC mixes are identified in the
figures using their reported 28-day strength and that the figures feature the final optimized column
diameter for all the different design cases. The results show that the original 6’-0” NSC column
can be reduced to 4’-2” when UHPC is used with 3.0-3.5% steel reinforcement ratios. When
reinforcement ratios between 5.0-6.0% is selected for Concrete02 and Concrete04, the column
diameter reaches its most optimized value, averaging 4’-0” regardless of compressive strength.
This would imply that the concrete no longer has any effect and that only the steel reinforcement
is being utilized. The moment curvatures shown in Figure 4.4 and 4.5 display a post-peak
degradation for the UHPC designs while the conventional concrete continuously hardens. This is
due to the material model defined for UHPC which includes linear and exponential tensile
softening for Concrete02 and Concrete04 respectively, a material property not defined for the
conventional concrete case. It is suggested for future studies to further investigate higher
reinforcement ratios in the 3.0-3.5% range (or even higher) for the most ideal reinforcement ratio
for the most optimized results. UHPC is expected to provide strain compatibility up to higher strain
levels than what is needed to rupture the reinforcing bars according to the current designs. Thus,
much higher reinforcement ratios or potential use of high strength steel should be considered in
future studies for further optimization.

53
Table 4-5 Optimized Concrete02 Column Design and Section Analysis Results
Property Original UHPC 1 UHPC 2 UHPC 3 UHPC 4
f’c (psi) 4,000 17,260 21,147 28,900 36,360
ft (psi) - 1,300 1,500* 1,700 2,611
Ast≅1.5%
Column Diameter 6’-0” 5’-2” 5’-0” 4’-10” 4’-6”
Bent Cap Width 8’-0” 7’-2” 7’-0” 6’-10” 6’-6”
Column Longitudinal Reinforcement 26 #14 28 #11 28 #11 28 #11 22 #11
Column Transverse Reinforcement #8 at 5” #5 at 5” #5 at 5” #5 at 5” #5 at 5”
Actual Column Steel Percentage 1.44% 1.45% 1.54% 1.65% 1.50%
Ultimate Moment (kip-in) 176,911 178,136 177,013 178,473 177,536
Curvature at Ultimate Moment (1/in.) 0.001120 0.00016 0.00018 0.00018 0.00016
Ast≅2.0-2.5%
Column Diameter 6’-0” 4’-10” 4’-8” 4’-8” 4’-4”
Bent Cap Width 8’-0” 6’-10” 6’-8” 6’-8” 6’-4”
Column Longitudinal Reinforcement 26 #14 26 #14 28 #14 24 #14 22 #14
Column Transverse Reinforcement #8 at 5” #5 at 5” #5 at 5” #5 at 5” #5 at 5”
Actual Column Steel Percentage 1.44% 2.21% 2.56% 2.19% 2.33%
Ultimate Moment (kip-in) 176,911 182,065 179,394 179,508 180,684
Curvature at Ultimate Moment (1/in.) 0.001120 0.00024 0.00026 0.0002 0.0002
Ast≅3.0-3.5%
Column Diameter 6’-0” 4’-8” 4’-6” 4’-4” 4’-2”
Bent Cap Width 8’-0” 6’-8” 6’-6” 6’-4” 6’-2”
Column Longitudinal Reinforcement 26 #14 32 #14 32 #14 32 #14 30 #14
Column Transverse Reinforcement #8 at 5” #5 at 5” #5 at 5” #5 at 5” #5 at 5”
Actual Column Steel Percentage 1.44% 2.92% 3.14% 3.39% 3.44%
Ultimate Moment (kip-in) 176,911 182,773 179,553 178,426 186,882
Curvature at Ultimate Moment (1/in.) 0.001120 0.00026 0.0003 0.00028 0.00024
Ast≅5.0-6.0%
Column Diameter 6’-0” 4’-0” 4’-0” 4’-0” 3’-10”
Bent Cap Width 8’-0” 6’-0” 6’-0” 6’-0” 5’-10”
Column Longitudinal Reinforcement 26 #14 26 #18 26 #18 24 #18 22 #18
Column Transverse Reinforcement #8 at 5” #5 at 5” #5 at 5” #5 at 5” #5 at 5”
Actual Column Steel Percentage 1.44% 5.75% 5.75% 5.31% 5.30%
Ultimate Moment (kip-in) 176,911 184,758 187,347 182,755 180,330
Curvature at Ultimate Moment (1/in.) 0.001120 0.01792 0.01127 0.00798 0.00035

54
Figure 4.4 Concrete02-Based Moment Curvature Relationships for all UHPC Cases Along with Different Longitudinal Steel Ratios: (a) Ast≅1.5% (b) Ast≅2.0-2.5% (c) Ast≅3.0-3.5% (d) Ast≅5.0-
6.0%.
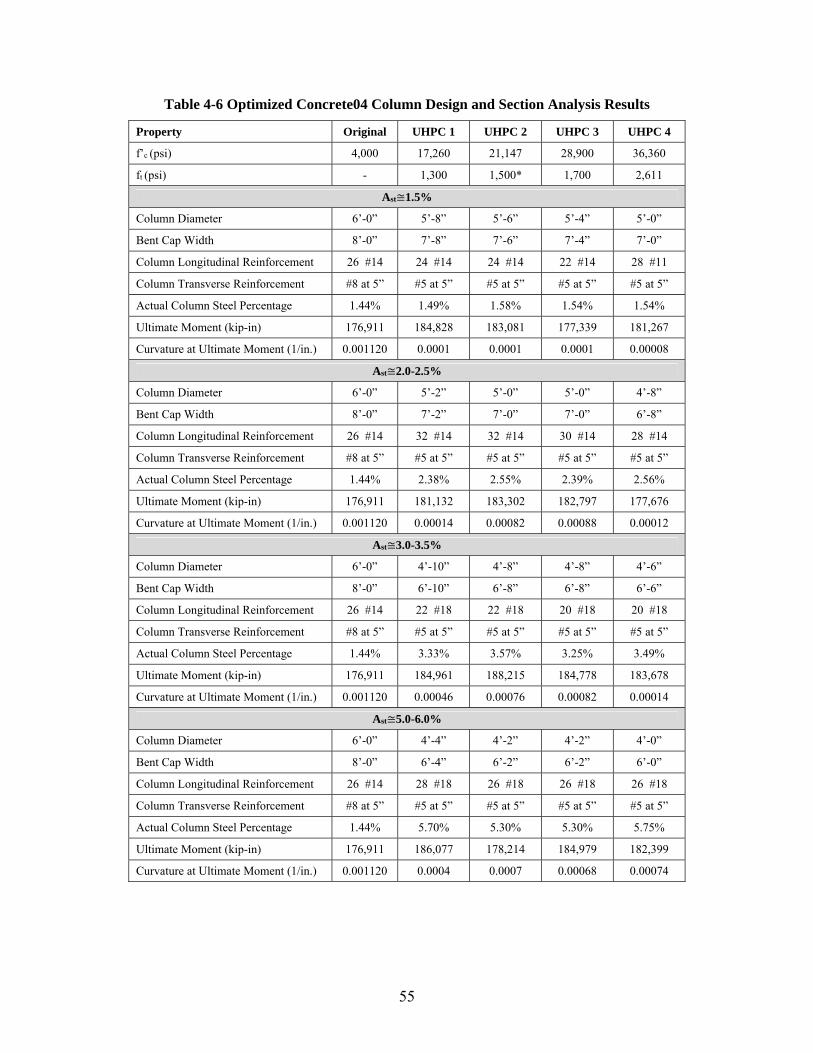
55
Table 4-6 Optimized Concrete04 Column Design and Section Analysis Results
Property Original UHPC 1 UHPC 2 UHPC 3 UHPC 4
f’c (psi) 4,000 17,260 21,147 28,900 36,360
ft (psi) - 1,300 1,500* 1,700 2,611
Ast≅1.5%
Column Diameter 6’-0” 5’-8” 5’-6” 5’-4” 5’-0”
Bent Cap Width 8’-0” 7’-8” 7’-6” 7’-4” 7’-0”
Column Longitudinal Reinforcement 26 #14 24 #14 24 #14 22 #14 28 #11
Column Transverse Reinforcement #8 at 5” #5 at 5” #5 at 5” #5 at 5” #5 at 5”
Actual Column Steel Percentage 1.44% 1.49% 1.58% 1.54% 1.54%
Ultimate Moment (kip-in) 176,911 184,828 183,081 177,339 181,267
Curvature at Ultimate Moment (1/in.) 0.001120 0.0001 0.0001 0.0001 0.00008
Ast≅2.0-2.5%
Column Diameter 6’-0” 5’-2” 5’-0” 5’-0” 4’-8”
Bent Cap Width 8’-0” 7’-2” 7’-0” 7’-0” 6’-8”
Column Longitudinal Reinforcement 26 #14 32 #14 32 #14 30 #14 28 #14
Column Transverse Reinforcement #8 at 5” #5 at 5” #5 at 5” #5 at 5” #5 at 5”
Actual Column Steel Percentage 1.44% 2.38% 2.55% 2.39% 2.56%
Ultimate Moment (kip-in) 176,911 181,132 183,302 182,797 177,676
Curvature at Ultimate Moment (1/in.) 0.001120 0.00014 0.00082 0.00088 0.00012
Ast≅3.0-3.5%
Column Diameter 6’-0” 4’-10” 4’-8” 4’-8” 4’-6”
Bent Cap Width 8’-0” 6’-10” 6’-8” 6’-8” 6’-6”
Column Longitudinal Reinforcement 26 #14 22 #18 22 #18 20 #18 20 #18
Column Transverse Reinforcement #8 at 5” #5 at 5” #5 at 5” #5 at 5” #5 at 5”
Actual Column Steel Percentage 1.44% 3.33% 3.57% 3.25% 3.49%
Ultimate Moment (kip-in) 176,911 184,961 188,215 184,778 183,678
Curvature at Ultimate Moment (1/in.) 0.001120 0.00046 0.00076 0.00082 0.00014
Ast≅5.0-6.0%
Column Diameter 6’-0” 4’-4” 4’-2” 4’-2” 4’-0”
Bent Cap Width 8’-0” 6’-4” 6’-2” 6’-2” 6’-0”
Column Longitudinal Reinforcement 26 #14 28 #18 26 #18 26 #18 26 #18
Column Transverse Reinforcement #8 at 5” #5 at 5” #5 at 5” #5 at 5” #5 at 5”
Actual Column Steel Percentage 1.44% 5.70% 5.30% 5.30% 5.75%
Ultimate Moment (kip-in) 176,911 186,077 178,214 184,979 182,399
Curvature at Ultimate Moment (1/in.) 0.001120 0.0004 0.0007 0.00068 0.00074

56
Figure 4.5 Concrete04-Based Moment Curvature Relationships for all UHPC Cases Along with Different Longitudinal Steel Ratios: (a) Ast≅1.5% (b) Ast≅2.0-2.5% (c) Ast≅3.0-3.5% (d) Ast≅5.0-
6.0%.
4.3.2 CAP BEAM DESIGN OPTIMIZATION
Following the finalized UHPC column designs, the bent cap beam design width is finalized by
adding 2.0 ft. to the column diameter. An iterative procedure was also used to check whether a
slight reduction in the depth of the cap beam can be obtained while maintaining the same ultimate
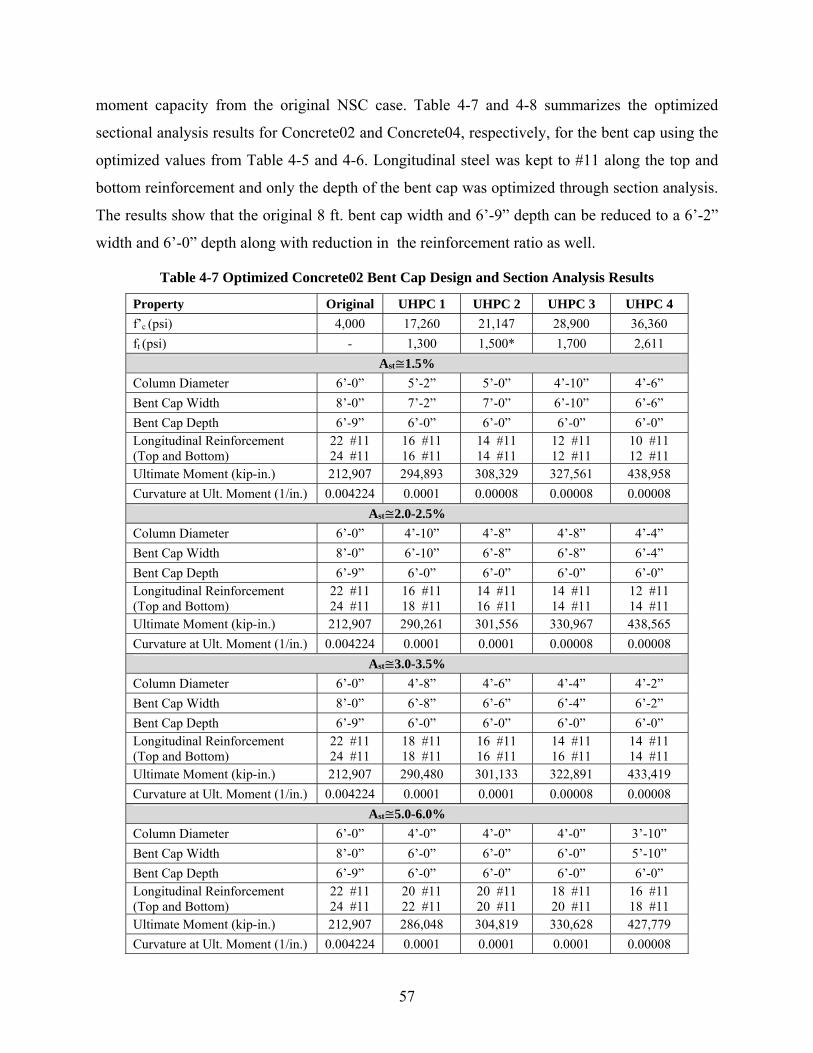
57
moment capacity from the original NSC case. Table 4-7 and 4-8 summarizes the optimized
sectional analysis results for Concrete02 and Concrete04, respectively, for the bent cap using the
optimized values from Table 4-5 and 4-6. Longitudinal steel was kept to #11 along the top and
bottom reinforcement and only the depth of the bent cap was optimized through section analysis.
The results show that the original 8 ft. bent cap width and 6’-9” depth can be reduced to a 6’-2”
width and 6’-0” depth along with reduction in the reinforcement ratio as well.
Table 4-7 Optimized Concrete02 Bent Cap Design and Section Analysis Results
Property Original UHPC 1 UHPC 2 UHPC 3 UHPC 4
f’c (psi) 4,000 17,260 21,147 28,900 36,360
ft (psi) - 1,300 1,500* 1,700 2,611
Ast≅1.5%
Column Diameter 6’-0” 5’-2” 5’-0” 4’-10” 4’-6”
Bent Cap Width 8’-0” 7’-2” 7’-0” 6’-10” 6’-6”
Bent Cap Depth 6’-9” 6’-0” 6’-0” 6’-0” 6’-0” Longitudinal Reinforcement (Top and Bottom)
22 #11 24 #11
16 #11 16 #11
14 #11 14 #11
12 #11 12 #11
10 #11 12 #11
Ultimate Moment (kip-in.) 212,907 294,893 308,329 327,561 438,958
Curvature at Ult. Moment (1/in.) 0.004224 0.0001 0.00008 0.00008 0.00008
Ast≅2.0-2.5%
Column Diameter 6’-0” 4’-10” 4’-8” 4’-8” 4’-4”
Bent Cap Width 8’-0” 6’-10” 6’-8” 6’-8” 6’-4”
Bent Cap Depth 6’-9” 6’-0” 6’-0” 6’-0” 6’-0” Longitudinal Reinforcement (Top and Bottom)
22 #11 24 #11
16 #11 18 #11
14 #11 16 #11
14 #11 14 #11
12 #11 14 #11
Ultimate Moment (kip-in.) 212,907 290,261 301,556 330,967 438,565
Curvature at Ult. Moment (1/in.) 0.004224 0.0001 0.0001 0.00008 0.00008
Ast≅3.0-3.5%
Column Diameter 6’-0” 4’-8” 4’-6” 4’-4” 4’-2”
Bent Cap Width 8’-0” 6’-8” 6’-6” 6’-4” 6’-2”
Bent Cap Depth 6’-9” 6’-0” 6’-0” 6’-0” 6’-0” Longitudinal Reinforcement (Top and Bottom)
22 #11 24 #11
18 #11 18 #11
16 #11 16 #11
14 #11 16 #11
14 #11 14 #11
Ultimate Moment (kip-in.) 212,907 290,480 301,133 322,891 433,419
Curvature at Ult. Moment (1/in.) 0.004224 0.0001 0.0001 0.00008 0.00008
Ast≅5.0-6.0%
Column Diameter 6’-0” 4’-0” 4’-0” 4’-0” 3’-10”
Bent Cap Width 8’-0” 6’-0” 6’-0” 6’-0” 5’-10”
Bent Cap Depth 6’-9” 6’-0” 6’-0” 6’-0” 6’-0” Longitudinal Reinforcement (Top and Bottom)
22 #11 24 #11
20 #11 22 #11
20 #11 20 #11
18 #11 20 #11
16 #11 18 #11
Ultimate Moment (kip-in.) 212,907 286,048 304,819 330,628 427,779
Curvature at Ult. Moment (1/in.) 0.004224 0.0001 0.0001 0.0001 0.00008

58
Table 4-8 Optimized Concrete04 Bent Cap Design and Section Analysis Results
Property Original UHPC 1 UHPC 2 UHPC 3 UHPC 4
f’c (psi) 4,000 17,260 21,147 28,900 36,360
ft (psi) - 1,300 1,500* 1,700 2,611
Ast≅1.5%
Column Diameter 6’-0” 5’-8” 5’-6” 5’-4” 5’-0”
Bent Cap Width 8’-0” 7’-8” 7’-6” 7’-4” 7’-0”
Bent Cap Depth 6’-9” 6’-0” 6’-0” 6’-0” 6’-0”
Longitudinal Reinforcement (Top and Bottom)
22 #11 24 #11
22 #11 22 #11
18 #11 18 #11
16 #11 18 #11
16 #11 16 #11
Ultimate Moment (kip-in.) 212,907 248,489 249,943 267,694 357,959
Curvature at Ult. Moment (1/in.) 0.004224 0.00006 0.00006 0.00004 0.00004
Ast≅2.0-2.5%
Column Diameter 6’-0” 5’-2” 5’-0” 5’-0” 4’-8”
Bent Cap Width 8’-0” 7’-2” 7’-0” 7’-0” 6’-8”
Bent Cap Depth 6’-9” 6’-0” 6’-0” 6’-0” 6’-0”
Longitudinal Reinforcement (Top and Bottom)
22 #11 24 #11
24 #11 24 #11
18 #11 18 #11
16 #11 18 #11
16 #11 16 #11
Ultimate Moment (kip-in.) 212,907 246,131 238,203 257,603 342,852
Curvature at Ult. Moment (1/in.) 0.004224 0.00006 0.00006 0.00004 0.00004
Ast≅3.0-3.5%
Column Diameter 6’-0” 4’-10” 4’-8” 4’-8” 4’-6”
Bent Cap Width 8’-0” 6’-10” 6’-8” 6’-8” 6’-6”
Bent Cap Depth 6’-9” 6’-0” 6’-0” 6’-0” 6’-0”
Longitudinal Reinforcement (Top and Bottom)
22 #11 24 #11
26 #11 26 #11
22 #11 22 #11
20 #11 20 #11
16 #11 18 #11
Ultimate Moment (kip-in.) 212,907 247,051 245,893 260,871 337,636
Curvature at Ult. Moment (1/in.) 0.004224 0.00008 0.00006 0.00006 0.00004
Ast≅5.0-6.0%
Column Diameter 6’-0” 4’-4” 4’-2” 4’-2” 4’-0”
Bent Cap Width 8’-0” 6’-4” 6’-2” 6’-2” 6’-0”
Bent Cap Depth 6’-9” 6’-0” 6’-0” 6’-0” 6’-0”
Longitudinal Reinforcement (Top and Bottom)
22 #11 24 #11
28 #11 28 #11
24 #11 24 #11
22 #11 22 #11
20 #11 20 #11
Ultimate Moment (kip-in.) 212,907 247,552 253,549 255,389 323,296
Curvature at Ult. Moment (1/in.) 0.004224 0.00008 0.00006 0.00006 0.00006
59
5 Seismic Analysis of UHPC Substructure
This chapter provides the seismic analysis results and discussion for the NSC and UHPC bridge
piers. Nonlinear pushover and time history analyses are conducted to compare the seismic behavior
of UHPC bridge piers against conventional NSC piers. The analysis also aims at finalizing the
UHPC pier design, where a capacity check is required for the bent caps.
5.1 DESIGN PHILOSOPHY OF BRIDGES
AASHTO 3.10.1 (2012) states that, “Bridges shall be designed to have a low probability of
collapse but may suffer significant damage and disruption to service when subject to earthquake
ground motions.” This design philosophy keeps the costs of the bridge practical while keeping life
safety at the highest priority. If higher levels of performance are required, the bridge owner must
give the authorization for that design. The general design philosophy of bridges begins with
selecting where you want the damage to occur under seismic loading. All other elements shall be
shall be protected from failure and remain essentially elastic. Caltrans SDC 3.4 (2013) states that
while damage is allowed in columns, capacity protected concrete components include footings,
Type II shafts, bent cap beams, column joints at the footing and bent cap, and the superstructure.
The columns shall have a ductile design (to resist smaller loads without having to do immediate
repairs) and selected as the component where damage shall occur for larger seismic events. The
bridge columns require a plastic hinging system to dissipate the earthquake energy when the
columns begin to experience non-linear effects. Plastic hinging is required to form just beneath the
bent cap at the column for multi-column bents, where columns are pinned at the footings. This is
achieved by assuring that the bent cap and various capacity protected components remain
essentially elastic. This location of the plastic hinge also allows for easy inspection of the columns
after a large seismic event. If plastic hinging forms anywhere else such as the superstructure, the
superstructure can lose jacking forces in its post-tensioned system, for instance, making the bridge
susceptible to catastrophic failure. To guarantee the desired essentially elastic behavior during a
severe earthquake event, the capacity protected members design is checked against an overstrength
column moment capacity, which is 1.2 times the ultimate plastic moment of the column determined
from sectional analysis. An alternative approach for the capacity check, which is adopted in this
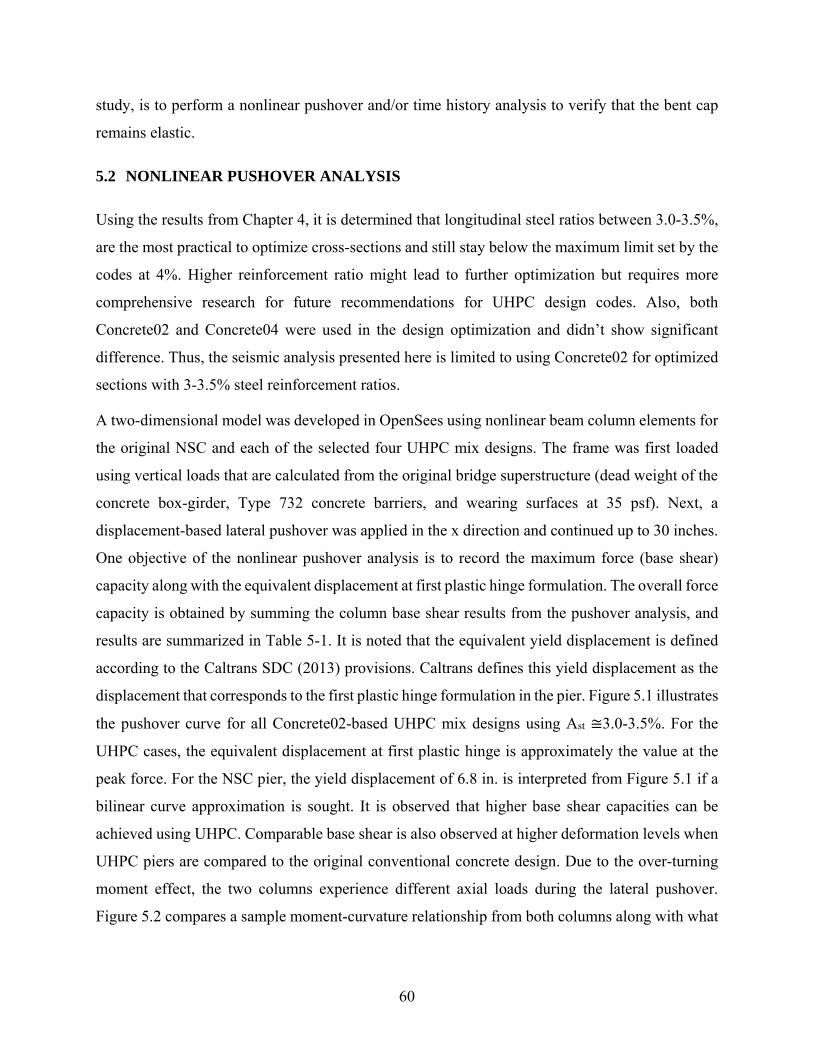
60
study, is to perform a nonlinear pushover and/or time history analysis to verify that the bent cap
remains elastic.
5.2 NONLINEAR PUSHOVER ANALYSIS
Using the results from Chapter 4, it is determined that longitudinal steel ratios between 3.0-3.5%,
are the most practical to optimize cross-sections and still stay below the maximum limit set by the
codes at 4%. Higher reinforcement ratio might lead to further optimization but requires more
comprehensive research for future recommendations for UHPC design codes. Also, both
Concrete02 and Concrete04 were used in the design optimization and didn’t show significant
difference. Thus, the seismic analysis presented here is limited to using Concrete02 for optimized
sections with 3-3.5% steel reinforcement ratios.
A two-dimensional model was developed in OpenSees using nonlinear beam column elements for
the original NSC and each of the selected four UHPC mix designs. The frame was first loaded
using vertical loads that are calculated from the original bridge superstructure (dead weight of the
concrete box-girder, Type 732 concrete barriers, and wearing surfaces at 35 psf). Next, a
displacement-based lateral pushover was applied in the x direction and continued up to 30 inches.
One objective of the nonlinear pushover analysis is to record the maximum force (base shear)
capacity along with the equivalent displacement at first plastic hinge formulation. The overall force
capacity is obtained by summing the column base shear results from the pushover analysis, and
results are summarized in Table 5-1. It is noted that the equivalent yield displacement is defined
according to the Caltrans SDC (2013) provisions. Caltrans defines this yield displacement as the
displacement that corresponds to the first plastic hinge formulation in the pier. Figure 5.1 illustrates
the pushover curve for all Concrete02-based UHPC mix designs using Ast ≅3.0-3.5%. For the
UHPC cases, the equivalent displacement at first plastic hinge is approximately the value at the
peak force. For the NSC pier, the yield displacement of 6.8 in. is interpreted from Figure 5.1 if a
bilinear curve approximation is sought. It is observed that higher base shear capacities can be
achieved using UHPC. Comparable base shear is also observed at higher deformation levels when
UHPC piers are compared to the original conventional concrete design. Due to the over-turning
moment effect, the two columns experience different axial loads during the lateral pushover.
Figure 5.2 compares a sample moment-curvature relationship from both columns along with what

61
was obtained from the sectional analysis. This figure shows that the sectional analysis results is an
average estimate of the two laterally loaded columns as expected.
Another objective of the pushover analysis is to finalize the design of the full pier by checking the
optimized bent cap beam sections, i.e. satisfy the required Caltrans capacity check. It is observed
for all UHPC design cases that the cap beam remains linear elastic while all the damage takes place
in the columns as desired. Figure 5.3 shows a sample moment curvature response for UHPC 3 cap
beam as resulting from the pushover analysis. The figure shows very small curvature values and
the beam is essentially elastic as per Caltrans SDC provisions (2013).
Table 5-1 Final cross-sections and OpenSees pushover results using Concrete02 (Ast≅3.0-3.5%)
Property Original UHPC 1 UHPC 2 UHPC 3 UHPC 4 f’c (psi) 4,000 17,260 21,147 28,900 36,360
Column Diameter 6’-0” 4’-8” 4’-6” 4’-4” 4’-2” Bent Cap Width 8’-0” 6’-8” 6’-6” 6’-4” 6’-2” Bent Cap Depth 6’-9” 6’-0” 6’-0” 6’-0” 6’-0”
Column Section Analysis Results Ultimate Moment (kip-in) 176,911 182,773 179,553 178,426 186,882
Bent Cap Section Analysis Results Ultimate Moment (kip-in) 212,907 290,480 301,133 322,891 433,419
Pushover Analysis Results Pier Maximum Force (kip) 577.50 712.17 695.31 693.08 734.94
Equivalent Yield Deformation, ∆y (in.) 6.80 7.571 8.136 7.878 7.220
Figure 5.1 Pushover curve for NSC and UHPC bents with column reinforcement Ast ≅ 3.0-3.5%.

62
Figure 5.2 Sample moment-curvature relationship for UHPC 3 bent columns (Ast ≅3.0-3.5%) as
obtained from the OpenSees pushover and sectional analysis using Concrete02.
Figure 5.3 Sample moment-curvature relationship for UHPC 3 bent cap beam as obtained from the
OpenSees pushover analysis using Concrete02.
5.3 NONLINEAR TIME HISTORY ANALYSIS
A nonlinear time history (response) analysis (NTHA) was performed and presented in this section
for the cases that used Concrete02 with column reinforcement Ast ≅3.0-3.5%. The objective of
NTHA is to investigate the actual dynamic and seismic behavior of UHPC piers in the transverse
direction under actual ground motions. The longitudinal direction was not considered because the
overall bridge designs will dictate the longitudinal force and reactions.
-250000
-200000
-150000
-100000
-50000
0
-0.0001 -0.00008 -0.00006 -0.00004 -0.00002 0
Mom
ent (
kip-
in.)
Curvature (1/in.)

63
5.3.1 GROUND MOTIONS
The Caltrans design response spectrum used for the original conventional concrete prototype
bridge design is utilized in this study to select four different ground motions for the NTHA. This
design spectrum is inputted into the Pacific Earthquake Engineering Research Center (PEER)
Ground Motion Database and NGA-2 tool (2015) to select ground motions that best match the
input response spectrum. Table 5-2 shows the list of the selected ground motions for the NTHA
that best match the Caltrans design level earthquake (DLE) spectrum. The conducted NTHA in
this study also considered the maximum considered earthquake (MCE) level ground motions,
which is 1.5 times the corresponding DLE ground motions. Figure 5.4 plots the response spectra
of the selected DLE ground motions along with their mean spectrum and the inputted Caltrans
design spectrum (used for the original prototype bridge design).
Table 5-2 Selected Ground Motion Records for NTHAs
Earthquake Name Year Magnitude Record
Sequence Number
Station Name Scale
Factor (DLE)
Scale Factor (MCE)
Duration (sec)
Imperial Valley-02 1940 6.95 RSN 6 El Centro Array #9 2.393 3.590 54
San Fernando 1971 6.61 RSN 68 LA – Hollywood
Store FF 3.195 4.792 80
San Fernando 1971 6.61 RSN 77 Pacoima Dam
(Upper Left Abut) 0.902 1.353 42
Managua_Nicaragua-02
1972 5.2 RSN 96 Managua_ESSO 3.570 5.354 48
Figure 5.4 Response spectra of the selected records and Caltrans design spectrum (5% damping).
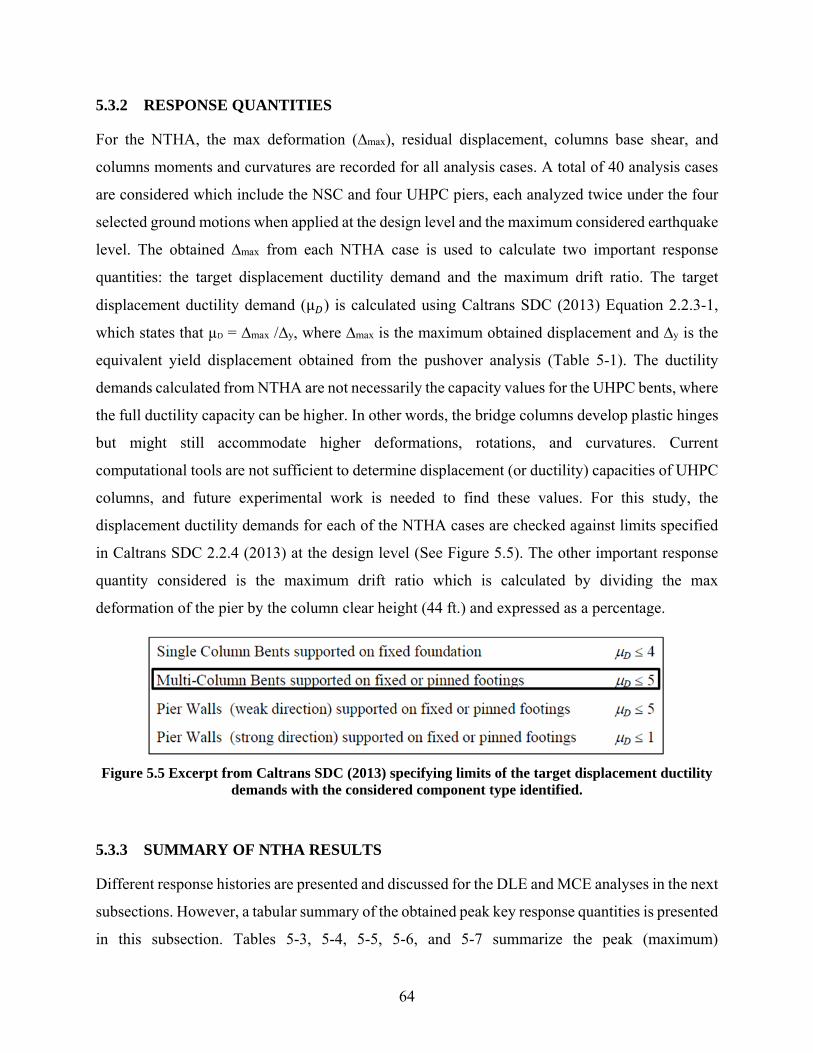
64
5.3.2 RESPONSE QUANTITIES
For the NTHA, the max deformation (∆max), residual displacement, columns base shear, and
columns moments and curvatures are recorded for all analysis cases. A total of 40 analysis cases
are considered which include the NSC and four UHPC piers, each analyzed twice under the four
selected ground motions when applied at the design level and the maximum considered earthquake
level. The obtained ∆max from each NTHA case is used to calculate two important response
quantities: the target displacement ductility demand and the maximum drift ratio. The target
displacement ductility demand (μ ) is calculated using Caltrans SDC (2013) Equation 2.2.3-1,
which states that µD = ∆max /∆y, where ∆max is the maximum obtained displacement and ∆y is the
equivalent yield displacement obtained from the pushover analysis (Table 5-1). The ductility
demands calculated from NTHA are not necessarily the capacity values for the UHPC bents, where
the full ductility capacity can be higher. In other words, the bridge columns develop plastic hinges
but might still accommodate higher deformations, rotations, and curvatures. Current
computational tools are not sufficient to determine displacement (or ductility) capacities of UHPC
columns, and future experimental work is needed to find these values. For this study, the
displacement ductility demands for each of the NTHA cases are checked against limits specified
in Caltrans SDC 2.2.4 (2013) at the design level (See Figure 5.5). The other important response
quantity considered is the maximum drift ratio which is calculated by dividing the max
deformation of the pier by the column clear height (44 ft.) and expressed as a percentage.
Figure 5.5 Excerpt from Caltrans SDC (2013) specifying limits of the target displacement ductility
demands with the considered component type identified.
5.3.3 SUMMARY OF NTHA RESULTS
Different response histories are presented and discussed for the DLE and MCE analyses in the next
subsections. However, a tabular summary of the obtained peak key response quantities is presented
in this subsection. Tables 5-3, 5-4, 5-5, 5-6, and 5-7 summarize the peak (maximum)

65
displacements, ductility demands, maximum drift ratios, residual displacements, and maximum
base shears, respectively, generated for all NTHA (DLE and MCE) cases. The overall observation
is that UHPC piers experience less peak displacements and have less ductility demands. The
maximum obtained base shear is the same as the pier’s force capacity determined from pushover
analysis (Table 5-1) for all the cases, which means that the NSC and UHPC bridge piers reaches
its capacity for all DLE and MCE cases. However, the DLE cases show lower displacement values,
less residual displacement, and lower ductility demands than the MCE for NSC and all UHPC
cases as expected. For a force-based design approach, all NSC and UHPC pier columns are
expected to reach their force capacity, which does not favor UHPC seismic behavior to NSC.
However, the lower displacements demands on UHPC promises favorable seismic response if
bridge piers are designed using a displacement-based or a performance-based approach. If so,
future research will be needed to properly determine UHPC pier displacement capacities to enable
accurate prospect performance-based design.
Table 5-3 Summary of NTHA Maximum Displacements (in.)
RSN 6 RSN 68 RSN 77 RSN 96
DLE MCE DLE MCE DLE MCE DLE MCE Original 16.394 19.986 10.719 19.111 12.683 21.427 14.766 26.494
UHPC 1 11.941 19.250 9.827 18.228 12.280 18.900 11.068 21.383
UHPC 2 12.972 19.043 9.521 17.738 12.620 19.080 11.912 22.993
UHPC 3 12.959 18.701 9.533 17.741 12.473 19.052 11.371 21.942
UHPC 4 12.265 18.853 9.492 18.346 13.059 18.870 10.721 20.953
Table 5-4 Summary of NTHA Ductility Demands
RSN 6 RSN 68 RSN 77 RSN 96
DLE MCE DLE MCE DLE MCE DLE MCE Original 2.411 2.939 1.576 2.810 1.865 3.151 2.171 3.896
UHPC 1 1.577 2.543 1.298 2.408 1.622 2.496 1.462 2.824
UHPC 2 1.594 2.341 1.170 2.180 1.551 2.345 1.464 2.826
UHPC 3 1.645 2.374 1.210 2.252 1.583 2.418 1.443 2.785
UHPC 4 1.699 2.611 1.315 2.541 1.809 2.614 1.485 2.902
Table 5-5 Summary of NTHA Maximum Drift Ratios
RSN 6 RSN 68 RSN 77 RSN 96
DLE MCE DLE MCE DLE MCE DLE MCE Original 3.10% 3.79% 2.03% 3.62% 2.40% 4.06% 2.80% 5.02%
UHPC 1 2.26% 3.65% 1.86% 3.45% 2.33% 3.58% 2.10% 4.05%
UHPC 2 2.46% 3.61% 1.80% 3.36% 2.39% 3.61% 2.26% 4.35%
UHPC 3 2.45% 3.54% 1.81% 3.36% 2.36% 3.61% 2.15% 4.16%
UHPC 4 2.32% 3.57% 1.80% 3.47% 2.47% 3.57% 2.03% 3.97%

66
Table 5-6 Summary of NTHA Residual Displacements (in.)
RSN 6 RSN 68 RSN 77 RSN 96
DLE MCE DLE MCE DLE MCE DLE MCE
Original 3.519 6.478 2.022 1.757 0.877 7.016 0.270 7.177
UHPC 1 0.881 3.971 0.489 1.033 0.456 3.570 0.017 2.378
UHPC 2 1.100 4.644 0.536 0.551 0.547 3.407 0.092 3.008
UHPC 3 1.079 4.551 0.473 0.593 0.562 3.329 0.163 2.451
UHPC 4 1.012 4.918 0.399 0.998 0.807 3.683 0.314 1.977
Table 5-7 Summary of NTHA Maximum Base Shears (kip)
25 RSN 6 RSN 68 RSN 77 RSN 96
DLE MCE DLE MCE DLE MCE DLE MCE
Original 574.05 575.60 559.69 585.42 566.68 577.01 574.05 582.08
UHPC 1 707.83 696.40 697.48 709.63 712.54 710.87 710.80 711.60
UHPC 2 690.48 685.61 684.90 691.57 695.78 694.02 693.92 694.30
UHPC 3 687.30 678.04 677.92 688.26 693.50 691.89 691.80 692.07
UHPC 4 726.653 721.55 725.33 721.75 735.66 734.41 733.01 732.34
5.3.4 DETAILED ANALYSIS RESULTS: DESIGN LEVEL EARTHQUAKE
This subsection presents the different response histories of the different UHPC piers as compared
to the NSC under the four DLE ground motions. Figures 5.6 through 5.9 show the displacement
history for each of the four ground motions. Figures 5.10 through 5.13 show the force-
displacement (hysteresis) relationships for each DLE ground motion. As shown from the
displacement histories, the maximum displacements for the UHPC designs are consistently lower
when compared to the original conventional concrete design with lower residual displacements
overall. The displacement ductility demands all satisfied the limits specified in SDC 2.2.4 (μ < 5)
and the drift ratios for each DLE ground motion averaged between 2-3%. The forces from the
hysteresis diagrams are also consistent with the results from the pushover analysis, i.e. indicating
the bridge pier reaching its capacity.

67
Figure 5.6 Displacement history for RSN 6 (Design Level) for (a) UHPC 1, (b) UHPC 2, (c) UHPC 3, and (d) UHPC 4
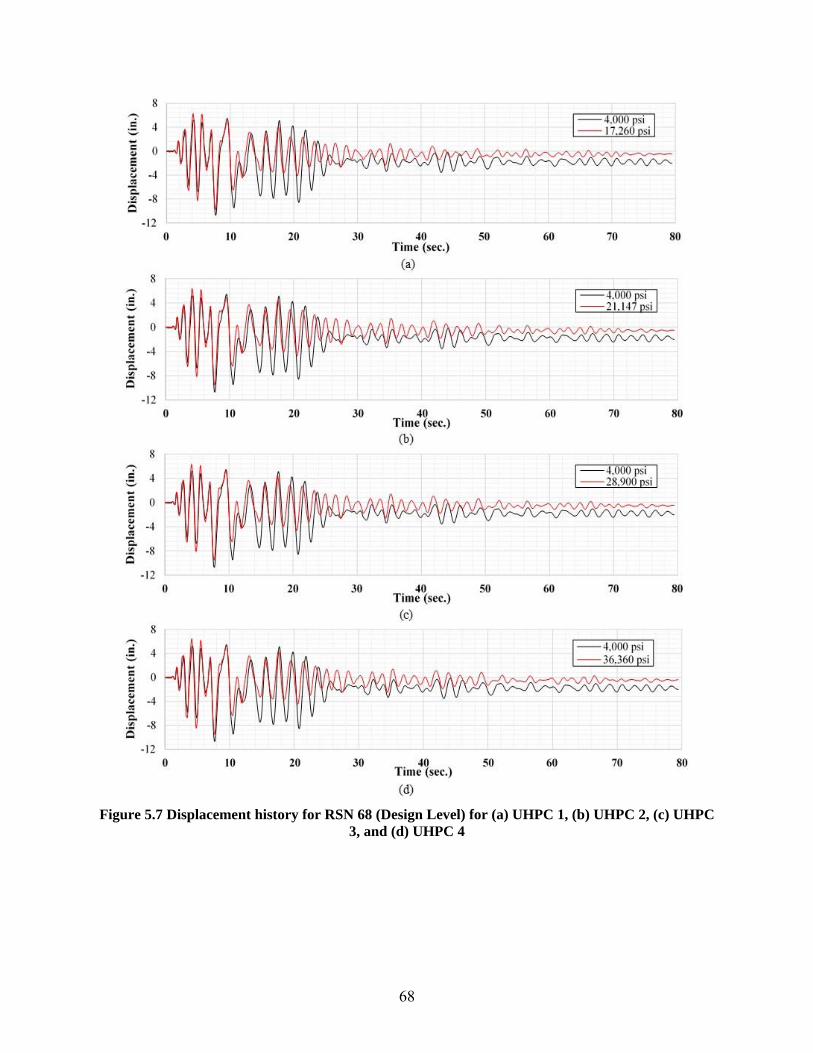
68
Figure 5.7 Displacement history for RSN 68 (Design Level) for (a) UHPC 1, (b) UHPC 2, (c) UHPC 3, and (d) UHPC 4
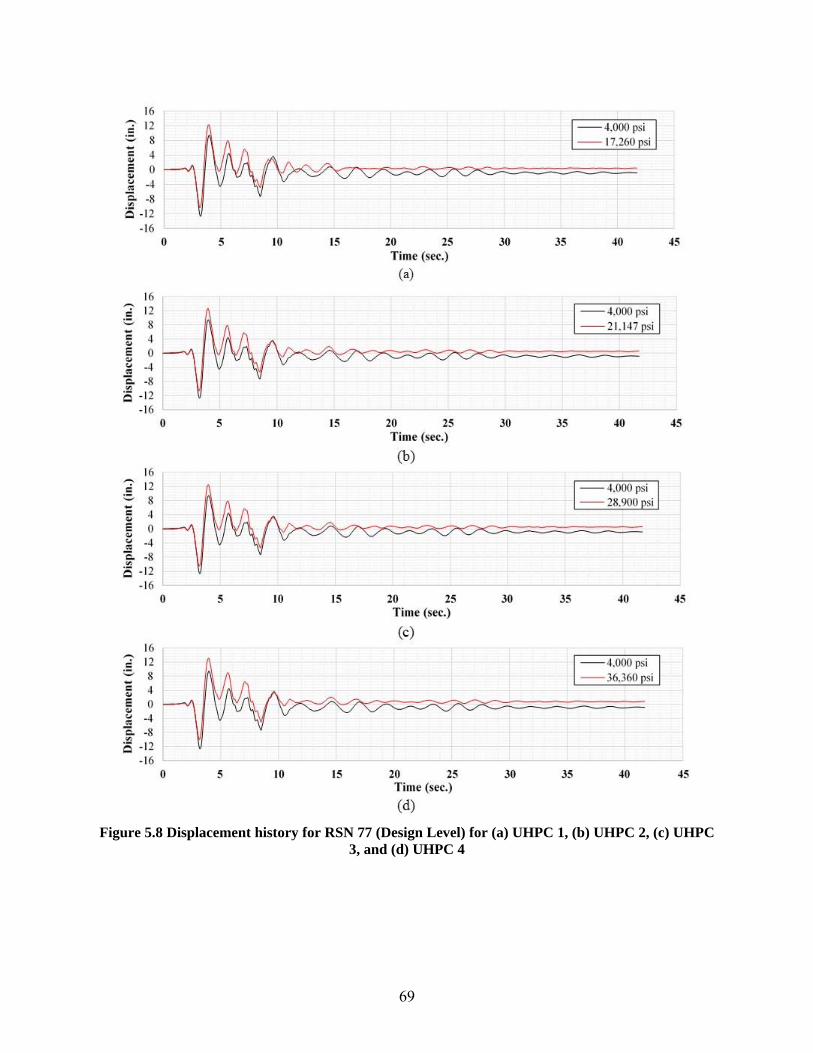
69
Figure 5.8 Displacement history for RSN 77 (Design Level) for (a) UHPC 1, (b) UHPC 2, (c) UHPC
3, and (d) UHPC 4
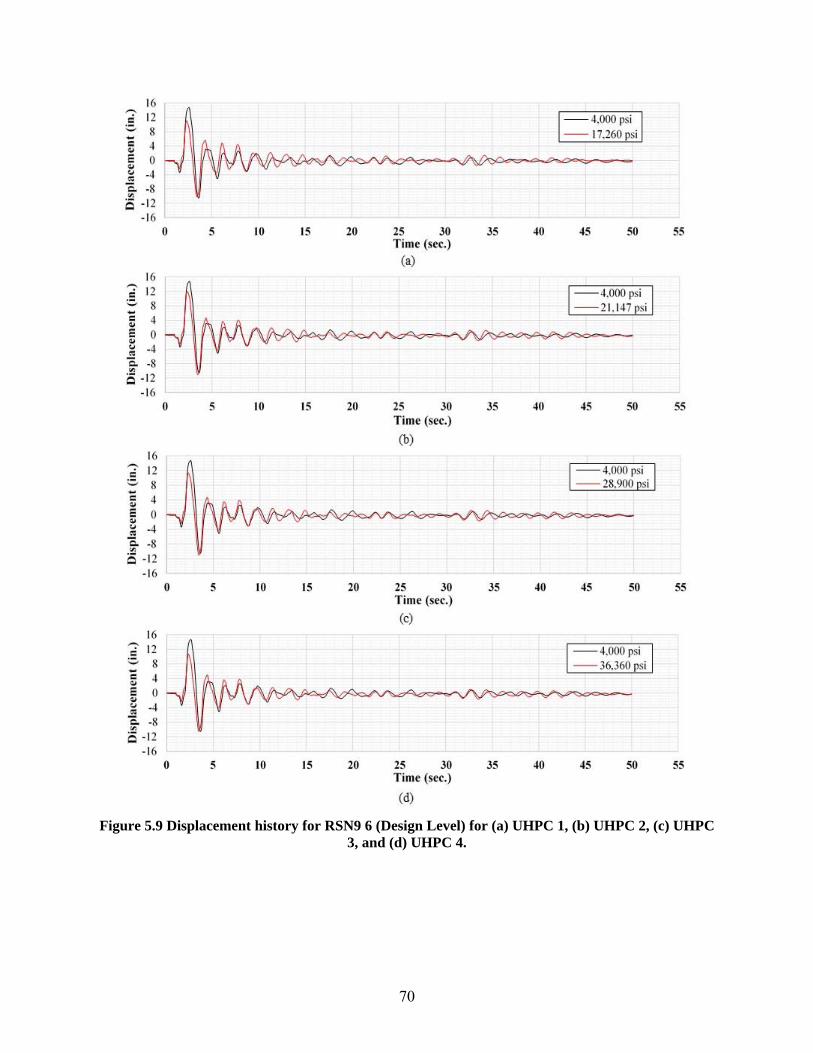
70
Figure 5.9 Displacement history for RSN9 6 (Design Level) for (a) UHPC 1, (b) UHPC 2, (c) UHPC 3, and (d) UHPC 4.
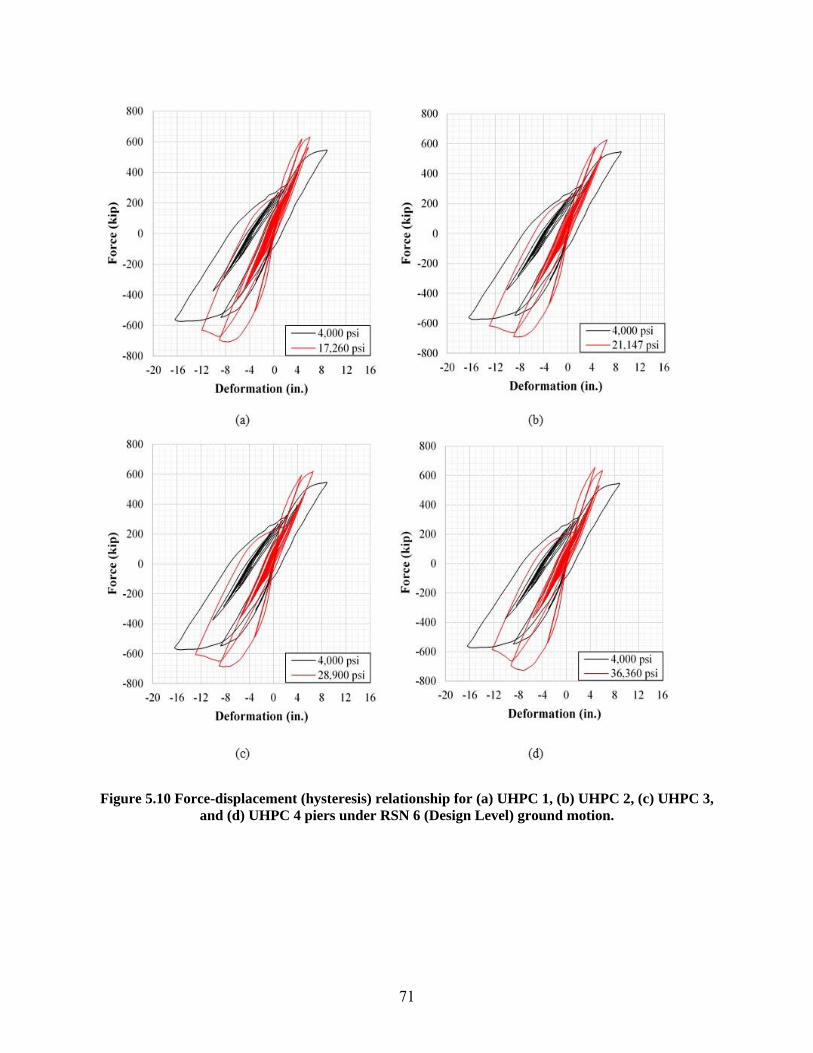
71
Figure 5.10 Force-displacement (hysteresis) relationship for (a) UHPC 1, (b) UHPC 2, (c) UHPC 3,
and (d) UHPC 4 piers under RSN 6 (Design Level) ground motion.
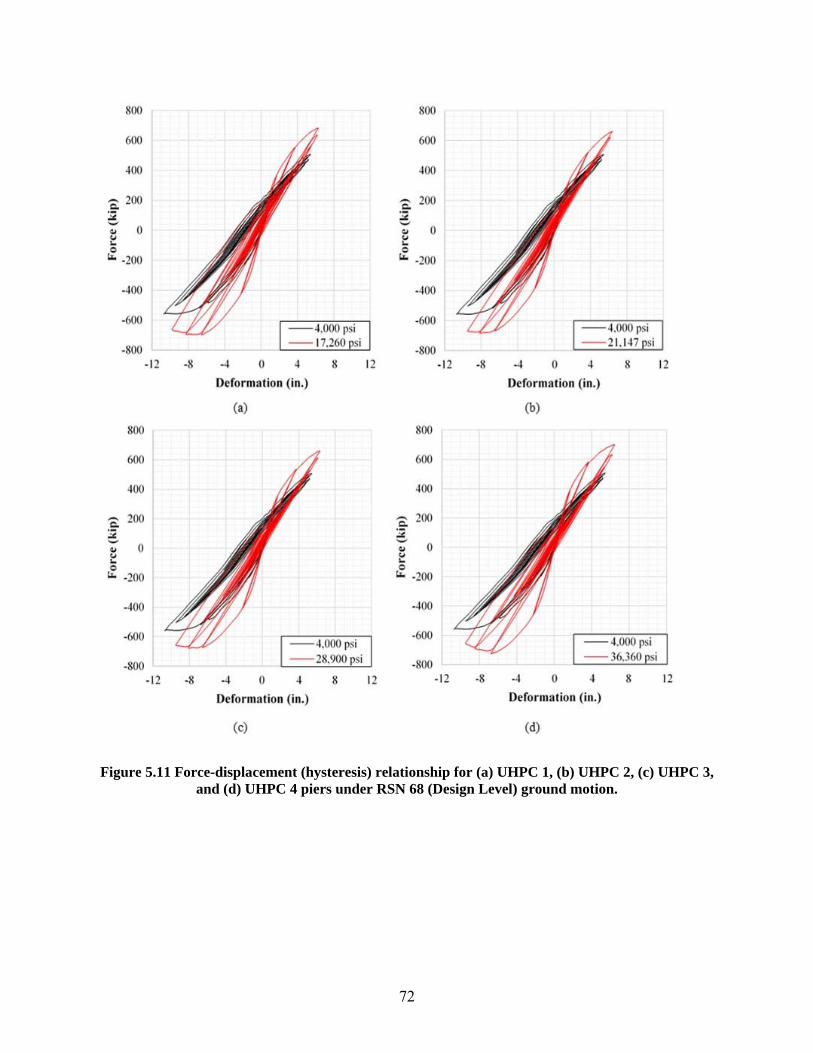
72
Figure 5.11 Force-displacement (hysteresis) relationship for (a) UHPC 1, (b) UHPC 2, (c) UHPC 3, and (d) UHPC 4 piers under RSN 68 (Design Level) ground motion.
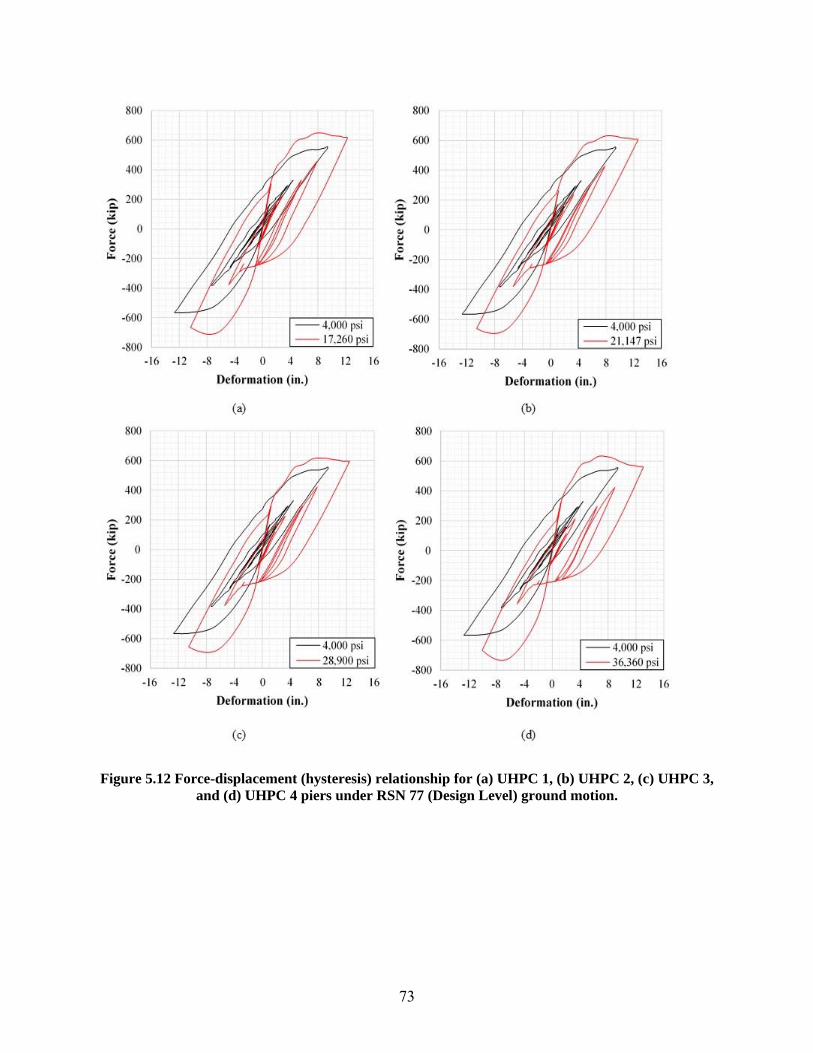
73
Figure 5.12 Force-displacement (hysteresis) relationship for (a) UHPC 1, (b) UHPC 2, (c) UHPC 3,
and (d) UHPC 4 piers under RSN 77 (Design Level) ground motion.
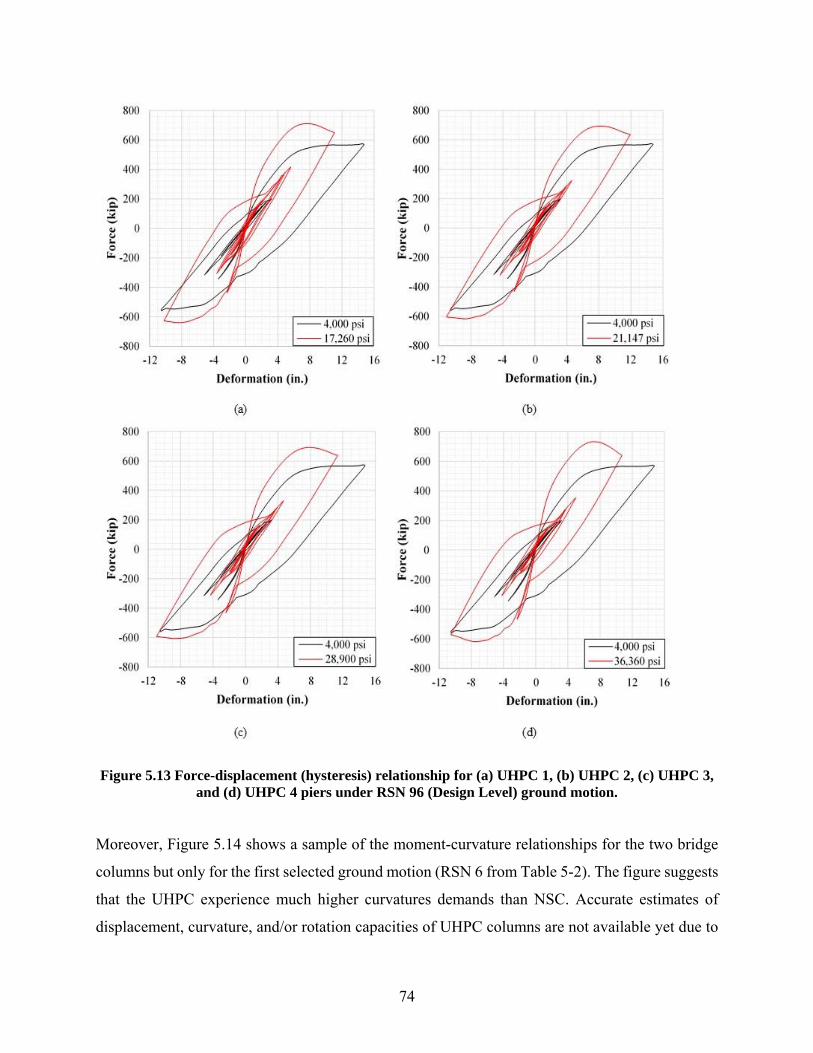
74
Figure 5.13 Force-displacement (hysteresis) relationship for (a) UHPC 1, (b) UHPC 2, (c) UHPC 3,
and (d) UHPC 4 piers under RSN 96 (Design Level) ground motion.
Moreover, Figure 5.14 shows a sample of the moment-curvature relationships for the two bridge
columns but only for the first selected ground motion (RSN 6 from Table 5-2). The figure suggests
that the UHPC experience much higher curvatures demands than NSC. Accurate estimates of
displacement, curvature, and/or rotation capacities of UHPC columns are not available yet due to
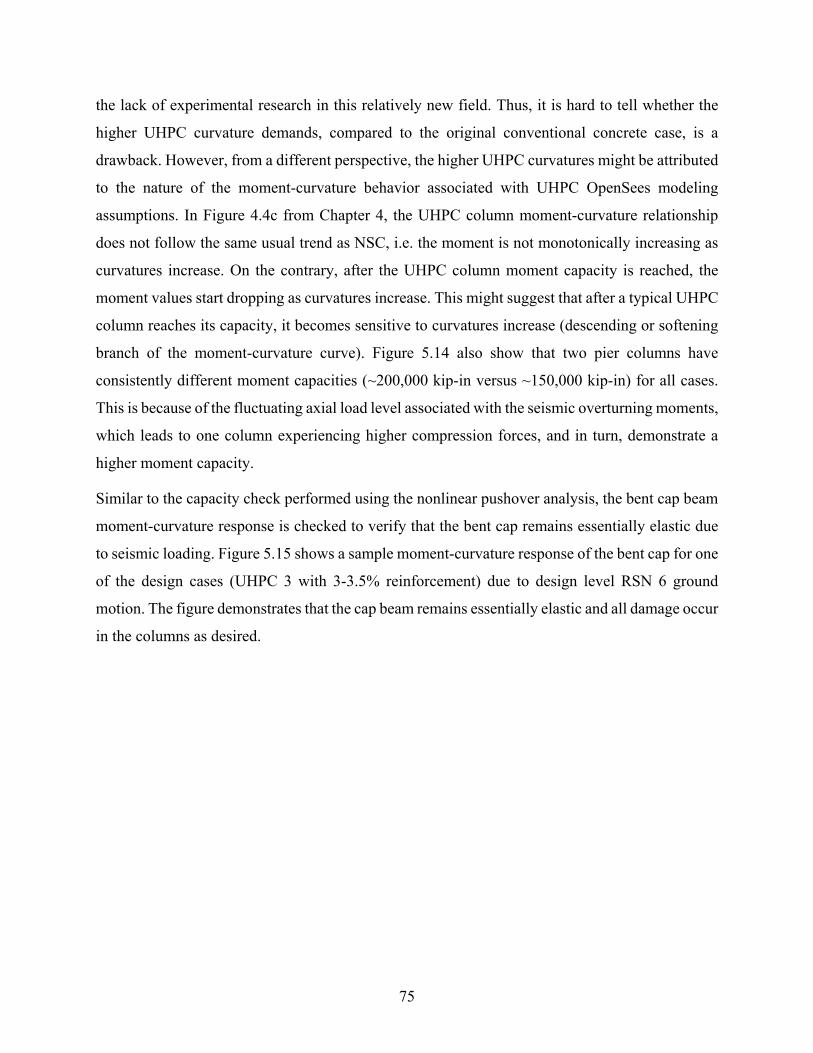
75
the lack of experimental research in this relatively new field. Thus, it is hard to tell whether the
higher UHPC curvature demands, compared to the original conventional concrete case, is a
drawback. However, from a different perspective, the higher UHPC curvatures might be attributed
to the nature of the moment-curvature behavior associated with UHPC OpenSees modeling
assumptions. In Figure 4.4c from Chapter 4, the UHPC column moment-curvature relationship
does not follow the same usual trend as NSC, i.e. the moment is not monotonically increasing as
curvatures increase. On the contrary, after the UHPC column moment capacity is reached, the
moment values start dropping as curvatures increase. This might suggest that after a typical UHPC
column reaches its capacity, it becomes sensitive to curvatures increase (descending or softening
branch of the moment-curvature curve). Figure 5.14 also show that two pier columns have
consistently different moment capacities (~200,000 kip-in versus ~150,000 kip-in) for all cases.
This is because of the fluctuating axial load level associated with the seismic overturning moments,
which leads to one column experiencing higher compression forces, and in turn, demonstrate a
higher moment capacity.
Similar to the capacity check performed using the nonlinear pushover analysis, the bent cap beam
moment-curvature response is checked to verify that the bent cap remains essentially elastic due
to seismic loading. Figure 5.15 shows a sample moment-curvature response of the bent cap for one
of the design cases (UHPC 3 with 3-3.5% reinforcement) due to design level RSN 6 ground
motion. The figure demonstrates that the cap beam remains essentially elastic and all damage occur
in the columns as desired.
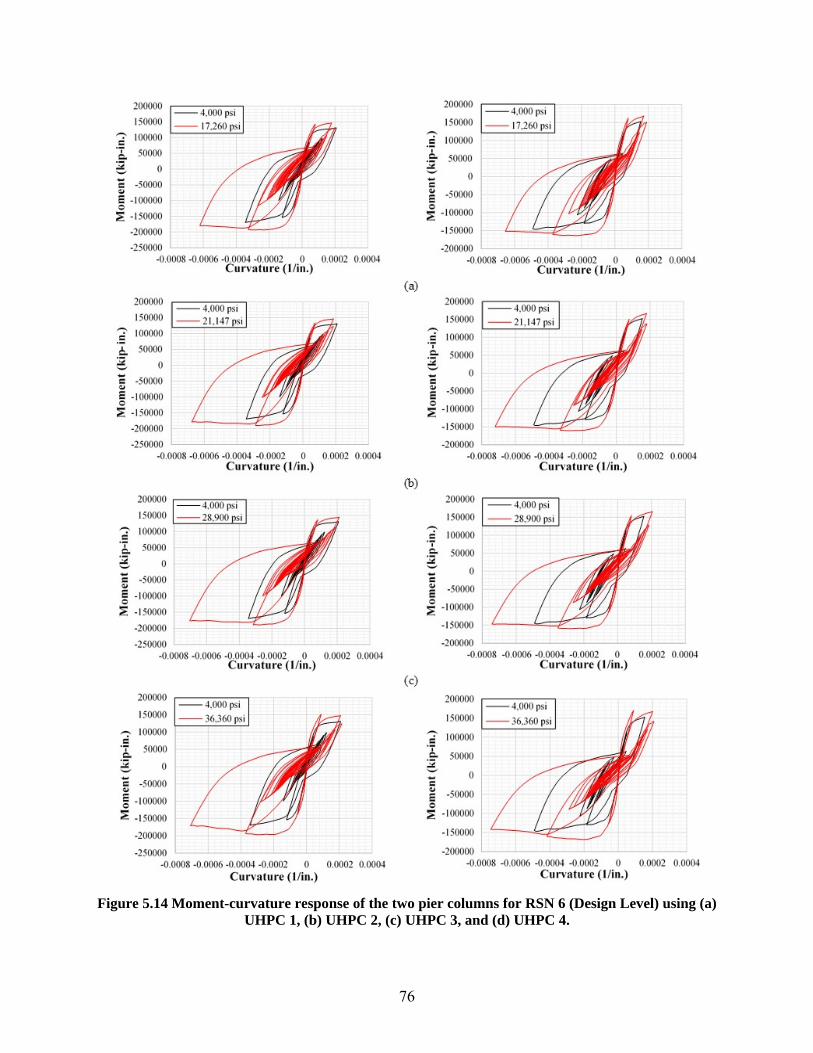
76
Figure 5.14 Moment-curvature response of the two pier columns for RSN 6 (Design Level) using (a) UHPC 1, (b) UHPC 2, (c) UHPC 3, and (d) UHPC 4.

77
Figure 5.15 Sample moment-curvature response of the bent cap beam under RSN 6 (Design Level)
for both conventional concrete and UHPC 3 bridge piers.
To conclude the discussion of the DLE NTHA cases, Figures 5.16, 5.17, and 5.18 summarize the
maximum displacements, residual displacements, and base shears for each UHPC design as
compared with the original conventional concrete design. These figures provide the same
observations as before. It illustrates in a more convenient visual display that UHPC piers have
higher force capacities and experience overall less displacements and residual (permanent)
damage.
Figure 5.16 Maximum displacements for each ground motion case at the Design Level.
-250000
-200000
-150000
-100000
-50000
0
50000
100000
150000
-0.0001 -0.00008 -0.00006 -0.00004 -0.00002 0 0.00002
Mom
ent
(kip
-in
.)
Curvature (1/in.)
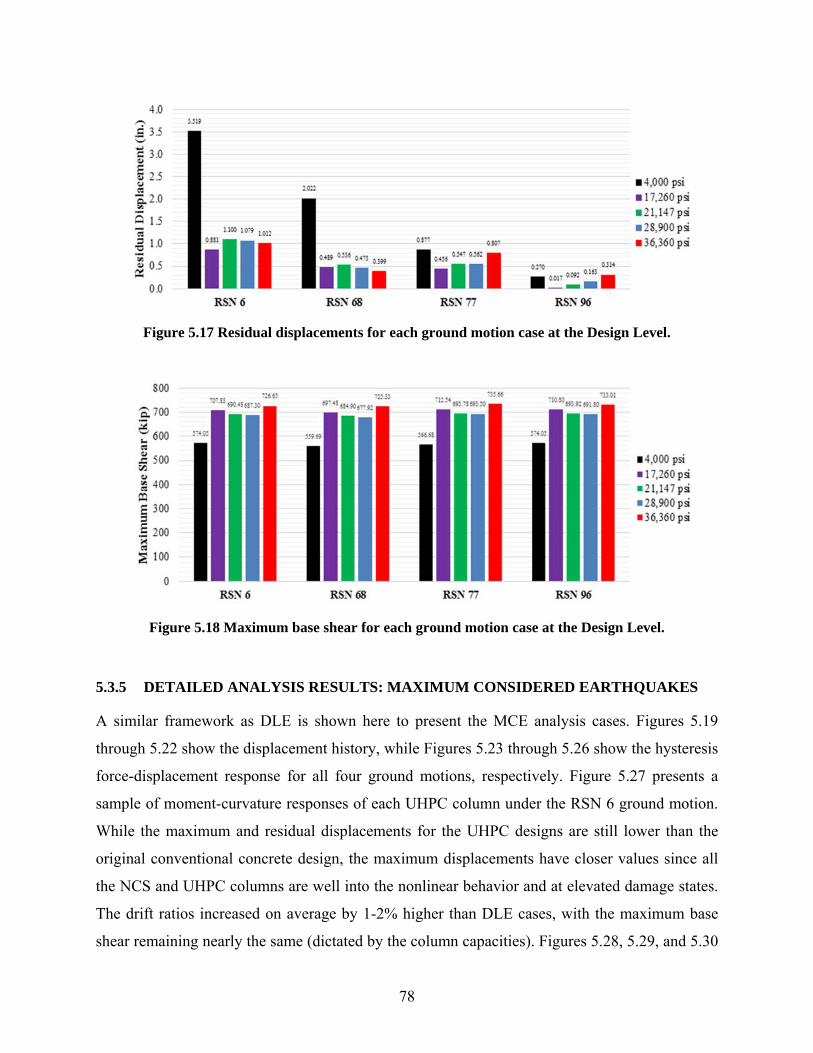
78
Figure 5.17 Residual displacements for each ground motion case at the Design Level.
Figure 5.18 Maximum base shear for each ground motion case at the Design Level.
5.3.5 DETAILED ANALYSIS RESULTS: MAXIMUM CONSIDERED EARTHQUAKES
A similar framework as DLE is shown here to present the MCE analysis cases. Figures 5.19
through 5.22 show the displacement history, while Figures 5.23 through 5.26 show the hysteresis
force-displacement response for all four ground motions, respectively. Figure 5.27 presents a
sample of moment-curvature responses of each UHPC column under the RSN 6 ground motion.
While the maximum and residual displacements for the UHPC designs are still lower than the
original conventional concrete design, the maximum displacements have closer values since all
the NCS and UHPC columns are well into the nonlinear behavior and at elevated damage states.
The drift ratios increased on average by 1-2% higher than DLE cases, with the maximum base
shear remaining nearly the same (dictated by the column capacities). Figures 5.28, 5.29, and 5.30

79
again summarize the maximum displacements, residual displacements, and base shears for each
UHPC design, respectively, as compared with the original conventional concrete design at the
MCE level. In summary, the optimized UHPC piers have demonstrated an overall comparable, or
even superior, seismic response when compared to conventional concrete with higher force
capacities and lower deformations and displacement demands.
Figure 5.19 Displacement history for RSN 6 (MCE) for (a) UHPC 1, (b) UHPC 2, (c) UHPC 3, and (d) UHPC 4.
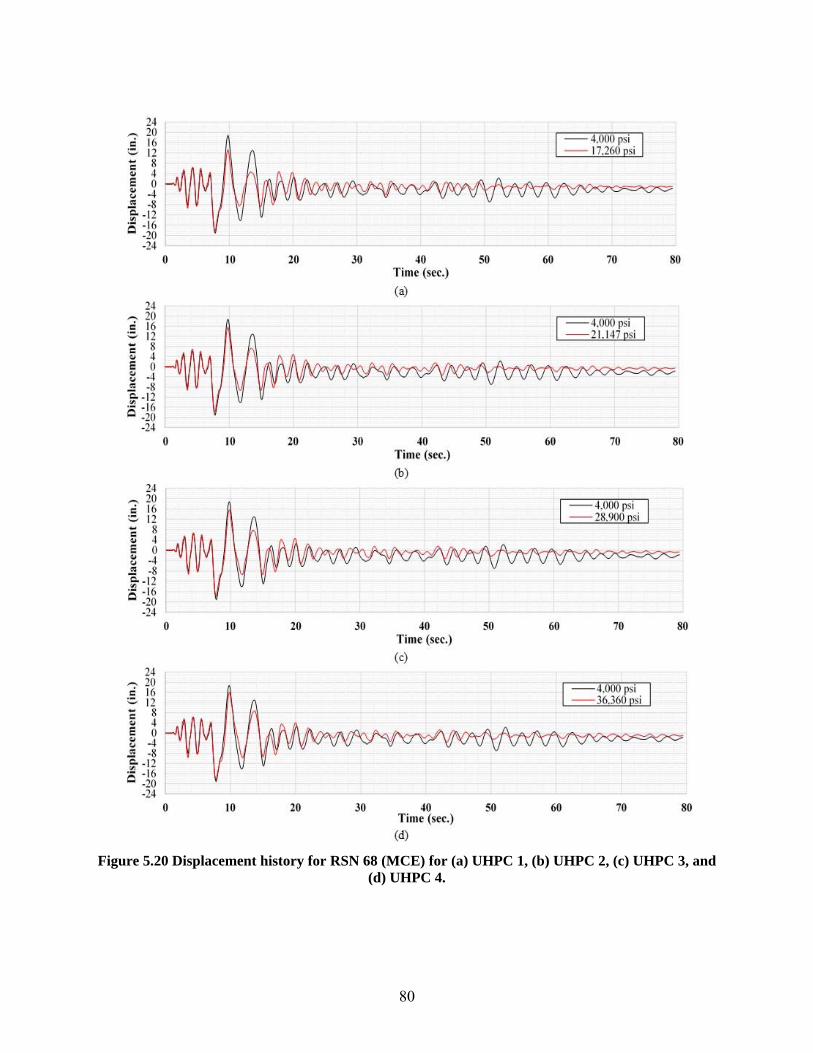
80
Figure 5.20 Displacement history for RSN 68 (MCE) for (a) UHPC 1, (b) UHPC 2, (c) UHPC 3, and
(d) UHPC 4.

81
Figure 5.21 Displacement history for RSN 77 (MCE) for (a) UHPC 1, (b) UHPC 2, (c) UHPC 3, and (d) UHPC 4.
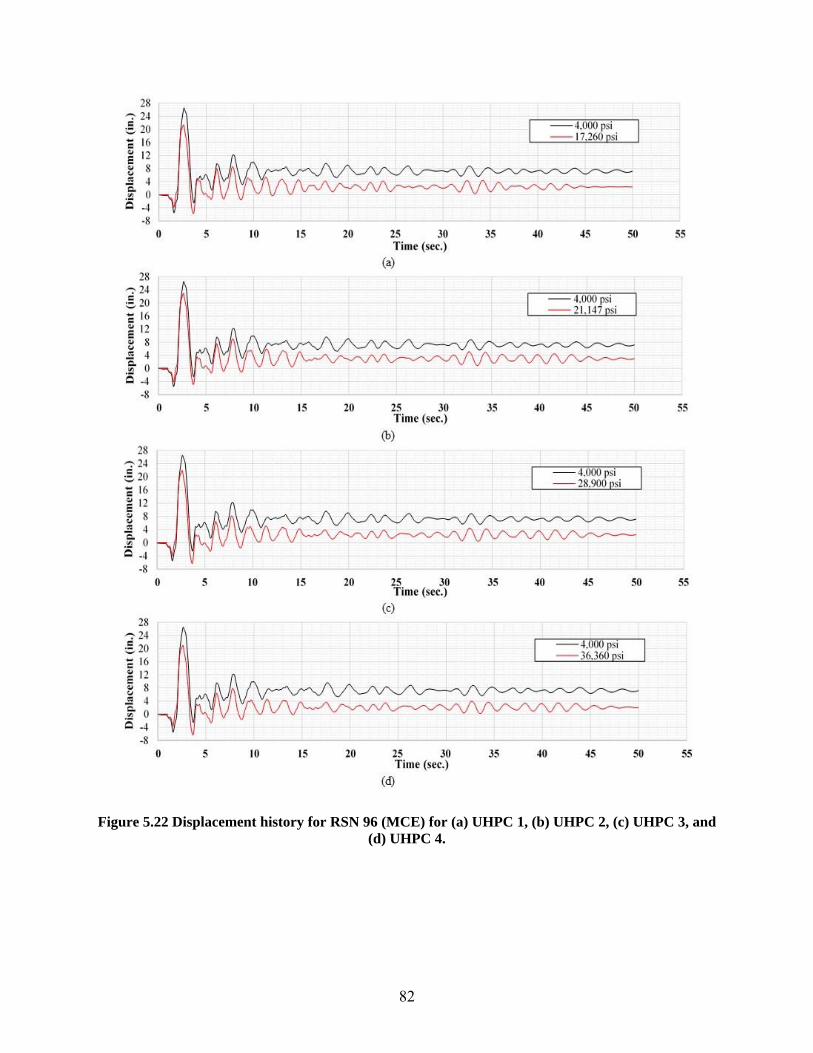
82
Figure 5.22 Displacement history for RSN 96 (MCE) for (a) UHPC 1, (b) UHPC 2, (c) UHPC 3, and (d) UHPC 4.
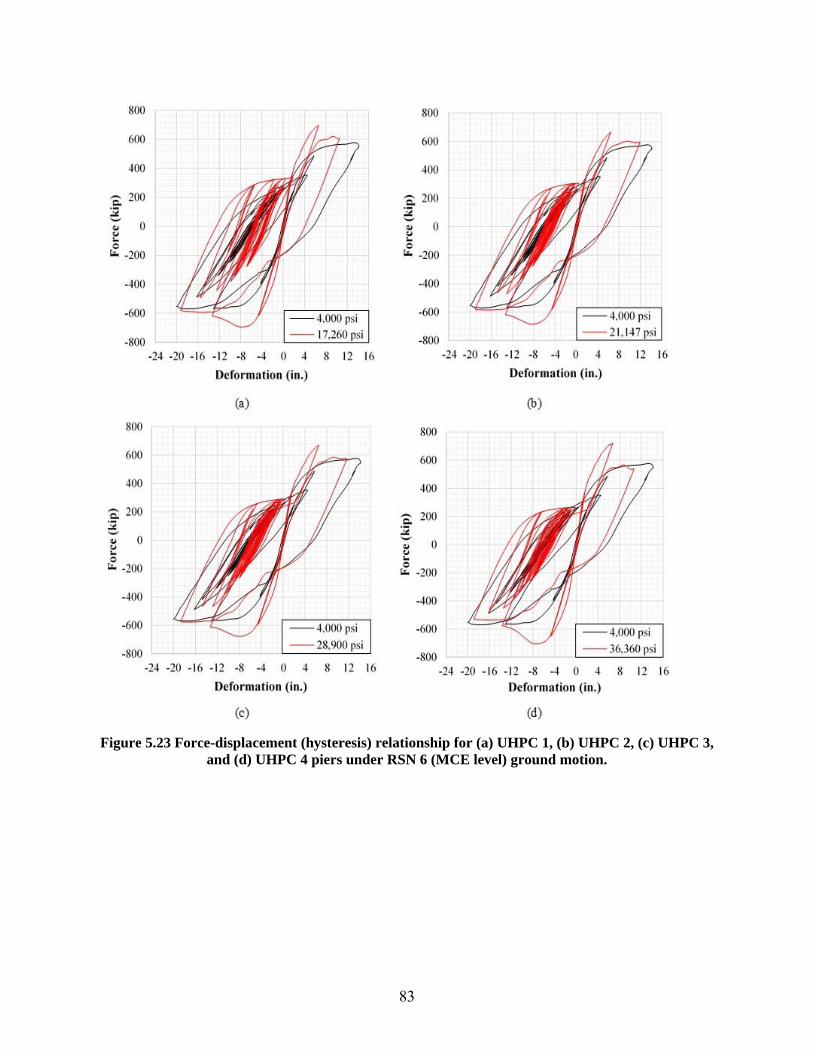
83
Figure 5.23 Force-displacement (hysteresis) relationship for (a) UHPC 1, (b) UHPC 2, (c) UHPC 3,
and (d) UHPC 4 piers under RSN 6 (MCE level) ground motion.
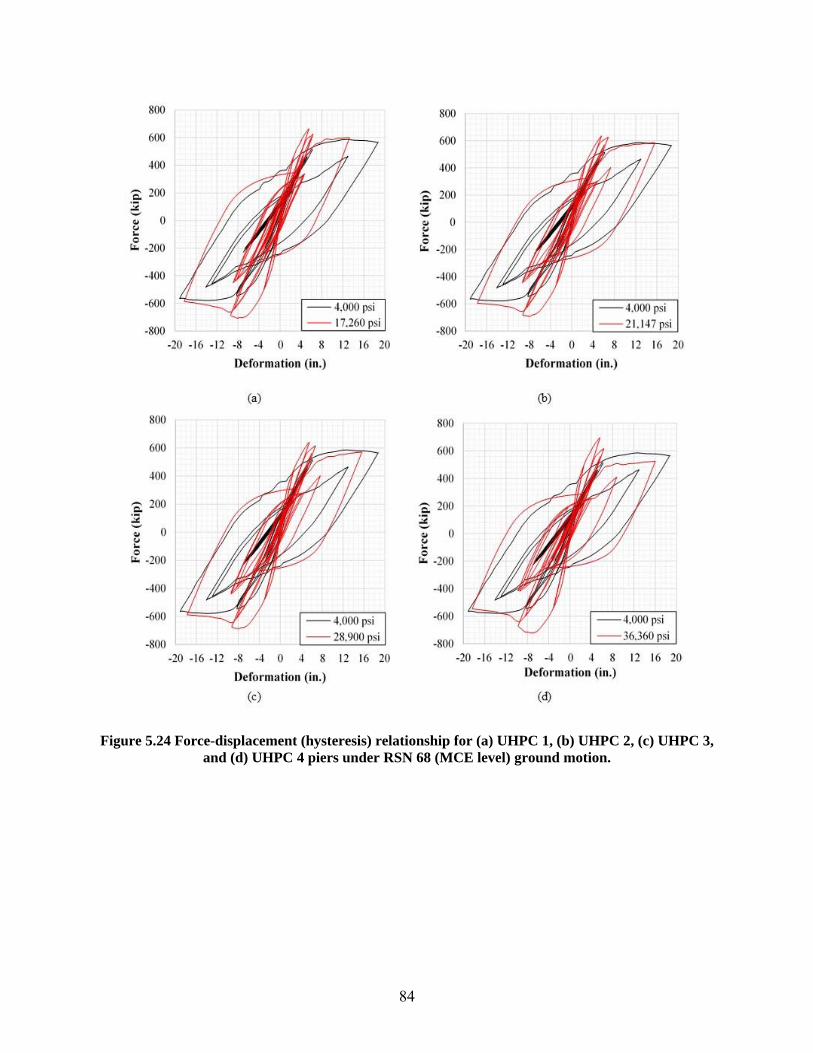
84
Figure 5.24 Force-displacement (hysteresis) relationship for (a) UHPC 1, (b) UHPC 2, (c) UHPC 3, and (d) UHPC 4 piers under RSN 68 (MCE level) ground motion.

85
Figure 5.25 Force-displacement (hysteresis) relationship for (a) UHPC 1, (b) UHPC 2, (c) UHPC 3,
and (d) UHPC 4 piers under RSN 77 (MCE level) ground motion.
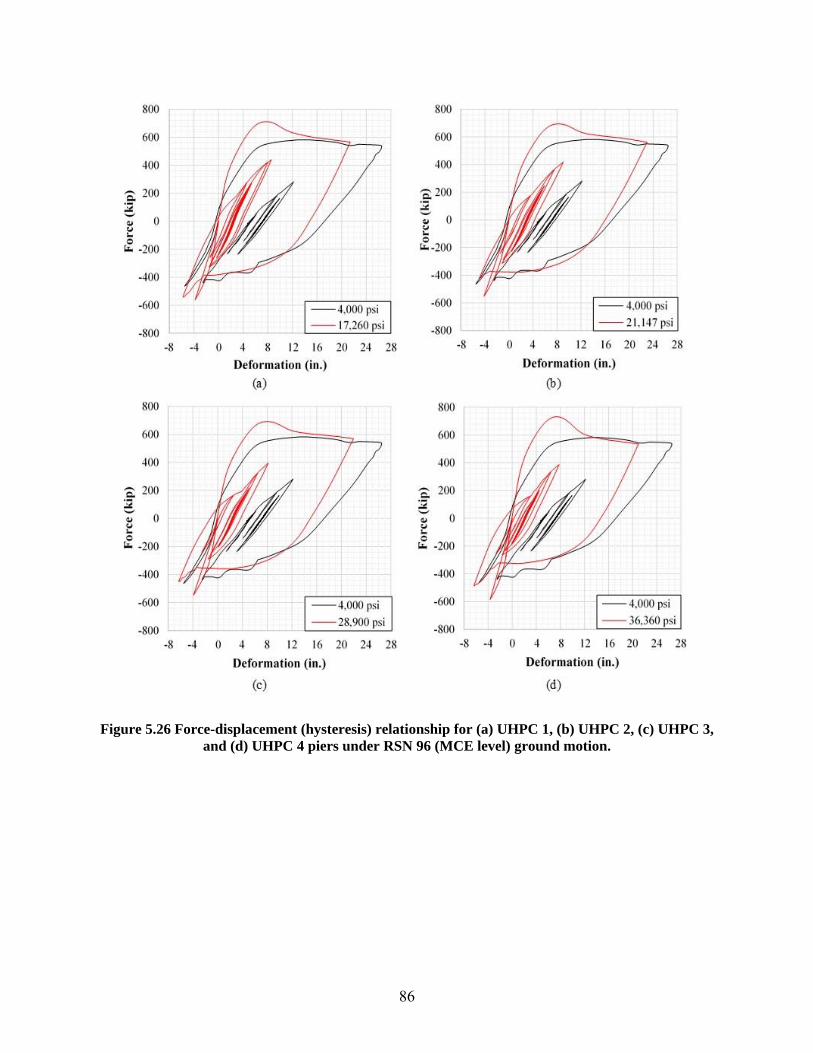
86
Figure 5.26 Force-displacement (hysteresis) relationship for (a) UHPC 1, (b) UHPC 2, (c) UHPC 3,
and (d) UHPC 4 piers under RSN 96 (MCE level) ground motion.
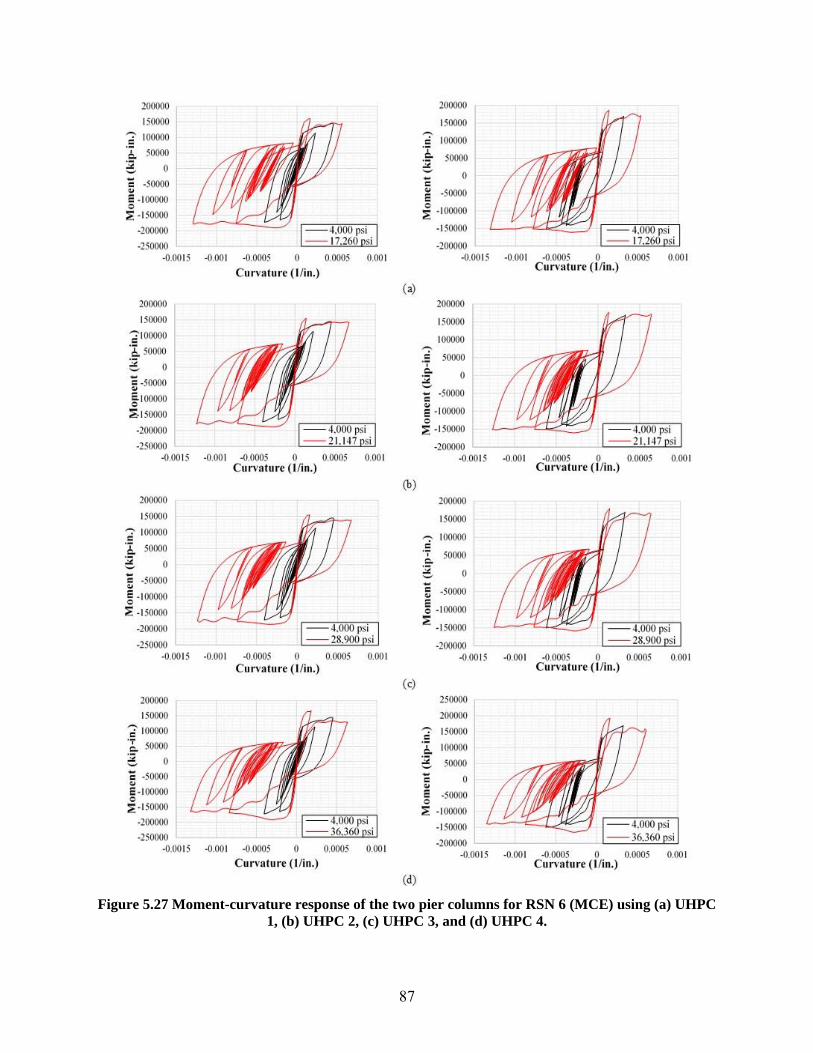
87
Figure 5.27 Moment-curvature response of the two pier columns for RSN 6 (MCE) using (a) UHPC
1, (b) UHPC 2, (c) UHPC 3, and (d) UHPC 4.

88
Figure 5.28 Maximum displacements for each ground motion at the MCE level.
Figure 5.29 Residual displacements for each ground motion at the MCE level.
Figure 5.30 Maximum base shear for each ground motion at the MCE level.
89
6 Cost Analysis
6.1 BILLS OF QUANTITIES
Using the optimized column designs from Chapter 4 for each varying longitudinal steel
reinforcement ratio (~1.5%, 2.0-2.5%, 3.0-3.5%, and 5.0-6.0%) and associated bent cap designs,
volumetric and weight calculations per full bridge pier are performed. Tables 6-1 and 6-2
summarize the concrete and reinforcement bill of quantities based on the Concrete02 and
Concrete04 optimized designs, respectively. The estimated material consumption metrics, based
on bills of quantities, include cement, water, superplasticizer, steel fibers, and reinforcement steel.
Tables 6-3 and 6-4 present the consumed material estimates for the Concrete02 and Concrete04
designs, respectively. As demonstrated in Chapter 4, the importance of increasing the longitudinal
steel reinforcement ratios is to better utilize the UHPC superior mechanical properties, and in turn,
allow the decrease in column diameter and bent cap width.
The steep costs of steel fibers in the UHPC mix designs contribute immensely to the costs of each
design. The cost of manufacturing the steel fibers is high due to the lack of multiple domestic
manufacturers and low demands. According to Voort et al. (2008), as the utilization of UHPC
increases across North America, the manufacturing costs of steel fibers will decrease as more
orders of steel fibers are placed. The cost of UHPC in North America was approximately
$2,000/yd3 in the year 2000 and has since decreased (Voort et al., 2008), especially for non-
proprietary mixes. Current costs of UHPC have been reported as low as $1,500/yd3 and will
hopefully decrease to an amount as low as $570/yd3, which is the current estimate in Europe where
UHPC is more widely utilized (Aïtcin, 2000).

90
Table 6-1 Total Concrete and Steel Volumes for Concrete02-Based Designs
Property Original UHPC 1 UHPC 2 UHPC 3 UHPC 4
f’c (psi) 4,000 17,260 21,147 28,900 36,360
ft (psi) - 1,300 1,500* 1,700 2,611
Ast≅1.5%
Total Column Concrete Volume (yd3) 92.15 68.33 64.00 59.80 51.84
Total Bent Cap Concrete Volume (yd3) 98.88 78.74 76.91 75.08 71.41
Total Column Rebar Weight (ton) 10.75 8.26 8.20 8.14 6.63
Total Bent Cap Rebar Weight (ton) 6.04 4.20 3.68 3.15 2.89
Total Rebar Weight (ton) 16.79 12.46 11.88 11.29 9.51
Total Concrete Volume (yd3) 191.03 147.07 140.90 134.88 123.25
% Decrease of Total Volume - 23.01% 26.24% 29.39% 35.48%
Ast≅2.0-2.5%
Total Column Concrete Volume (yd3) 92.15 59.80 55.75 55.75 48.07
Total Bent Cap Concrete Volume (yd3) 98.88 75.08 73.24 73.24 69.58
Total Column Rebar Weight (ton) 10.75 10.35 10.97 9.62 8.83
Total Bent Cap Rebar Weight (ton) 6.04 4.46 3.94 3.68 3.41
Total Rebar Weight (ton) 16.79 14.82 14.91 13.30 12.25
Total Concrete Volume (yd3) 191.03 134.88 128.99 128.99 117.65
% Decrease of Total Volume - 29.39% 32.48% 32.48% 38.41%
Ast≅3.0-3.5%
Total Column Concrete Volume (yd3) 92.15 55.75 51.84 48.07 44.44
Total Bent Cap Concrete Volume (yd3) 98.88 73.24 71.41 69.58 67.75
Total Column Rebar Weight (ton) 10.75 12.31 12.26 12.20 11.47
Total Bent Cap Rebar Weight (ton) 6.04 4.73 4.20 3.94 3.68
Total Rebar Weight (ton) 16.79 17.04 16.46 16.14 15.15
Total Concrete Volume (yd3) 191.03 128.99 123.25 117.65 112.19
% Decrease of Total Volume - 32.48% 35.48% 38.41% 41.27%
Ast≅5.0-6.0%
Total Column Concrete Volume (yd3) 92.15 40.96 40.96 40.96 37.62
Total Bent Cap Concrete Volume (yd3) 98.88 65.92 65.92 65.92 64.09
Total Column Rebar Weight (ton) 10.75 16.87 16.87 15.68 14.42
Total Bent Cap Rebar Weight (ton) 6.04 5.51 5.25 4.99 4.46
Total Rebar Weight (ton) 16.79 22.39 22.12 20.66 18.89
Total Concrete Volume (yd3) 191.03 106.88 106.88 106.88 101.70
% Decrease of Total Volume - 44.05% 44.05% 44.05% 46.76%

91
Table 6-2 Total Concrete and Steel Volumes for Concrete04-Based Designs
Property Original UHPC 1 UHPC 2 UHPC 3 UHPC 4
f’c (psi) 4,000 17,260 21,147 28,900 36,360
ft (psi) - 1,300 1,500* 1,700 2,611
Ast≅1.5%
Total Column Concrete Volume (yd3) 92.15 82.20 77.43 72.81 64.00
Total Bent Cap Concrete Volume (yd3) 98.88 84.23 82.40 80.57 76.91
Total Column Rebar Weight (ton) 10.75 9.97 9.91 9.18 8.20
Total Bent Cap Rebar Weight (ton) 6.04 5.78 4.73 4.46 4.20
Total Rebar Weight (ton) 16.79 15.74 14.63 13.64 12.40
Total Concrete Volume (yd3) 191.03 166.43 159.83 153.38 140.90
% Decrease of Total Volume - 12.88% 16.33% 19.71% 26.24%
Ast≅2.0-2.5%
Total Column Concrete Volume (yd3) 92.15 68.33 64.00 64.00 55.75
Total Bent Cap Concrete Volume (yd3) 98.88 78.74 76.91 76.91 73.24
Total Column Rebar Weight (ton) 10.75 12.49 12.43 11.76 10.97
Total Bent Cap Rebar Weight (ton) 6.04 6.30 4.73 4.46 4.20
Total Rebar Weight (ton) 16.79 18.79 17.15 16.22 15.17
Total Concrete Volume (yd3) 191.03 147.07 140.90 140.90 128.99
% Decrease of Total Volume - 23.01% 26.24% 26.24% 32.48%
Ast≅3.0-3.5%
Total Column Concrete Volume (yd3) 92.15 59.80 55.75 55.75 51.84
Total Bent Cap Concrete Volume (yd3) 98.88 75.08 73.24 73.24 71.41
Total Column Rebar Weight (ton) 10.75 14.77 14.71 13.51 13.45
Total Bent Cap Rebar Weight (ton) 6.04 6.83 5.78 5.25 4.46
Total Rebar Weight (ton) 16.79 21.59 20.48 18.76 17.92
Total Concrete Volume (yd3) 191.03 134.88 128.99 128.99 123.25
% Decrease of Total Volume - 29.39% 32.48% 32.48% 35.48%
Ast≅5.0-6.0%
Total Column Concrete Volume (yd3) 92.15 48.07 44.44 44.44 40.96
Total Bent Cap Concrete Volume (yd3) 98.88 69.58 67.75 67.75 65.92
Total Column Rebar Weight (ton) 10.75 18.18 16.93 16.93 16.87
Total Bent Cap Rebar Weight (ton) 6.04 7.35 6.30 5.78 5.25
Total Rebar Weight (ton) 16.79 25.54 23.23 22.71 22.12
Total Concrete Volume (yd3) 191.03 117.65 112.19 112.19 106.88
% Decrease of Total Volume - 38.41% 41.27% 41.27% 44.05%

92
Table 6-3 Total Material Consumption for Concrete02-Based Designs
Property Original UHPC 1 UHPC 2 UHPC 3 UHPC 4
Mix No. - #1 #81 #1 #87
f’c (psi) 4,000 17,260 21,147 28,900 36,360
ft (psi) - 1,300 1,500* 1,700 2,611
Cement (lb/yd3) 675 1,200 1,153 1,200 1,002
Water (lb/yd3) 335 184 196 184 190
Superplasticizer (lb/yd3) - 51.8 28.8 51.8 11.0
Steel Fibers (lb/yd3) - 263 288 263 271
Ast≅1.5%
Total Cement Consumed (ton) 64.47 88.24 81.23 80.93 61.75
Total Water Consumed (gallons) 8,608 3,640 3,715 3,338 3,150
Total Superplasticizer Consumed (ton) - 3.81 2.03 3.49 0.68
Total Steel Fibers Consumed (ton) - 19.34 20.29 17.74 16.70
Total Rebar Consumed (ton)
16.79 12.46 11.88 11.29 9.51
Ast≅2.0-2.5%
Total Cement Consumed (ton) 64.47 80.93 74.36 77.39 58.94
Total Water Consumed (gallons) 8,608 3,338 3,401 3,192 3,007
Total Superplasticizer Consumed (ton) - 3.49 1.86 3.34 0.65
Total Steel Fibers Consumed (ton) - 17.74 18.57 16.96 15.94
Total Rebar Consumed (ton) 16.79 14.82 14.91 13.30 12.25
Ast≅3.0-3.5%
Total Cement Consumed (ton) 64.47 77.39 71.05 70.59 56.21
Total Water Consumed (gallons) 8,608 3,192 3,249 2,912 2,867
Total Superplasticizer Consumed (ton) - 3.34 1.77 3.05 0.62
Total Steel Fibers Consumed (ton) - 16.96 17.75 15.47 15.20
Total Rebar Consumed (ton) 16.79 17.04 16.46 16.14 15.15
Ast≅5.0-6.0%
Total Cement Consumed (ton) 64.47 64.13 61.62 64.13 50.95
Total Water Consumed (gallons) 8,608 2,645 2,818 2,645 2,599
Total Superplasticizer Consumed (ton) - 2.77 1.54 2.77 0.56
Total Steel Fibers Consumed (ton) - 14.05 15.39 14.05 13.78
Total Rebar Consumed (ton) 16.79 22.39 22.12 20.66 18.89
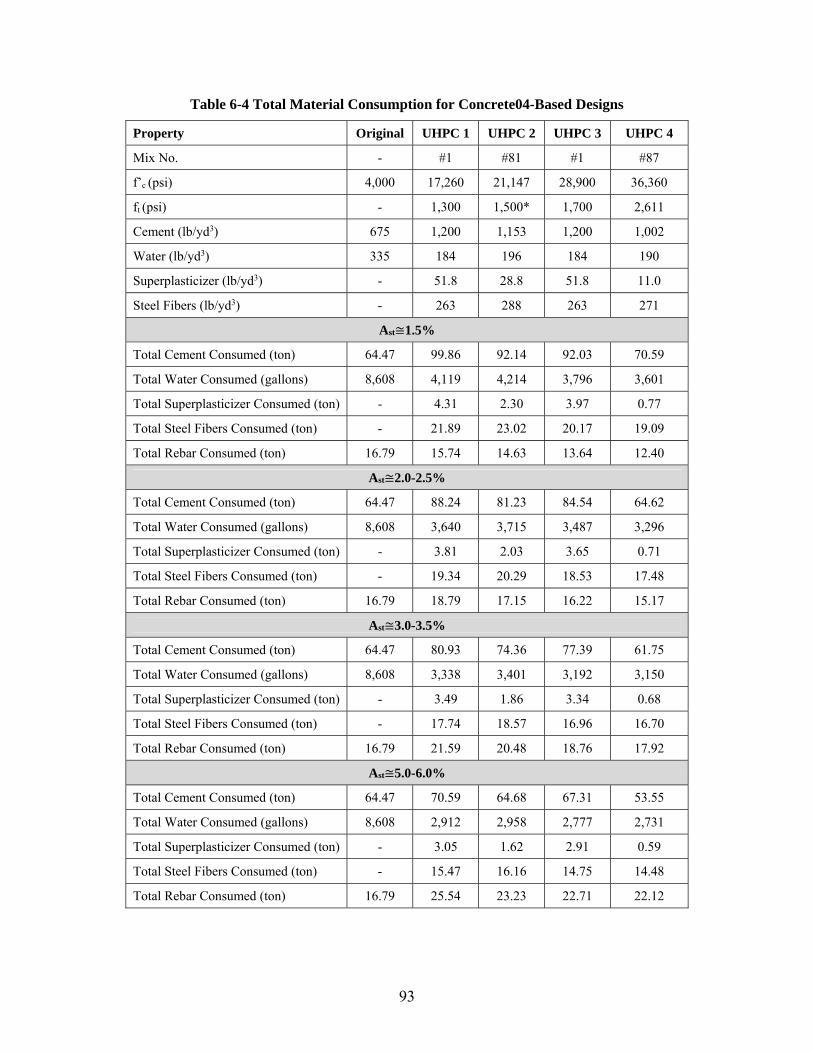
93
Table 6-4 Total Material Consumption for Concrete04-Based Designs
Property Original UHPC 1 UHPC 2 UHPC 3 UHPC 4
Mix No. - #1 #81 #1 #87
f’c (psi) 4,000 17,260 21,147 28,900 36,360
ft (psi) - 1,300 1,500* 1,700 2,611
Cement (lb/yd3) 675 1,200 1,153 1,200 1,002
Water (lb/yd3) 335 184 196 184 190
Superplasticizer (lb/yd3) - 51.8 28.8 51.8 11.0
Steel Fibers (lb/yd3) - 263 288 263 271
Ast≅1.5%
Total Cement Consumed (ton) 64.47 99.86 92.14 92.03 70.59
Total Water Consumed (gallons) 8,608 4,119 4,214 3,796 3,601
Total Superplasticizer Consumed (ton) - 4.31 2.30 3.97 0.77
Total Steel Fibers Consumed (ton) - 21.89 23.02 20.17 19.09
Total Rebar Consumed (ton) 16.79 15.74 14.63 13.64 12.40
Ast≅2.0-2.5%
Total Cement Consumed (ton) 64.47 88.24 81.23 84.54 64.62
Total Water Consumed (gallons) 8,608 3,640 3,715 3,487 3,296
Total Superplasticizer Consumed (ton) - 3.81 2.03 3.65 0.71
Total Steel Fibers Consumed (ton) - 19.34 20.29 18.53 17.48
Total Rebar Consumed (ton) 16.79 18.79 17.15 16.22 15.17
Ast≅3.0-3.5%
Total Cement Consumed (ton) 64.47 80.93 74.36 77.39 61.75
Total Water Consumed (gallons) 8,608 3,338 3,401 3,192 3,150
Total Superplasticizer Consumed (ton) - 3.49 1.86 3.34 0.68
Total Steel Fibers Consumed (ton) - 17.74 18.57 16.96 16.70
Total Rebar Consumed (ton) 16.79 21.59 20.48 18.76 17.92
Ast≅5.0-6.0%
Total Cement Consumed (ton) 64.47 70.59 64.68 67.31 53.55
Total Water Consumed (gallons) 8,608 2,912 2,958 2,777 2,731
Total Superplasticizer Consumed (ton) - 3.05 1.62 2.91 0.59
Total Steel Fibers Consumed (ton) - 15.47 16.16 14.75 14.48
Total Rebar Consumed (ton) 16.79 25.54 23.23 22.71 22.12

94
6.2 MONETARY COST ESTIMATES
Using the calculated volumes of concrete and the weight of the steel fibers and reinforcement
(Tables 6-1 through 6-4), the total costs of each UHPC design case are estimated using four
different estimates that range as follows: $550/yd3, $1,500/yd3, $2,000/yd3, and $2,500/yd3. These
estimations include the costs of curing and mixing the various UHPC components such as cement,
steel fibers, fine sand, ground quartz, silica fume, high range water reducers, and accelerators. As
a side calculation to a percent contribution of the total costs due to the steel fibers, the cost of an
equivalent 2% steel fibers is estimated to be $1,000 for one cubic yard of UHPC using estimates
provided by KPM Industries, a Canadian UHPC manufacturer (2016). Note that this estimate is
only for current typical costs in Northern America. Thus, such percentage for cost contribution
from the steel fiber cost is not valid, and not calculated, for the $550/yd3 European estimate. The
cost of steel reinforcement was estimated to be $441 per metric ton of reinforcing steel
(SteelBenchmarker, 2016). The cost of the original conventional concrete design (f’c = 4,000 psi)
is estimated to be $130/yd3 of concrete (Paragon Ready Mix Inc., 2016).
While all Concrete02 and Concrete04-based designs result in significant savings in volume
(compared to the original conventional concrete design), UHPC 4 achieved the highest savings of
cement in each level of steel reinforcement ratio. Despite the increasing compressive strengths and
Young’s Moduli across UHPC 1, 2, 3, and 4, cases using the 5.0-6.0% steel reinforcement ratios
result in nearly similar column dimensions. Since each design performs equally well, mechanical
properties beyond UHPC 1 would not be necessary to achieve the most optimized dimensions.
Overall, the largest percent decrease in volume achieved for Concrete02 and Concrete04-based
designs, when compared to the original conventional concrete design, are 46.76% and 44.05%,
respectively (refer to Table 4-8 and 4-9 in Chapter 4 for the tabulated column and bent dimensions
for the NSC and each UHPC design case).
An estimate of the material costs of a single bridge pier for each of the considered design cases is
calculated and summarized in Table 6-5 and 6-6 for the designs based on Concrete02 and
Concrete04, respectively. When the assumed unit cost of UHPC is equal to the highest estimate at
$2,500/yd3, immediate cost savings, relative to the original conventional design, are achieved at
Ast = 3.0-3.5% for UHPC 3 and 4, and for all designs at Ast=5.0-6.0%. When the assumed cost of
UHPC is equal to $2,000/yd3, immediate cost savings are achieved at every design except for
95
UHPC 1 at Ast = ~1.5%. Estimations at $550/yd3 and $1,500/yd3 of UHPC were able to achieve
cost savings for every design with respect to the original conventional concrete design.
For a meaningful cost comparison, the UHPC piers construction costs are integrated within an
overall cost estimate for the full prototype bridge. For this purpose, the bridge superstructure is
always considered a NSC box-girder and only the piers are considered to be made of UHPC. Using
values provided by the Florida Department of Transportation (FDOT, 2009), a cost estimate for a
concrete bridge (continuous span) is approximately $211/ft2 making the overall construction cost
estimate of the original conventional concrete bridge approximately $4,297,918 (~$4.3 million).
If the $2,500 UHPC unit cost (highest estimate) is considered along with the highlighted pier
construction costs in Tables 6-5 and 6-6, the increase for UHPC columns as a percentage of overall
bridge cost ranges from 10.7%-15.9% and 11.4%-18.2% for both Concrete02 and Concrete04-
based designs, respectively. This cost increase range depends on which UHPC mix is used and
what reinforcement ratios are used to optimize the design. For the $550 UHPC unit cost estimate,
the percent increase in bridge cost ranges from 1.5%-2.5% and 1.7%-3.1% for both Concrete02
and Concrete04-based designs, respectively. Thus, if UHPC unit material cost drops in the future
to be within the current price range as in Europe, building UHPC bridge piers will lead to only a
very small increase in the construction costs based on the prototype bridge considered in this study.
This small increase in cost is worth considering for a better life expectancy, seismic performance,
and minimal maintenance.
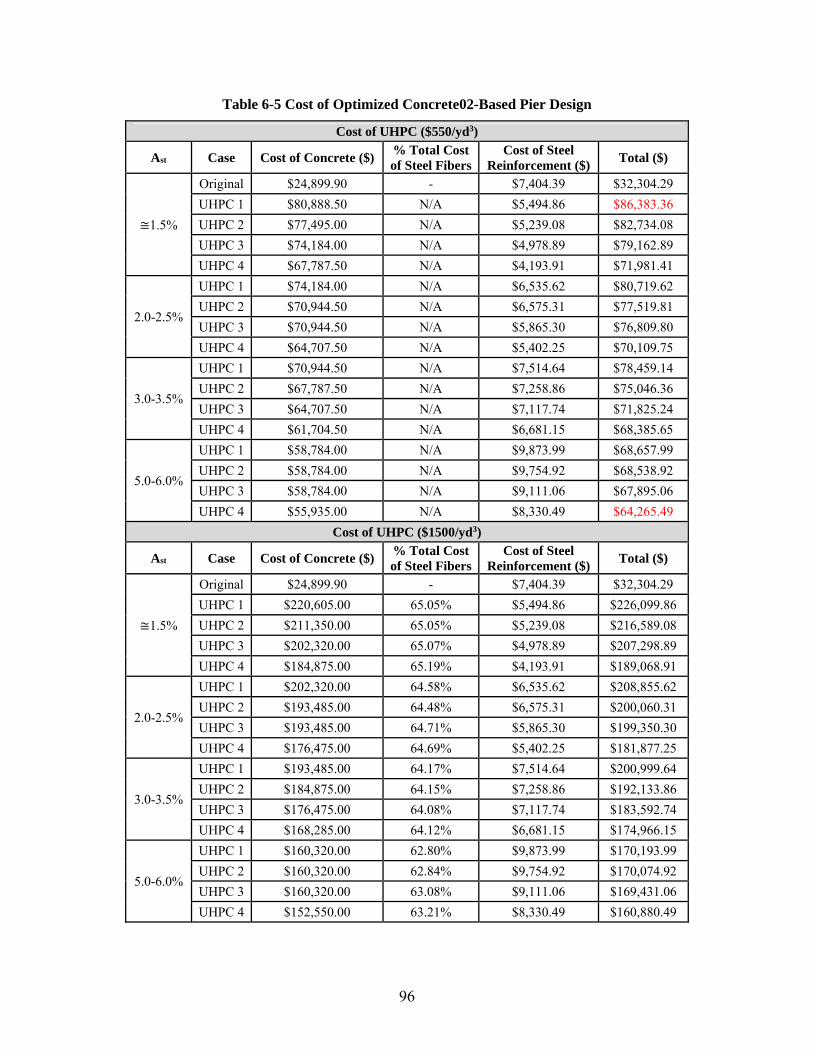
96
Table 6-5 Cost of Optimized Concrete02-Based Pier Design
Cost of UHPC ($550/yd3)
Ast Case Cost of Concrete ($) % Total Cost of Steel Fibers
Cost of Steel Reinforcement ($)
Total ($)
≅1.5%
Original $24,899.90 - $7,404.39 $32,304.29
UHPC 1 $80,888.50 N/A $5,494.86 $86,383.36
UHPC 2 $77,495.00 N/A $5,239.08 $82,734.08
UHPC 3 $74,184.00 N/A $4,978.89 $79,162.89
UHPC 4 $67,787.50 N/A $4,193.91 $71,981.41
2.0-2.5%
UHPC 1 $74,184.00 N/A $6,535.62 $80,719.62
UHPC 2 $70,944.50 N/A $6,575.31 $77,519.81
UHPC 3 $70,944.50 N/A $5,865.30 $76,809.80
UHPC 4 $64,707.50 N/A $5,402.25 $70,109.75
3.0-3.5%
UHPC 1 $70,944.50 N/A $7,514.64 $78,459.14
UHPC 2 $67,787.50 N/A $7,258.86 $75,046.36
UHPC 3 $64,707.50 N/A $7,117.74 $71,825.24
UHPC 4 $61,704.50 N/A $6,681.15 $68,385.65
5.0-6.0%
UHPC 1 $58,784.00 N/A $9,873.99 $68,657.99
UHPC 2 $58,784.00 N/A $9,754.92 $68,538.92
UHPC 3 $58,784.00 N/A $9,111.06 $67,895.06
UHPC 4 $55,935.00 N/A $8,330.49 $64,265.49
Cost of UHPC ($1500/yd3)
Ast Case Cost of Concrete ($) % Total Cost of Steel Fibers
Cost of Steel Reinforcement ($)
Total ($)
≅1.5%
Original $24,899.90 - $7,404.39 $32,304.29
UHPC 1 $220,605.00 65.05% $5,494.86 $226,099.86
UHPC 2 $211,350.00 65.05% $5,239.08 $216,589.08
UHPC 3 $202,320.00 65.07% $4,978.89 $207,298.89
UHPC 4 $184,875.00 65.19% $4,193.91 $189,068.91
2.0-2.5%
UHPC 1 $202,320.00 64.58% $6,535.62 $208,855.62
UHPC 2 $193,485.00 64.48% $6,575.31 $200,060.31
UHPC 3 $193,485.00 64.71% $5,865.30 $199,350.30
UHPC 4 $176,475.00 64.69% $5,402.25 $181,877.25
3.0-3.5%
UHPC 1 $193,485.00 64.17% $7,514.64 $200,999.64
UHPC 2 $184,875.00 64.15% $7,258.86 $192,133.86
UHPC 3 $176,475.00 64.08% $7,117.74 $183,592.74
UHPC 4 $168,285.00 64.12% $6,681.15 $174,966.15
5.0-6.0%
UHPC 1 $160,320.00 62.80% $9,873.99 $170,193.99
UHPC 2 $160,320.00 62.84% $9,754.92 $170,074.92
UHPC 3 $160,320.00 63.08% $9,111.06 $169,431.06
UHPC 4 $152,550.00 63.21% $8,330.49 $160,880.49
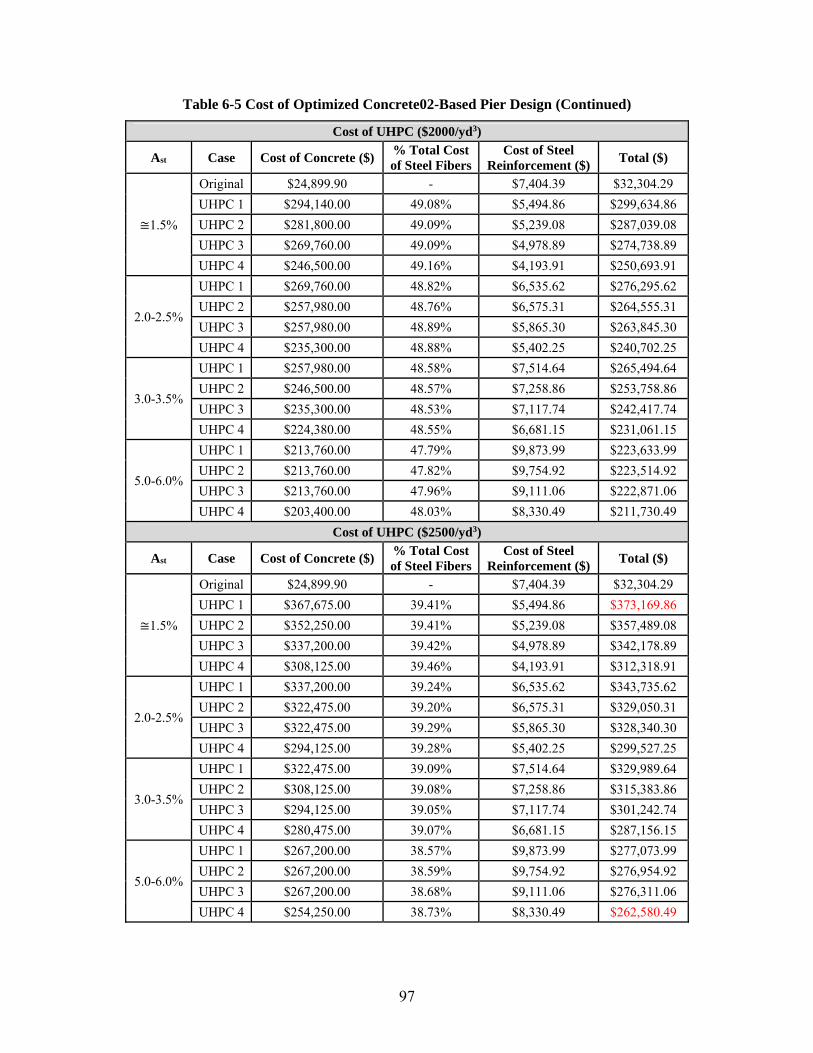
97
Table 6-5 Cost of Optimized Concrete02-Based Pier Design (Continued)
Cost of UHPC ($2000/yd3)
Ast Case Cost of Concrete ($) % Total Cost of Steel Fibers
Cost of Steel Reinforcement ($)
Total ($)
≅1.5%
Original $24,899.90 - $7,404.39 $32,304.29
UHPC 1 $294,140.00 49.08% $5,494.86 $299,634.86
UHPC 2 $281,800.00 49.09% $5,239.08 $287,039.08
UHPC 3 $269,760.00 49.09% $4,978.89 $274,738.89
UHPC 4 $246,500.00 49.16% $4,193.91 $250,693.91
2.0-2.5%
UHPC 1 $269,760.00 48.82% $6,535.62 $276,295.62
UHPC 2 $257,980.00 48.76% $6,575.31 $264,555.31
UHPC 3 $257,980.00 48.89% $5,865.30 $263,845.30
UHPC 4 $235,300.00 48.88% $5,402.25 $240,702.25
3.0-3.5%
UHPC 1 $257,980.00 48.58% $7,514.64 $265,494.64
UHPC 2 $246,500.00 48.57% $7,258.86 $253,758.86
UHPC 3 $235,300.00 48.53% $7,117.74 $242,417.74
UHPC 4 $224,380.00 48.55% $6,681.15 $231,061.15
5.0-6.0%
UHPC 1 $213,760.00 47.79% $9,873.99 $223,633.99
UHPC 2 $213,760.00 47.82% $9,754.92 $223,514.92
UHPC 3 $213,760.00 47.96% $9,111.06 $222,871.06
UHPC 4 $203,400.00 48.03% $8,330.49 $211,730.49
Cost of UHPC ($2500/yd3)
Ast Case Cost of Concrete ($) % Total Cost of Steel Fibers
Cost of Steel Reinforcement ($)
Total ($)
≅1.5%
Original $24,899.90 - $7,404.39 $32,304.29
UHPC 1 $367,675.00 39.41% $5,494.86 $373,169.86
UHPC 2 $352,250.00 39.41% $5,239.08 $357,489.08
UHPC 3 $337,200.00 39.42% $4,978.89 $342,178.89
UHPC 4 $308,125.00 39.46% $4,193.91 $312,318.91
2.0-2.5%
UHPC 1 $337,200.00 39.24% $6,535.62 $343,735.62
UHPC 2 $322,475.00 39.20% $6,575.31 $329,050.31
UHPC 3 $322,475.00 39.29% $5,865.30 $328,340.30
UHPC 4 $294,125.00 39.28% $5,402.25 $299,527.25
3.0-3.5%
UHPC 1 $322,475.00 39.09% $7,514.64 $329,989.64
UHPC 2 $308,125.00 39.08% $7,258.86 $315,383.86
UHPC 3 $294,125.00 39.05% $7,117.74 $301,242.74
UHPC 4 $280,475.00 39.07% $6,681.15 $287,156.15
5.0-6.0%
UHPC 1 $267,200.00 38.57% $9,873.99 $277,073.99
UHPC 2 $267,200.00 38.59% $9,754.92 $276,954.92
UHPC 3 $267,200.00 38.68% $9,111.06 $276,311.06
UHPC 4 $254,250.00 38.73% $8,330.49 $262,580.49

98
Table 6-6 Cost of Optimized Concrete04-Based Pier Design
Cost of UHPC ($550/yd3)
Ast Case Cost of Concrete ($) % Total Cost of Steel Fibers
Cost of Steel Reinforcement ($)
Total ($)
≅1.5%
Original $24,899.90 - $7,404.39 $32,304.29
UHPC 1 $91,536.50 N/A $6,941.34 $98,477.84
UHPC 2 $87,906.50 N/A $6,451.83 $94,358.33
UHPC 3 $84,359.00 N/A $6,015.24 $90,374.24
UHPC 4 $77,495.00 N/A $5,468.40 $82,963.40
2.0-2.5%
UHPC 1 $80,888.50 N/A $8,286.39 $89,174.89
UHPC 2 $77,495.00 N/A $7,563.15 $85,058.15
UHPC 3 $77,495.00 N/A $7,153.02 $84,648.02
UHPC 4 $70,944.50 N/A $6,689.97 $77,634.47
3.0-3.5%
UHPC 1 $74,184.00 N/A $9,521.19 $83,705.19
UHPC 2 $70,944.50 N/A $9,031.68 $79,976.18
UHPC 3 $70,944.50 N/A $8,273.16 $79,217.66
UHPC 4 $67,787.50 N/A $7,902.72 $75,690.22
5.0-6.0%
UHPC 1 $64,707.50 N/A $11,263.14 $75,970.64
UHPC 2 $61,704.50 N/A $10,244.43 $71,948.93
UHPC 3 $61,704.50 N/A $10,015.11 $71,719.61
UHPC 4 $58,784.00 N/A $9,754.92 $68,538.92
Cost of UHPC ($1500/yd3)
Ast Case Cost of Concrete ($) % Total Cost of Steel Fibers
Cost of Steel Reinforcement ($)
Total ($)
≅1.5%
Original $24,899.90 - $7,404.39 $32,304.29
UHPC 1 $249,645.00 64.86% $6,941.34 $256,586.34
UHPC 2 $239,745.00 64.92% $6,451.83 $246,196.83
UHPC 3 $230,070.00 64.97% $6,015.24 $236,085.24
UHPC 4 $211,350.00 64.99% $5,468.40 $216,818.40
2.0-2.5%
UHPC 1 $220,605.00 64.25% $8,286.39 $228,891.39
UHPC 2 $211,350.00 64.36% $7,563.15 $218,913.15
UHPC 3 $211,350.00 64.48% $7,153.02 $218,503.02
UHPC 4 $193,485.00 64.44% $6,689.97 $200,174.97
3.0-3.5%
UHPC 1 $202,320.00 63.67% $9,521.19 $211,841.19
UHPC 2 $193,485.00 63.69% $9,031.68 $202,516.68
UHPC 3 $193,485.00 63.93% $8,273.16 $201,758.16
UHPC 4 $184,875.00 63.93% $7,902.72 $192,777.72
5.0-6.0%
UHPC 1 $176,475.00 62.67% $11,263.14 $187,738.14
UHPC 2 $168,285.00 62.84% $10,244.43 $178,529.43
UHPC 3 $168,285.00 62.92% $10,015.11 $178,300.11
UHPC 4 $160,320.00 62.84% $9,754.92 $170,074.92

99
Table 6-6 Cost of Optimized Concrete04-Based Pier Design (Continued)
Cost of UHPC ($2000/yd3)
Ast Case Cost of Concrete ($) % Total Cost of Steel Fibers
Cost of Steel Reinforcement ($)
Total ($)
≅1.5%
Original $24,899.90 - $7,404.39 $32,304.29
UHPC 1 $332,860.00 48.98% $6,941.34 $339,801.34
UHPC 2 $319,660.00 49.01% $6,451.83 $326,111.83
UHPC 3 $306,760.00 49.04% $6,015.24 $312,775.24
UHPC 4 $281,800.00 49.05% $5,468.40 $287,268.40
2.0-2.5%
UHPC 1 $294,140.00 48.63% $8,286.39 $302,426.39
UHPC 2 $281,800.00 48.69% $7,563.15 $289,363.15
UHPC 3 $281,800.00 48.76% $7,153.02 $288,953.02
UHPC 4 $257,980.00 48.74% $6,689.97 $264,669.97
3.0-3.5%
UHPC 1 $269,760.00 48.30% $9,521.19 $279,281.19
UHPC 2 $257,980.00 48.31% $9,031.68 $267,011.68
UHPC 3 $257,980.00 48.45% $8,273.16 $266,253.16
UHPC 4 $246,500.00 48.45% $7,902.72 $254,402.72
5.0-6.0%
UHPC 1 $235,300.00 47.72% $11,263.14 $246,563.14
UHPC 2 $224,380.00 47.82% $10,244.43 $234,624.43
UHPC 3 $224,380.00 47.86% $10,015.11 $234,395.11
UHPC 4 $213,760.00 47.82% $9,754.92 $223,514.92
Cost of UHPC ($2500/yd3)
Ast Case Cost of Concrete ($) % Total Cost of Steel Fibers
Cost of Steel Reinforcement ($)
Total ($)
≅1.5%
Original $24,899.90 - $7,404.39 $32,304.29
UHPC 1 $416,075.00 39.34% $6,941.34 $423,016.34
UHPC 2 $399,575.00 39.36% $6,451.83 $406,026.83
UHPC 3 $383,450.00 39.38% $6,015.24 $389,465.24
UHPC 4 $352,250.00 39.39% $5,468.40 $357,718.40
2.0-2.5%
UHPC 1 $367,675.00 39.12% $8,286.39 $375,961.39
UHPC 2 $352,250.00 39.16% $7,563.15 $359,813.15
UHPC 3 $352,250.00 39.20% $7,153.02 $359,403.02
UHPC 4 $322,475.00 39.19% $6,689.97 $329,164.97
3.0-3.5%
UHPC 1 $337,200.00 38.90% $9,521.19 $346,721.19
UHPC 2 $322,475.00 38.91% $9,031.68 $331,506.68
UHPC 3 $322,475.00 39.00% $8,273.16 $330,748.16
UHPC 4 $308,125.00 39.00% $7,902.72 $316,027.72
5.0-6.0%
UHPC 1 $294,125.00 38.52% $11,263.14 $305,388.14
UHPC 2 $280,475.00 38.59% $10,244.43 $290,719.43
UHPC 3 $280,475.00 38.62% $10,015.11 $290,490.11
UHPC 4 $267,200.00 38.59% $9,754.92 $276,954.92

100
7 Ecological Assessment
This chapter presents the ecological assessment and environmental impact analysis conducted for
the different UHPC and NSC bridge pier cases. A detailed background section for energy
consumption and global warming potential associated with concrete industries is presented first.
This background section is included here for convenience as it provides the necessary data used in
the ecological assessment.
7.1 ENERGY CONSUMPTION AND GLOBAL WARMING POTENTIAL
Cement production accounted for 9.5% of global carbon dioxide (CO2) emissions in 2013. These
high emissions are caused by a combination of carbonate oxidation during the cement clinker
production process and fuel combustion during the general cement production within the kiln
(Olivier et al., 2014). Limestone, a primary component of cement production, is made up of
calcium carbonate. When heated to approximately 2700oF, the limestone breaks down into calcium
oxide and CO2 contributing to roughly 50% of all CO2 emissions from cement production
(Rubenstein, 2012). Unfortunately, concrete is still the second most consumed substance on Earth
next to water and will continually contribute to the global CO2 emissions. In 2013, China’s cement
use contributed to approximately 57.8% of global cement emissions with India and the European
Union following at 6.1% and 5.0% respectively. United States, Turkey, Russia, Japan, Iran, and
Brazil followed next with each country contributing between 1.5% and 2.09% in global cement
emissions (Olivier et al., 2014).
The four main steps of manufacturing portland cement include the following:
Quarry and Crush: Raw materials are extracted from the earth and are crushed into two
inch pieces stockpiled.
Raw Meal Preparation: Materials are moved from stockpiles, proportioned to the right
chemical composition, ground, and blended.
Pyroprocess: The materials are processed to remove water, calcinating limestone and
causing the mix components to react.
Clinker, a stony residue from a furnace or burned coal, is produced, cooled, and stored.

101
Finishing Grind: The clinker is extracted from storage, gypsum is added, and the mix is
round to a fine powder. The final product is then moved to storage and prepped for shipping.
(Portland Cement Association, 2006)
Table 7-1 summarizes the fuel and electricity input for four cement plant processes (wet, long dry,
dry with preheater, and dry with preheater and precalciner) and the weighted production average
in the United States. Each process creates the same product but differs mostly in energy
consumption. The wet process feeds raw material directly into the kiln as a slurry and averages 5.5
MBTu (million British thermal unit)/ton of concrete compared to the dry process (powder) with
preheater and precalciner which averages 3.6 MBTu/ton of concrete. Approximately 55% of
cement plants utilize post-consumer or industrial waste products as a fuel for combustion processes
during cement production. A few types of these waste products include tire-derived wastes, waste
oil, and solvents and are sometimes even combined by a few cement plants (PCA, 2006). Table 7-
2 summarizes the energy input by cement plant process type.
Table 7-1 Fuel and Electricity Input by Cement Process Type (Portland Cement Association, 2006)
Wet Long Dry Preheater Precalciner Average Fuel and Electricity Fuel or Electricity Unit/Ton of Cement
Coal (ton) 0.121 0.106 0.117 0.101 0.107 Gasoline (gallon) 0.0834 0.0118 0.0255 0.0233 0.0319
Liquefied Petroleum Gas (gallon) 0 0.0096 0.001 0.0035 0.0034 Middle Distillates (gallon) 0.171 0.16 0.193 0.326 0.255
Natural Gas (ft3) 0.066 0.171 0.12 0.232 0.178 Petroleum Coke (ton) 0.0326 0.0528 0.0139 0.0134 0.0223 Residual Oil (gallon) 0.0043 0.0131 0 0.015 0.0106
Wastes (ton) 0.0634 0.008 0.0037 0.0103 0.0177 Electricity (kWh) 125 136 136 130 131
Table 7-2 Energy Input by Cement Process Type (Portland Cement Association, 2006)
Wet Long Dry Preheater Precalciner Average Energy Source MBtu/Metric Ton of Cement
Coal 2.719 2.388 2.633 2.283 2.425 Gasoline 0.0104 0.0015 0.0032 0.0029 0.004
Liquefied Petroleum Gas 0 0.0009 0.0001 0.0003 0.0003 Middle Distillates 0.0238 0.0222 0.0267 0.0452 0.0354
Natural Gas 0.0676 0.174 0.123 0.237 0.182 Petroleum Coke 0.983 1.59 0.419 0.404 0.673
Residual Oil 0.0006 0.002 0 0.0022 0.0016 Wastes 1.269 0.161 0.075 0.206 0.354
Electricity 0.425 0.465 0.464 0.444 0.447 Total 5.499 4.804 3.743 3.626 4.122
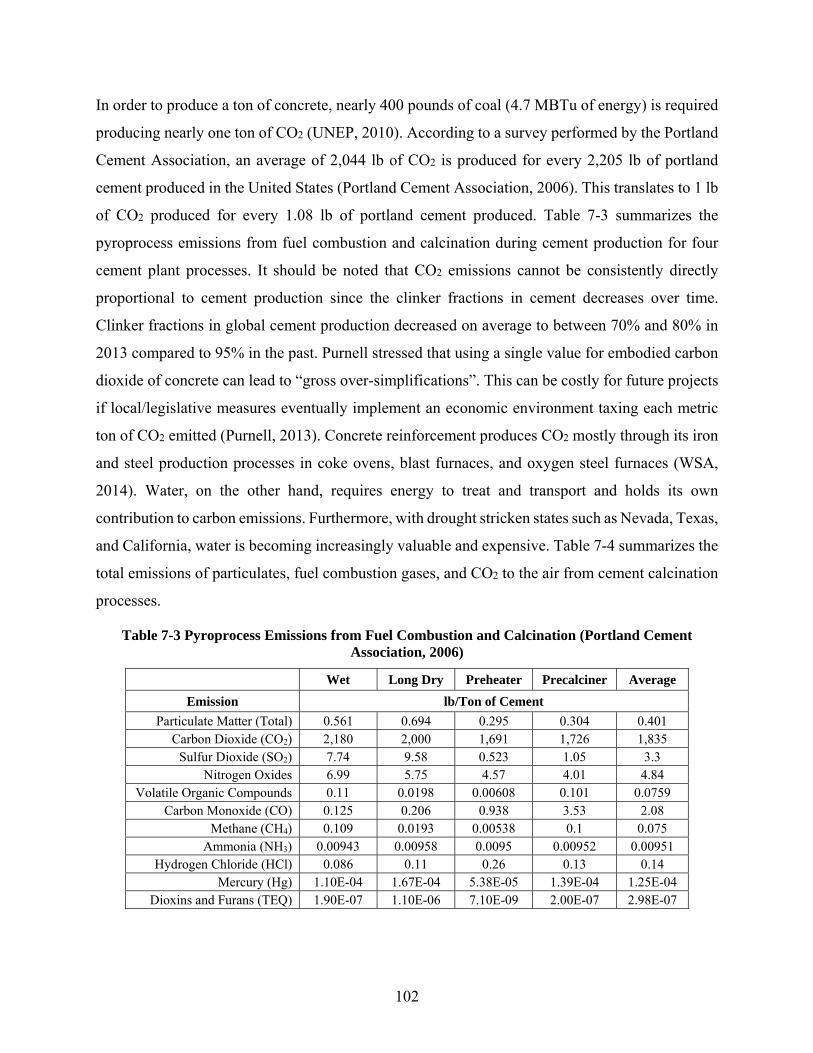
102
In order to produce a ton of concrete, nearly 400 pounds of coal (4.7 MBTu of energy) is required
producing nearly one ton of CO2 (UNEP, 2010). According to a survey performed by the Portland
Cement Association, an average of 2,044 lb of CO2 is produced for every 2,205 lb of portland
cement produced in the United States (Portland Cement Association, 2006). This translates to 1 lb
of CO2 produced for every 1.08 lb of portland cement produced. Table 7-3 summarizes the
pyroprocess emissions from fuel combustion and calcination during cement production for four
cement plant processes. It should be noted that CO2 emissions cannot be consistently directly
proportional to cement production since the clinker fractions in cement decreases over time.
Clinker fractions in global cement production decreased on average to between 70% and 80% in
2013 compared to 95% in the past. Purnell stressed that using a single value for embodied carbon
dioxide of concrete can lead to “gross over-simplifications”. This can be costly for future projects
if local/legislative measures eventually implement an economic environment taxing each metric
ton of CO2 emitted (Purnell, 2013). Concrete reinforcement produces CO2 mostly through its iron
and steel production processes in coke ovens, blast furnaces, and oxygen steel furnaces (WSA,
2014). Water, on the other hand, requires energy to treat and transport and holds its own
contribution to carbon emissions. Furthermore, with drought stricken states such as Nevada, Texas,
and California, water is becoming increasingly valuable and expensive. Table 7-4 summarizes the
total emissions of particulates, fuel combustion gases, and CO2 to the air from cement calcination
processes.
Table 7-3 Pyroprocess Emissions from Fuel Combustion and Calcination (Portland Cement Association, 2006)
Wet Long Dry Preheater Precalciner Average
Emission lb/Ton of Cement
Particulate Matter (Total) 0.561 0.694 0.295 0.304 0.401 Carbon Dioxide (CO2) 2,180 2,000 1,691 1,726 1,835
Sulfur Dioxide (SO2) 7.74 9.58 0.523 1.05 3.3 Nitrogen Oxides 6.99 5.75 4.57 4.01 4.84
Volatile Organic Compounds 0.11 0.0198 0.00608 0.101 0.0759 Carbon Monoxide (CO) 0.125 0.206 0.938 3.53 2.08
Methane (CH4) 0.109 0.0193 0.00538 0.1 0.075 Ammonia (NH3) 0.00943 0.00958 0.0095 0.00952 0.00951
Hydrogen Chloride (HCl) 0.086 0.11 0.26 0.13 0.14 Mercury (Hg) 1.10E-04 1.67E-04 5.38E-05 1.39E-04 1.25E-04
Dioxins and Furans (TEQ) 1.90E-07 1.10E-06 7.10E-09 2.00E-07 2.98E-07

103
Another study conducted by Feiz et al. (2015) evaluated the global warming potential of clinker
and three common cement products produced by various cement production plants.
CEM I 42.5 – Also known as portland cement with approximately 92% clinker content.
CEM III/A 42.5 – A blended cement type with approximately 50% clinker content.
CEM III/B 42.5 – A blended cement with GGBFS as a supplementary cementitious
material that has approximately 27% clinker content.
Table 7-4 Total Emissions to the Air (Portland Cement Association, 2006)
Wet Long Dry Preheater Precalciner Average
Emission lb/Ton of Cement
Particulate Matter (Total) 5.25 4.92 4.14 4.64 4.7 Particulate Matter (PM-10*) 0.648 0.575 0.531 0.598 0.593 Particulate Matter (PM-2.5*) 1.98E-04 1.82E-04 1.69E-04 1.81E-04 1.82E-04
Carbon Dioxide (CO2) 2,200 2,010 1,700 1,750 1,850 Sulfur Dioxide (SO2) 7.76 9.60 0.544 1.08 3.32
Nitrogen Oxides 7.16 5.87 4.7 4.2 5.01 Volatile Organic Compounds 0.132 0.0372 0.0256 0.13 0.1
Carbon Monoxide (CO) 0.249 0.293 1.04 3.68 2.21 Methane (CH4) 0.112 0.0222 0.00859 0.105 0.0791
Ammonia (NH3) 0.00943 0.00958 0.0095 0.00952 0.00951 Hydrogen Chloride (HCl) 0.086 0.11 0.26 0.13 0.14
Mercury (Hg) 1.10E-04 1.67E-04 5.38E-05 1.39E-04 1.25E-04 Dioxins and Furans (TEQ) 1.90E-07 1.10E-06 7.10E-09 2.00E-07 2.98E-07
*PM-10 is particulate matter with a median mass aerodynamic diameter of 10 micrometers or less *PM-2.5 is particulate matter with a median mass aerodynamic diameter of 2.5 micrometers or less
The CO2 emissions and various ratios for clinker, each cement product from three different cement
plants, and the average is summarized in Table 7-5. The cement plants are located in Germany and
include Kollenbach (Beckum), Dortmund (Dortmund), and Schwelgern (Duisburg). Feiz et al.
(2015) found that nearly 90% of the CO2 emissions for clinker wre connected to the Kollenbach
plant with 64% due to calcination, 10% due to the combustion of kiln coal, and 8% due to the
refused derived fuels (RDF). Table 7-6 is an excerpt from the Feiz et al. (2015) study breaking
down the life cycle and energy consumption of clinker in the Kollenbach plant.
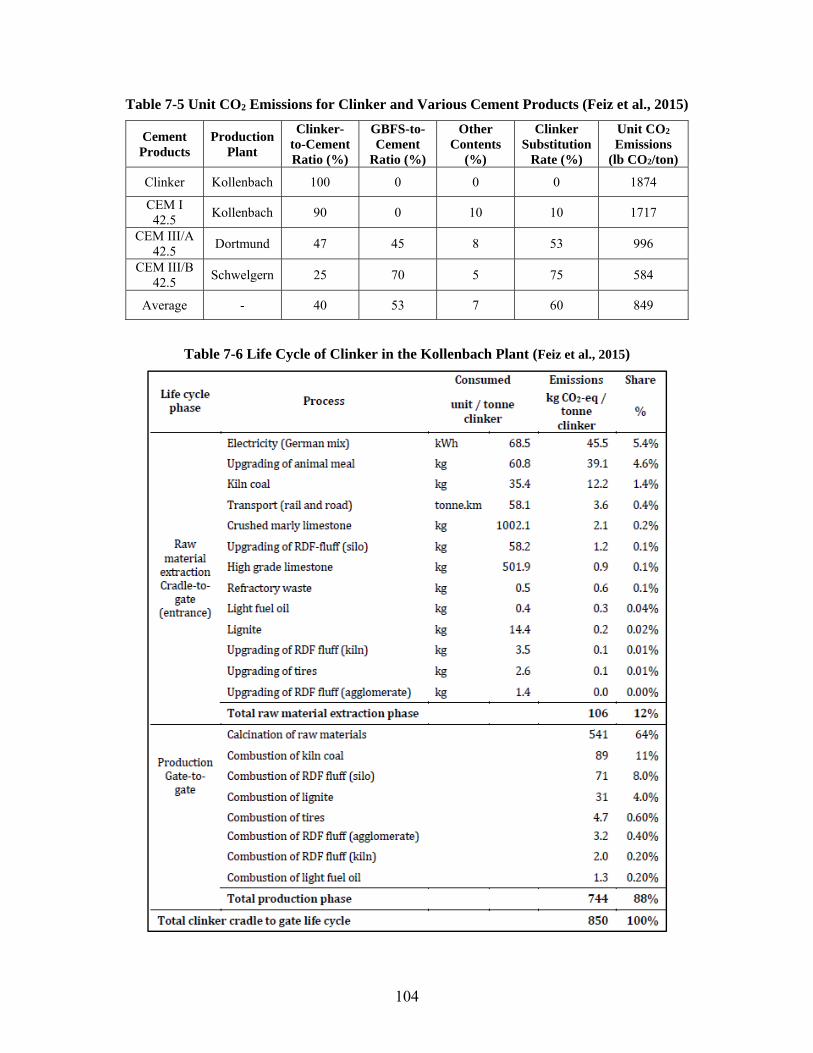
104
Table 7-5 Unit CO2 Emissions for Clinker and Various Cement Products (Feiz et al., 2015)
Cement Products
Production Plant
Clinker-to-Cement Ratio (%)
GBFS-to-Cement
Ratio (%)
Other Contents
(%)
Clinker Substitution
Rate (%)
Unit CO2 Emissions
(lb CO2/ton)
Clinker Kollenbach 100 0 0 0 1874
CEM I 42.5
Kollenbach 90 0 10 10 1717
CEM III/A 42.5
Dortmund 47 45 8 53 996
CEM III/B 42.5
Schwelgern 25 70 5 75 584
Average - 40 53 7 60 849
Table 7-6 Life Cycle of Clinker in the Kollenbach Plant (Feiz et al., 2015)
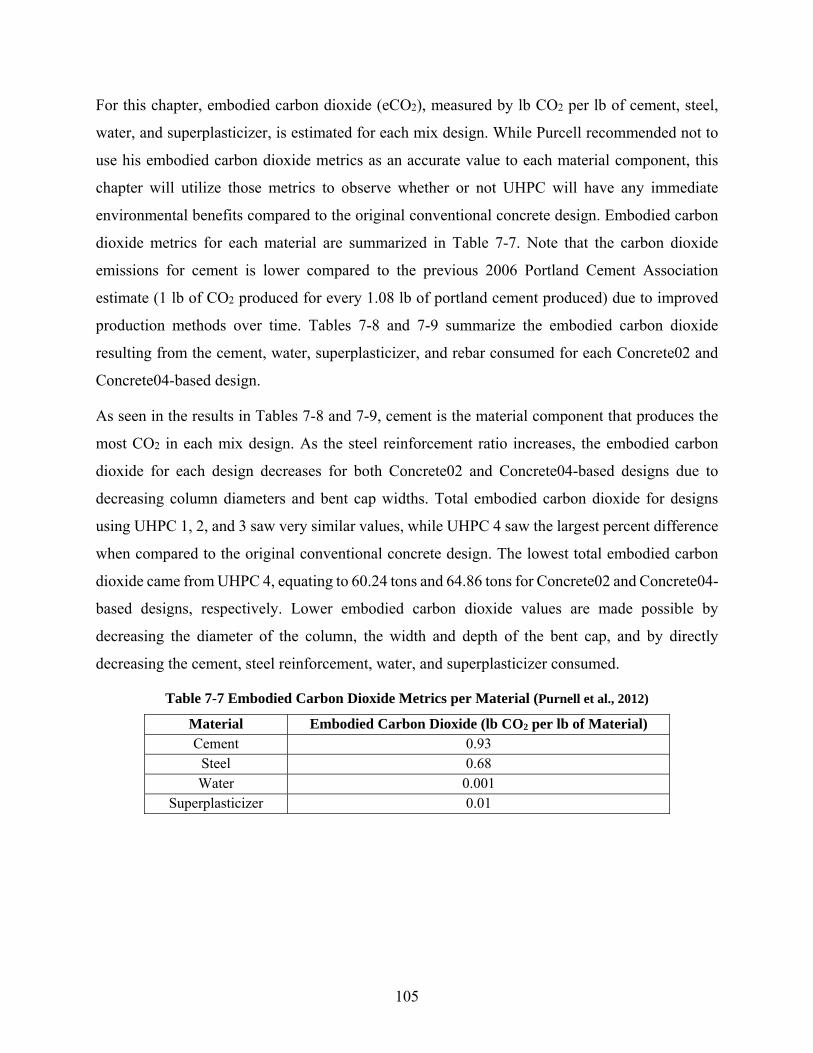
105
For this chapter, embodied carbon dioxide (eCO2), measured by lb CO2 per lb of cement, steel,
water, and superplasticizer, is estimated for each mix design. While Purcell recommended not to
use his embodied carbon dioxide metrics as an accurate value to each material component, this
chapter will utilize those metrics to observe whether or not UHPC will have any immediate
environmental benefits compared to the original conventional concrete design. Embodied carbon
dioxide metrics for each material are summarized in Table 7-7. Note that the carbon dioxide
emissions for cement is lower compared to the previous 2006 Portland Cement Association
estimate (1 lb of CO2 produced for every 1.08 lb of portland cement produced) due to improved
production methods over time. Tables 7-8 and 7-9 summarize the embodied carbon dioxide
resulting from the cement, water, superplasticizer, and rebar consumed for each Concrete02 and
Concrete04-based design.
As seen in the results in Tables 7-8 and 7-9, cement is the material component that produces the
most CO2 in each mix design. As the steel reinforcement ratio increases, the embodied carbon
dioxide for each design decreases for both Concrete02 and Concrete04-based designs due to
decreasing column diameters and bent cap widths. Total embodied carbon dioxide for designs
using UHPC 1, 2, and 3 saw very similar values, while UHPC 4 saw the largest percent difference
when compared to the original conventional concrete design. The lowest total embodied carbon
dioxide came from UHPC 4, equating to 60.24 tons and 64.86 tons for Concrete02 and Concrete04-
based designs, respectively. Lower embodied carbon dioxide values are made possible by
decreasing the diameter of the column, the width and depth of the bent cap, and by directly
decreasing the cement, steel reinforcement, water, and superplasticizer consumed.
Table 7-7 Embodied Carbon Dioxide Metrics per Material (Purnell et al., 2012)
Material Embodied Carbon Dioxide (lb CO2 per lb of Material) Cement 0.93
Steel 0.68 Water 0.001
Superplasticizer 0.01

106
Table 7-8 Embodied Carbon Dioxide for Concrete02-Based Designs
Property Original UHPC 1 UHPC 2 UHPC 3 UHPC 4
Mix No. - #1 #81 #1 #87
Cement (lb/yd3) 675 1,200 1,153 1,200 1,002
Water (lb/yd3) 335 184 196 184 190
Superplasticizer (lb/yd3) - 51.8 28.8 51.8 11.0
Ast≅1.5%
eCO2 of Cement (ton) 59.96 82.06 75.54 75.26 57.43
eCO2 of Water (ton) 0.032 0.014 0.014 0.012 0.012
eCO2 of Superplasticizer (ton) - 0.038 0.020 0.035 0.007
eCO2 of Rebar (ton) 11.42 8.47 8.08 7.68 6.47
Total eCO2 71.41 90.59 83.66 82.99 63.91
Ast≅2.0-2.5%
eCO2 of Cement (ton) 59.96 75.26 69.15 71.97 54.81
eCO2 of Water (ton) 0.032 0.012 0.013 0.012 0.011
eCO2 of Superplasticizer (ton) - 0.035 0.019 0.033 0.007
eCO2 of Rebar (ton) 11.42 10.08 10.14 9.04 8.33
Total eCO2 71.41 85.39 79.32 81.06 63.16
Ast≅3.0-3.5%
eCO2 of Cement (ton) 59.96 71.97 66.08 65.65 52.28
eCO2 of Water (ton) 0.032 0.012 0.012 0.011 0.011
eCO2 of Superplasticizer (ton) - 0.033 0.018 0.031 0.0062
eCO2 of Rebar (ton) 11.42 11.59 11.19 10.98 10.30
Total eCO2 71.41 83.61 77.30 76.67 62.59
Ast≅5.0-6.0%
eCO2 of Cement (ton) 59.96 59.64 57.31 59.64 47.38
eCO2 of Water (ton) 0.032 0.0098 0.010 0.0098 0.0097
eCO2 of Superplasticizer (ton) - 0.028 0.015 0.028 0.0056
eCO2 of Rebar (ton) 11.42 15.23 15.04 14.05 12.85
Total eCO2 71.41 74.90 72.37 73.73 60.24

107
Table 7-9 Embodied Carbon Dioxide for Concrete04-Based Designs
Property Original UHPC 1 UHPC 2 UHPC 3 UHPC 4
Mix No. - #1 #81 #1 #87
Cement (lb/yd3) 675 1,200 1,153 1,200 1,002
Water (lb/yd3) 335 184 196 184 190
Superplasticizer (lb/yd3) - 51.8 28.8 51.8 11.0
Ast≅1.5%
eCO2 of Cement (ton) 59.96 92.87 85.69 85.59 65.65
eCO2 of Water (ton) 0.032 0.015 0.016 0.014 0.013
eCO2 of Superplasticizer (ton) - 0.043 0.023 0.040 0.0077
eCO2 of Rebar (ton) 11.42 10.70 9.95 9.28 8.43
Total eCO2 71.41 103.63 95.68 94.92 74.10
Ast≅2.0-2.5%
eCO2 of Cement (ton) 59.96 82.06 75.54 78.62 60.10
eCO2 of Water (ton) 0.032 0.014 0.014 0.013 0.012
eCO2 of Superplasticizer (ton) - 0.038 0.020 0.037 0.0071
eCO2 of Rebar (ton) 11.42 12.78 11.66 11.03 10.32
Total eCO2 71.41 94.89 87.24 89.70 70.43
Ast≅3.0-3.5%
eCO2 of Cement (ton) 59.96 75.26 69.15 71.97 57.43
eCO2 of Water (ton) 0.032 0.012 0.013 0.012 0.012
eCO2 of Superplasticizer (ton) - 0.035 0.019 0.033 0.0068
eCO2 of Rebar (ton) 11.42 14.68 13.93 12.76 12.19
Total eCO2 71.41 89.99 83.11 84.77 69.63
Ast≅5.0-6.0%
eCO2 of Cement (ton) 59.96 65.65 60.15 62.60 49.80
eCO2 of Water (ton) 0.032 0.011 0.011 0.010 0.010
eCO2 of Superplasticizer (ton) - 0.031 0.016 0.029 0.0059
eCO2 of Rebar (ton) 11.42 17.37 15.80 15.44 15.04
Total eCO2 71.41 83.06 75.98 78.08 64.86
The percent difference of total embodied carbon dioxide of the original conventional concrete
design relative to the total embodied carbon dioxide of each UHPC design for Concrete02 and
Concrete04-based designs are summarized in Table 7-10. Negative percent differences in Table 7-
10 means there are net reductions in embodied carbon dioxide in UHPC designs compared to the
original conventional concrete design. Embodied carbon dioxide values for Concrete02 and
Concrete04-based designs saw a maximum, possible percent difference of -15.64% and -9.17%
respectively for steel reinforcement ratios at 5.0-6.0% due to having the smallest cross-sections
achieved.
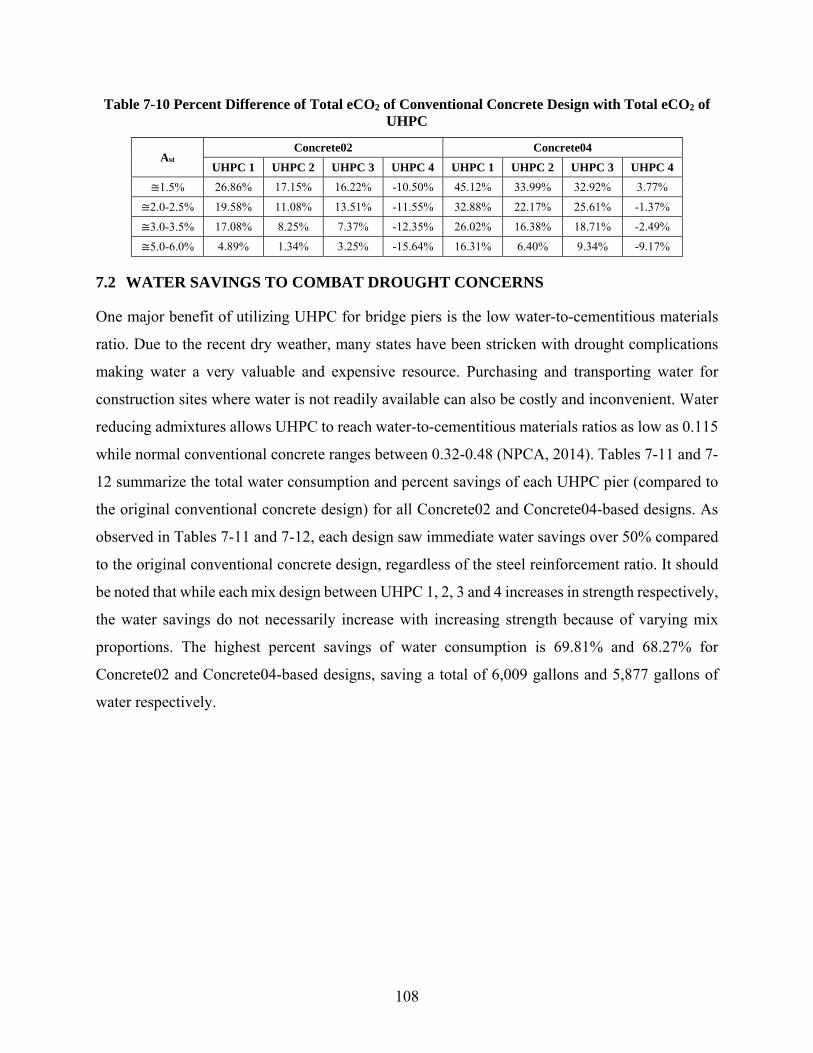
108
Table 7-10 Percent Difference of Total eCO2 of Conventional Concrete Design with Total eCO2 of UHPC
Ast Concrete02 Concrete04
UHPC 1 UHPC 2 UHPC 3 UHPC 4 UHPC 1 UHPC 2 UHPC 3 UHPC 4
≅1.5% 26.86% 17.15% 16.22% -10.50% 45.12% 33.99% 32.92% 3.77%
≅2.0-2.5% 19.58% 11.08% 13.51% -11.55% 32.88% 22.17% 25.61% -1.37%
≅3.0-3.5% 17.08% 8.25% 7.37% -12.35% 26.02% 16.38% 18.71% -2.49%
≅5.0-6.0% 4.89% 1.34% 3.25% -15.64% 16.31% 6.40% 9.34% -9.17%
7.2 WATER SAVINGS TO COMBAT DROUGHT CONCERNS
One major benefit of utilizing UHPC for bridge piers is the low water-to-cementitious materials
ratio. Due to the recent dry weather, many states have been stricken with drought complications
making water a very valuable and expensive resource. Purchasing and transporting water for
construction sites where water is not readily available can also be costly and inconvenient. Water
reducing admixtures allows UHPC to reach water-to-cementitious materials ratios as low as 0.115
while normal conventional concrete ranges between 0.32-0.48 (NPCA, 2014). Tables 7-11 and 7-
12 summarize the total water consumption and percent savings of each UHPC pier (compared to
the original conventional concrete design) for all Concrete02 and Concrete04-based designs. As
observed in Tables 7-11 and 7-12, each design saw immediate water savings over 50% compared
to the original conventional concrete design, regardless of the steel reinforcement ratio. It should
be noted that while each mix design between UHPC 1, 2, 3 and 4 increases in strength respectively,
the water savings do not necessarily increase with increasing strength because of varying mix
proportions. The highest percent savings of water consumption is 69.81% and 68.27% for
Concrete02 and Concrete04-based designs, saving a total of 6,009 gallons and 5,877 gallons of
water respectively.

109
Table 7-11 Total Water Consumption and Savings for Concrete02-Based Designs
Property Original UHPC 1 UHPC 2 UHPC 3 UHPC 4 Mix No. - #1 #81 #1 #87 f’c (psi) 4,000 17,260 21,147 28,900 36,360 ft (psi) - 1,300 1,500* 1,700 2,611 Water (lb/yd3) 335 184 196 184 190
Ast≅1.5% Total Water Consumed (gallons) 8,608 3,640 3,715 3,338 3,150 Total Water Saved (gallons) - 4,968 4,893 5,270 5,458 Percent Savings - 57.71% 56.84% 61.22% 63.41%
Ast≅2.0-2.5% Total Water Consumed (gallons) 8,608 3,338 3,401 3,192 3,007 Total Water Saved (gallons) - 5,270 5,207 5,416 5,601 Percent Savings - 61.22% 60.49% 62.92% 65.07%
Ast≅3.0-3.5% Total Water Consumed (gallons) 8,608 3,192 3,249 2,912 2,867 Total Water Saved (gallons) - 5,416 5,359 5,696 5,741 Percent Savings - 62.92% 62.26% 66.17% 66.69%
Ast≅5.0-6.0% Total Water Consumed (gallons) 8,608 2,645 2,818 2,645 2,599 Total Water Saved (gallons) - 5,963 5,790 5,963 6,009 Percent Savings - 69.27% 67.26% 69.27% 69.81%
Table 7-12 Total Water Consumption and Savings for Concrete04-Based Designs
Property Original UHPC 1 UHPC 2 UHPC 3 UHPC 4 Mix No. - #1 #81 #1 #87 f’c (psi) 4,000 17,260 21,147 28,900 36,360 ft (psi) - 1,300 1,500* 1,700 2,611 Water (lb/yd3) 335 184 196 184 190
Ast≅1.5% Total Water consumed (gallons) 8,608 4,119 4,214 3,796 3,601 Total Water Saved (gallons) - 4,489 4,394 4,812 5,007 Percent Savings - 52.15% 51.05% 55.90% 58.17%
Ast≅2.0-2.5% Total Water Consumed (gallons) 8,608 3,640 3,715 3,487 3,296 Total Water Saved (gallons) - 4,968 4,893 5,121 5,312 Percent Savings - 57.71% 56.84% 59.49% 61.71%
Ast≅3.0-3.5% Total Water Consumed (gallons) 8,608 3,338 3,401 3,192 3,150 Total Water Saved (gallons) - 5,270 5,207 5,416 5,458 Percent Savings - 61.22% 60.49% 62.92% 63.41%
Ast≅5.0-6.0% Total Water Consumed (gallons) 8,608 2,912 2,958 2,777 2,731 Total Water Saved (gallons) - 5,696 5,650 5,831 5,877 Percent Savings - 66.17% 65.64% 67.74% 68.27%
110
8 Summary and Conclusions
This study examined the effectiveness of substituting conventional concrete in a multi-column
bent of a typical California highway bridge with UHPC. The investigation began by exploring
various published UHPC mix designs and selecting four designs to use, each with increasing
strength. The four UHPC mix designs were used to optimize column and bent cap dimensions
using existing and slightly modified concrete material models in OpenSees with actual UHPC
mechanical properties. The objective was to find an overall design that performed equivalently
(columns that form plastic hinges with bent caps that are virtually elastic under seismic loading),
if not better, than the original conventional concrete design. Four ranges of reinforcement ratios
(Ast = ~1.5%, 2.0-2.5%, 3.0-3.5%, and 5.0-6.0%) were also considered to investigate its effect on
optimal utilization of the superior UHPC mechanical strength.
A two-dimensional OpenSees model was developed for each of the UHPC two-column bents, and
nonlinear pushover and time history (response) seismic analyses were performed. The seismic
analysis provided a final design check for each bent. The finalized designs were used to conduct a
monetary and ecological cost analysis and assessment. The cost per bridge pier for each UHPC
design was estimated using the following range of values: $550/yd3, $1,500/yd3, $2,000/yd3, and
$2,500/yd3 of UHPC Moreover, the expected increase in the overall bridge construction cost due
replacing conventional concrete with UHPC was estimated. Finally, an environmental assessment
was conducted to estimate the global warming potential associated with UHPC bridge piers and
potential savings in water as a result of the lower water-to-cement ratios adopted in UHPC mixes.
This can potentially justify the use of UHPC from an ecological point of view given that UHPC
consumes more cement than conventional concretes. According to the study presented in this
report and briefly summarized above, the following conclusions can be drawn:
Using UHPC for bridge columns and bent caps led to much more compact cross-sections with
column diameter and overall volume reductions, relative to using conventional concrete, as
high as 36% and 47%, respectively. Using varying longitudinal steel reinforcement ratios for
optimizing the UHPC designs, higher steel ratios were found to lead to further reductions in
cross-section dimensions. The 5-6% reinforcement ratio produced the most compact cross-
sections. However, design codes currently limit columns maximum reinforcement ratio to 4%
111
to avoid over-reinforced concrete sections that might lead to brittle modes of failure. Thus, for
UHPC sections, a 3.5%-4% reinforcement ratio may be most practical unless future research
can demonstrate the value of higher ratios.
The UHPC bridge piers showed acceptable seismic performance under the four different
ground motions used in this study, which were applied at the design level and maximum
considered earthquake. The overall structural and seismic response of the UHPC piers was
comparable or even superior to conventional concrete piers by consistently achieving lower
residual displacements and peak deformations.
Naturally, by reducing the cross-sections of the UHPC bridge columns and bent cap, less
materials are consumed. However, due to the higher UHPC unit material costs relative to
conventional concrete, the cost of an optimized UHPC pier was found to be much higher than
conventional concrete. If this additional material cost is accounted for in the overall cost of the
full prototype bridge, the use of UHPC in bridge piers is estimated to increase the bridge cost
by 10.7% to 18.2% based on a cost of $2,500/yd3 of UHPC. For the $550/yd3 of UHPC
estimate, the bridge cost is estimated to increase by 1.5% to 3.1%. These ranges are lower and
upper bounds based on UHPC mix design, reinforcement ratio, and modeling assumptions used
in design optimization. Thus, if UHPC unit material cost drops in the future to be within the
current price range as in Europe ($550/yd3), only a small increase in construction costs
happens, which is worth considering for a better structural life expectancy, seismic
performance, and minimal maintenance.
Savings in cement consumption was made possible through some of the considered UHPC
mixes for the steel ratios ~1.5%, 2.0-2.5%, and 3.0-3.5%, and for all considered mix designs
using steel ratios between 5.0-6.0%. When savings in cement are achieved, the total embodied
carbon dioxide (eCO2) of the bridge bent can reach savings as high as 11.17 tons of eCO2
relative to the conventional concrete bent. One more major benefit of utilizing UHPC over
conventional concrete is the low water-to-cement ratio. All UHPC designs achieved a percent
savings in water above 50% and reached savings as high as 70%, which can benefit many
drought stricken states such as California and Nevada.
Overall, using UHPC for structural members has been demonstrated through this study to
achieve reduced cross sections, comparable (if not better) seismic performance, savings in

112
cement, water, and overall CO2 emissions, and reasonable-to-justify additional costs. It is
anticipated that further environmental and cost benefits can be demonstrated when using
UHPC at larger scales if more accurate computational models are used in future studies. Due
to the inability of modelling the UHPC strain hardening behavior using existing computational
tools, the resulting UHPC dimensions, and in turn, material quantities and environmental
metrics are considered conservative. However, all conclusions drawn here with respect to
monetary and ecological costs are valid because the relaxed UHPC tensile strain hardening
effects will only lead to smaller column dimensions.
Finally, this study rendered several research needs to further develop confidence in using
UHPC. Extensive experimental testing of UHPC structural members in flexure and shear and
under monotonic and cyclic loading is needed to validate material property assumptions out to
large strains. Seismic dynamic tests should be conducted to investigate the damage response
of UHPC and behavior in plastic hinge zones. Such tests can provide new knowledge
pertaining to displacements, curvatures, and/or rotation capacity of UHPC members for future
performance-based design using UHPC. Accurate constitutive modeling of UHPC is also
needed to calibrate existing material models readily implemented in general purpose finite
element software or develop new numerical models.

113
REFERENCES
Ahlborn, T.M., Peuse, E.J., and Misson, D.L., “Ultra-High Performance Concrete for Michigan Bridges, Material Performance – Phase I, Final Report – November 2008.” Michigan Department of Transportation (2008)
Ahlborn, T.M., Harris, D.K., Misson, D.L., and Peuse, E.J., “Strength and Durability Characterization of Ultra-High Performance Concrete Under Variable Curing Conditions.” (2011)
Amato, I., “Green Cement: Concrete Solutions.” Nature, International Weekly Journal of Science (2013)
American Coal Ash Association, “Fly Ash 101.” The Concrete Producer (2006)
“AASHTO LRFD Bridge Design Specifications, 6th Ed.” Customary U.S. Units (2012)
Bentz, D.P., Jones, S.Z., and Snyder, K.A., “Design and Performance of Ternary Blend High-Volume Fly Ash Concretes of Moderate Slump.” (2015)
Bilodeau, A. and Malholtra, M.V., “High-Volume Fly Ash System: Concrete Solution for Sustainable Development.” ACI Materials Journal, Jan-Feb (2000)
Bouzoubaâ, N., Fournier, B., Malholtra, M.V., and Golden, D.M., “Mechanical Properties and Durability of Concrete made with HVFA Blended Cement Produced in a Cement Plant.” Materials Technology Laboratory (2001)
Bradley, D., “TR10: Green Concrete.” MIT Technology Review. Web. (2010)
Caltrans Seismic Design Criteria, Version 1.7 (2013)
Cavill, B., “Ductal® - An Ultra-High Performance Material for Resistance to Blasts and Impacts.” 1st Specialty Conference on Disaster Mitigation (2006)
Chadwell, C. B., and R. A. Imbsen. "XTRACT: A Tool for Axial Force-Ultimate Curvature Interactions." Struct. ASCE Library (2004).
Cheyrezy, M. and Behloul, M., “Creep and Shrinkage of Ultra-High Performance Concrete.” (2001)
ChunPing, G., Guang, Y., and Wei, S., “Ultrahigh Performance Concrete-Properties, Applications, and Perspectives.” (2015)
Crouch, L.K., Hewitt, R., and Byard, B., “High Volume Fly Ash Concrete.” (2007)
DeCristofaro, N. and Sahu, S., “CO2 – Reducing Cement” Solidia Technologies® – World Cement (2014)
Department of Homeland Security, Science and Technology, “UHPC, Ultra High Performance Concrete, Pathway to Commercialization.” Web. (2011)
Ductal® Solutions, “Ductal® Façades: A New Adventure in Technology.” (2011)
Ductal®, “Completed Projects.” Web. (n.d.)
Dumne, S.M., “Effect of Superplasticizer on Fresh and Hardened Properties of Self-Compacting Concrete Containing Fly Ash.” American Journal of Engineering Research (2014)

114
Feiz, R., Ammenberg, J., Baas, L., Eklund, M., Helgstrand, A., and Marshall, R., “Improving the CO2 Performance of Cement, Part I: Utilizing Life-Cycle Assessment and Key Performance Indicators to Assess Development Within the Cement Industry.” (2015)
Flietstra, J.C., “Creep and Shrinkage Behavior of Ultra High Performance Concrete under Compressive Loading with Varying Curing Regimes.” Michigan Technological University (2011)
Florida Department of Transportation (FDOT), “BDR Cost Estimating.” Structures Design Guidelines. Web. (2009)
Gauff, N., “Rubberized Asphalt Concrete (RAC).” CalRecycle. Web. (2012)
Garder, J.A., “Use of UHPC Piles in Integral Abutment Bridges.” Iowa State University (2012)
Graybeal, B.A. and Hartmann, J.L., “Strength and Durability of Ultra-High Performance Concrete.” 2003 Concrete Bridge Conference (2003)
Graybeal, B.A., “Material Property Characterization of Ultra-High Performance Concrete.” Federal Highway Administration. (2006)
Graybeal, B.A., “Structural Behavior of Ultra-High Performance Concrete Prestressed I-Griders.) Federal Highway Administration. (2006)
Graybeal, B.A., “Compressive Behavior of Ultra-High-Performance Fiber-Reinforced Concrete.” ACI Materials Journal, Title no. 104-M17. (2007)
Graybeal, B.A., “Structural Behavior of a 2nd Generation UHPC Pi-Girder.” Federal Highway Administration. (2009)
Graybeal, B.A., “Simultaneous Structural and Environmental Loading of an Ultra-High Performance Concrete Component.” Federal Highway Administration. (2010)
Graybeal, B.A. and Baby, F., “Development of Direct Tension Test Method for Ultra-High Performance Fiber-Reinforced Concrete.” (2013)
Graybeal, B.A. and Davis, M., “Cylinder or Cube: Strength Testing of 80 to 200 MPa (11.6 to 29 ksi) Ultra-High-Performance Fiber-Reinforced Concrete.” ACI Materials Journal, Nov-Dec (2008)
Imbsen, R.A., “AASHTO Guide Specifications for LRFD Seismic Bridge Design” (2007)
Hanson, K., “UHPC Offers Endless Possibilities.” NPCA (2014)
Heinz, D., Urbonas, L., and Gerlicher, T., “Effect of Heat Treatment Method on the Properties of UHPC.” 3rd International Symposium on UHPC and Nanotechnology for High Performance Construction Materials. (2012)
Huntzinger, D.N. and Eatmon, T.D., “A Life-Cycle Assessment of Portland Cement Manufacturing: Comparing the Traditional Process with Alternative Technologies.” (2008)
Khayat, K.H. and Meng, W., “Design and Performance of Stay-in-Place UHPC Prefabricated Panels for Infrastructure Construction.” (2014)
Kuhne, H.C. and Muller, U., “Properties of Heat and Steam Cured Ultra High Performance Concrete (UHPC).” BAM (n.d.)
115
Li, G., “Properties of High-Volume Fly Ash Concrete Incorporating nano-SiO2.” (2003)
Malhotra, V.M. and Mehta, P.K., “High-Performance, High-Volume Fly Ash Concrete for Building Sustainable and Durable Structures. Third Edition.” (2008)
Mander, J. B., Priestley, M. J., & Park, R. (1988). Theoretical stress-strain model for confined concrete. Journal of structural engineering, 114(8), 1804-1826.
Marceau, M.L., Nisbet, M.A., and VanGeem, M.G., “Life Cycle Inventory of Portland Cement Manufacture.” Portland Cement Association (2006)
Mehta, P.K., “High-Performance, High-Volume Fly Ash Concrete for Sustainable Development.” University of California, Berkeley (n.d.)
Mehta, P.K., “Greening of the Concrete Industry for Sustainable Development.” (2001)
Moore, B.P., “Little Cedar Creek Bridge – Big Innovation.” Creative Concrete Construction (2012)
Naaman, A.E., “Toughness, Ductility, Surface Energy and Deflection-Hardening FRC Composites.” Proceedings of JCI International Workshop on Ductile Fiber Reinforced Cementitious Composites (DFRCC) – Application and Evaluation (DFRCC-02). (2002)
Naaman, A.E. and Wille, K., “The Path to Ultra-High Performance Fiber Reinforced Concrete (UHP-FRC): Five Decades of Progress.” 3rd International Symposium of UHPC and Nanotechnology for High Performance Construction Materials. (2012)
National Ready Mixed Concrete Association (NRMCA), “CIP 36 – Structural Lightweight Concrete” (2004)
Naik, T.R., Sivasundaram, V., and Singh, S.S., “Use of High-Volume Class F Fly Ash for Structural Grade Concrete.” (1991)
Naik, T.R., Ramme, B.W., and Kraus, R.N., “Performance of High-Volume Fly Ash Concrete Pavements Constructed since 1984.” The Indian Concrete Journal. Vol 78, March (2004)
National Precast Concrete Association (NPCA), “Ultra High Performance Concrete (UHPC), Guide to Manufacturing Architectural Precast UHPC Elements.” (2013)
National Ready Mixed Concrete Association (NRMCA), “CIP 37 – Self Consolidating Concrete (SCC)” (2004)
National Ready Mixed Concrete Association (NRMCA), “CIP 38 – Pervious Concrete” (2004)
Natural Resources Canada, “CanmetENERGY.” Web. (n.d.)
Neville, A.M., “Properties of Concrete, 4th Edition.” (1995)
Olivier, J.G.J. and Muntean, M., “Trends in Global CO2 Emissions, 2014 Report.” PBL Netherlands Environmental Assessment Agency (2014)
Paragon Ready Mix Inc. “Ready Mixed Concrete Price List.” (2016)
Perry, V.H. and Seibert, P.J., “The use of UHPFRC (Ductal®) for Bridges in North America: The Technology, Applications and Challenges Facing Commercilization.” Lafarge North America Inc. (n.d.)
116
Perry, V.H. and Zakariasen, D., “First Use of Ultra-High Performance Concrete for an Innovative Train Station Canopy.” Concrete Technology Today. Vol. 25, No. 2 (2004)
Pike, C.A., “A Preliminary Investigation of Fiber Reinforced Concrete under Quasi-Static and Dynamic Loads.” North Carolina State University (2009)
Portland Cement Association, “Ultra-High Performance Concrete.” Web. (n.d.)
Prem, P.R., Bharatkumar, B.H., and Iyer, N.R., “Mechanical Properties of Ultra High Performance Concrete.” (2012)
Probha, S.L., Dattatreya, J.K., Neelamegam, M., “Stress Strain Behaviour of Ultra High Performance Concrete Under Uniaxial Compression.” (2014)
Purnell, P., “The Carbon Footprint of Reinforced Concrete.” Advances in Cement Research. (2013)
Randl, N., Steiner, T., Baumgartner, E., and Mészöly, T., “Development of UHPC Mixtures from an Ecological Point of View.” (2014)
Ritter, R. and Curbach, M., “Material Behavior of Ultra-High Strength Concrete under Multiaxial Stress States” ACI Materials Journal, Sept-Oct (2015)
Rubenstein, M., “Emissions from the Cement Industry.” State of the Planet, Earth Institute | Columbia University. Web. (2012)
Russell, H.G. and Graybeal, B.A., “Ultra-High Performance Concrete: A State-of-the-Art Report for the Bridge Community.” Federal Highway Administration (2013)
Schmidt, M. and Fehling, E., “Ultra-High-Performance Concrete: Research, Development and Application in Europe.” (2004)
Shann, S.V., “Application of Ultra High Performance Concrete (UHPC) as a Thin-Bonded Overlay for Concrete Bridge Decks.” Michigan Technological University (2012)
Shaikh, F.U.A. and Supit, S.W.M., “Mechanical and Durability Properties of High Volume Fly Ash (HVFA) Concrete Containing Calcium Carbonate (CaCO3) nanoparticles.” (2014)
Schmidt, M. and Fehling, E., “Ultra-High Performance Concrete: Research, Development and Application in Europe.” (2004)
Stengel, T. and Schießl, P., “Life Cycle Assessment of UHPC Bridge Constructions: Sherbrooke Footbridge, Kassel Gärtnerplatz Footbridge and Wapello Road Bridge.” Silesian University of Technology (2009)
Talebinejad, I., Iranmanesh, A., Bassam, S.A., and Shekarchizadeh, M., “Optimizing Mix Proportions of Normal Weight Reactive Powder Concrete with Strengths of 200-350 MPa.” International Symposium on Ultra High Performance Concrete. (2004)
Thomas, M., “Optimizing the Use of Fly Ash in Concrete.” Portland Cement Association (2007)
UNEP Global Environmental Alert Service, “Greening Cement Production has a Big Role to Play in Reducing Greenhouse Gas Emissions.” (2010)
United States Environmental Protection Agency (EPA), “Design for the Environmental Life-Cycle Assessments.” (n.d.)

117
United States Environmental Protection Agency (EPA), “Understanding Global Warming Potential.” (n.d.)
Volz, J.S., Myers, J.J., Richardson, D.N., Arezoumandi, M., Beckemeiser, K., Davis, D., Holman, K., Looney, T., and Tucker, B., “Design and Evaluation of High-Volume Fly Ash (HVFA) Concrete Mixes.” (2012)
Voort, T.V., Suleiman, M., and Sritharan, S., “Design and Performance Verification of Ultra-High Performance Concrete Piles for Deep Foundations.” Iowa State University (2008)
Wille, K., Naaman, A.E., El-Tawil, S., and Parra-Montesinos, J., “Ultra-High Performance Concrete and Fiber Reinforced Concrete; Achieving Strength and Ductility Without Heat Curing.” (2011)
Wille, K., El-Tawil, S., Naaman, A.E., “Properties of Strain Hardening Ultra High Performance Fiber Reinforced Concrete (UHP-FRC) Under Direct Tensile Loading.” (2013)
Wiss Janney Elstner Associates, “Introduction to Ultra-High Performance Concrete (UHPC).” Web. (2011)
Yoo, S.W., Ryu, G.S., and Choo, J.F., “Evaluation of the Effects of High-Volume Fly Ash on the Flexural Behavior of Reinforced Concrete Beams.” (2015)
Yu, R., Spiesz, P., and Brouwers, H.J.H., “Mix Design and Properties Assessment of Ultra-High Performance Fibre Reinforced Concrete (UHPFRC).” (2013)
118
Appendix A High Volume Fly Ash Concrete
A.1 DEFINITION
Concrete is currently the most used material in construction and second most consumed substance
on Earth after water. Unfortunately the production of cement used in concrete accounts for 9.5%
of global carbon dioxide (CO2) emissions in 2013. (Olivier et al., 2014) Limestone (calcium
carbonate) and clay are heated to 1450oC consuming large amounts of coal and gases during the
process. (Rubenstein, 2012) Because cement is being consumed at an annual rate of 1.6 billion
metric tons, an alternative substitution was highly sought after. Fortunately, the by-product of
cement production and coal-fired power plants is called fly ash and is accepted as a substitution to
portland cement. In 2003, only 38% of the 70 million tons of produced fly ash were recycled.
(American Coal Ash Association, 2006) This makes fly ash a cheap and readily available product
and an eco-friendly solution to rising cement production demands. According to Malhotra et al.,
fly ash is created based on non-combustible impurities in the form of clay, shale, quartz, feldspar,
dolomite, and limestone present in pulverized coal (Malhotra et al., 2008). Any unburned residue
is either carried away by flue gases and collected (fly ash) or left at the bottom of the furnace
(bottom ash) and thrown away. (Thomas, 2007) Figure A.1 illustrates the fly ash production
process.
There are two types of common fly ash: Class F and Class C. Table A-1 describes the ASTM
definitions and its chemical requirements. Table A-2 describes the effects of Fly Ash on the
Properties of Concrete with commentary and guidance of each effect.
High volume fly ash (HVFA) concrete, is defined as a concrete mix with a fly ash by mass of
cementitious materials of 50% or more. The term “high volume fly ash concrete” was originally
devised in the 1980’s by V. Mohan Malhotra of CANMET in Ottawa, Canada. HVFA concrete
has greater workability, a low exothermic reaction during mixing and curing procedures (heat-of-
hydration), early strengths that are satisfactory, low shrinkage, sustainable benefits, and
comparable durability to normal strength concrete. (Malhotra et al., 2008) According to Crouch et
al., the improved workability stems from the “ball bearing” action of the spherical fly ash particles.
Fly ash generated from power plants have also been shown to decrease the water content by 15-
20%. As a result, the HVFA concrete experiences a decrease in shrinkage creating a more crack

119
resistant product compared to conventional concrete. Because of the improved fine particle size
distribution of the mixture, HVFA concrete has a lower water permeability making it ideal for
environments with high freeze/thaw damage potential. (Crouch et al., 2007) The Leadership in
Energy and Environmental Design (LEED) program also awards LEED points based on mixtures
that use up to 40% substitution of fly ash for cement.
Figure A.1 Fly Ash Production Process (Thomas, 2007)
Table A-1 ASTM Specifications for Fly Ash (ASTM C 618)
Class ASTM Description Chemical Requirements
F
“Fly ash normally produced from burning anthracite or bituminous coal that meets the
applicable requirements for this class as given herein. The class of fly ash has pozzolanic
properties.”
SiO2 + Al2O3 + FeO3 70%
C
“Fly ash normally produced from lignite or sub-bituminous coal that meets the applicable
requirements for this class as given herein. This class of fly ash, in addition to having
pozzolanic properties, also has some cementitious properties. Note: Some Class C fly ashes may contain lime contents higher
than 10%”
SiO2 + Al2O3 + FeO3 70%
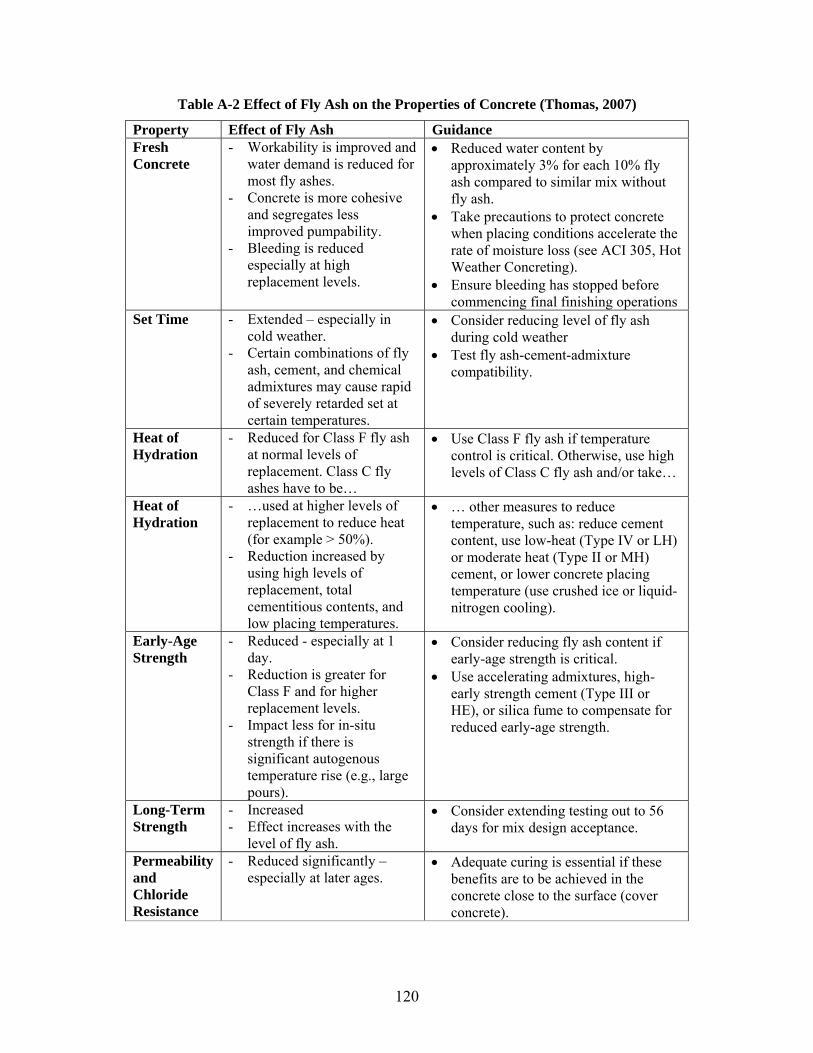
120
Table A-2 Effect of Fly Ash on the Properties of Concrete (Thomas, 2007)
Property Effect of Fly Ash Guidance Fresh Concrete
- Workability is improved and water demand is reduced for most fly ashes.
- Concrete is more cohesive and segregates less improved pumpability.
- Bleeding is reduced especially at high replacement levels.
Reduced water content by approximately 3% for each 10% fly ash compared to similar mix without fly ash.
Take precautions to protect concrete when placing conditions accelerate the rate of moisture loss (see ACI 305, Hot Weather Concreting).
Ensure bleeding has stopped before commencing final finishing operations
Set Time - Extended – especially in cold weather.
- Certain combinations of fly ash, cement, and chemical admixtures may cause rapid of severely retarded set at certain temperatures.
Consider reducing level of fly ash during cold weather
Test fly ash-cement-admixture compatibility.
Heat of Hydration
- Reduced for Class F fly ash at normal levels of replacement. Class C fly ashes have to be…
Use Class F fly ash if temperature control is critical. Otherwise, use high levels of Class C fly ash and/or take…
Heat of Hydration
- …used at higher levels of replacement to reduce heat (for example > 50%).
- Reduction increased by using high levels of replacement, total cementitious contents, and low placing temperatures.
… other measures to reduce temperature, such as: reduce cement content, use low-heat (Type IV or LH) or moderate heat (Type II or MH) cement, or lower concrete placing temperature (use crushed ice or liquid-nitrogen cooling).
Early-Age Strength
- Reduced - especially at 1 day.
- Reduction is greater for Class F and for higher replacement levels.
- Impact less for in-situ strength if there is significant autogenous temperature rise (e.g., large pours).
Consider reducing fly ash content if early-age strength is critical.
Use accelerating admixtures, high-early strength cement (Type III or HE), or silica fume to compensate for reduced early-age strength.
Long-Term Strength
- Increased - Effect increases with the
level of fly ash.
Consider extending testing out to 56 days for mix design acceptance.
Permeability and Chloride Resistance
- Reduced significantly – especially at later ages.
Adequate curing is essential if these benefits are to be achieved in the concrete close to the surface (cover concrete).
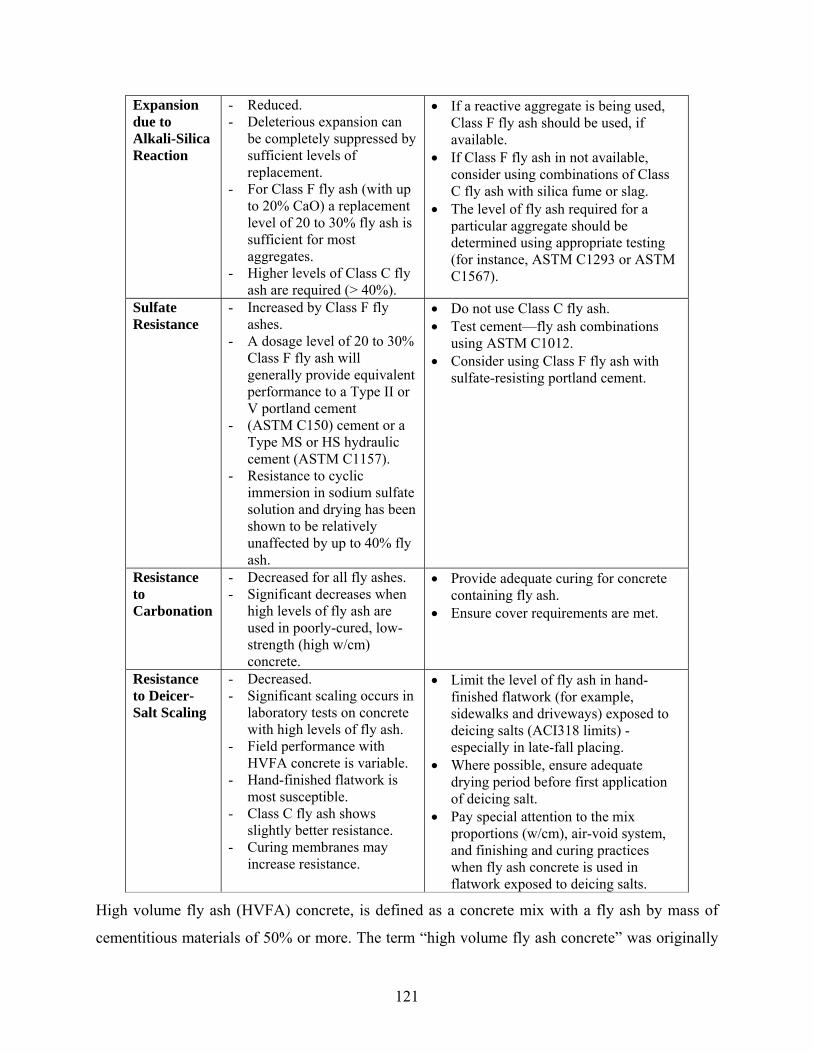
121
Expansion due to Alkali-Silica Reaction
- Reduced. - Deleterious expansion can
be completely suppressed by sufficient levels of replacement.
- For Class F fly ash (with up to 20% CaO) a replacement level of 20 to 30% fly ash is sufficient for most aggregates.
- Higher levels of Class C fly ash are required (> 40%).
If a reactive aggregate is being used, Class F fly ash should be used, if available.
If Class F fly ash in not available, consider using combinations of Class C fly ash with silica fume or slag.
The level of fly ash required for a particular aggregate should be determined using appropriate testing (for instance, ASTM C1293 or ASTM C1567).
Sulfate Resistance
- Increased by Class F fly ashes.
- A dosage level of 20 to 30% Class F fly ash will generally provide equivalent performance to a Type II or V portland cement
- (ASTM C150) cement or a Type MS or HS hydraulic cement (ASTM C1157).
- Resistance to cyclic immersion in sodium sulfate solution and drying has been shown to be relatively unaffected by up to 40% fly ash.
Do not use Class C fly ash. Test cement—fly ash combinations
using ASTM C1012. Consider using Class F fly ash with
sulfate-resisting portland cement.
Resistance to Carbonation
- Decreased for all fly ashes. - Significant decreases when
high levels of fly ash are used in poorly-cured, low-strength (high w/cm) concrete.
Provide adequate curing for concrete containing fly ash.
Ensure cover requirements are met.
Resistance to Deicer-Salt Scaling
- Decreased. - Significant scaling occurs in
laboratory tests on concrete with high levels of fly ash.
- Field performance with HVFA concrete is variable.
- Hand-finished flatwork is most susceptible.
- Class C fly ash shows slightly better resistance.
- Curing membranes may increase resistance.
Limit the level of fly ash in hand-finished flatwork (for example, sidewalks and driveways) exposed to deicing salts (ACI318 limits) - especially in late-fall placing.
Where possible, ensure adequate drying period before first application of deicing salt.
Pay special attention to the mix proportions (w/cm), air-void system, and finishing and curing practices when fly ash concrete is used in flatwork exposed to deicing salts.
High volume fly ash (HVFA) concrete, is defined as a concrete mix with a fly ash by mass of
cementitious materials of 50% or more. The term “high volume fly ash concrete” was originally
122
devised in the 1980’s by V. Mohan Malhotra of CANMET in Ottawa, Canada. HVFA concrete
has greater workability, a low exothermic reaction during mixing and curing procedures (heat-of-
hydration), early strengths that are satisfactory, low shrinkage, sustainable benefits, and
comparable durability to normal strength concrete. (Malhotra et al., 2008) According to Crouch et
al., the improved workability stems from the “ball bearing” action of the spherical fly ash particles.
Fly ash generated from power plants have also been shown to decrease the water content by 15-
20%. As a result, the HVFA concrete experiences a decrease in shrinkage creating a more crack
resistant product compared to conventional concrete. Because of the improved fine particle size
distribution of the mixture, HVFA concrete has a lower water permeability making it ideal for
environments with high freeze/thaw damage potential. (Crouch et al., 2007) The Leadership in
Energy and Environmental Design (LEED) program also awards LEED points based on mixtures
that use up to 40% substitution of fly ash for cement.
Unfortunately, HVFA concrete is not entirely perfect. Properties of HVFA are directly affected by
the type of cement and percentage of fly ash incorporated. (Bilodeau et al., 2000) The substitution
of fly ash in any percentage will also increase the strength and development time of concrete at its
early stages. According to Ravina et al., Class C fly ash delays strength development more than
Class F fly ash due to its higher sulfate contents. Consistencies in physical and chemical
characteristics can also vary within the fly ash not just between different power plants, but within
the same power plant as well. (Volz, et al, 2012)
A.2 MIX DESIGN
In order to identify the most efficient and eco-friendly mix design, this literature review compiles
over 30 different HVFA concrete mix designs from various sources across the world. Table A-3
shows some components of each mix design.
The variations in strength of HVFA concrete are directly related to the use of different chemical
admixtures and the temperature during placement. It is known that the use of superplasticizers or
other high range water reducers is imperative to the HVFA concrete’s workability. Fly ash with a
high carbon content will also require higher dosages of air-entraining admixtures which decrease
in effectiveness as the fly ash to cementitious materials ratio increase. (Bilodeau et al., 2000) The
BAPS Temple and Cultural Complexes located in Chicago, Illinois poured the same HVFA
concrete foundations on two different days with varying temperatures. One placement was during
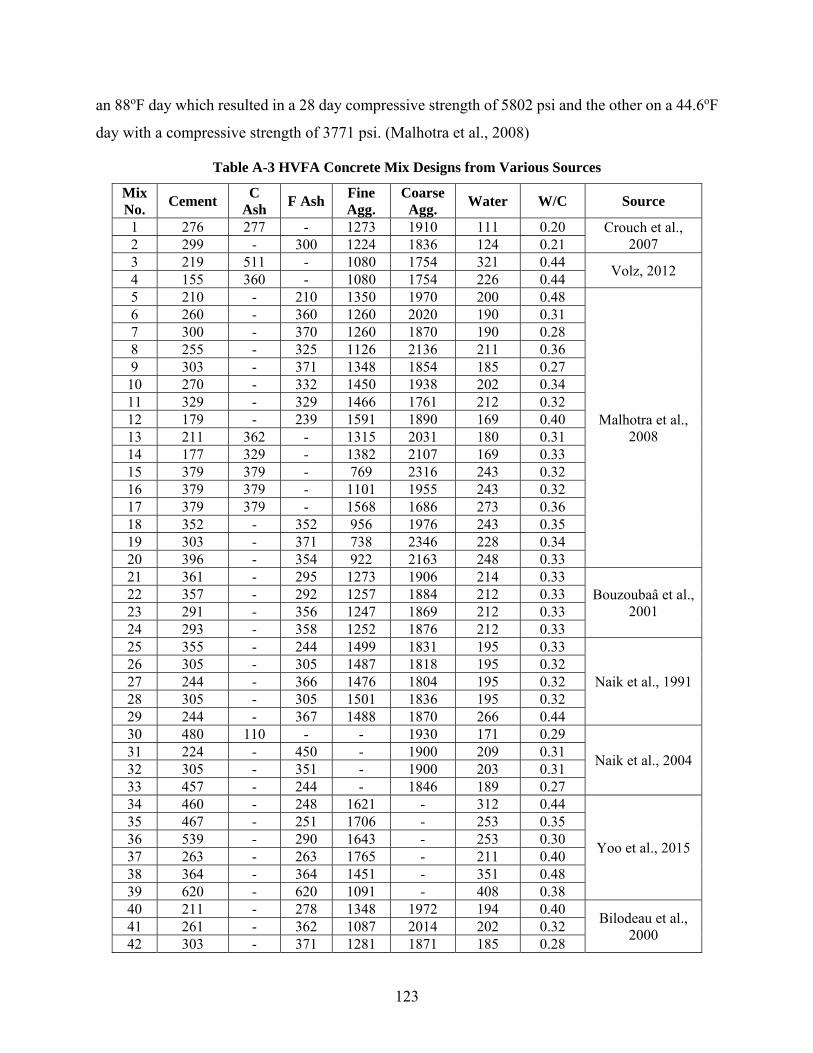
123
an 88oF day which resulted in a 28 day compressive strength of 5802 psi and the other on a 44.6oF
day with a compressive strength of 3771 psi. (Malhotra et al., 2008)
Table A-3 HVFA Concrete Mix Designs from Various Sources
Mix No.
Cement C
Ash F Ash
Fine Agg.
Coarse Agg.
Water W/C Source
1 276 277 - 1273 1910 111 0.20 Crouch et al., 2007 2 299 - 300 1224 1836 124 0.21
3 219 511 - 1080 1754 321 0.44 Volz, 2012
4 155 360 - 1080 1754 226 0.44 5 210 - 210 1350 1970 200 0.48
Malhotra et al., 2008
6 260 - 360 1260 2020 190 0.31 7 300 - 370 1260 1870 190 0.28 8 255 - 325 1126 2136 211 0.36 9 303 - 371 1348 1854 185 0.27
10 270 - 332 1450 1938 202 0.34 11 329 - 329 1466 1761 212 0.32 12 179 - 239 1591 1890 169 0.40 13 211 362 - 1315 2031 180 0.31 14 177 329 - 1382 2107 169 0.33 15 379 379 - 769 2316 243 0.32 16 379 379 - 1101 1955 243 0.32 17 379 379 - 1568 1686 273 0.36 18 352 - 352 956 1976 243 0.35 19 303 - 371 738 2346 228 0.34 20 396 - 354 922 2163 248 0.33 21 361 - 295 1273 1906 214 0.33
Bouzoubaâ et al., 2001
22 357 - 292 1257 1884 212 0.33 23 291 - 356 1247 1869 212 0.33 24 293 - 358 1252 1876 212 0.33 25 355 - 244 1499 1831 195 0.33
Naik et al., 1991 26 305 - 305 1487 1818 195 0.32 27 244 - 366 1476 1804 195 0.32 28 305 - 305 1501 1836 195 0.32 29 244 - 367 1488 1870 266 0.44 30 480 110 - - 1930 171 0.29
Naik et al., 2004 31 224 - 450 - 1900 209 0.31 32 305 - 351 - 1900 203 0.31 33 457 - 244 - 1846 189 0.27 34 460 - 248 1621 - 312 0.44
Yoo et al., 2015
35 467 - 251 1706 - 253 0.35 36 539 - 290 1643 - 253 0.30 37 263 - 263 1765 - 211 0.40 38 364 - 364 1451 - 351 0.48 39 620 - 620 1091 - 408 0.38 40 211 - 278 1348 1972 194 0.40
Bilodeau et al., 2000
41 261 - 362 1087 2014 202 0.32 42 303 - 371 1281 1871 185 0.28
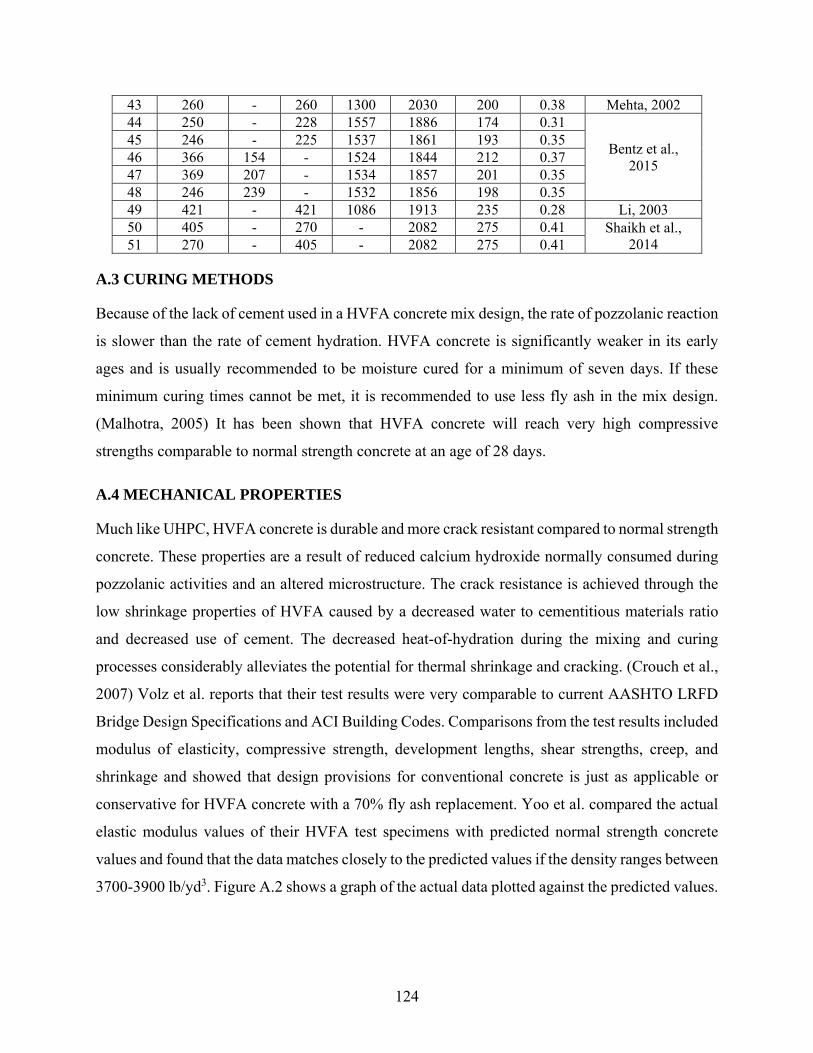
124
43 260 - 260 1300 2030 200 0.38 Mehta, 2002 44 250 - 228 1557 1886 174 0.31
Bentz et al., 2015
45 246 - 225 1537 1861 193 0.35 46 366 154 - 1524 1844 212 0.37 47 369 207 - 1534 1857 201 0.35 48 246 239 - 1532 1856 198 0.35 49 421 - 421 1086 1913 235 0.28 Li, 2003 50 405 - 270 - 2082 275 0.41 Shaikh et al.,
2014 51 270 - 405 - 2082 275 0.41
A.3 CURING METHODS
Because of the lack of cement used in a HVFA concrete mix design, the rate of pozzolanic reaction
is slower than the rate of cement hydration. HVFA concrete is significantly weaker in its early
ages and is usually recommended to be moisture cured for a minimum of seven days. If these
minimum curing times cannot be met, it is recommended to use less fly ash in the mix design.
(Malhotra, 2005) It has been shown that HVFA concrete will reach very high compressive
strengths comparable to normal strength concrete at an age of 28 days.
A.4 MECHANICAL PROPERTIES
Much like UHPC, HVFA concrete is durable and more crack resistant compared to normal strength
concrete. These properties are a result of reduced calcium hydroxide normally consumed during
pozzolanic activities and an altered microstructure. The crack resistance is achieved through the
low shrinkage properties of HVFA caused by a decreased water to cementitious materials ratio
and decreased use of cement. The decreased heat-of-hydration during the mixing and curing
processes considerably alleviates the potential for thermal shrinkage and cracking. (Crouch et al.,
2007) Volz et al. reports that their test results were very comparable to current AASHTO LRFD
Bridge Design Specifications and ACI Building Codes. Comparisons from the test results included
modulus of elasticity, compressive strength, development lengths, shear strengths, creep, and
shrinkage and showed that design provisions for conventional concrete is just as applicable or
conservative for HVFA concrete with a 70% fly ash replacement. Yoo et al. compared the actual
elastic modulus values of their HVFA test specimens with predicted normal strength concrete
values and found that the data matches closely to the predicted values if the density ranges between
3700-3900 lb/yd3. Figure A.2 shows a graph of the actual data plotted against the predicted values.
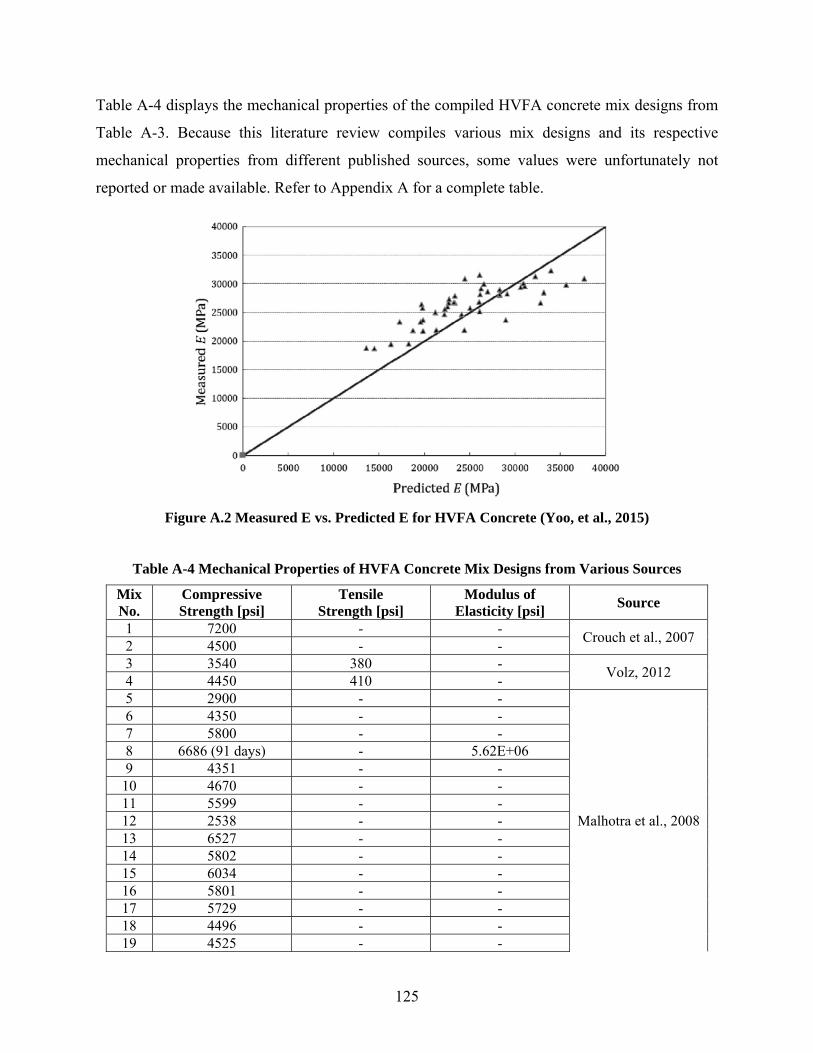
125
Table A-4 displays the mechanical properties of the compiled HVFA concrete mix designs from
Table A-3. Because this literature review compiles various mix designs and its respective
mechanical properties from different published sources, some values were unfortunately not
reported or made available. Refer to Appendix A for a complete table.
Figure A.2 Measured E vs. Predicted E for HVFA Concrete (Yoo, et al., 2015)
Table A-4 Mechanical Properties of HVFA Concrete Mix Designs from Various Sources
Mix No.
Compressive Strength [psi]
Tensile Strength [psi]
Modulus of Elasticity [psi]
Source
1 7200 - - Crouch et al., 2007
2 4500 - - 3 3540 380 -
Volz, 2012 4 4450 410 - 5 2900 - -
Malhotra et al., 2008
6 4350 - - 7 5800 - - 8 6686 (91 days) - 5.62E+06 9 4351 - -
10 4670 - - 11 5599 - - 12 2538 - - 13 6527 - - 14 5802 - - 15 6034 - - 16 5801 - - 17 5729 - - 18 4496 - - 19 4525 - -
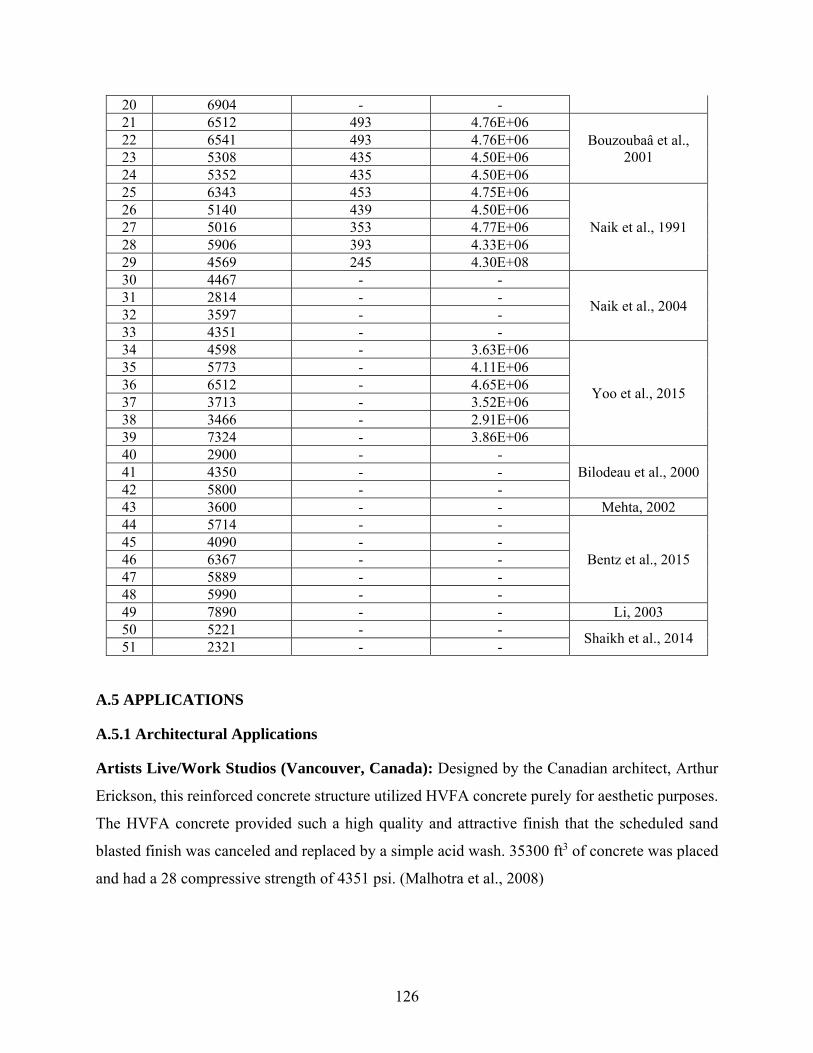
126
20 6904 - - 21 6512 493 4.76E+06
Bouzoubaâ et al., 2001
22 6541 493 4.76E+06 23 5308 435 4.50E+06 24 5352 435 4.50E+06 25 6343 453 4.75E+06
Naik et al., 1991 26 5140 439 4.50E+06 27 5016 353 4.77E+06 28 5906 393 4.33E+06 29 4569 245 4.30E+08 30 4467 - -
Naik et al., 2004 31 2814 - - 32 3597 - - 33 4351 - - 34 4598 - 3.63E+06
Yoo et al., 2015
35 5773 - 4.11E+06 36 6512 - 4.65E+06 37 3713 - 3.52E+06 38 3466 - 2.91E+06 39 7324 - 3.86E+06 40 2900 - -
Bilodeau et al., 2000 41 4350 - - 42 5800 - - 43 3600 - - Mehta, 2002 44 5714 - -
Bentz et al., 2015 45 4090 - - 46 6367 - - 47 5889 - - 48 5990 - - 49 7890 - - Li, 2003 50 5221 - -
Shaikh et al., 2014 51 2321 - -
A.5 APPLICATIONS
A.5.1 Architectural Applications
Artists Live/Work Studios (Vancouver, Canada): Designed by the Canadian architect, Arthur
Erickson, this reinforced concrete structure utilized HVFA concrete purely for aesthetic purposes.
The HVFA concrete provided such a high quality and attractive finish that the scheduled sand
blasted finish was canceled and replaced by a simple acid wash. 35300 ft3 of concrete was placed
and had a 28 compressive strength of 4351 psi. (Malhotra et al., 2008)
127
A.5.2 Structural Applications in Buildings
Concrete Block for Component Testing of Communication Satellites (Ottawa, Canada):
Placed on March 1987, this 30 ft. x 23 ft. x 10 ft. block of concrete is the first field application of
HVFA concrete. The block was cast indoors in permanent steel forms and was used for vibration
testing of components for communication satellites. It was imperative that the HVFA concrete
block did not develop cracks for it may affect the test results. 6357 ft3 of HVFA concrete was
placed at room temperatures of 54oF and 46oF respectively and produced a 91 day compressive
strength of 6686 psi. (Malhotra et al., 2008)
Park Lane Hotel/Office Complex (Halifax, Canada): Constructed in 1988, the Park Lane
Hotel/Office Complex provides 12900 yd3 of office space divided into seven stories and a 600 car
indoor parking garage. Because of the late concrete development strength requirements, HVFA
concrete was ideal for this build. The lower columns, 3 ft. in diameter, required 120 day
compressive strengths of 7252 psi and resulted in an actual compressive strength of 10733 psi.
Using HVFA concrete was not only sustainable, but economical. The HVFA mixture saved $0.37
per cubic ft. compared to conventional portland cement concrete. (Malhotra et al., 2008)
York University Computer Science Building (Toronto, Canada): Constructed in 2001, the
York University Computer Science Building utilized a 50% fly ash replacement mix design with
no superplasticizer. As unusual as this was, this was most likely due to the fact that the design
called for structural strength only with durability neglected. York University has since utilized
HVFA concrete mix designs on various structures throughout the campus after the success of their
Computer Science Building. (Malhotra et al., 2008)
University of California, Berkeley, Wurster Hall (Berkeley, California, United States): Due
to monetary constraints, HVFA concrete was chosen for a seismic retrofit of reinforced concrete
piers and foundations of Wurster Hall. By using a HVFA mix design, the university was able to
save $13,000 over the use of conventional portland cement concrete. This HVFA concrete mix
design also used no air entrainers or superplasticizers. (Malhotra et al., 2008)
Hindu Temple (Kauai Island, Hawaii, United States): In order to support a large, all-stone
Hindu temple, a large foundation design was required. Because typical conventional portland
cement concrete designs crack resulting in corroded steel, the owners called for a crack-resistant
foundation design with no reinforcing steel. The foundation design called for two independent

128
HVFA concrete slabs measuring 118 ft. x 56 ft. x 2 ft. without the use of expansion or control
joints. By using a HVFA concrete mix design, the thermal cracks and drying shrinkage was kept
to a minimum due to the reduced use of cement in the mix design. A petrographic examination
was performed and revealed that the foundation contained very minute amounts of calcium
hydroxide crystals. The examination also revealed a high amount of unreacted fly ash with little
to no residual cement particles. As initially desired, there was also little to no micro-cracking.
(Malhotra et al., 2008)
BAPS Temple and Cultural Complexes (Chicago, Illinois, United States): Inspired by the
outcome and performance of the Hindu Temple on Kauai Island, Hawaii, the BAPS Temple
utilizes 250 unreinforced, cast in place HVFA concrete caissons (30 m. tall and 3m. in diameter),
HVFA concrete foundations, and HVFA concrete walls. Key features of the mix design include:
using Class C fly ash with a low amount of unburnt carbon, well-graded coarse aggregate with an
emphasis on pea-sized gravel, effective superplasticizer, and a low cement content (65% fly ash
replacement) to limit thermal cracking and drying shrinkage. The HVFA concrete mix was mixed
at a local mixing plant, transferred by ready-mixed concrete trucks, and pumped into place. A very
interesting note to take is the drastic strength differences when the foundation slabs were placed
on different days. A slab placed on August 13, 2002, where the temperature was 88oF, resulted in
a compressive strength of 5802 psi. The second slab was placed October 18, 2002 where the
temperature was 44.6oF and the compressive strength was only 3771 psi (Malhotra et al., 2008).
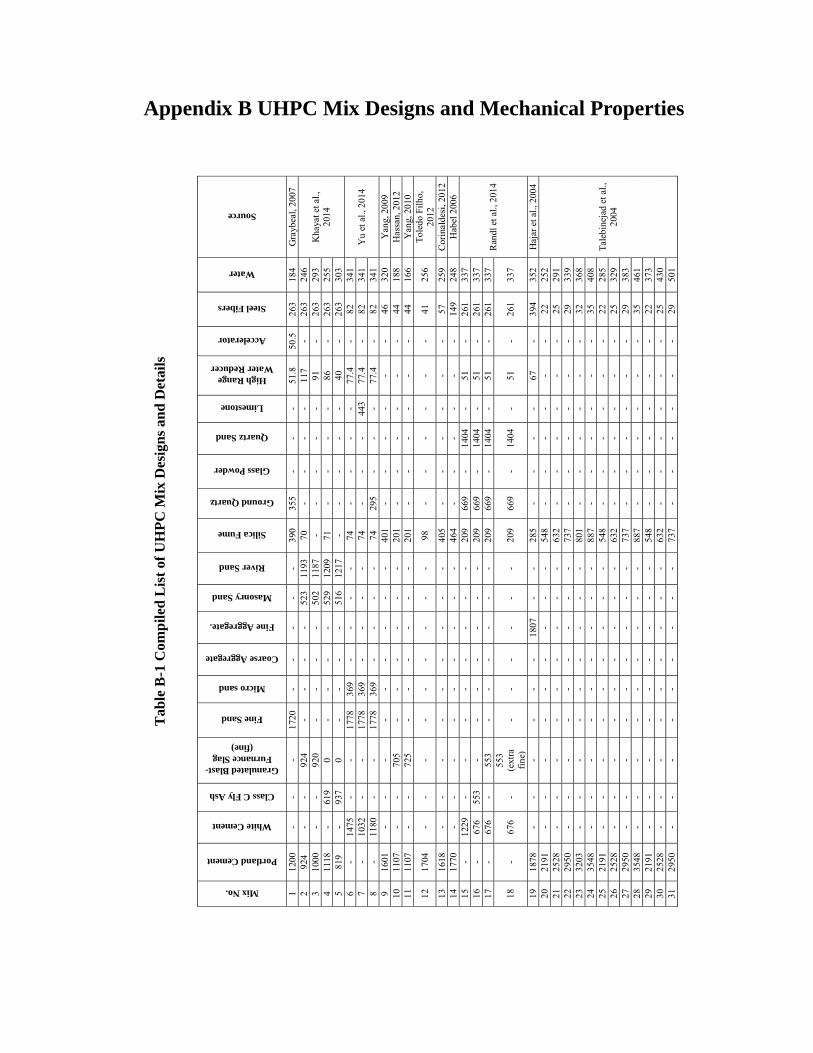
Appendix B UHPC Mix Designs and Mechanical Properties
T
able
B-1
Com
pil
ed L
ist
of U
HP
C M
ix D
esig
ns
and
Det
ails
Mix No.
Portland Cement
White Cement
Class C Fly Ash
Granulated Blast-Furnance Slag
(fine)
Fine Sand
Micro sand
Coarse Aggregate
Fine Aggregate.
Masonry Sand
River Sand
Silica Fume
Ground Quartz
Glass Powder
Quartz Sand
Limestone
High Range Water Reducer
Accelerator
Steel Fibers
Water
Source
1 12
00
- -
- 17
20
- -
- -
- 39
0 35
5 -
- -
51.8
50
.5
263
184
Gra
ybea
l, 20
07
2 92
4 -
- 92
4 -
- -
- 52
3 11
93
70
- -
- -
117
- 26
3 24
6 K
haya
t et a
l.,
2014
3
1000
-
- 92
0 -
- -
- 50
2 11
87
- -
- -
- 91
-
263
293
4 11
18
- 61
9 0
- -
- -
529
1209
71
-
- -
- 86
-
263
255
5 81
9 -
937
0 -
- -
- 51
6 12
17
- -
- -
- 40
-
263
303
6 -
1475
-
- 17
78
369
- -
- -
74
- -
- -
77.4
-
82
341
Yu
et a
l., 2
014
7 -
1032
-
- 17
78
369
- -
- -
74
- -
- 44
3 77
.4
- 82
34
1 8
- 11
80
- -
1778
36
9 -
- -
- 74
29
5 -
- -
77.4
-
82
341
9 16
01
- -
- -
- -
- -
- 40
1 -
- -
- -
- 46
32
0 Y
ang,
200
9 10
11
07
- -
705
- -
- -
- -
201
- -
- -
- -
44
188
Has
san,
201
2 11
11
07
- -
725
- -
- -
- -
201
- -
- -
- -
44
166
Yan
g, 2
010
12
1704
-
- -
- -
- -
- -
98
- -
- -
- -
41
256
Tol
edo
Filh
o,
2012
13
16
18
- -
- -
- -
- -
- 40
5 -
- -
- -
- 57
25
9 C
orin
alde
si, 2
012
14
1770
-
- -
- -
- -
- -
464
- -
- -
- -
149
248
Hab
el 2
006
15
- 12
29
- -
- -
- -
- -
209
669
- 14
04
- 51
-
261
337
Ran
dl e
t al.,
201
4
16
- 67
6 55
3 -
- -
- -
- -
209
669
- 14
04
- 51
-
261
337
17
- 67
6 -
553
- -
- -
- -
209
669
- 14
04
- 51
-
261
337
18
- 67
6 -
553
(ext
ra
fine
) -
- -
- -
- 20
9 66
9 -
1404
-
51
- 26
1 33
7
19
1878
-
- -
- -
- 18
07
- -
285
- -
- -
67
- 39
4 35
2 H
ajar
et a
l., 2
004
20
2191
-
- -
- -
- -
- -
548
- -
- -
- -
22
252
Tal
ebin
ejad
et a
l.,
2004
21
2528
-
- -
- -
- -
- -
632
- -
- -
- -
25
291
22
2950
-
- -
- -
- -
- -
737
- -
- -
- -
29
339
23
3203
-
- -
- -
- -
- -
801
- -
- -
- -
32
368
24
3548
-
- -
- -
- -
- -
887
- -
- -
- -
35
408
25
2191
-
- -
- -
- -
- -
548
- -
- -
- -
22
285
26
2528
-
- -
- -
- -
- -
632
- -
- -
- -
25
329
27
2950
-
- -
- -
- -
- -
737
- -
- -
- -
29
383
28
3548
-
- -
- -
- -
- -
887
- -
- -
- -
35
461
29
2191
-
- -
- -
- -
- -
548
- -
- -
- -
22
373
30
2528
-
- -
- -
- -
- -
632
- -
- -
- -
25
430
31
2950
-
- -
- -
- -
- -
737
- -
- -
- -
29
501

Tab
le B
-1 C
omp
iled
Lis
t of
UH
PC
Mix
Des
ign
s an
d D
etai
ls (
Con
tin
ued
)
Mix No.
Portland Cement
White Cement
Class C Fly Ash
Granulated Blast-Furnance Slag
(fine)
Fine Sand
Micro sand
Coarse Aggregate
Fine Aggregate.
Masonry Sand
River Sand
Silica Fume
Ground Quartz
Glass Powder
Quartz Sand
Limestone
High Range Water Reducer
Accelerator
Steel Fibers
Water
Source
32
3548
-
- -
- -
- -
- -
887
- -
- -
- -
35
603
Tal
ebin
ejad
et a
l.,
2004
33
3203
-
- -
- -
- -
- -
641
- -
- -
- -
32
368
34
3203
-
- -
- -
- -
- -
961
- -
- -
- -
32
368
35
3203
-
- -
- -
- -
- -
1121
-
- -
- -
- 32
36
8 36
32
03
- -
- -
- -
- -
- 64
1 -
- -
- -
- 32
38
4 37
32
03
- -
- -
- -
- -
- 80
1 -
- -
- -
- 32
38
4 38
32
03
- -
- -
- -
- -
- 96
1 -
- -
- -
- 32
38
4 39
32
03
- -
- -
- -
- -
- 11
21
- -
- -
- -
32
384
40
3203
-
- -
- -
- -
- -
641
- -
- -
- -
32
416
41
3203
-
- -
- -
- -
- -
801
- -
- -
- -
32
416
42
3203
-
- -
- -
- -
- -
961
- -
- -
- -
32
416
43
3203
-
- -
- -
- -
- -
1121
-
- -
- -
- 32
41
6 44
32
03
- -
- -
- -
- -
- 64
1 -
- -
- -
- 32
54
4 45
32
03
- -
- -
- -
- -
- 80
1 -
- -
- -
- 32
54
4 46
32
03
- -
- -
- -
- -
- 96
1 -
- -
- -
- 32
54
4 47
32
03
- -
- -
- -
- -
- 11
21
- -
- -
- -
32
544
48
3203
-
- -
- -
- -
- -
801
- -
- -
- -
32
320
49
3203
-
- -
- -
- -
- -
801
- -
- -
- -
32
352
50
3203
-
- -
- -
- -
- -
801
- -
- -
- -
32
641
51
3203
-
- -
- -
- -
- -
801
- -
- -
- -
32
368
52
3203
-
- -
- -
- -
- -
801
- -
- -
- -
32
416
53
3203
-
- -
- -
- -
- -
801
- -
- -
- -
32
544
54
3203
-
- -
- -
- -
- -
801
- -
- -
- -
32
641
55
3203
-
- -
- -
- -
- -
801
- -
- -
- -
32
368
56
3203
-
- -
- -
- -
- -
801
- -
- -
- -
32
368
57
3203
-
- -
- -
- -
- -
801
- -
- -
- -
32
368
58
1210
-
- -
1734
-
- -
- -
394
357
- -
- 50
.6
43.8
26
3 18
9 G
rayb
eal e
t al.,
20
08
59
1198
-
- -
1718
-
- -
- -
391
354
- -
- 50
.6
43.8
26
1 22
6 60
-
1402
-
- -
- -
- -
- 22
8 34
9 -
1643
-
50
- 32
4 28
0 R
itte
r et
al.,
201
5
61
- 16
01
- -
- -
- -
- -
253
573
- 11
29
- 51
-
51
303
Shak
hmen
ko e
t al
., 20
12
62
- 16
01
- -
- -
- -
- -
34
674
- 11
29
- 42
-
34
337
Just
s et
al.,
201
2 63
-
1601
-
- -
- -
- -
- 16
9 57
3 -
1129
-
42
- 34
33
7 64
10
53
- -
- -
- 16
28
1332
-
- -
- -
- -
26.3
-
- 27
5
Ha
et a
l., 2
012
65
811
- 12
0 -
- -
1628
13
32
- -
- -
- -
- 20
.3
- -
263
66
585
- 23
2 -
- -
1628
13
32
- -
- -
- -
- 14
.6
- -
255
67
696
- 11
8 -
- -
1628
13
32
- -
99
- -
- -
17.4
-
- 25
8

Tab
le B
-1 C
omp
iled
Lis
t of
UH
PC
Mix
Des
ign
s an
d D
etai
ls (
Con
tin
ued
)
Mix No.
Portland Cement
White Cement
Class C Fly Ash
Granulated Blast-Furnance Slag
(fine)
Fine Sand
Micro sand
Coarse Aggregate
Fine Aggregate.
Masonry Sand
River Sand
Silica Fume
Ground Quartz
Glass Powder
Quartz Sand
Limestone
High Range Water Reducer
Accelerator
Steel Fibers
Water
Source
68
1257
-
- -
1797
-
- -
- -
408
378
- -
- 15
-
271
239
Duc
tal ®
69
18
78
- -
- 18
07
- -
- -
- 28
5 -
- -
- 67
-
394
357
BSI
®
70
1770
-
- -
1230
-
- -
- -
464
- -
- -
59
- 79
2 32
0 C
EM
TE
Cm
ultis
cale
®
71
1476
-
- -
- -
- -
- -
240
- -
-
28
- -
315
Hei
nz, e
t al.,
20
12
72
375
- -
1016
-
- -
- -
- 24
3 36
7 -
1660
-
22
- -
303
73
964
- 82
1 -
- -
- -
- -
243
373
- 16
87
- 28
-
- 31
5
74
1517
-
- -
1955
-
- -
- -
303
- -
1469
-
25
- 26
5 30
3 Fr
anci
sco
et a
l.,
2012
75
13
28
- -
- -
- -
1461
-
- 33
2 53
1 -
- -
25
- 33
29
2
Prem
et a
l., 2
012
76
1328
-
- -
- -
- 14
61
- -
332
531
- -
- 25
-
27
292
77
1328
-
- -
- -
- 14
61
- -
332
531
- -
- 25
-
33
292
78
1328
-
- -
- -
- 14
61
- -
332
531
- -
- 25
-
27
292
79
1328
-
- -
- -
- 14
61
- -
332
531
- -
- 25
-
- 29
2 80
1*
-
- -
- -
- 1.
1*
- -
0.25
* 0.
4*
- -
- -
- 1%
0.
17*
Prab
ha e
t al.,
20
14
81
1*
- -
- -
- -
1.1*
-
- 0.
25*
0.4*
-
- -
2.25
%
- 2%
0.
17*
82
1*
- -
- -
- -
1.1*
-
- 0.
25*
0.4*
-
- -
- -
3%
0.20
* 83
1*
-
- -
- -
- 1.
1*
- -
0.25
* 0.
4*
- -
- -
- 1%
0.
17*
84
1*
- -
- -
- -
1.1*
-
- 0.
25*
0.4*
-
- -
- -
2%
0.17
* 85
1*
-
- -
- -
- 1.
1*
- -
0.25
* 0.
4*
- -
- -
- 2%
0.
17*
86
1*
- -
- -
- -
1.1*
-
- 0.
25*
0.4*
-
- -
- -
3%
0.20
*
87
1*
- -
- 0.
28/
0.64
* -
- -
- -
0.25
* -
0.25
* -
- 0.
011*
-
0.27
* 0.
19*
Will
e et
al.,
201
3
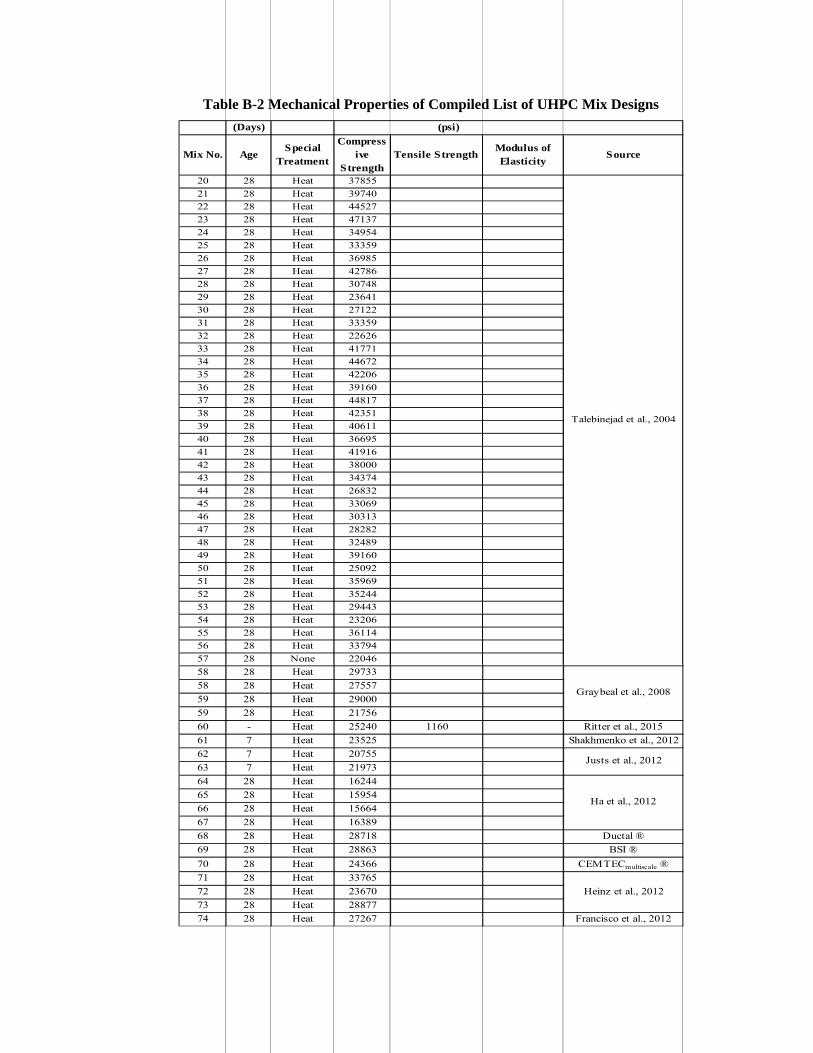
Table B-2 Mechanical Properties of Compiled List of UHPC Mix Designs
20 28 Heat 37855
21 28 Heat 39740
22 28 Heat 44527
23 28 Heat 47137
24 28 Heat 34954
25 28 Heat 33359
26 28 Heat 36985
27 28 Heat 42786
28 28 Heat 30748
29 28 Heat 23641
30 28 Heat 27122
31 28 Heat 33359
32 28 Heat 22626
33 28 Heat 41771
34 28 Heat 44672
35 28 Heat 42206
36 28 Heat 39160
37 28 Heat 44817
38 28 Heat 42351
39 28 Heat 40611
40 28 Heat 36695
41 28 Heat 41916
42 28 Heat 38000
43 28 Heat 34374
44 28 Heat 26832
45 28 Heat 33069
46 28 Heat 30313
47 28 Heat 28282
48 28 Heat 32489
49 28 Heat 39160
50 28 Heat 25092
51 28 Heat 35969
52 28 Heat 35244
53 28 Heat 29443
54 28 Heat 23206
55 28 Heat 36114
56 28 Heat 33794
57 28 None 22046
Talebinejad et al., 2004
58 28 Heat 29733
58 28 Heat 27557
59 28 Heat 29000
59 28 Heat 21756
60 - Heat 25240 1160 Ritter et al., 2015
61 7 Heat 23525 Shakhmenko et al., 2012
62 7 Heat 20755
63 7 Heat 21973
64 28 Heat 16244
65 28 Heat 15954
66 28 Heat 15664
67 28 Heat 16389
68 28 Heat 28718 Ductal ®
69 28 Heat 28863 BSI ®
70 28 Heat 24366 CEMTECmultiscale ®
71 28 Heat 33765
72 28 Heat 23670
73 28 Heat 28877
74 28 Heat 27267 Francisco et al., 2012
Ha et al., 2012
Graybeal et al., 2008
Heinz et al., 2012
Justs et al., 2012
(Days)
Mix No. AgeSpecial
Treatment
Compressive
StrengthTensile Strength
Modulus of Elasticity
Source
(psi)
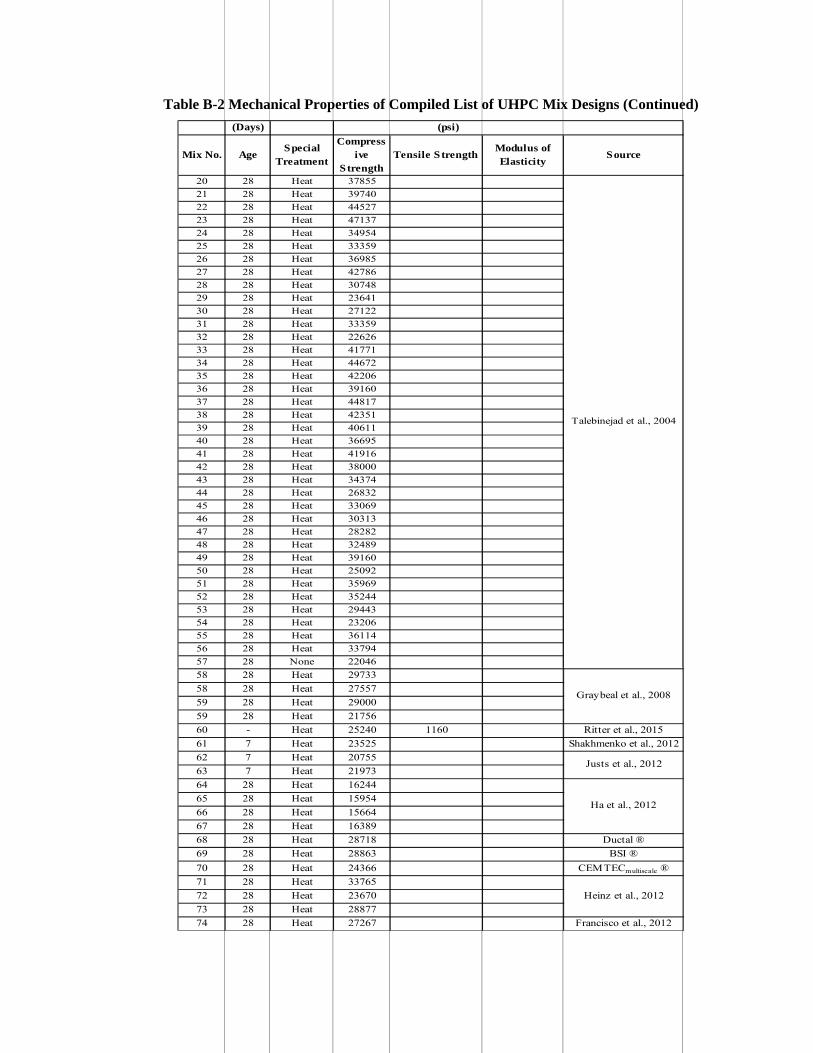
Table B-2 Mechanical Properties of Compiled List of UHPC Mix Designs (Continued)
20 28 Heat 37855
21 28 Heat 39740
22 28 Heat 44527
23 28 Heat 47137
24 28 Heat 34954
25 28 Heat 33359
26 28 Heat 36985
27 28 Heat 42786
28 28 Heat 30748
29 28 Heat 23641
30 28 Heat 27122
31 28 Heat 33359
32 28 Heat 22626
33 28 Heat 41771
34 28 Heat 44672
35 28 Heat 42206
36 28 Heat 39160
37 28 Heat 44817
38 28 Heat 42351
39 28 Heat 40611
40 28 Heat 36695
41 28 Heat 41916
42 28 Heat 38000
43 28 Heat 34374
44 28 Heat 26832
45 28 Heat 33069
46 28 Heat 30313
47 28 Heat 28282
48 28 Heat 32489
49 28 Heat 39160
50 28 Heat 25092
51 28 Heat 35969
52 28 Heat 35244
53 28 Heat 29443
54 28 Heat 23206
55 28 Heat 36114
56 28 Heat 33794
57 28 None 22046
Talebinejad et al., 2004
58 28 Heat 29733
58 28 Heat 27557
59 28 Heat 29000
59 28 Heat 21756
60 - Heat 25240 1160 Ritter et al., 2015
61 7 Heat 23525 Shakhmenko et al., 2012
62 7 Heat 20755
63 7 Heat 21973
64 28 Heat 16244
65 28 Heat 15954
66 28 Heat 15664
67 28 Heat 16389
68 28 Heat 28718 Ductal ®
69 28 Heat 28863 BSI ®
70 28 Heat 24366 CEMTECmultiscale ®
71 28 Heat 33765
72 28 Heat 23670
73 28 Heat 28877
74 28 Heat 27267 Francisco et al., 2012
Ha et al., 2012
Graybeal et al., 2008
Heinz et al., 2012
Justs et al., 2012
(Days)
Mix No. AgeSpecial
Treatment
Compressive
StrengthTensile Strength
Modulus of Elasticity
Source
(psi)

Nevada Department of Transportation
Rudy Malfabon, P.E. Director
Ken Chambers, Research Division Chief
(775) 888-7220
1263 South Stewart Street
Carson City, Nevada 89712
Top Related