


Languages
Pages
Legal

Da
ibo
ch
i Pla
stic &
P
ac
ka
gin
g In
du
stry
Be
rha
d
Inv
esto
rs’ Brie
fing
FY1
2 Fin
an
cia
l Re
sults &
Co
rpo
rate
Up
da
te
26
Feb
rua
ry 2
01
3
IR A
dv
ise
r
AQ
UIL
AS
•Operatio
nal H
ighlights
•Financial H
ighlights
•FY2013 Growth Stra
tegies
2
•FY2013 Growth Stra
tegies
•Appendix:
»Corporate Profile
»Industry
Insig
ht
Opera
tional H
ighlig
hts
3
Opera
tional H
ighlig
hts
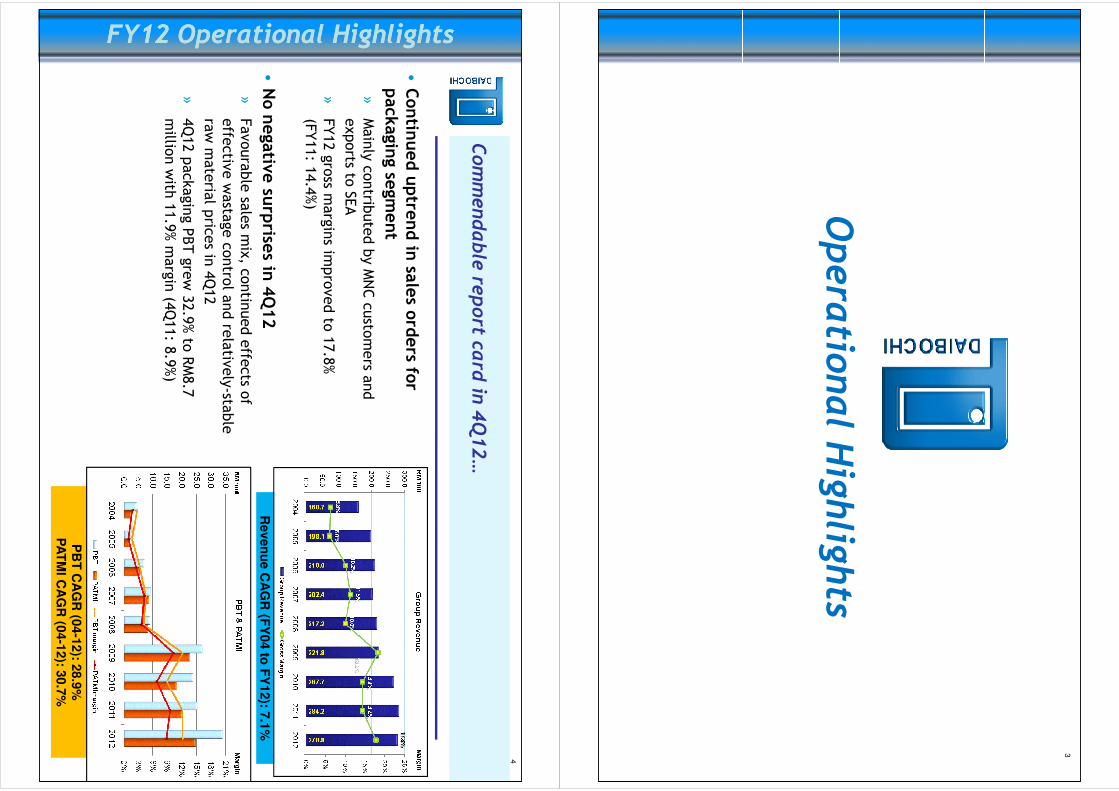
•Contin
ued uptre
nd in sa
les o
rders fo
r packagin
g segm
ent
»Mainly contrib
uted by MNC custo
mers a
nd
exports to
SEA
»FY12 gross m
argins im
proved to
17.8%
(FY11: 1
4.4%)
4
FY12 Operational HighlightsFY12 Operational Highlights
Commendable re
port ca
rd in
4Q12…
•No negative su
rprise
s in 4Q12
»Favourable
sales m
ix, c
ontin
ued effe
cts o
f
effe
ctiv
e wasta
ge contro
l and re
lativ
ely-sta
ble
raw m
ateria
l pric
es in
4Q12
»4Q12 packaging PBT grew 32.9% to
RM8.7
millio
n with
11.9% m
argin (4
Q11: 8
.9%)
FY12 Operational HighlightsFY12 Operational Highlights
Reven
ue C
AG
R (F
Y04 to
FY
12): 7
.1%
PB
T C
AG
R (0
4-1
2): 2
8.9
%P
AT
MI C
AG
R (0
4-1
2): 3
0.7
%

FY12
5
FY12
Financia
l Review
4Q12 to
31.12.12
3Q12 to
30.9.12
Change vs
preceding qtr
RM'mil
FY12 to
31.12.12
FY11 to
31.12.11
Change vs
prev perio
d
73.76
65.66
12.3%
Revenue
278.75
284.23
(1.9%)
10.84
11.61
(6.7%)
EBITDA
43.36
34.82
24.5%
8.48
9.35
(9.4%)
Operatin
g Profit
34.46
26.57
29.7%
0.36
0.10
>100%
Share of A
ssociate Results
0.33
(0.07)
n/m
8.68
9.25
(6.2%)
Pre-ta
x Profit
33.92
25.28
34.2%
6.25
6.90
(9.5%)
Net P
rofit to
Shareholders
24.64
20.08
22.7%
5.50
6.06
(9.2%)
Basic
EPS (se
n)
21.74
17.78
22.3%
6
FY12 Income StatementFY12 Income Statement
Reco
rd FY12 net p
rofit re
sultin
g fro
m positiv
e in
tern
al a
nd extern
al
facto
rs…
�FY12 earnings
helped by lo
wer
cost o
f sales a
nd
reduced fin
ance
costs
5.50
6.06
(9.2%)
Basic
EPS (se
n)
21.74
17.78
22.3%
14.7%
17.7%
(3.0)
EBITDA m
argin
15.6%
12.3%
3.3
11.8%
14.1%
(2.3)
PBT m
argin
12.2%
8.9%
3.3
8.5%
10.5%
(2.0)
Net m
argin
8.8%
7.1%
1.8
FY12 Income StatementFY12 Income Statement
(2.6
%)
5.0
4.2
4.8
4.2
4.6
5.0
4.5
5.9
5.1
6.4
6.9
6.2
0.0
2.0
4.0
6.0
8.0
1Q10
2Q10
3Q10
4Q10
1Q11
2Q11
3Q11
4Q11
1Q12
2Q12
3Q12
4Q12
Qu
arte
rly P
AT
MI (R
M ‘m
il)
+5.7
%

7Packaging Revenue & PBT TrendPackaging Revenue & PBT Trend
Impro
ved pack
aging m
argins y
ear-o
n-year o
n fa
voura
ble
pro
duct
mix, w
asta
ge co
ntro
l and sta
ble ra
w m
ateria
l price
s…
4Q12 to
31.12.12
3Q12 to
30.9.12
Change vs
preceding qtr
PACKAGING SEGMENT
(RM'mil)
FY12 to
31.12.12
FY11 to
31.12.11
Change vs
previous p
erio
d
72.87
65.12
11.9%
Revenue
275.77
267.90
2.9%
11.17
11.50
(2.9%)
EBITDA
43.04
31.03
38.7%
8.81
9.24
(4.7%)
Operatin
g Profit
34.14
22.77
49.9%
8.65
9.05
(4.4%)
Pre-ta
x Profit
33.28
21.55
54.4%
15.3%
17.7%
(2.3)
EBITDA m
argin
15.6%
11.6%
4.0
11.9%
13.9%
(2.0)
PBT m
argin
12.1%
8.0%
4.1
Packaging Revenue & PBT TrendPackaging Revenue & PBT Trend
(1.0
)%+
32.9
%
11.9%
13.9%
(2.0)
PBT m
argin
12.1%
8.0%
4.1
8
FY12 Balance Sheet (Highlights)FY12 Balance Sheet (Highlights)
Health
y balance
sheet re
nders fle
xibility
for fu
ture expansio
n…
RM
’ mil
As
at
31
.12
.12
(Un
au
dite
d)
As
at
31
.12
.11
(Au
dite
d)
Fix
ed
asse
ts (e
xcl a
sso
cia
te in
ve
stm
en
t & d
efe
rred
tax)
87
.69
83
.21
Asso
cia
te in
ve
stm
en
t 2
3.3
42
3.0
1
Cu
rren
t asse
ts
12
4.1
51
21
.80
RM19.8 m
il CAPEX
in FY12 la
rgely
financed by
internal fu
nds
FY12 Balance Sheet (Highlights)FY12 Balance Sheet (Highlights)
Cu
rren
t liab
ilities
70
.54
70
.43
Sh
are
ho
lde
rs’ e
qu
ity1
50
.42
14
0.2
0
To
tal b
orro
win
gs
30
.07
35
.54
Ca
sh
& B
an
k B
ala
nce
s7
.45
10
.41
Ne
t ge
arin
g0
.15
x0
.18
x
Re
turn
on
Ave
rag
e S
ha
reh
old
ers
Eq
uity
17
.0%
14
.8%
Re
turn
on
Ave
rag
e T
ota
l Asse
ts1
0.6
%9
.1%
Improved net g
earin
g
from re
duced
borro
wings a
nd
higher sh
areholders’
funds
Enhanced re
turns fro
m
higher p
rofita
bility
and im
proved fin
ancial
leverage

9Dividend HistoryDividend History
Reco
rd dividend payout in
line w
ith earn
ings…
distrib
utin
g 61.5% of
FY2012 net p
rofit a
s dividends
•4thinterim
dividendof 3
.5 se
nper sh
are in
respect o
f FY2012
(amountin
g to
RM4.0 m
il) to be paid
on 12 April 2
013
•Dividends in
respect o
f FY2012
Dividend HistoryDividend History
»1stinterim
tax exempt d
ividend of
3.5 se
n/share (p
aid on 8 Jun 2012)
-Adju
sted D
PS: 2
.3 se
n
»2ndinterim
tax exempt d
ividend of
6.0 se
n/share (p
aid on 7 Sep 2012)
-Adju
sted D
PS: 4
.0 se
n
»3rdinterim
tax exempt d
ividend of
3.5 se
n/share (p
aid on 7 Dec 2012)
^Sin
ce 2
Q12, D
aib
och
i revise
d its d
ivid
end p
olicy
upw
ard
s to p
ay n
o le
ss than 6
0% o
f gro
up n
et p
rofit a
s
div
idends
* Ad
juste
d fo
r 1-fo
r-2 B
on
us Is
su
e, e
ffectiv
e 1
0 S
ep
tem
be
r 20
12
10
PROSPECTS AND PLANS
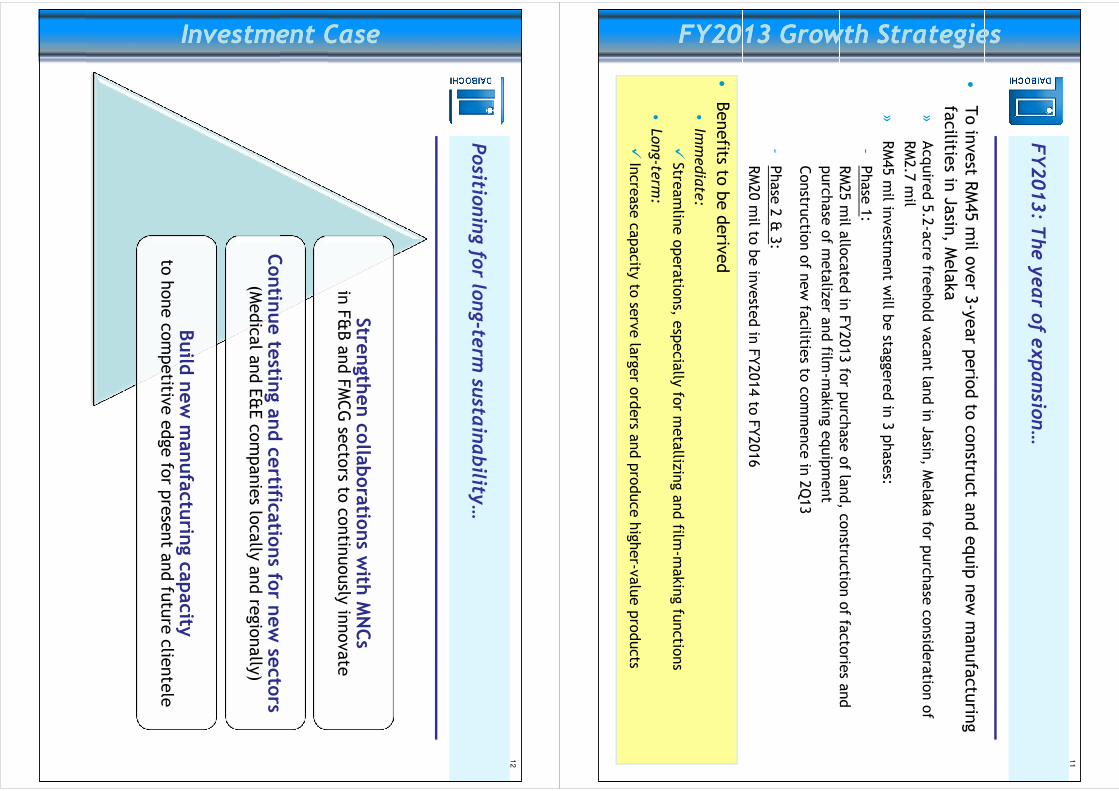
•To in
vest R
M45 m
il over 3
-year p
erio
d to
constru
ct a
nd equip new m
anufacturin
g
facilitie
s in Jasin
, Melaka
»Acquire
d 5.2-acre fre
ehold vacant la
nd in
Jasin
, Melaka fo
r purchase consid
eratio
n of
RM2.7 m
il
»RM45 m
il investm
ent w
ill be sta
ggered in
3 phases:
-Phase 1:
RM25 m
il allo
cated in
FY2013 fo
r purchase of la
nd, c
onstru
ctio
n of fa
ctorie
s and
11
FY2013: T
he year o
f expansio
n…
FY2013 Growth StrategiesFY2013 Growth Strategies
RM25 m
il allo
cated in
FY2013 fo
r purchase of la
nd, c
onstru
ctio
n of fa
ctorie
s and
purchase of m
etalizer a
nd film
-making equipment
Constru
ctio
n of n
ew fa
cilitie
s to commence in
2Q13
-Phase 2 & 3:
RM20 m
il to be in
veste
d in
FY2014 to
FY2016
FY2013 Growth StrategiesFY2013 Growth Strategies
•Benefits to
be deriv
ed
•Im
media
te:
�Stre
amlin
e operatio
ns, e
specially
for m
etalliz
ingand film
-making fu
nctio
ns
•Long-te
rm:
�Increase capacity
to se
rve la
rger o
rders a
nd produce higher-v
alue products
Strength
en co
llaboratio
ns w
ith MNCs
in F&B and FMCG se
ctors to
contin
uously
innovate
Contin
ue te
sting a
nd ce
rtificatio
ns fo
r new se
ctors
12
Positio
ning fo
r long-te
rm su
stainability
…
Investment CaseInvestment Case
Contin
ue te
sting a
nd ce
rtificatio
ns fo
r new se
ctors
(Medical a
nd E&E companies lo
cally and re
gionally)
Build new manufactu
ring ca
pacity
to hone competitiv
e edge fo
r present a
nd fu
ture clie
ntele
Investment CaseInvestment Case

13
PE to
be co
mpresse
d by earn
ings g
rowth m
omentum… sw
eetened by
dece
nt d
ividend yield of 5
%
ValuationsValuations
Sh
are
Pric
e @
18
-Fe
bR
M2
.53
Ma
rke
t Ca
p @
18
-Fe
bR
M2
88
.0 m
il
FY
12
PE
11
.7 x
ValuationsValuations
FY
12
EV
/ EB
ITD
A7
.2 x
FY
12
Div
ide
nd Y
ield
15
.3%
1B
ased o
n a
dju
ste
d d
ivid
end p
er s
hare
of 1
3.3
sen, p
ost 1
-for-2
Bonus Is
sue
THANK YOU
14
THANK YOU
Bursa
: DAIB
OCI/
8125
Blo
om
berg
: DPP:M
KReute
rs: DPPM
.KL
IR Conta
cts:
Thomas L
imE: to
mlim
@daiboch
iplastic.c
om
T: 0
6-231 9779
Julia
Pong
E: ju
lia@aquila
s.com.m
yT: 0
12-3909 258

APPENDIX
15
APPENDIX
CORPORATE PROFILE
16
CORPORATE PROFILE

The LARGEST su
pplier o
f packagin
g in SE
AThe LARGEST su
pplier o
f packagin
g in SE
A
17
Daiboch
i, a re
silient in
vestm
ent ca
se…
Track RecordTrack Record
The SO
LE su
pplier to
Chembong C
onfectio
nery
The SO
LE su
pplier to
Chembong C
onfectio
nery
Facto
ry in M’sia
Facto
ry in M’sia
Supplier o
f >90% of ’s fle
xible packa
ging in
M’sia
Supplier o
f >90% of ’s fle
xible packa
ging in
M’sia
Track RecordTrack Record
Supplier o
f >90% of ’s fle
xible packa
ging in
M’sia
Supplier o
f >90% of ’s fle
xible packa
ging in
M’sia
The SO
LE su
pplier o
f The SO
LE su
pplier o
f biscu
its in M’sia
biscu
its in M’sia
Other im
porta
nt c
usto
mers:
�Liste
d sin
ce 1990, n
ow on Main Market o
f Bursa
M’sia
�Market ca
p of R
M288.0 mil (1
8.2.2013)
�Dividend policy
of p
aying m
inimum 60% of annual net p
rofit to
shareholders, o
n a quarte
rly basis
DA
IBO
CH
I PL
AS
TIC
& P
AC
KA
GIN
G IN
DU
ST
RY
BE
RH
AD
Lis
ted
Main
Mark
et, B
urs
a M
ala
ysia
sin
ce 1
990
(Tra
nsfe
rred fro
m S
econd B
oard
in 2
003)
Secto
rIn
dustria
l Pro
ducts
18
Liste
d sin
ce 1990…
Corporate InformationCorporate Information
Secto
rIn
dustria
l Pro
ducts
Codes
Burs
a: 8
125 / D
AIB
OC
I
Blo
om
berg
: DP
P:M
K
Reute
rs: D
PP
M.K
L
Share
Capita
lR
M113.9
mil (1
13.8
53 m
il share
s o
f RM
1.0
0 e
ach)
Mark
et C
apita
lizatio
nR
M288.0
mil (R
M2.5
3 a
s a
t 18 F
eb 2
013)
Corporate InformationCorporate Information
Corporate ProfileCorporate Profile1
9
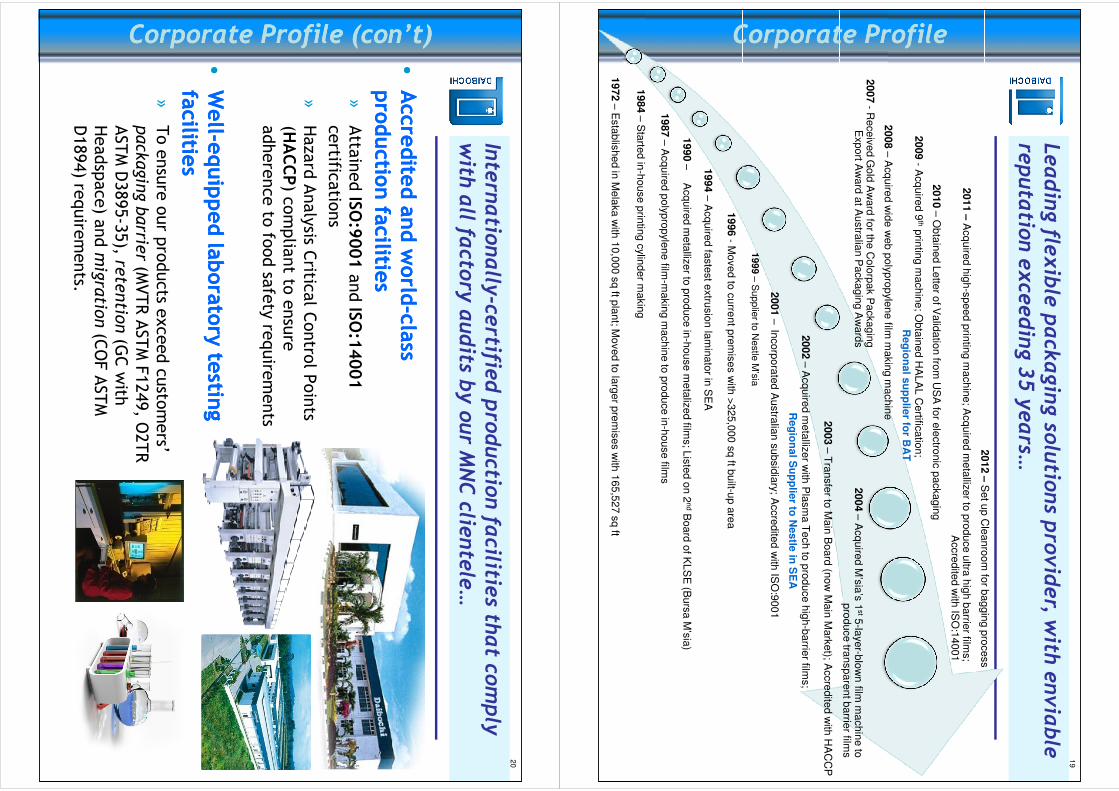
Leading fle
xible pack
aging so
lutio
ns p
rovider, w
ith enviable
reputa
tion exce
eding 35 years…
20
09
-A
cq
uire
d 9
thp
rintin
g m
ach
ine
; Ob
tain
ed
HA
LA
L C
ertific
atio
n;
20
08
–A
cq
uire
d w
ide
we
b p
oly
pro
pyle
ne
film m
akin
g m
ach
ine
20
07
-R
ece
ive
d G
old
Aw
ard
for th
e C
olo
rpa
kP
acka
gin
g
Exp
ort A
wa
rd a
t Au
stra
lian
Pa
cka
gin
g A
wa
rds
20
04
–A
cq
uire
d M
’sia
’s 1
st5
-laye
r-blo
wn
film m
ach
ine
to
pro
du
ce
tran
sp
are
nt b
arrie
r films
Re
gio
na
l su
pp
lier fo
r BA
T
20
10
–O
bta
ine
d L
ette
r of V
alid
atio
n fro
m U
SA
for e
lectro
nic
pa
cka
gin
g
20
11
–A
cq
uire
d h
igh
-sp
ee
d p
rintin
g m
ach
ine
; Acq
uire
d m
eta
llize
rto
pro
du
ce
ultra
hig
h b
arrie
r films;
Accre
dite
d w
ith IS
O:1
40
01
20
12
–S
et u
p C
lea
nro
om
for b
ag
gin
g p
roce
ss
Corporate ProfileCorporate Profile
19
94
–A
cq
uire
d fa
ste
st e
xtru
sio
n la
min
ato
r in S
EA
19
96
-M
ove
d to
cu
rren
t pre
mis
es w
ith >
32
5,0
00
sq
ft bu
ilt-up
are
a
20
01
–In
co
rpo
rate
d A
ustra
lian
su
bsid
iary
; Accre
dite
d w
ith IS
O:9
00
1
19
99
–S
up
plie
r to N
estle
M’s
ia
20
02
–A
cq
uire
d m
eta
llize
r with
Pla
sm
a T
ech
to p
rod
uce
hig
h-b
arrie
r films;
Re
gio
na
l Su
pp
lier to
Ne
stle
in S
EA
20
03
–T
ran
sfe
r to M
ain
Bo
ard
(no
w M
ain
Ma
rke
t); Accre
dite
d w
ith H
AC
CP
19
90
–A
cq
uire
d m
eta
llize
rto
pro
du
ce
in-h
ou
se
me
taliz
ed
films; L
iste
d o
n 2
nd
Bo
ard
of K
LS
E (B
urs
a M
’sia
)
19
87
–A
cq
uire
d p
oly
pro
pyle
ne
film-m
akin
g m
ach
ine
to p
rod
uce
in-h
ou
se
films
19
84
–S
tarte
d in
-ho
use
prin
ting
cylin
de
r ma
kin
g
19
72
–E
sta
blis
he
d in
Me
laka
with
10
,00
0 s
q ft p
lan
t; Mo
ve
d to
larg
er p
rem
ise
s w
ith 1
65
,52
7 s
q ft
Corporate Profile (con’t)Corporate Profile (con’t)
••Accre
dite
d and world
Accre
dite
d and world
--class
class
productio
n facilitie
sproductio
n facilitie
s»
Atta
ined ISO
:9001and ISO
:14001
certific
atio
ns
»Hazard Analysis C
ritical C
ontro
l Points
(HACCP) c
ompliant to
ensure
20
Intern
atio
nally
-certifie
d pro
ductio
n fa
cilities th
at co
mply
with
all fa
ctory
audits b
y our M
NC clie
ntele…
Corporate Profile (con’t)Corporate Profile (con’t)
(HACCP) c
ompliant to
ensure
adherence to
food sa
fety re
quire
ments
••Well
Well--e
quipped laboratory te
sting
equipped laboratory te
sting
facilitie
sfacilitie
s»
To ensure our p
roducts e
xceed custo
mers’
pack
agin
g b
arrie
r (MVTR ASTM F1249, O
2TR
ASTM D3895-35), re
tentio
n(GC with
Headspace) a
nd m
igra
tion(COF ASTM
D1894) re
quire
ments.

21
Production FacilitiesProduction Facilities
Integra
ted end-to
-end pack
aging pro
cess…
equipped w
ith
specia
lized in
-house
capabilitie
s
Th
e o
nly
pla
ye
r with
in-h
ou
se
cylin
de
r-ma
kin
g, a
nd
on
e o
f the
few
with
me
talliz
ing
an
d
se
alin
g c
ap
abilitie
s fo
r qu
ality
assu
ran
ce
an
d c
on
sta
nt im
pro
ve
me
nt a
t ke
y s
tag
es
Production FacilitiesProduction Facilities
Pre
pre
ss
Pre
pre
ss
Cylin
de
r C
ylin
de
r M
ak
ing
Ma
kin
gG
ravu
re
Gra
vu
re
Prin
ting
Prin
ting
La
min
atio
n
La
min
atio
n
(Ex
trus
ion
/ (E
xtru
sio
n /
Dry
)D
ry)
Slittin
g /
Slittin
g /
Ba
gg
ing
Ba
gg
ing
CP
P F
ilmM
eta
llize
r
Up to
9-c
olo
ur 2
-sid
ed p
rintin
gIn
-house c
apabilitie
sS
olv
ent-b
ase
d/fre
eC
apabilitie
s in
cl S
tandin
g P
ouch
To b
uild
hig
h b
arrie
rsP
olyp
rop
yle
ne s
ealin
g film
s
22
Daibochi ProductsDaibochi Products
Wide ra
nge of p
ack
aging so
lutio
ns fo
r vario
us p
roduct
functio
ns…
Consta
ntly
innovatin
g fo
r changing re
quire
ments
Film
Typ
eA
pp
lica
tion
s / U
se
Hig
h P
erm
ea
bility
Ba
rrier / P
erfo
rma
nc
eC
offe
e, N
uts
, Po
tato
Ch
ips
Co
st E
ffec
tive
Ba
rrier
Sn
acks, B
iscu
its, W
afe
r, Ch
oco
late
, C
ake
s
Daibochi ProductsDaibochi Products
Ca
ke
s
Ge
ne
ral P
ac
ka
gin
gO
ute
r Pa
ck, N
oo
dle
s, B
iscu
its, W
afe
rs
Sp
ec
ialty
Ap
plic
atio
nL
ab
ellin
g, Ic
e-c
rea
m, F
roze
n F
oo
d,
Ce
rea
l Pe
el S
ea
l, Se
aso
nin
g O
il, P
ow
de
r / Liq
uid
De
terg
en
t, S
ho
we
r Fo
am
, To
ba
cco
, Pe
t foo
d

Customer BaseCustomer Base
Diversifie
d clie
ntele of le
ading bra
nds…
2
3
Fo
od
Be
ve
rag
eF
MC
GS
pe
cia
lty
Customer BaseCustomer Base
24
Key ManagementKey Management
Experie
nce
d m
anagement w
ith in
dustry
expertise
…
Th
om
as
Lim
So
o K
oo
n, M
an
ag
ing
Dire
cto
r
-H
old
s a
degre
e in
Bachelo
r of S
cie
nce In
dustria
l Engin
eerin
g a
nd M
anagem
ent fro
m O
kla
hom
a S
tate
Univ
ers
ity, &
Maste
r of B
usin
ess A
dm
inis
tratio
n d
egre
e fro
m O
kla
hom
a S
tate
Univ
ers
ity.
-Join
ed D
aib
ochi in
1995, a
nd w
as a
ppoin
ted a
s M
anagin
g D
irecto
r in F
ebru
ary
2005.
-P
layed a
key ro
le in
build
ing G
roup’s
MN
C c
liente
le.
Da
tuk
Wo
ng
So
on
Lim
, Ex
ec
utiv
e D
irec
tor
-A
n a
ccounta
nt b
y tra
inin
g a
nd a
mem
ber o
f the M
ala
ysia
n A
ssocia
tion o
f the In
stitu
te o
f Charte
red S
ecre
tarie
s a
nd
Key ManagementKey Management
-A
n a
ccounta
nt b
y tra
inin
g a
nd a
mem
ber o
f the M
ala
ysia
n A
ssocia
tion o
f the In
stitu
te o
f Charte
red S
ecre
tarie
s a
nd
Adm
inis
trato
rs.
-H
as a
n e
xte
nsiv
e e
xperie
nce a
nd k
now
ledge in
the fie
ld o
f accountin
g, fin
ance, c
onsulta
ncy, c
orp
ora
te fin
ance,
manufa
ctu
ring a
nd p
roperty
develo
pm
ent. In
stru
menta
l in lis
ting o
f the C
om
pany.
Lo
w C
ha
n T
ian
, Ex
ec
utiv
e D
irec
tor
-H
old
s a
degre
e in
Bachelo
r of E
ngin
eerin
g fro
m th
e U
niv
ers
ity o
f Weste
rn A
ustra
lia.
-H
as w
ide e
xperie
nce in
manufa
ctu
ring, p
roperty
develo
pm
ent, b
usin
ess a
nd fin
ance.
Lo
w J
in W
ei, E
xe
cu
tive
Dire
cto
r
-H
old
s a
degre
e in
Bachelo
r of C
om
merc
e (M
ajo
r in F
inance &
Mark
etin
g) fro
m U
niv
ers
ity o
f Sydney, N
SW
, Austra
lia.
-P
rior to
this
, Mr. L
ow
was th
e M
anagin
g D
irecto
r / Pro
ject D
irecto
r of G
lassK
ote
(Mala
ysia
) Sdn B
hd fro
m 2
005 to
Septe
mber 2
010.

25
Major ShareholdersMajor Shareholders
Gro
wing in
stitutio
nal fo
llowing… Free flo
at re
tained at >
50%
No. o
f shares (‘m
il)(31.12.2012)
Perce
ntage *
Low Chan Tian, E
D10.10
8.9%
Datuk Wong Soon Lim, E
D7.02
6.2%
Major ShareholdersMajor Shareholders
Lim Koy Peng
8.62
7.6%
* Exclu
din
g 4
16
,30
0 s
ha
res b
ou
gh
t ba
ck b
y th
e C
om
pa
ny a
nd
reta
ine
d a
s tre
asu
ry s
ha
res
••Flexible packagin
g market, w
orth
Flexible packagin
g market, w
orth
$58.3 bil in
2011, e
stimated to
$58.3 bil in
2011, e
stimated to
reach $71.3 bil in
2016
reach $71.3 bil in
2016*
»Favoured fo
r its versa
tility, c
omparativ
e
low cost a
nd potentia
l for in
novatio
n.
26
Industry InsightIndustry Insight
Gro
wth in
flexible pack
aging to
be le
d by th
e Asia
n re
gion…
Global co
nsumer fle
xible packa
ging
consumptio
n by re
gion, 2
011
(% sh
are by volume)
••Asia
: the large
st and faste
stAsia
: the large
st and faste
st--gro
wing fle
xible packagin
g market
growing fle
xible packagin
g market
»Represented 29.1% of g
lobal m
arket
volume
»Forecast C
AGR of 7
.9% fo
r 2011 to
2016;
becoming one of th
e fa
stest g
rowing
markets in
the re
gion; le
d by In
dia and
China in
line with
their d
eveloping
economies
Industry InsightIndustry Insight
*S
ou
rce
: “Th
e F
utu
re o
f Glo
ba
l Fle
xib
le P
acka
gin
g to
20
16
” by P
ira In
tern
atio
na
l
Top Related