


Languages
Pages
Legal

Corporate EntrepreneurshipPerformance: Sloveniaand Romaniaboštjan antonci c
University of Primorska, Slovenia
cezar scarlat
University Politechnica of Bucharest, Romania
Entrepreneurship development is an imperative agenda for theimprovement of competitiveness of current and future eu mem-ber countries. Corporate entrepreneurship activities and orien-tations can be considered important predictors of organizationalperformance. Hypotheses on the relationship between corporateentrepreneurship (organizational-level entrepreneurial behav-iors) and performance elements and between alliance and cor-porate entrepreneurship elements were developed and tested.The analyses were done by using questionnaire data collected intwo countries: Slovenia and Romania. Findings indicated very mi-nor differences in corporate entrepreneurship and alliance itemmeans between the two countries. Innovation in products andservices can be considered crucial for performance of firms andeconomic growth. Strategic alliance relationships can be impor-tant for corporate entrepreneurship development.
Key words: corporate entrepreneurship, performance, alliances,Slovenia, Romania
Introduction
Entrepreneurship development is an imperative agenda for the im-provement of competitiveness of current and future European Union(eu) member countries. The focus of this study is corporate en-trepreneurship (i. e. entrepreneurship at the level of an existingfirm). Corporate entrepreneurship activities and orientations canbe considered important predictors of organizational performance.While past corporate entrepreneurship research in North America(for example, Covin and Slevin 1986; Covin 1991; Zahra 1991; 1993;
A previous version of this paper was published in Managing the Process of Globalis-ation in New and Upcoming eu Members: Proceedings of the 6th International Con-ference of the Faculty of Management Koper, University of Primorska, 71–89 (Koper:Faculty of Management, 2006).
management 3 (1): 15–38 15

Boštjan Antoncic and Cezar Scarlat
Zahra and Covin 1995) provided substantial evidence on the cor-porate entrepreneurship-performance relationship, empirical re-search on this relationship in new or future eu accession countrieshas been rare and is mainly concentrated in works of Antoncic andassociates (Antoncic and Hisrich 2000; 2001; 2004; Antoncic andZorn 2004) in Slovenia – a relatively newer eu country (a new eu
country at the time of the study). This study extends the study ofcorporate entrepreneurship-performance relationship to a new eu
member country (a prospective eu member country at the time ofthe study) – Romania, by making a comparison with Slovenia. Thisstudy is exploiting a research opportunity to assess the role of en-trepreneurship – in this case corporate entrepreneurship – in firmperformances that were brought with the shift from socialism tomarket-based systems in Central and Eastern Europe, as advocatedby Hills and LaForge (1992).
A significant amount of research has been conducted includingtwo groups of corporate entrepreneurship antecedents: factors ofthe firm’s external environment (e. g., Miller 1983; Khandwalla 1987;Covin and Slevin 1991; Zahra 1991; 1993; Badguerahanian and Abetti1995; Antoncic and Hisrich 2000; 2001; 2004) and organizational-level internal factors (e. g., Souder 1981; Schollhammer 1982; Kan-ter 1984, Pinchot 1985; Luchsinger and Bagby 1987; Antoncic andHisrich 2000; 2001; 2004). This research, with the exception of An-toncic and Hisrich (2004), failed to recognize that corporate en-trepreneurship may also be influenced by the firm’s engagementin inter-organizational alliances. The present study remedies thisweakness of past research by examining the relationship betweenalliance elements and corporate entrepreneurship.
In what follows, hypotheses on the relationship between corporateentrepreneurship and performance elements and between allianceand corporate entrepreneurship elements are developed, researchmethods are described, findings are presented and discussed.
Theory and Hypotheses
In this paper, corporate entrepreneurship is defined as entrepreneur-ship within an existing organization, including emergent behavioralintentions and behaviors of an organization related to departuresfrom the customary (Antoncic and Hisrich 2003). Even if corporateentrepreneurship can have several characteristic dimensions, suchas new business venturing, product/service innovation, process in-novation, self-renewal, risk taking, proactiveness, and competitiveaggressiveness, this paper focuses only on the most evident cor-
16 management · volume 3

Corporate Entrepreneurship Performance
porate entrepreneurship activities: new businesses, new ventures,and product and service innovation. These activities are definedas: (1) new businesses – pursuit of and entering into new busi-nesses related to current products or markets (Rule and Irvin 1988;Zahra 1991; Stopford and Baden-Fuller 1994; Antoncic and Hisrich2003); (2) new ventures – creation of new autonomous or semi-autonomous units or firms (Schollhammer 1981; Hisrich and Peters1984; MacMillan et al. 1984; Vesper 1984; Kanter and Richardson1991; Stopford and Baden-Fuller 1994; Sharma and Chrisman 1999;Antoncic and Hisrich 2003); (3) product/service innovation – cre-ation of new products and services (Schollhammer 1982; Covin andSlevin 1991; Zahra 1993; Damanpour 1996; Burgelman and Rosen-blom 1997; Knight 1997; Tushman and Anderson 1997; Antoncic andHisrich 2003). Corporate entrepreneurship (intrapreneurship) canbe differentiated from other similar concepts in management andbusiness research, such as diversification strategy, capabilities, or-ganizational learning and organizational innovation (a more precisedescription of this differentiation and the corporate entrepreneur-ship definition is provided in Antoncic and Hisrich 2003).
corporate entrepreneurship and performance
Growth and profitability are performance elements that can be con-sidered important consequences of corporate entrepreneurship. Ingeneral, corporate entrepreneurship has been regarded an impor-tant element of successful organizations (Peters and Waterman 1982;Kanter 1984; Pinchot 1985). On the one hand, the relationship be-tween corporate entrepreneurship and growth has received widesupport in past research. Corporate entrepreneurship was foundpredictive of the growth of small firms (Covin 1991) and large firms(Covin and Slevin 1986; Zahra 1991; 1993; Zahra and Covin 1995).A positive corporate entrepreneurship-growth relationship was dis-covered for Slovenian (Antoncic and Hisrich 2001; 2004) and us es-tablished firms (Morris and Sexton 1996; Antoncic and Hisrich 2001)and health care firms (Stetz et al. 1998). On the other hand, past re-search on the relationship between corporate entrepreneurship andprofitability produced mixed support. Corporate entrepreneurshipwas found to be related to the profitability of large firms (Covin andSlevin 1986; Zahra 1991; 1993; Zahra and Covin 1995), and small,medium-sized, and large firms from various industries in Slovenia,but not in the us (Antoncic and Hisrich 2001). Morris and Sexton(1996) also did not find a significant positive relationship betweenentrepreneurial intensity and profitability of us firms. One explana-
number 1 · spring 2008 17

Boštjan Antoncic and Cezar Scarlat
tion for such mixed results is that ‘firms in the us are more growthoriented and value growth more than profitability than do the firmsin Slovenia that may be still more survival and profit rather thangrowth oriented’ (Antoncic and Hisrich 2001, 523). A similar pos-itive relationship between corporate entrepreneurship and perfor-mance may be expected also for other similar countries referred toas transition economies, such as Romania. For firms in transitioneconomies it may be particularly beneficial to exercise corporate en-trepreneurship in order to ensure change and growth (Antoncic andHisrich 2000). Romania has been going through the transition to-wards a market-based economic system in a similar period to thatof Slovenia. When taking into consideration the economic develop-ment model based on corporate entrepreneurship (Douglas et al.2003), Romania may be at the medium levels of economic devel-opment (gdp per capita), where strong efforts need to be made toincrease all dimensions of corporate entrepreneurship. In contrast,Slovenia may be at the medium-high, where among entrepreneurialactivities innovativeness becomes a key for improved performance.Hence, we would expect a general positive relationship between cor-porate entrepreneurship and performance in terms of profitabil-ity and growth, with a distinction in more positive and significantrelationships of innovativeness items to performance than the im-pact of other elements on performance in Slovenia, while in Roma-nia we may find a more balanced impact of different corporate en-trepreneurship elements on performance. This research forms thebasis of the following hypotheses:
hypothesis 1: The extent of corporate entrepreneurship (newbusinesses, new ventures, product/service innovation) will be pos-itively related to organizational performance in terms of growthand profitability in Slovenia and Romania.
hypothesis 2: Positive and significant relationships of corpo-rate entrepreneurship to performance will have the following prop-erties: (2a) product/service innovation will be the most impor-tant among corporate entrepreneurship elements in Slovenia, and(2b) the importance of new businesses, new ventures, and prod-uct/service innovation will be balanced in Romania.
alliance elements and corporate entrepreneurship
Inter-organizational relationships have received limited researchattention in the context of corporate entrepreneurship (Antoncic1999). Firms participate in alliances in order to learn know-how and
18 management · volume 3

Corporate Entrepreneurship Performance
capabilities from their alliance partners (Kale et al. 2000). Inter-firm elements that reside in networks and strategic alliances andcan be beneficial for corporate entrepreneurship, as conceptuallyelaborated by Antoncic (2001), are: inter-firm communication, trust,external-relationship oriented support, value congruence, and thenumber of external relationships. First, the frequency and qualityof inter-firm communication can have a positive impact on corpo-rate entrepreneurship. Past research that supports this notion hasemphasized the following: face-to-face interaction (Saxenian 1991),communication quality and participation (Mohr and Spekman 1994),information sharing (Jones et al. 1997; Uzzi 1997), open and promptcommunication (Das and Teng 1998), and frequency of communi-cation (Deeds and Hill 1998). Second, inter-firm trust can have apositive impact on corporate entrepreneurship. Past research hasstressed the importance of trust in alliances (Pruitt 1981; Parkhe1993; Das and Teng 1998; Weaver and Dickson 1998) and networks(Saxenian 1991). Third, the inter-firm level organizational supportcan be seen as a crucial element for corporate entrepreneurship. Thesupport elements can be found in discussions about: commitmentin inter-firm relationships (Porter et al. 1974; Mohr and Spekman1994) and permeability of network boundaries (Jones et al. 1997).Fourth, congruence of organizational values across alliance or net-work partner firms can be an important predictor of corporate en-trepreneurship development. Values in general can serve as socialcontrol mechanisms that encourage desirable behavior in alliances(Das and Teng 1998), sharing values can improve alliance success(Parkhe 1991), and, in addition, values can even be a byproductof joint networking (Jones et al. 1997). Fifth, the number of inter-firm relationships of a firm can have a positive impact on corporateentrepreneurship development, particularly on product innovation(Saxenian 1991); Deeds and Hill 1996; 1998; Powell et al. 1996), aswell as on corporate entrepreneurship as a construct (Antoncic andHisrich 2004).
hypothesis 3: The extent of alliance elements (communication,trust, support, value congruence, number of alliances) will be pos-itively related to corporate entrepreneurship in terms of new busi-nesses, new ventures, and product/service innovation in Sloveniaand Romania.
Methods
The methodology will be discussed in terms of measurement instru-ment, data collection, samples, and data analysis.
number 1 · spring 2008 19

Boštjan Antoncic and Cezar Scarlat
measurement instrument
In this research, corporate entrepreneurship, alliance character-istics, and performance elements were measured mostly throughscales previously tested and used by other researchers. The ques-tionnaire was initially prepared in English and then translated intoSlovenian and Romanian. Perceptual measures were selected basedon their congruence with the concepts under examination. Five pointscales (Likert-type scales and semantic differentials) were used tokeep the questionnaire as simple as possible. In some cases longerscales were needed to capture the information. Companies reportedanswers for the past three-year period.
Corporate entrepreneurship was measured by selected items ofnew businesses, new ventures, and product/service innovation (seetable 1) from the corporate entrepreneurship scale used by Antoncicand Hisrich (2004). The number of alliances was measured as thenumber of strategic alliances of the focal firm (Antoncic and Hisrich2004) and was assessed across different alliance types: customer-supplier relationships, licensing, technology sharing, joint develop-ment, and equity joint ventures (Mowery et al. 1996), and at the over-all level.
Dependent variables – performance – were measured in terms ofgrowth and profitability in absolute and relative terms (Antoncic andHisrich 2001): absolute growth items are the average annual growthin number of employees in the last three years and the average an-nual growth in sales in the last three years, while the relative growthitem is growth in market share (Chandler and Hanks 1993) in the lastthree years; absolute profitability items are average annual returnon sales (ros), average return on assets (roa), and average annualreturn on equity (roe), in the last three years, while relative prof-itability items are a subjective measure of firm performance relativeto competitors (Chandler and Hanks 1993) and its extension (Anton-cic and Hisrich 2001; 2004): the company’s profitability in compari-son to all competitors, as well as to competitors that are at about thesame age and stage of development. Control variables included firmage, size, and industry.
data collection, samples, and data analysis
Questionnaire data were collected from top executives of selectedfirms in Slovenia and Romania. For analysis 477 usable responseswere obtained from Slovenia (a representative random sample) and30 responses were obtained from Romania.
The average firm in the Slovenian sample had 100 to 249 employ-
20 management · volume 3

Corporate Entrepreneurship Performance
ees (full time equivalent), had $5 Million to up to $10 Million sales,was 21 to 50 years old, and operated in manufacturing, trade andservices sectors. The average firm in the Romanian sample had 50 to99 employees (full time equivalent), had $1 Million to up to $5 Mil-lion sales, was 11 to 20 years old, and operated in trade, services, andmanufacturing sectors. In both countries also other industries werewell represented. The samples were not ideally matched, but past re-search (Antoncic and Hisrich 2000; 2001; 2004) mostly confirmed thestability of corporate entrepreneurship models across control vari-ables.
Data were analyzed by using the spss statistical analytical soft-ware. Item means were compared in absolute and statistical terms(Kolmogorov-Smirnov test). The hypotheses were tested with theanalysis of correlations. These simple analytical methods were usedbecause of the small size of the Romanian sample.
Findings
Research findings will be discussed in terms of comparisons of cor-porate entrepreneurship and alliance mean values between Slove-nia and Romania, and hypotheses testing findings on corporateentrepreneurship–performance and alliance–corporate entrepre-neurship relationships.
comparisons of means
Means for all corporate entrepreneurship and alliance items areshown in table 1. Most differences in item means were found notto be statistically significant (at 0.05 levels). Significant differenceswere found only for few items: only one among 17 corporate en-trepreneurship items (the number of products introduced by thecompany lower in Slovenia – mean 2.65 – than in Romania – mean3.40); three among 28 alliance items (the congruence of organiza-tional values was found higher in Romania than in Slovenia for twoitems: in technology sharing – Slovenia 2.64, Romania 3.80 – andin joint development – Slovenia 2.58, Romania 3.50; the number ofstrategic alliances in the equity joint ventures type was found higherin Slovenia than in Romania: mean value 1.91 is close to one allianceof this type in Slovenia and mean 1.13 is close to zero alliances inRomania).
corporate entrepreneurship–performance
relationships
Hypothesis 1 predicted a positive relationship between corporateentrepreneurship and performance. Correlations for the Slovenian
number 1 · spring 2008 21

Boštjan Antoncic and Cezar Scarlat
ta
bl
e1
Mea
nco
mp
aris
ons
bet
wee
nS
love
nia
and
Rom
ania
Qu
esti
onn
aire
item
Dim
ensi
onC
ode
Slo
ven
iaR
oman
ia
(1)
(2)
(1)
(2)
Sti
mu
lati
ng
you
rn
ewd
eman
don
you
rex
isti
ng
pro
du
cts
inyo
ur
curr
ent
mar
kets
thro
ugh
aggr
essi
vead
vert
isin
gan
dm
arke
tin
gN
ewb
usi
nes
ses
i1
nb
01
2.71
0.05
2.97
0.24
Bro
aden
ing
you
rb
usi
nes
sli
nes
inyo
ur
curr
ent
ind
ust
ries
New
bu
sin
esse
si1
nb
02
3.13
0.05
3.50
0.20
Pu
rsu
ing
new
bu
sin
esse
sin
new
ind
ust
ries
that
are
rela
ted
toyo
ur
curr
ent
bu
sin
ess
New
bu
sin
esse
si1
nb
03
3.14
0.05
2.83
0.24
Fin
din
gn
ewn
ich
esfo
ryo
ur
pro
du
cts
inyo
ur
curr
ent
mar
kets
New
bu
sin
esse
si1
nb
04
3.50
0.05
3.07
0.21
En
teri
ng
new
bu
sin
esse
sby
offe
rin
gn
ewli
nes
and
pro
du
cts
New
bu
sin
esse
si1
nb
05
3.00
0.06
2.80
0.22
Cre
atin
gn
ewse
mi-
auto
nom
ous
un
its
New
ven
ture
si1
nb
06
2.24
0.05
2.47
0.25
Cre
atin
gn
ewau
ton
omou
su
nit
sN
ewve
ntu
res
i1
nb
07
1.97
0.05
2.07
0.22
Cre
atin
gn
ewfi
rms
New
ven
ture
si1
nb
08
1.84
0.05
1.97
0.26
Cre
atin
gn
ewto
tall
yin
dep
end
ent
firm
sN
ewve
ntu
res
i1
nb
09
1.44
0.04
1.50
0.20
You
rco
mp
any’
sem
ph
asis
ond
evel
opin
gn
ewp
rod
uct
sP
rod
uct
/ser
vice
inn
ovat
ion
i2
pi0
13.
450.
053.
400.
19
Rat
eof
new
pro
du
ctin
trod
uct
ion
into
the
mar
ket
Pro
du
ct/s
ervi
cein
nov
atio
ni2
pi0
23.
160.
043.
200.
20
You
rco
mp
any’
ssp
end
ing
onn
ewp
rod
uct
dev
elop
men
tac
tivi
ties
Pro
du
ct/s
ervi
cein
nov
atio
ni2
pi0
33.
200.
053.
170.
21
Th
en
um
ber
ofn
ewp
rod
uct
sad
ded
byyo
ur
com
pan
yP
rod
uct
/ser
vice
inn
ovat
ion
i2
pi0
43.
220.
043.
270.
23
Th
en
um
ber
ofn
ewp
rod
uct
sin
trod
uce
dby
you
rco
mp
any
Pro
du
ct/s
ervi
cein
nov
atio
ni2
pi0
52.
650.
053.
400.
21*
Ple
ase
esti
mat
eth
ep
erce
nt
ofth
eco
mp
any’
sre
ven
ue
gen
erat
edfr
omp
rod
uct
sth
atd
idn
otex
ist
thre
eye
ars
earl
ier
(1=
0–9%
...7
=70
%or
mor
e)
Pro
du
ct/s
ervi
cein
nov
atio
ni2
pi0
52.
650.
053.
400.
21
How
man
yn
ewli
nes
ofp
rod
uct
sor
serv
ices
has
you
rfi
rmm
arke
ted
inla
stth
ree
year
s(5
=ve
rym
any
new
lin
esof
pro
du
cts
orse
rvic
es)
Pro
du
ct/s
ervi
cein
nov
atio
ni2
pi0
63.
110.
083.
530.
36
How
man
yn
ewli
nes
ofp
rod
uct
sor
serv
ices
has
you
rfi
rmm
arke
ted
inla
stth
ree
year
s(5
=ch
ange
sin
pro
du
ctor
serv
ice
lin
esh
ave
usu
ally
bee
nq
uit
ed
ram
atic
)
Pro
du
ct/s
ervi
cein
nov
atio
ni2
pi0
73.
030.
052.
790.
21
22 management · volume 3

Corporate Entrepreneurship PerformanceP
leas
era
teth
eex
ten
tof
com
mu
nic
atio
nw
ith
you
rst
rate
gic
alli
ance
par
t-n
ers
inge
ner
alin
last
thre
eye
ars
(r;1
=ti
mel
y)A
llia
nce
com
mu
nic
atio
nn
1c
o0
12.
340.
042.
420.
22
Ple
ase
rate
the
exte
nt
ofco
mm
un
icat
ion
wit
hyo
ur
stra
tegi
cal
lian
cep
art-
ner
sin
gen
eral
inla
stth
ree
year
s(r
;1=
accu
rate
)A
llia
nce
com
mu
nic
atio
nn
1c
o0
22.
490.
042.
380.
22
Ple
ase
rate
the
exte
nt
ofco
mm
un
icat
ion
wit
hyo
ur
stra
tegi
cal
lian
cep
art-
ner
sin
gen
eral
inla
stth
ree
year
s(r
;1=
adeq
uat
e)A
llia
nce
com
mu
nic
atio
nn
1c
o0
32.
570.
042.
350.
25
Ple
ase
rate
the
exte
nt
ofco
mm
un
icat
ion
wit
hyo
ur
stra
tegi
cal
lian
cep
art-
ner
sin
gen
eral
inla
stth
ree
year
s(r
;1=
com
ple
te)
All
ian
ceco
mm
un
icat
ion
n1
co
04
2.78
0.03
2.62
0.24
Ple
ase
rate
the
exte
nt
ofco
mm
un
icat
ion
wit
hyo
ur
stra
tegi
cal
lian
cep
art-
ner
sin
gen
eral
inla
stth
ree
year
s(r
;1=
cred
ible
)A
llia
nce
com
mu
nic
atio
nn
1c
o0
52.
340.
042.
380.
21
Ple
ase
rate
the
exte
nt
ofco
mm
un
icat
ion
wit
hyo
ur
stra
tegi
cal
lian
cep
art-
ner
sin
gen
eral
inla
stth
ree
year
s(r
;1=
freq
uen
t)A
llia
nce
com
mu
nic
atio
nn
1c
o0
62.
530.
042.
620.
20
Ple
ase
rate
the
exte
nt
ofco
mm
un
icat
ion
wit
hyo
ur
stra
tegi
cal
lian
cep
art-
ner
sin
gen
eral
inla
stth
ree
year
s(r
;1=
hig
hq
ual
ity)
All
ian
ceco
mm
un
icat
ion
n1
co
07
2.63
0.04
2.46
0.19
We
tru
stth
atth
eal
lian
cep
artn
ers’
dec
isio
ns
wil
lbe
ben
efici
alto
our
bu
sin
ess
All
ian
cetr
ust
n2
tr
01
3.34
0.04
3.62
0.19
We
feel
that
we
do
not
get
fair
dea
lsfr
omou
ral
lian
cep
artn
ers
(r)
All
ian
cetr
ust
n2
tr
02
2.38
0.04
2.38
0.22
Rel
atio
nsh
ips
wit
hou
ral
lian
cep
artn
ers
are
mar
ked
bya
hig
hd
egre
eof
har
mon
yA
llia
nce
tru
stn
2t
r0
33.
190.
043.
190.
22
Ou
ral
lian
cep
artn
ers
pro
vid
eu
sw
ith
atr
uth
fulp
ictu
reof
thei
rb
usi
nes
ses
All
ian
cetr
ust
n2
tr
04
3.09
0.04
3.00
0.22
Ou
ral
lian
cep
artn
ers
carr
you
td
uti
esev
enif
we
do
not
chec
ku
pon
them
All
ian
cetr
ust
n2
tr
05
3.14
0.04
3.00
0.24
Ou
ral
lian
cep
artn
ers
hav
eso
met
imes
pro
mis
edto
do
thin
gsw
ith
out
actu
-al
lyd
oin
gth
emla
ter
(r)
All
ian
cetr
ust
n2
tr
06
2.97
0.05
2.85
0.24
Th
em
anag
emen
tst
ruct
ure
itse
lfen
cou
rage
sem
plo
yees
tob
elie
veth
atco
llab
orat
ion
wit
hp
artn
erco
mp
anie
sis
par
tof
the
role
set
for
allm
em-
ber
sof
the
orga
niz
atio
n
All
ian
cesu
pp
ort
n3
es
01
3.34
0.05
3.60
0.23
Rew
ard
san
dre
info
rcem
ent
enh
ance
the
mot
ivat
ion
ofin
div
idu
als
toco
l-la
bor
ate
wit
hp
artn
erco
mp
anie
sA
llia
nce
sup
por
tn
3e
s0
23.
090.
053.
130.
23
Con
tinu
edon
the
follo
win
gp
age
number 1 · spring 2008 23

Boštjan Antoncic and Cezar Scarlat
Con
tinu
edfr
omth
ep
revi
ous
pag
e
Bou
nd
arie
s(r
eala
nd
imag
ined
)th
atp
reve
nt
peo
ple
from
look
ing
atp
rob
-le
ms
outs
ide
our
com
pan
yd
on
otex
ist
All
ian
cesu
pp
ort
n3
es
03
3.01
0.05
3.07
0.22
Ou
rco
mp
any
has
am
inim
alco
mm
itm
ent
tost
rate
gic
alli
ance
par
tner
s(r
)A
llia
nce
sup
por
tn
3e
s0
42.
880.
052.
750.
26
Ple
ase
rate
the
leve
lof
con
gru
ence
ofor
gan
izat
ion
alva
lues
bet
wee
nyo
ur
com
pan
yan
dyo
ur
alli
ance
par
tner
sby
alli
ance
typ
e(c
ust
omer
-su
pp
lier
rela
tion
ship
s)
All
ian
ceva
lue
con
gru
ence
n4
vc
01
3.48
0.04
3.92
0.16
Ple
ase
rate
the
leve
lof
con
gru
ence
ofor
gan
izat
ion
alva
lues
bet
wee
nyo
ur
com
pan
yan
dyo
ur
alli
ance
par
tner
sby
alli
ance
typ
e(l
icen
sin
g)A
llia
nce
valu
eco
ngr
uen
cen
4v
c0
22.
270.
063.
360.
28
Ple
ase
rate
the
leve
lof
con
gru
ence
ofor
gan
izat
ion
alva
lues
bet
wee
nyo
ur
com
pan
yan
dyo
ur
alli
ance
par
tner
sby
alli
ance
typ
e(t
ech
nol
ogy
shar
ing)
All
ian
ceva
lue
con
gru
ence
n4
vc
03
2.64
0.05
3.80
0.29
*
Ple
ase
rate
the
leve
lof
con
gru
ence
ofor
gan
izat
ion
alva
lues
bet
wee
nyo
ur
com
pan
yan
dyo
ur
alli
ance
par
tner
sby
alli
ance
typ
e(j
oin
td
evel
opm
ent)
All
ian
ceva
lue
con
gru
ence
n4
vc
04
2.58
0.06
3.50
0.15
*
Ple
ase
rate
the
leve
lof
con
gru
ence
ofor
gan
izat
ion
alva
lues
bet
wee
nyo
ur
com
pan
yan
dyo
ur
alli
ance
par
tner
sby
alli
ance
typ
e(e
qu
ity
join
tve
ntu
res)
All
ian
ceva
lue
con
gru
ence
n4
vc
05
2.26
0.06
3.50
0.65
Ple
ase
esti
mat
eth
eov
eral
lnu
mb
erof
stra
tegi
cal
lian
ces
ofyo
ur
com
pan
yw
ith
oth
erco
mp
anie
sin
last
thre
eye
ars
All
ian
cen
um
ber
n5
de
01
3.89
0.08
4.77
0.43
Ple
ase
esti
mat
eth
en
um
ber
ofst
rate
gic
alli
ance
sin
last
thre
eye
ars
byth
efo
llow
ing
alli
ance
typ
es(c
ust
omer
-su
pp
lier
rela
tion
ship
s)A
llia
nce
nu
mb
ern
5d
e0
24.
560.
094.
380.
43
Ple
ase
esti
mat
eth
en
um
ber
ofst
rate
gic
alli
ance
sin
last
thre
eye
ars
byth
efo
llow
ing
alli
ance
typ
es(l
icen
sin
g)A
llia
nce
nu
mb
ern
5d
e0
31.
690.
061.
790.
22
Ple
ase
esti
mat
eth
en
um
ber
ofst
rate
gic
alli
ance
sin
last
thre
eye
ars
byth
efo
llow
ing
alli
ance
typ
es(t
ech
nol
ogy
shar
ing)
All
ian
cen
um
ber
n5
de
04
2.38
0.07
2.03
0.34
Ple
ase
esti
mat
eth
en
um
ber
ofst
rate
gic
alli
ance
sin
last
thre
eye
ars
byth
efo
llow
ing
alli
ance
typ
es(j
oin
td
evel
opm
ent)
All
ian
cen
um
ber
n5
de
05
2.28
0.07
1.87
0.25
Ple
ase
esti
mat
eth
en
um
ber
ofst
rate
gic
alli
ance
sin
last
thre
eye
ars
byth
efo
llow
ing
alli
ance
typ
es(e
qu
ity
join
tve
ntu
res)
All
ian
cen
um
ber
n5
de
06
1.91
0.06
1.13
0.08
*
no
te
sC
olu
mn
hea
din
gsar
eas
foll
ows:
(1)
mea
n,(
2)st
and
ard
erro
r.*
Dif
fere
nce
issi
gnifi
can
tat
the
0.05
leve
l.
24 management · volume 3

Corporate Entrepreneurship Performance
sample are shown in table 2. The majority of correlations betweencorporate entrepreneurship and growth items (44 out of 51 correla-tions, 86%) and corporate entrepreneurship and profitability items(60 out of 85 correlations, 71%) were found positive and significant.For one item – creating new totally independent firms – no signifi-cant relationship to profitability was found.
Correlations for the Romanian sample are shown in table 3. Cor-porate entrepreneurship and growth items were found not to be pre-dominantly significantly correlated (31 out of 51 correlations werenot significant, 61%), but three corporate entrepreneurship items(broadening business lines in current industries, the percent of com-pany revenue generated from newer products, dramatic changes inlines of products or services) stand out with strong and positive re-lationships to all growth items. Similar results were found for corre-lations between corporate entrepreneurship and profitability items(65 out of 85 correlations were not significant, 76%), but with twoitems strongly correlated to absolute profitability (broadening busi-ness lines in current industries, the percent of company revenuegenerated from newer products) and two items with strong corre-lation to relative profitability (broadening business lines in currentindustries, marketing of many new lines of products or services).
However, when we move over the significance levels and look atthe coefficient size, we can see that the results are not that differentbetween the two samples. For instance, many correlations below 0.2values are significant for the Slovenian sample, while many correla-tions above 0.2 are not significant in the Romanian sample. This isdue to the difference in sample sizes and measurement items’ codingproperties. Overall, Hypothesis 1 received mixed support.
Hypothesis 2 postulated that product/service innovation may bethe most important in the relationship to performance in Slovenia,while the relationship to performance of new businesses, new ven-tures, and product/service innovation may be balanced in Romania.Significant correlations to growth in Slovenia were found as follows(see table 2): new businesses – 9 out of 15, 60%; new ventures – 12 outof 12, 100%; product/service innovation – 23 out of 24, 96%. Signifi-cant correlations to profitability in Slovenia were found as follows:new businesses – 12 out of 25, 48%; new ventures – 11 out of 20, 55%;product/service innovation – 38 out of 40, 95%. These findings are ingeneral in support of Hypothesis 2a, with the notion that new ven-ture formation is also very important for growth in Slovenia.
In Romania, significant correlations to growth were found as fol-lows (see table 3): new businesses – 9 out of 15, 60%; new ventures –
number 1 · spring 2008 25

Boštjan Antoncic and Cezar Scarlat
ta
bl
e2
Pea
rson
corr
elat
ion
coef
fici
ents
bet
wee
nco
rpor
ate
entr
epre
neu
rsh
ipan
dp
erfo
rman
ceit
ems:
Slo
ven
ia
Cod
eP
erfo
rman
ceit
ems
p1
gr
01
p1
gr
02
p1
gr
03
p2
pr
01
p2
pr
02
p2
pr
03
p2
pr
04
p2
pr
05
i1
nb
01
.085
.161
**.1
68**
.089
.067
.059
.142
**.1
54**
i1
nb
02
.079
.168
**.1
98**
.147
**.1
78**
.165
**.1
53**
.181
**
i1
nb
03
.075
.143
**.2
17**
.075
.117
*.0
83.0
19.0
42
i1
nb
04
.016
.089
.129
**.0
85.0
91.0
50.0
56.0
97*
i1
nb
05
.118
*.2
02**
.229
**.1
30**
.106
*.0
98*
.066
.086
i1
nb
06
.163
**.1
71**
.194
**.0
75.0
83.0
82.1
37**
.150
**
i1
nb
07
.188
**.2
03**
.167
**.1
08*
.106
*.0
96*
.091
.120
*
i1
nb
08
.092
*.1
79**
.120
**.1
37**
.150
**.1
58**
.144
**.1
39**
i1
nb
09
.137
**.1
35**
.105
*.0
38.0
43.0
27.0
32.0
63
i2
pi0
1.0
88.1
90**
.243
**.1
48**
.167
**.1
57**
.157
**.1
51**
i2
pi0
2.1
13*
.193
**.2
03**
.148
**.1
77**
.189
**.1
85**
.177
**
i2
pi0
3.1
03*
.134
**.1
81**
.088
.139
**.1
49**
.089
.110
*
i2
pi0
4.1
22**
.164
**.2
17**
.148
**.1
68**
.197
**.1
39**
.139
**
i2
pi0
5.1
03*
.144
**.1
97**
.153
**.1
66**
.146
**.1
32**
.132
**
i2
pi0
6.3
01**
.340
**.3
12**
.215
**.2
35**
.216
**.1
51**
.175
**
i2
pi0
7.2
09**
.242
**.2
77**
.270
**.2
63**
.240
**.1
04*
.147
**
i2
pi0
8.1
75**
.209
**.2
53**
.238
**.2
61**
.260
**.1
37**
.194
**
no
te
s*
Cor
rela
tion
issi
gnifi
can
tat
the
.05
leve
l(2-
tail
ed).
**C
orre
lati
onis
sign
ifica
nt
atth
e.0
1le
vel(
2-ta
iled
).
pe
rf
or
ma
nc
eit
em
sp
1g
r0
1–
aver
age
ann
ual
grow
thin
nu
mb
erof
emp
loye
esin
last
thre
eye
ars;
p1
gr
02
–av
erag
ean
nu
algr
owth
insa
les
inla
stth
ree
year
s;p
1g
r0
3–
grow
thin
mar
ket
shar
ein
last
thre
eye
ars;
p2
pr
01
–av
erag
ean
nu
alre
turn
onsa
les
inla
stth
ree
year
s;p
2p
r0
2–
aver
age
ann
ual
retu
rnon
asse
tsin
last
thre
eye
ars;
p2
pr
03
–av
erag
ean
nu
alre
turn
oneq
uit
yin
last
thre
eye
ars;
p2
pr
04
–p
rofi
tab
ilit
yof
you
rco
mp
any
inla
stth
ree
year
sin
com
par
ison
toal
lco
mp
etit
ors
that
you
are
awar
eof
;p2
pr
05
–p
rofi
tab
ilit
yof
you
rco
mp
any
inla
stth
ree
year
sin
com
par
ison
toco
mp
etit
ors
atab
out
sam
eag
ean
dst
age
ofd
evel
opm
ent.
26 management · volume 3

Corporate Entrepreneurship Performance
ta
bl
e3
Pea
rson
corr
elat
ion
coef
fici
ents
bet
wee
nco
rpor
ate
entr
epre
neu
rsh
ipan
dp
erfo
rman
ceit
ems:
Rom
ania
Cod
eP
erfo
rman
ceit
ems
p1
gr
01
p1
gr
02
p1
gr
03
p2
pr
01
p2
pr
02
p2
pr
03
p2
pr
04
p2
pr
05
i1
nb
01
.272
.212
.404
*.2
60.2
21.2
56.0
51.1
19
i1
nb
02
.470
**.4
13*
.600
**.4
30*
.579
**.5
78**
.350
.407
*
i1
nb
03
.471
**.3
51.4
53*
.253
.177
.232
–.05
7.1
58
i1
nb
04
.177
.529
**.4
06*
.265
.294
.291
.163
.258
i1
nb
05
.021
.343
.378
*.3
61*
.304
.311
.195
.305
i1
nb
06
.091
.267
.137
.158
–.03
3–.
032
.296
.405
*
i1
nb
07
–.12
6.0
39–.
104
.142
–.01
6–.
018
.270
.145
i1
nb
08
.089
–.13
9–.
064
.014
–.12
6–.
140
–.03
1–.
182
i1
nb
09
.024
–.04
8–.
026
.037
.062
.062
–.07
8–.
024
i2
pi0
1.0
97.2
90.3
84*
.250
.231
.171
.369
*.3
40
i2
pi0
2.1
38.1
85.3
48.3
47.3
12.2
84.5
25**
.530
**
i2
pi0
3.2
58.3
36.4
13*
.183
.138
.113
.317
.411
*
i2
pi0
4.1
21.2
80.3
60.4
18*
.257
.229
.245
.308
i2
pi0
5.3
79*
.321
.475
**.4
15*
.388
*.3
53.3
10.4
04*
i2
pi0
6.6
21**
.643
**.6
64**
.540
**.5
91**
.590
**.1
98.3
79*
i2
pi0
7.2
69.1
57.4
60*
.336
.352
.360
.388
*.4
36*
i2
pi0
8.3
68*
.407
*.5
17**
.343
.285
.243
.198
.316
no
te
s*
Cor
rela
tion
issi
gnifi
can
tat
the
.05
leve
l(2-
tail
ed).
**C
orre
lati
onis
sign
ifica
nt
atth
e.0
1le
vel(
2-ta
iled
).
pe
rf
or
ma
nc
eit
em
sp
1g
r0
1–
aver
age
ann
ual
grow
thin
nu
mb
erof
emp
loye
esin
last
thre
eye
ars;
p1
gr
02
–av
erag
ean
nu
algr
owth
insa
les
inla
stth
ree
year
s;p
1g
r0
3–
grow
thin
mar
ket
shar
ein
last
thre
eye
ars;
p2
pr
01
–av
erag
ean
nu
alre
turn
onsa
les
inla
stth
ree
year
s;p
2p
r0
2–
aver
age
ann
ual
retu
rnon
asse
tsin
last
thre
eye
ars;
p2
pr
03
–av
erag
ean
nu
alre
turn
oneq
uit
yin
last
thre
eye
ars;
p2
pr
04
–p
rofi
tab
ilit
yof
you
rco
mp
any
inla
stth
ree
year
sin
com
par
ison
toal
lco
mp
etit
ors
that
you
are
awar
eof
;p2
pr
05
–p
rofi
tab
ilit
yof
you
rco
mp
any
inla
stth
ree
year
sin
com
par
ison
toco
mp
etit
ors
atab
out
sam
eag
ean
dst
age
ofd
evel
opm
ent.
number 1 · spring 2008 27

Boštjan Antoncic and Cezar Scarlat
ta
bl
e4
Pea
rson
corr
elat
ion
coef
fici
ents
bet
wee
nal
lian
cean
dn
ewb
usi
nes
ses/
ven
ture
sit
ems:
Slo
ven
ia
Cod
ei1
nb
01
i1
nb
02
i1
nb
03
i1
nb
04
i1
nb
05
i1
nb
06
i1
nb
07
i1
nb
08
i1
nb
09
n1
co
01
–.17
8**
–.11
6*–.
010
–.12
2**
–.08
1–.
064
.014
.000
.045
n1
co
02
–.16
6**
–.10
6*–.
058
–.11
5*–.
098*
–.05
6.0
15.0
24.0
36
n1
co
03
–.10
9*–.
065
–.06
7–.
064
–.05
5–.
061
.019
.041
.046
n1
co
04
–.04
7.0
03–.
007
–.04
0–.
093*
–.04
0.0
07–.
011
.031
n1
co
05
–.10
4*–.
040
–.01
0–.
042
–.00
9–.
014
.059
.029
.110
*
n1
co
06
–.16
1**
–.11
8*–.
033
–.12
5**
–.04
7–.
026
.045
.064
.101
*
n1
co
07
–.13
7**
–.06
3–.
038
–.09
8*–.
034
–.07
1.0
17.0
38.0
43
n2
tr
01
.143
**.1
74**
.116
*.1
94**
.179
**.1
05*
.030
.094
*.0
29
n2
tr
02
–.06
3–.
048
–.01
4–.
014
–.12
0*–.
073
.000
.030
.116
*
n2
tr
03
.119
*.1
31**
.029
.104
*.1
73**
.154
**.1
18*
.076
–.00
1
n2
tr
04
.098
*.0
70.0
40.0
45.0
91.0
83.1
12*
.120
**–.
009
n2
tr
05
.156
**.1
28**
.036
.024
.072
.065
.025
.126
**.0
09
n2
tr
06
.006
–.00
7–.
028
.032
–.03
1.0
29.0
36.0
09.0
37
n3
es
01
.184
**.1
94**
.132
**.1
50**
.090
.181
**.1
37**
.101
*.0
51
n3
es
02
.220
**.1
97**
.192
**.2
12**
.175
**.1
60**
.136
**.0
78.0
58
n3
es
03
.032
.003
.025
.039
–.02
7.1
05*
.169
**.1
18*
.126
**
n3
es
04
–.00
9–.
109*
–.07
8–.
082
–.08
1–.
053
–.00
3–.
030
.036
n4
vc
01
.134
**.2
03**
.161
**.2
48**
.145
**.0
45.0
12.0
74.0
26
n4
vc
02
.215
**.2
19**
.093
.097
.089
.130
*.1
62**
.245
**.1
68**
n4
vc
03
.206
**.2
05**
.121
*.1
06*
.154
**.1
72**
.161
**.2
30**
.094
n4
vc
04
.205
**.2
58**
.136
**.1
24*
.165
**.1
73**
.120
*.2
07**
.075
n4
vc
05
.202
**.2
01**
.055
.106
*.1
06*
.212
**.1
39**
.278
**.1
35**
n5
de
01
.177
**.1
88**
.227
**.1
43**
.157
**.1
57**
.127
**.1
06*
.122
**
n5
de
02
.151
**.1
41**
.212
**.1
38**
.193
**.1
18*
.146
**.0
65.1
00*
28 management · volume 3

Corporate Entrepreneurship Performance
n5
de
03
.137
**.1
07*
.064
.039
.107
*.1
46**
.187
**.1
80**
.224
**
n5
de
04
.136
**.1
63**
.142
**.1
48**
.144
**.1
85**
.179
**.1
25**
.100
*
n5
de
05
.123
**.1
90**
.146
**.1
03*
.151
**.1
48**
.171
**.1
63**
.148
**
n5
de
06
.096
*.0
96*
.054
.042
.083
.191
**.1
90**
.258
**.1
87**
no
te
s*
Cor
rela
tion
issi
gnifi
can
tat
the
.05
leve
l(2-
tail
ed).
**C
orre
lati
onis
sign
ifica
nt
atth
e.0
1le
vel(
2-ta
iled
).
ta
bl
e5
Pea
rson
corr
elat
ion
coef
fici
ents
bet
wee
nal
lian
cean
dp
rod
uct
/ser
vice
inn
ovat
ion
item
s:S
love
nia
Cod
ei2
pi0
1i2
pi0
2i2
pi0
3i2
pi0
4i2
pi0
5i2
pi0
6i2
pi0
7i2
pi0
8
n1
co
01
–.15
5**
–.12
3**
–.12
0**
–.11
6*–.
088
–.07
5–.
148*
*–.
167*
*
n1
co
02
–.14
2**
–.10
6*–.
131*
*–.
115*
–.06
4–.
090
–.09
7*–.
173*
*
n1
co
03
–.07
3–.
083
–.12
6**
–.06
5–.
055
–.03
4–.
028
–.10
2*
n1
co
04
–.10
9*–.
066
–.16
1**
–.07
4–.
098*
–.02
4–.
059
–.16
9**
n1
co
05
–.06
6–.
070
–.13
4**
–.10
6*–.
076
.026
–.05
4–.
100*
n1
co
06
–.10
7*–.
147*
*–.
149*
*–.
116*
–.10
1*–.
060
–.08
5–.
118*
n1
co
07
–.11
1*–.
124*
*–.
234*
*–.
117*
–.16
6**
–.05
0–.
089
–.13
4**
n2
tr
01
.155
**.1
95**
.099
*.1
38**
.104
*.1
63**
.216
**.2
60**
n2
tr
02
–.13
1**
–.14
8**
–.15
1**
–.18
0**
–.12
7**
–.16
4**
–.10
0*–.
114*
n2
tr
03
.178
**.1
66**
.127
**.1
28**
.078
.161
**.1
44**
.184
**
n2
tr
04
.039
.114
*.0
74.0
60.0
77.0
26.0
89.1
04*
n2
tr
05
.117
*.1
62**
.052
.124
**.1
19*
.146
**.1
52**
.139
**
n2
tr
06
–.06
2–.
071
–.07
5–.
074
–.08
0–.
060
–.07
3–.
090
n3
es
01
.183
**.1
23**
.163
**.1
24**
.107
*.1
01*
.162
**.2
07**
n3
es
02
.182
**.1
17*
.199
**.1
12*
.134
**.1
69**
.125
**.2
18**
n3
es
03
.025
–.02
0.0
53–.
025
.019
.020
.043
.087
Con
tinu
edon
the
follo
win
gp
age
number 1 · spring 2008 29

Boštjan Antoncic and Cezar Scarlat
Con
tinu
edfr
omth
ep
revi
ous
pag
e
n4
vc
01
.186
**.2
00**
.245
**.1
95**
.116
*.1
72**
.214
**.2
17**
n4
vc
02
.045
.100
.109
*.1
53**
.213
**.1
24*
.163
**.1
01
n4
vc
03
.161
**.1
08*
.197
**.1
59**
.221
**.1
39**
.213
**.1
36**
n4
vc
04
.185
**.1
19*
.237
**.1
46**
.260
**.1
41**
.152
**.2
32**
n4
vc
05
.138
**.0
84.1
90**
.136
**.2
47**
.121
*.1
43**
.127
*
n5
de
01
.216
**.2
19**
.183
**.1
69**
.168
**.1
45**
.157
**.2
24**
n5
de
02
.158
**.2
04**
.120
*.1
18*
.178
**.1
81**
.174
**.2
31**
n5
de
03
–.00
5.0
62.0
36.0
15.1
25**
.202
**.1
38**
.114
*
n5
de
04
.159
**.1
23**
.135
**.1
30**
.164
**.1
78**
.182
**.1
72**
n5
de
05
.158
**.1
63**
.162
**.1
60**
.218
**.2
12**
.168
**.2
18**
n5
de
06
.022
.014
.052
.030
.125
**.1
56**
.062
.081
no
te
s*
Cor
rela
tion
issi
gnifi
can
tat
the
.05
leve
l(2-
tail
ed).
**C
orre
lati
onis
sign
ifica
nt
atth
e.0
1le
vel(
2-ta
iled
).
ta
bl
e6
Pea
rson
corr
elat
ion
coef
fici
ents
bet
wee
nal
lian
cean
dn
ewb
usi
nes
ses/
ven
ture
sit
ems:
Rom
ania
Cod
ei1
nb
01
i1
nb
02
i1
nb
03
i1
nb
04
i1
nb
05
i1
nb
06
i1
nb
07
i1
nb
08
i1
nb
09
n1
co
01
.016
.214
.184
–.05
9.2
36.0
75.1
37.1
25.4
80*
n1
co
02
.073
.198
.424
*.0
72.2
30.1
12.1
98.1
03.4
67*
n1
co
03
–.00
8.0
72.2
73–.
019
.137
.086
.277
.112
.532
**
n1
co
04
.034
.264
.364
–.09
3.1
20–.
009
.170
–.00
5.3
80
n1
co
05
.104
.410
*.3
55.0
08.3
07.0
90.2
36.0
31.4
17*
n1
co
06
.041
.283
.180
–.00
8.2
88.0
72.2
38.0
46.4
25*
n1
co
07
.140
.439
*.3
26.0
39.3
80.2
69.3
17.0
83.4
09*
n2
tr
01
–.08
1.0
37.0
07–.
044
.374
.132
.080
.266
–.05
8
n2
tr
02
–.27
9–.
032
.098
–.08
7.2
23.1
09.2
21.0
76.2
67
n2
tr
03
.076
–.27
2.1
93.0
82–.
001
.092
–.20
9.0
62.0
41
n2
tr
04
.135
–.06
4.0
78–.
063
–.06
5–.
124
–.26
2–.
118
.279
30 management · volume 3

Corporate Entrepreneurship Performancen
2t
r0
5–.
025
–.44
1*.0
24.0
00–.
207
.046
–.08
0.0
65.0
00
n2
tr
06
–.29
6–.
030
.234
.212
.455
*.1
81.1
12.1
16.2
63
n3
es
01
.140
.154
.329
.237
.218
.292
.179
.302
.385
*
n3
es
02
.065
.201
.435
*.0
41.1
73.0
42–.
141
.362
*.1
50
n3
es
03
.090
–.16
0.0
07.0
22–.
274
–.28
9–.
027
–.18
0.0
00
n3
es
04
–.01
6–.
333
–.15
1–.
226
–.36
7–.
043
.000
–.01
8.0
12
n4
vc
01
–.04
1–.
211
.123
.274
.244
.242
.255
.113
.152
n4
vc
02
.086
.053
–.60
7*–.
461
–.34
5–.
228
.489
–.29
8–.
404
n4
vc
03
–.15
7.1
24–.
440
.135
.355
.000
–.02
2.0
17–.
058
n4
vc
04
–.06
4–.
290
.000
–.09
7–.
329
–.11
6–.
271
.212
.374
n4
vc
05
–.37
8–.
258
–.10
3.0
86–.
775
–.61
4–.
405
–.93
9–.
775
n5
de
01
.299
.155
.453
*.0
95–.
029
–.01
8–.
188
–.08
4.0
34
n5
de
02
.260
–.00
1.3
56.0
78–.
128
–.06
4–.
170
–.04
3.1
02
n5
de
03
.104
.065
.323
–.03
2.2
65.1
95–.
083
–.07
7.0
75
n5
de
04
.158
.165
.336
–.08
3.1
26.0
75–.
110
–.15
7.0
43
n5
de
05
.095
–.09
5.4
04*
.028
.130
.071
–.12
1.0
51.0
95
n5
de
06
.130
.296
.099
–.01
9–.
013
–.05
0.1
15.0
07.0
00
no
te
s*
Cor
rela
tion
issi
gnifi
can
tat
the
.05
leve
l(2-
tail
ed).
**C
orre
lati
onis
sign
ifica
nt
atth
e.0
1le
vel(
2-ta
iled
).
ta
bl
e7
Pea
rson
corr
elat
ion
coef
fici
ents
bet
wee
nal
lian
cean
dp
rod
uct
/ser
vice
inn
ovat
ion
item
s:R
oman
ia
Cod
ei2
pi0
1i2
pi0
2i2
pi0
3i2
pi0
4i2
pi0
5i2
pi0
6i2
pi0
7i2
pi0
8
n1
co
01
.385
.059
.257
.136
.281
.128
.210
.230
n1
co
02
.432
*-.
060
.354
.171
.114
.161
.124
.330
n1
co
03
.416
*.0
07.3
36.2
26.0
84.2
16.1
04.2
61
n1
co
04
.535
**.2
20.3
72.3
78.2
48.3
17.2
35.2
23
Con
tinu
edon
the
follo
win
gp
age
number 1 · spring 2008 31
Boštjan Antoncic and Cezar Scarlat
Con
tinu
edfr
omth
ep
revi
ous
pag
e
n1
co
05
.555
**.2
29.4
33*
.430
*.4
30*
.357
.413
*.4
08*
n1
co
06
.573
**.2
66.4
49*
.311
.299
.145
.085
.131
n1
co
07
.415
*.1
28.3
93*
.204
.333
.415
*.2
28.4
33*
n2
tr
01
.133
–.14
2.0
00.2
33.2
78.1
72.2
30.3
88*
n2
tr
02
.218
–.30
0.0
31.0
08–.
036
–.02
3–.
192
.007
n2
tr
03
.009
.031
–.12
5.0
44–.
091
–.06
6.0
01.0
19
n2
tr
04
–.10
0.0
61–.
188
–.15
8–.
176
.000
.000
–.18
8
n2
tr
05
–.27
6–.
306
–.37
3–.
169
–.40
4*–.
214
–.20
4–.
259
n2
tr
06
.322
–.14
7.1
73.0
26.0
73–.
001
–.14
6.3
28
n3
es
01
.501
**.4
64**
.422
*.4
22*
.410
*.4
07*
.507
**.5
13**
n3
es
02
.478
**.2
26.4
66**
.363
*.3
43.2
82.4
06*
.586
**
n3
es
03
–.21
6–.
141
–.08
1–.
149
–.35
0–.
073
–.28
2–.
368*
n3
es
04
–.11
8–.
185
.067
.057
–.23
6–.
261
–.21
3–.
189
n4
vc
01
.085
–.02
7.0
42.1
83.0
35.0
13.1
45.1
60
n4
vc
02
–.45
9–.
086
–.14
1–.
076
–.03
8.0
73–.
045
–.31
0
n4
vc
03
.251
.249
.466
.131
.433
.280
–.06
5.2
56
n4
vc
04
–.35
4–.
267
–.42
0–.
603*
–.41
2–.
297
–.40
8–.
374
n4
vc
05
–.31
6.8
94–.
674
–.31
6–.
800
.000
–.75
6–.
602
n5
de
01
.025
.178
–.14
6.0
91.0
62.4
20*
.352
.188
n5
de
02
–.09
7.0
94–.
246
–.04
9–.
075
.310
.238
.018
n5
de
03
.182
.086
.100
.270
.141
.221
.358
.280
n5
de
04
.335
.218
.204
.382
*.1
75.2
57.3
20.2
37
n5
de
05
.260
–.02
8.0
79.3
04.0
81.1
04.2
88.3
96*
n5
de
06
.260
.160
.225
.248
.098
.273
–.07
3.2
07
no
te
s*
Cor
rela
tion
issi
gnifi
can
tat
the
.05
leve
l(2-
tail
ed).
**C
orre
lati
onis
sign
ifica
nt
atth
e.0
1le
vel(
2-ta
iled
).
32 management · volume 3

Corporate Entrepreneurship Performance
0 out of 12, 0%; product/service innovation – 11 out of 24, 46%. Sig-nificant correlations to profitability in Slovenia were found as fol-lows: new businesses – 5 out of 25, 20%; new ventures – 1 out of20, 5%; product/service innovation – 15 out of 40, 37%. These find-ings are not in support of Hypothesis 2b. New businesses and prod-uct/service innovation can be considered important for growth, andproduct/service innovation can be important for profitability in Ro-mania.
alliance–corporate entrepreneurship relationships
Hypothesis 3 predicted that the extent of alliance elements (com-munication, trust, support, value congruence, number of alliances)would be positively related to corporate entrepreneurship. Correla-tions for the Slovenian sample are shown in tables 4 and 5. Signif-icant correlations in the proposed direction were found as follows:for the alliance–new businesses relationship – 15 out of 35 (43%) foralliance communication items, 13 out of 30 (43%) for alliance trustitems, 9 out of 20 (45%) for alliance support items, 21 out of 25 (84%)for value congruence items, 25 out of 30 (83%) for alliance numberitems; for the alliance–new ventures relationship – 2 out of 28 (7%)for alliance communication items, 8 out of 24 (33%) for alliance trustitems, 9 out of 16 (56%) for alliance support items, 14 out of 20 (70%)for value congruence items, 23 out of 24 (96%) for alliance numberitems; for the alliance–product/service innovation relationship – 33out of 56 (59%) for alliance communication items, 31 out of 48 (65%)for alliance trust items, 24 out of 32 (75%) for alliance support items,21 out of 25 (84%) for shared values items, 38 out of 48 (79%) foralliance number items.
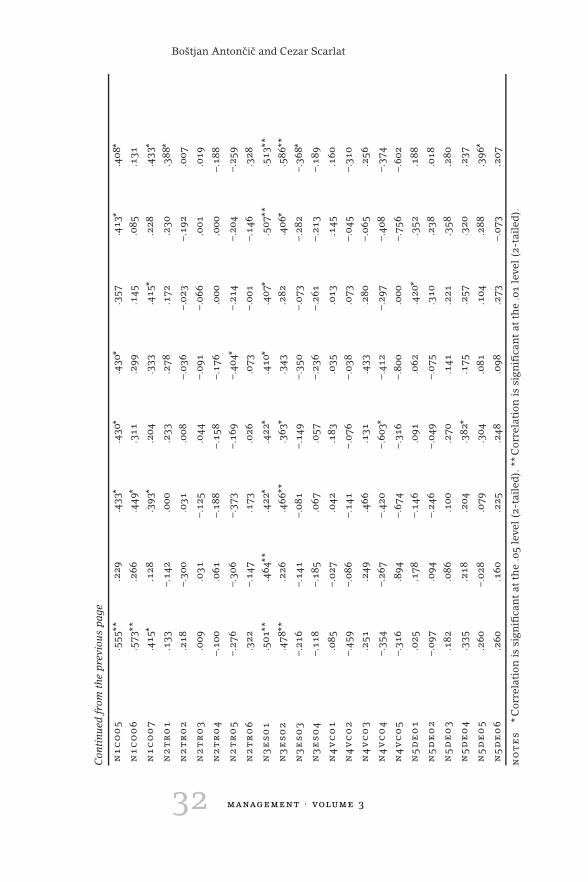
Correlations for the Romanian sample are shown in tables 6 and7. Significant correlations in the proposed direction were found asfollows: for the alliance–new businesses relationship – 0 out of 35(0%) for alliance communication items, 0 out of 30 (0%) for alliancetrust items, 1 out of 20 (5%) for alliance support items, 0 out of 25(0%) for value congruence items, 2 out of 30 (7%) for alliance numberitems; for the alliance–new ventures relationship – 0 out of 28 (0%)for alliance communication items, 0 out of 24 (0%) for alliance trustitems, 2 out of 16 (12%) for alliance support items, 0 out of 20 (0%)for shared values items, 0 out of 24 (0%) for alliance number items;for the alliance–product/service innovation relationship – 0 out of 56(0%) for alliance communication items, 1 out of 48 (2%) for alliancetrust items, 12 out of 32 (75%) for alliance support items, 0 out of25 (0%) for shared values items, 3 out of 48 (6%) for alliance number
number 1 · spring 2008 33

Boštjan Antoncic and Cezar Scarlat
items. The results based on the Romanian sample should be inferredwith caution because of the low number of responses.
Overall, Hypothesis 3 did not receive enough support. Some find-ings were supportive only for Slovenia, particularly between al-liances (value congruence and number) and new businesses, be-tween alliances (support, value congruence, and number) and newventures, and between alliances (communication, trust, support,value congruence, and number) and product/service innovation.
Discussion and Conclusion
This study provided some new evidence on the relationship betweencorporate entrepreneurship and performance, as well as alliancecharacteristics and corporate entrepreneurship in two countries –Slovenia and Romania. The analysis indicated very minor differ-ences in corporate entrepreneurship and alliance item means be-tween the two countries. This similarity in levels of corporate en-trepreneurship and alliance characteristics may be due to the factthat the transition to the market-based economy has followed sim-ilar paths in past the two decades (democracy, private ownership,competition, efforts to join the eu, etc.). Even though the overallhypothesis on the relationship between corporate entrepreneurshipreceived mixed support, we are confident that recommendations forSlovenia from past research (Antoncic and Hisrich 2000; Douglas etal. 2003) can be equally or even more relevant for Romania: increasecorporate entrepreneurship in order to increase firm performancein terms of growth and profitability.
We discovered that in Slovenia innovation in products and ser-vices represents a driving force for improvements in growth andprofitability of firms, with the addition that new venture formationcan be also important for growth. In Romania, on the other hand,new businesses and product/service innovation can be very impor-tant for growth of firms, while product/service innovation can be re-lated to profitability. Therefore, innovation in products and servicescan be considered a crucial element in the performance of firms andconsequently in the economic growth of the two countries. Devel-opment of an innovation friendly environment should become a toppriority of practitioners and policy makers in Slovenia and Romania,and probably also in other countries that have followed similar pathsof economic development.
The study provided also some insights on the relationship betweenalliance characteristics and corporate entrepreneurship. On the ba-sis of the findings for Slovenia, we can claim that firms can achieve
34 management · volume 3

Corporate Entrepreneurship Performance
beneficial results in their product and service innovation activitiesby taking good care of their strategic alliance relationships, whichincludes: developing a good communication with alliance partners;developing trust between partners; supporting collaboration activi-ties with appropriate encouragements, commitments, structures, andrewards; developing value congruence between partners; and enter-ing a higher number of strategic alliances.
The study has some limitations. Measures were based on percep-tions of managers. The Romanian sample was small, so only limitedanalysis techniques could be used and the results based on the Ro-manian sample need to be inferred with caution. The study was lim-ited to item by item correlation analysis that resulted in rather smallcorrelation coefficients. Testing relationships between constructs byusing structural equation modelling would provide better results.The study was conducted in two countries; future research may fur-ther validate the results of this study in other countries. Despite thelimitations, we believe we have provided some interesting evidenceon the relationship between corporate entrepreneurship and perfor-mance and on the relationship between alliance characteristics andcorporate entrepreneurship.
References
Antoncic, B. 1999. Entrepreneurship networks: A review and future re-search directions. Slovenian Economic Review 50 (3): 195–221.
. 2001. Organizational processes in intrapreneurship: A concept-ual integration. Journal of Enterprising Culture 9 (2): 221–235.
Antoncic, B., and R. D. Hisrich. 2000. Intrapreneurship modeling intransition economies: A comparison of Slovenia and the UnitedStates. Journal of Developmental Entrepreneurship 5 (1): 21–40.
. 2001. Intrapreneurship: Construct refinement and cross-culturalvalidation. Journal of Business Venturing 16 (5): 495–527.
. 2003. Clarifying the intrapreneurship concept. Journal of SmallBusiness and Enterprise Development 10 (1): 7–24.
. 2004. Corporate entrepreneurship contingencies and organiza-tional wealth creation. Journal of Management Development 23 (6):518–550.
Antoncic, B., and O. Zorn. 2004. The mediating role of corporate en-trepreneurship in the organizational support-performance relation-ship: An empirical examination. Managing Global Transitions 2 (1):5–14.
Badguerahanian, L., and P. A. Abetti. 1995. The rise and fall of theMerin-Gerin Foundry business: A case study in French corporateentrepreneurship. Journal of Business Venturing 10 (6): 477–493.
number 1 · spring 2008 35

Boštjan Antoncic and Cezar Scarlat
Burgelman, R. A., and R. S. Rosenbloom. 1997. Technology strategy: Anevolutionary process perspective. In Managing strategic innovationand change: A collection of readings, ed. M. L. Tushman and P. An-derson, 273–286. New York: Oxford University Press.
Chandler, G. N., and S. H. Hanks. 1993. Measuring the performance ofemerging businesses: A validation study. Journal of Business Ventur-ing 8 (5): 391–408.
Covin, J. G. 1991. Entrepreneurial vs. conservative firms: A comparisonof strategies and performance. Journal of Management Studies 25 (5):439–462.
Covin, J. G., and D. P. Slevin. 1986. The development and testing ofan organizational-level entrepreneurship scale. In Frontiers of en-trepreneurship research 1986, ed. R. Ronstadt, R. Peterson, and K.Vasper, 628–639. Wellesley, ma: Babson College.
. 1991. A conceptual model of entrepreneurship as firm behavior.Entrepreneurship Theory and Practice 16 (1): 7–25.
Damanpour, F. 1996. Organizational complexity and innovation: Devel-oping and testing multiple contingency models. Management Science42 (5): 693–716.
Das, T. K., and B. Teng. 1998. Between trust and control: Developingconfidence in partner cooperation in alliances. Academy of Manage-ment Review 23 (3): 491–512.
Deeds, D. L., and C. W. L. Hill. 1996. Strategic alliances and the rateof new product development: An empirical study of entrepreneurialbiotechnology firms. Journal of Business Venturing 11 (1): 41–55.
. 1998. An examination of opportunistic action within research al-liances: Evidence from the biotechnology industry. Journal of Busi-ness Venturing 14 (2): 141–163.
Douglas, E. J., B. Antoncic, R. D. Hisrich, and T. A. McLaughlin. 2003.Intrapreneurship in Australian, us, and Slovenian firms. Paper pre-sented at Babson College/Kauffman Foundation Research Confer-ence, Wellesley, ma.
Hills, G., and R. LaForge. 1992. Research at the marketing interfaceto advance entrepreneurship theory. Entrepreneurship: Theory andPractice, 16 (3): 33–59.
Hisrich, R. D., and M. P. Peters. 1984. Internal venturing in large cor-porations. In Frontiers of Entrepreneurship Research 1984, ed. J. A.Hornaday, F. A. Tarpley, jr., J. A. Timmons, and K. H. Vesper, 321–346. Wellesley, ma: Babson College.
Jones, C., W. S. Hesterly, and S. P. Borgatti. 1997. A general theory ofnetwork governance: Exchange conditions and social mechanisms.Academy of Management Review 22 (4): 911–945.
Kale, P., H. Singh, and H. Perlmutter. 2000. Learning and protection ofproprietary assets in strategic alliances: Building relational capital.Strategic Management Journal 21(3): 217–237.
36 management · volume 3

Corporate Entrepreneurship Performance
Kanter, R. M. 1984. The change masters. New York: Simon and Schuster.
Kanter, R. M., and L. Richardson. 1991. Engines of progress: Design-ing and running entrepreneurial vehicles in established companies– The Enter-Prize Program at Ohio Bell, 1985–1990. Journal of Busi-ness Venturing 6 (3): 209–229.
Khandwalla, P. N. 1987. Generators of pioneering-innovative manage-ment: Some Indian evidence. Organization Studies 8 (1): 39–59.
Knight, G. A. 1997. Cross-cultural reliability and validity of a scale tomeasure firm entrepreneurial orientation. Journal of Business Ven-turing 12 (3): 213–225.
Luchsinger, V., and D. R. Bagby. 1987. Entrepreneurship and intraprene-urship. sam Advanced Management Journal 52 (3): 10–13.
MacMillan, I. C., Z. Block, and P. N. S. Narasimha. 1984. Obstacles andexperience in corporate ventures. In Frontiers of EntrepreneurshipResearch 1984, ed. J. A. Hornaday, F. A. Tarpley, jr., J. A. Timmons,and K. H. Vesper, 280–293. Wellesley, ma: Babson College.
Miller, D. 1983. The correlates of entrepreneurship in three types offirms. Management Science 29:770–791.
Mohr, J., and R. Spekman. 1994. Characteristics of partnership success:Partnership attributes, communication behavior, and conflict reso-lution techniques. Strategic Management Journal 15 (2): 135–152.
Morris, M. H., and D. L. Sexton. 1996. The concept of entrepreneurial in-tensity: Implications for company performance. Journal of BusinessResearch 36 (1): 5–13.
Mowery, D. C., J. E. Oxley, and B. S. Silverman. 1996. Strategic alliancesand interfirm knowledge transfer. Special issue, Strategic Manage-ment Journal 17:77–91.
Parkhe, A. 1991. Interfirm diversity, organizational learning, and longev-ity in global strategic alliances. Journal of International BusinessStudies 22 (4): 579–601.
Parkhe, A. 1993. Strategic alliance structuring: A game theoretic andtransaction cost examination of interfirm cooperation. Academy ofManagement Journal 36 (4): 794–829.
Peters, T. J., and R. H. Waterman. 1982. In search of excellence. New York:Harper and Row.
Pinchot, G. III. 1985. Intrapreneuring. New York: Harper and Row.
Porter, L., R. Steers, R. Mowday, P. and Boulian. 1974. Organizationalcommitment, job satisfaction, and turnover among psychiatric tech-nicians. Journal of Applied Psychology 59:603–609.
Powell, W. W., K. W. Koput, and L. Smith-Doerr. 1996. Interorganiza-tional collaboration and the locus of innovation: Networks of learn-ing in biotechnology. Administrative Science Quarterly 41 (1): 116–145.
Pruitt, D. G. 1981. Negotiation behavior. New York: Academic Press.
number 1 · spring 2008 37

Boštjan Antoncic and Cezar Scarlat
Rule, E. G., and D. W. Irwin. 1988. Fostering intrapreneurship: The newcompetitive edge. Journal of Business Strategy 9 (3): 44–47.
Saxenian, A. 1991. The origins and dynamics of production networks inSillicon Valley. Research Policy 20 (5): 423–437.
Schollhammer, H. 1981. The efficacy of internal corporate entrepreneur-ship strategies. In Frontiers of Entrepreneurship Research 1981, ed.K. H. Vesper, 451–456. Wellesley, ma: Babson College.
. 1982. Internal corporate entrepreneurship. In Encyclopedia ofEntrepreneurship, ed. C. A. Kent, D. L. Sexton, and K. H. Vesper,209–229. Englewood Cliffs, nj: Prentice-Hall.
Sharma, P., and J. J. Chrisman. 1999. Toward a reconciliation of thedefinitional issues in the field of corporate entrepreneurship. En-trepreneurship Theory and Practice 23 (3): 11–27.
Souder, W. E. 1981. Encouraging entrepreneurship in the large corpo-rations. Research Management 14 (3): 18–22.
Stetz, P. E., A. Stewart, R. Howell, J. D. Blair, and M. D. Fottler. 1998. Di-mensionality of the entrepreneurial posture/orientation construct:A structural equation study. Paper presented at the 1998 AnnualAcademy of Management Meeting, San Diego, ca.
Stopford, J. M., and C. W. F. Baden-Fuller. 1994. Creating corporate en-trepreneurship. Strategic Management Journal 15 (7): 521–536.
Tushman, M. L., and P. Anderson, P., eds. 1997. Managing strategic in-novation and change: A collection of readings. New York: Oxford Uni-versity Press.
Uzzi, B. 1997. Social structure and competition in interfirm networks:The paradox of embeddedness. Administrative Science Quarterly 42(1): 35–67.
Vesper, K. H. 1984. Three faces of corporate entrepreneurship. In Fron-tiers of Entrepreneurship Research 1984, ed. J. A. Hornaday, F. A.Tarpley, jr., J. A. Timmons, and K. H. Vesper, 294–320. Wellesley, ma:Babson College.
Weaver, K. M., and P. H. Dickson. 1998. Outcome quality of small- tomedium-sized enterprise-based alliances: The role of perceivedpartner behaviors. Journal of Business Venturing 13 (6): 505–522.
Zahra, S. A. 1991. Predictors and financial outcomes of corporate en-trepreneurship: An exploratory study. Journal of Business Venturing6 (4): 259–285.
. 1993. Environment, corporate entrepreneurship, and financialperformance: A taxonomic approach. Journal of Business Venturing8 (4): 319–340.
Zahra, S. A., and J. G. Covin. 1995. Contextual influences on the cor-porate entrepreneurship–performance relationship: A longitudinalanalysis. Journal of Business Venturing 10 (1): 43–58.
38 management · volume 3
Top Related