


Languages
Pages
Legal


Copyright © First Pacific Company Limited 28 March 2017. All rights reserved.

This presentation is provided for information purposes only. It does not constitute an offer or invitation to purchase or subscribe for any securities of First Pacific or any of its subsidiaries or investee companies, and no part of this presentation shall form the basis of or be relied upon in connection with any contract or commitment. Certain statements contained in this presentation may be statements of future expectations and other forward-looking statements that are based on third party sources and involve known and unknown risks and uncertainties. Forward-looking statements contained in this presentation regarding past trends or activities should not be taken as a representation that such trends or activities will continue in the future. There is no obligation to update or revise any forward-looking statements, whether as a result of new information, future events or otherwise. You should not place undue reliance on forward-looking statements, which speak only as of the date of this presentation. The dollar sign (“$”) is used throughout this presentation to represent U.S. dollars except where otherwise indicated.
2

Manuel V. Pangilinan Managing Director and CEO
Robert C. Nicholson
Executive Director
Joseph H.P. Ng
Exec. Vice President,
Group Finance
Edward A. Tortorici
Executive Director
John W. Ryan
Exec. Vice President,
Investor Relations
Ray C. Espinosa
Associate Director
Stanley H. Yang
Exec. Vice President,
Corp. Development
Chris H. Young
Chief Financial Officer
Victorico P. Vargas
Assistant Director
Marilyn A.
Victorio-Aquino
Assistant Director
3

Natural Resources
First Pacific owns 31.2% of Philex and Two Rivers, a Philippine affiliate, holds 15.0%. First Pacific holds an effective economic interest of 41.6% in Philex Petroleum, 31.4% in IndoAgri, and 47.4% in Roxas Holdings.
Infrastructure
First Pacific owns 42.0% of MPIC and holds economic interests of 19.5% in Meralco, 23.9% in Global Business Power, 47.5% of PacificLight, 22.2% of Maynilad, and 41.9% of MetroPacific Tollways.
Telecommunications
First Pacific owns 25.6% of PLDT which in turn owns 100% of Smart, its mobile telecommunications subsidiary.
Consumer Foods
First Pacific owns 50.1% of Indofood and has an economic interest of 40.3% in ICBP. FPC owns 50.0% of Goodman Fielder.
4
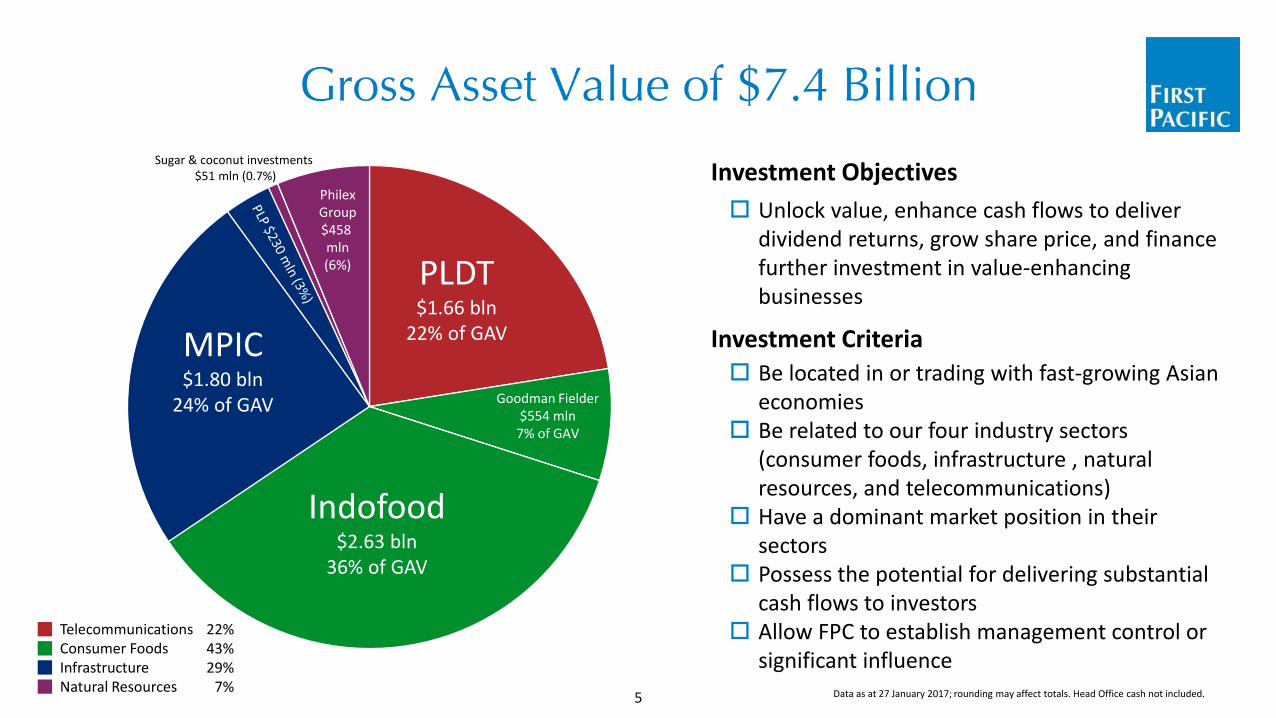
22% 43% 29%
7%
Telecommunications Consumer Foods Infrastructure Natural Resources Data as at 27 January 2017; rounding may affect totals. Head Office cash not included. 5
PLDT $1.66 bln
22% of GAV MPIC $1.80 bln
24% of GAV
Philex Group $458 mln (6%)
Indofood $2.63 bln
36% of GAV
Sugar & coconut investments $51 mln (0.7%)
Goodman Fielder $554 mln
7% of GAV
Investment Objectives
Unlock value, enhance cash flows to deliver dividend returns, grow share price, and finance further investment in value-enhancing businesses
Investment Criteria
Be located in or trading with fast-growing Asian economies
Be related to our four industry sectors (consumer foods, infrastructure , natural resources, and telecommunications)
Have a dominant market position in their sectors
Possess the potential for delivering substantial cash flows to investors
Allow FPC to establish management control or significant influence
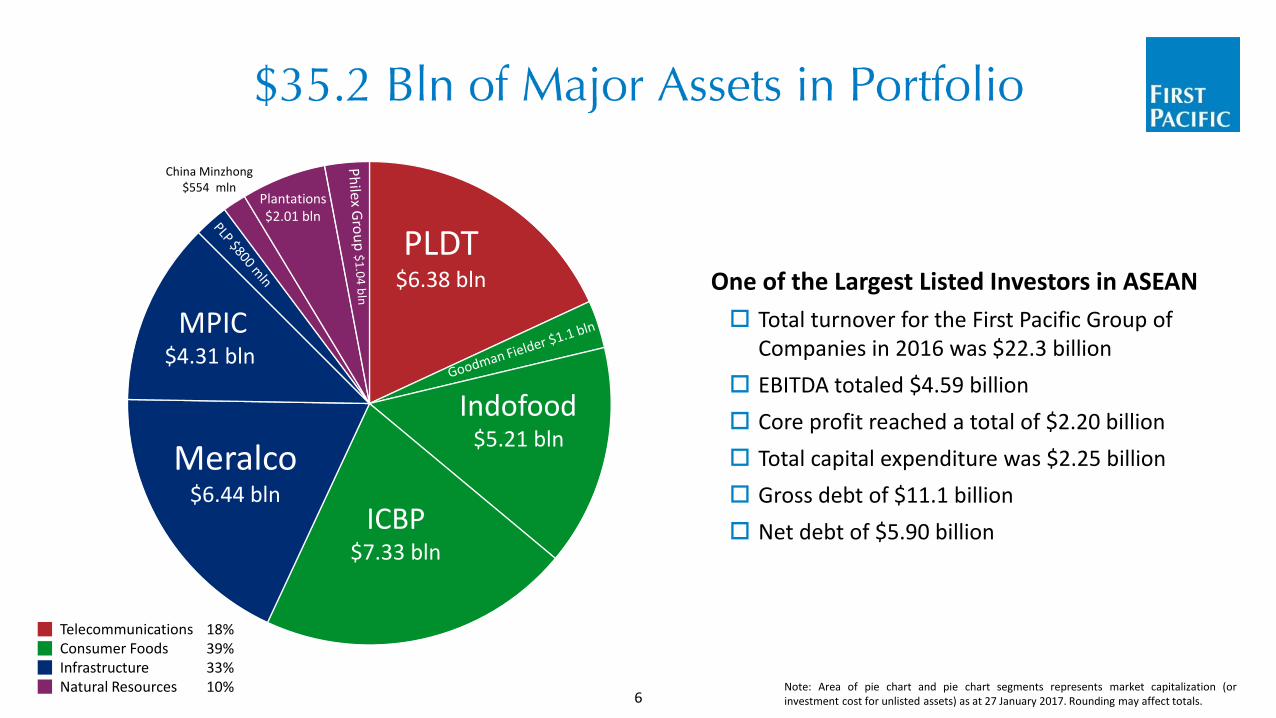
Note: Area of pie chart and pie chart segments represents market capitalization (or investment cost for unlisted assets) as at 27 January 2017. Rounding may affect totals. 6
China Minzhong $554 mln
Indofood $5.21 bln
Meralco $6.44 bln
MPIC $4.31 bln
ICBP $7.33 bln
PLDT $6.38 bln
Plantations $2.01 bln
One of the Largest Listed Investors in ASEAN
Total turnover for the First Pacific Group of Companies in 2016 was $22.3 billion
EBITDA totaled $4.59 billion
Core profit reached a total of $2.20 billion
Total capital expenditure was $2.25 billion
Gross debt of $11.1 billion
Net debt of $5.90 billion
18% 39% 33% 10%
Telecommunications Consumer Foods Infrastructure Natural Resources
Telecommunications Food/Consumer
Infrastructure Natural Resources
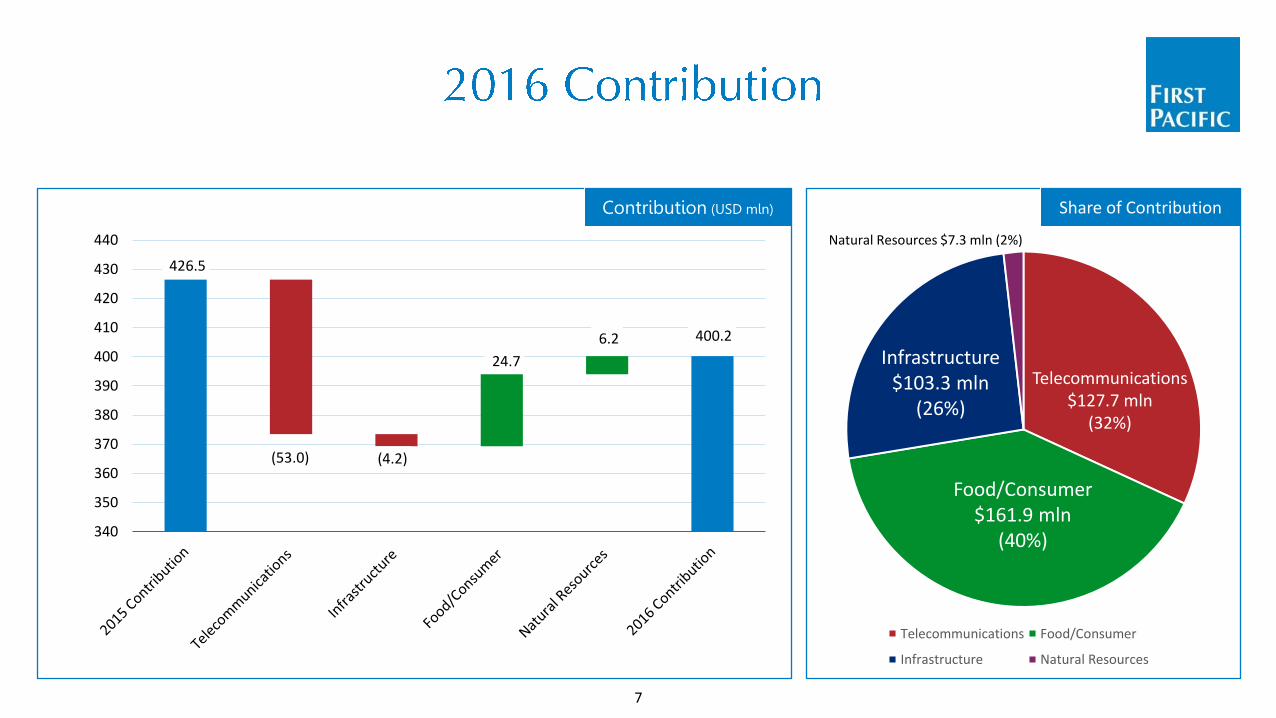
426.5
400.2
(53.0) (4.2)
24.7
6.2
340
350
360
370
380
390
400
410
420
430
440
Contribution (USD mln)
7
Share of Contribution
Natural Resources $7.3 mln (2%)
Infrastructure $103.3 mln
(26%)
Food/Consumer $161.9 mln
(40%)
Telecommunications $127.7 mln
(32%)

Telecommunications Food/Consumer
Infrastructure Natural Resources
102.6
236.5
163.2
199.7 0.5
(91.7)
(74.2) (36.0)
(27.6)
0
50
100
150
200
250
300
350
400
450
500
8
2016 Free Cash Flow (USD mln) Source of Dividends
Infrastructure $30 mln
(15%)
Food/Consumer $50 mln
(25%)
Telecommunications $118 mln
(59%)

320
20
219
312
400 367
0
100
200
300
400
500
2017 2018 2019 2020 2021 2022 2023
Unsecured Bank Loans Secured Bonds Unsecured Bonds
7⅜% 6.0% 6⅜% 4½%
Coupon 7-Year
10-Year 7-Year
10-Year
Term 24 July 2017
28 June 2019 28 Sept 2020 16 April 2023
Maturity US$219 mln US$400 mln US$312 mln US$367 mln
Principal 102.070 106.051 108.942 101.652
Price*
*Recent data from Bloomberg.
End-2016 Data Cash interest cover over 2.0x Gross assets $8.3 billion at end-2016 Gross debt $1.8 billion, gross debt
cover 4.5x Net debt $1.5 billion, net debt cover
5.4x Average maturity of 3.6 years Blended interest cost of 5.3% Bloomberg listing: FIRPAC <Corp> <Go>
9
Unsecured 61%
Secured 39%
Fixed 82%
Floating 18%
Debt Profile After January Bond Tender (USD mln)
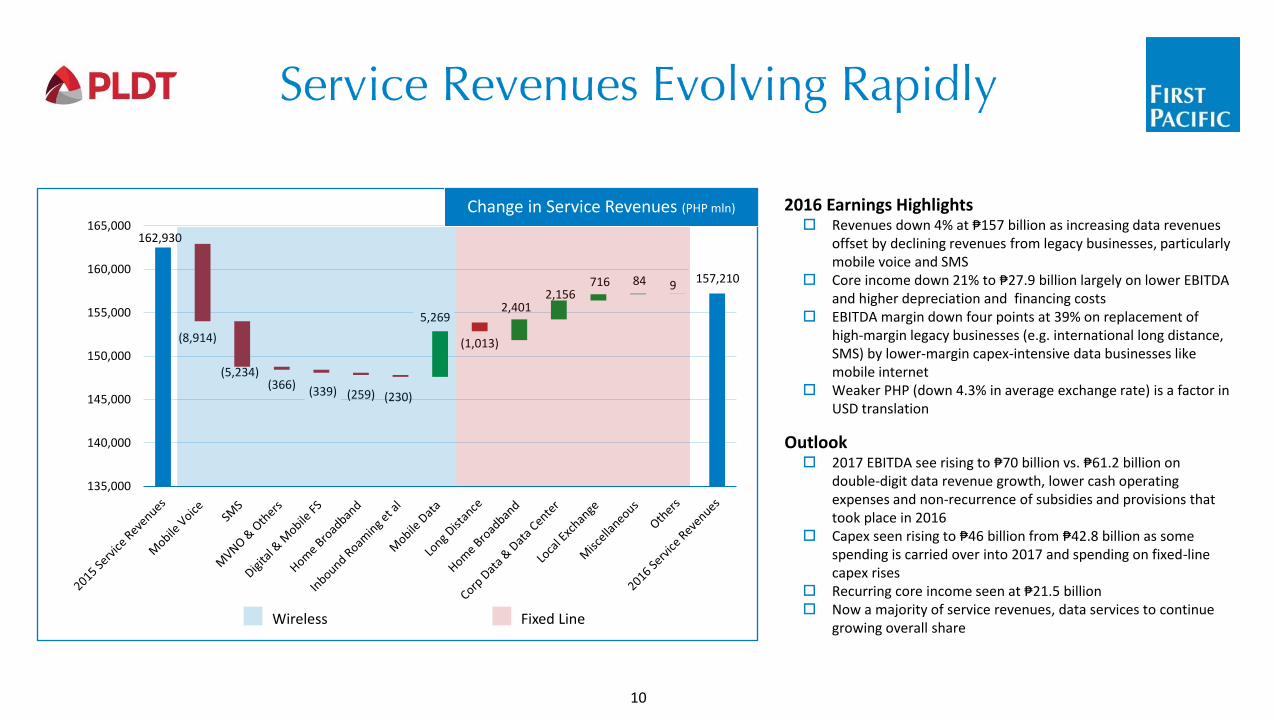
162,930
157,210
(8,914)
(5,234) (366)
(339) (259) (230)
5,269
(1,013)
2,401 2,156
716 84 9
135,000
140,000
145,000
150,000
155,000
160,000
165,000
Wireless Fixed Line
Change in Service Revenues (PHP mln)
Outlook 2017 EBITDA see rising to ₱70 billion vs. ₱61.2 billion on
double-digit data revenue growth, lower cash operating expenses and non-recurrence of subsidies and provisions that took place in 2016
Capex seen rising to ₱46 billion from ₱42.8 billion as some spending is carried over into 2017 and spending on fixed-line capex rises
Recurring core income seen at ₱21.5 billion Now a majority of service revenues, data services to continue
growing overall share
2016 Earnings Highlights Revenues down 4% at ₱157 billion as increasing data revenues
offset by declining revenues from legacy businesses, particularly mobile voice and SMS
Core income down 21% to ₱27.9 billion largely on lower EBITDA and higher depreciation and financing costs
EBITDA margin down four points at 39% on replacement of high-margin legacy businesses (e.g. international long distance, SMS) by lower-margin capex-intensive data businesses like mobile internet
Weaker PHP (down 4.3% in average exchange rate) is a factor in USD translation
10

0
20
40
60
80
100
120
Growing Maturing Shrinking
2012 2013 2014 2015 2016
Evolution of Service Revenues (PHP bln)
2012
2016
Growing 39%
Maturing 49%
Growing 19%
Maturing 63%
Shrink -ing 12%
Shrinking 17%
11
Evolution of Service Revenues
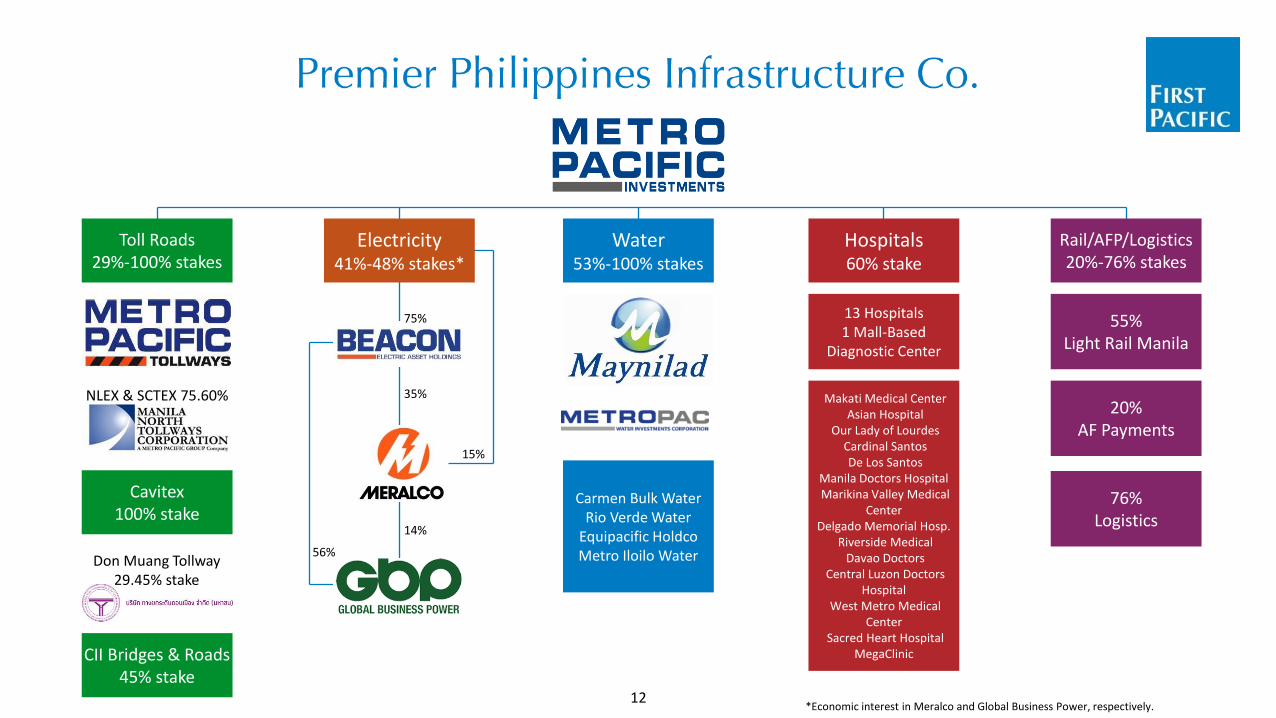
Electricity 41%-48% stakes*
Hospitals 60% stake
13 Hospitals 1 Mall-Based
Diagnostic Center
*Economic interest in Meralco and Global Business Power, respectively.
Rail/AFP/Logistics 20%-76% stakes
55% Light Rail Manila
20% AF Payments
Toll Roads 29%-100% stakes
CII Bridges & Roads 45% stake
Cavitex 100% stake
Don Muang Tollway 29.45% stake
NLEX & SCTEX 75.60%
75%
35% Makati Medical Center Asian Hospital
Our Lady of Lourdes Cardinal Santos De Los Santos
Manila Doctors Hospital Marikina Valley Medical
Center Delgado Memorial Hosp.
Riverside Medical Davao Doctors
Central Luzon Doctors Hospital
West Metro Medical Center
Sacred Heart Hospital MegaClinic
15%
56%
14%
Water 53%-100% stakes
Carmen Bulk Water Rio Verde Water
Equipacific Holdco Metro Iloilo Water
76% Logistics
12
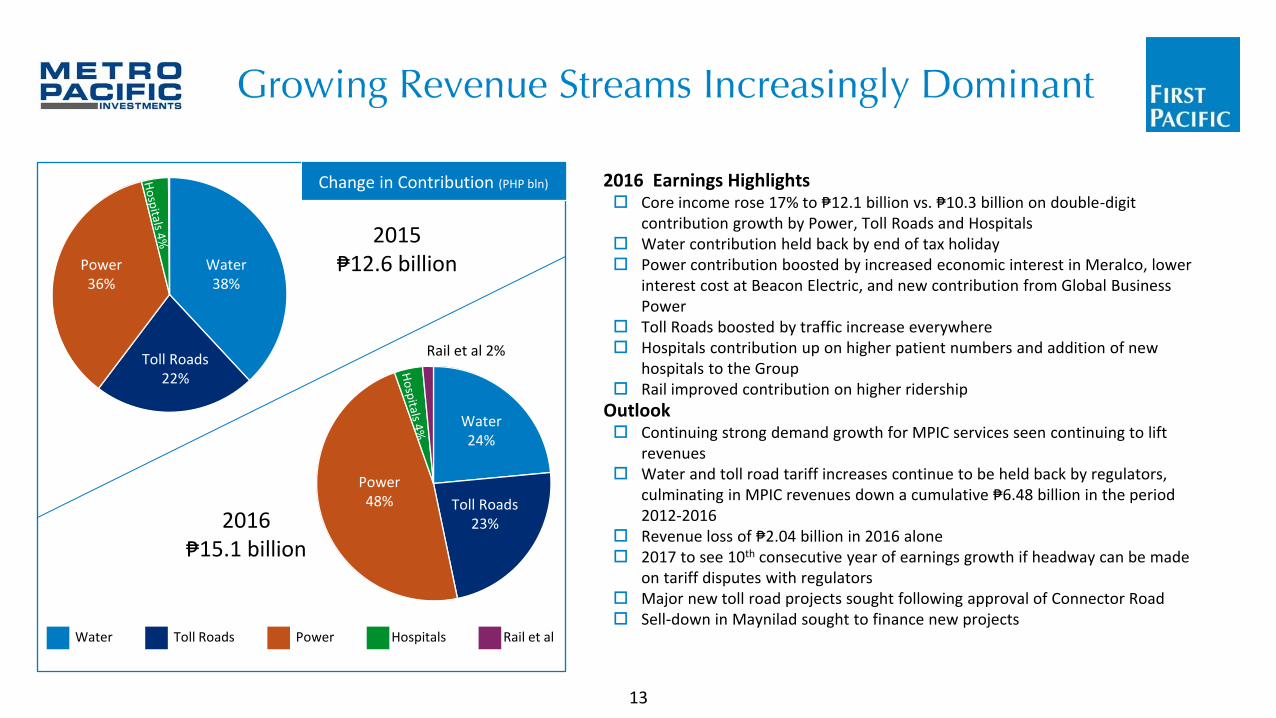
2015 ₱12.6 billion
2016 ₱15.1 billion
2016 Earnings Highlights Core income rose 17% to ₱12.1 billion vs. ₱10.3 billion on double-digit
contribution growth by Power, Toll Roads and Hospitals Water contribution held back by end of tax holiday Power contribution boosted by increased economic interest in Meralco, lower
interest cost at Beacon Electric, and new contribution from Global Business Power
Toll Roads boosted by traffic increase everywhere Hospitals contribution up on higher patient numbers and addition of new
hospitals to the Group Rail improved contribution on higher ridership
Outlook Continuing strong demand growth for MPIC services seen continuing to lift
revenues Water and toll road tariff increases continue to be held back by regulators,
culminating in MPIC revenues down a cumulative ₱6.48 billion in the period 2012-2016
Revenue loss of ₱2.04 billion in 2016 alone 2017 to see 10th consecutive year of earnings growth if headway can be made
on tariff disputes with regulators Major new toll road projects sought following approval of Connector Road Sell-down in Maynilad sought to finance new projects
Water Toll Roads Power Hospitals Rail et al
Change in Contribution (PHP bln)
Water 24%
Power 48% Toll Roads
23%
Rail et al 2%
Water 38%
Power 36%
Toll Roads 22%
13
14
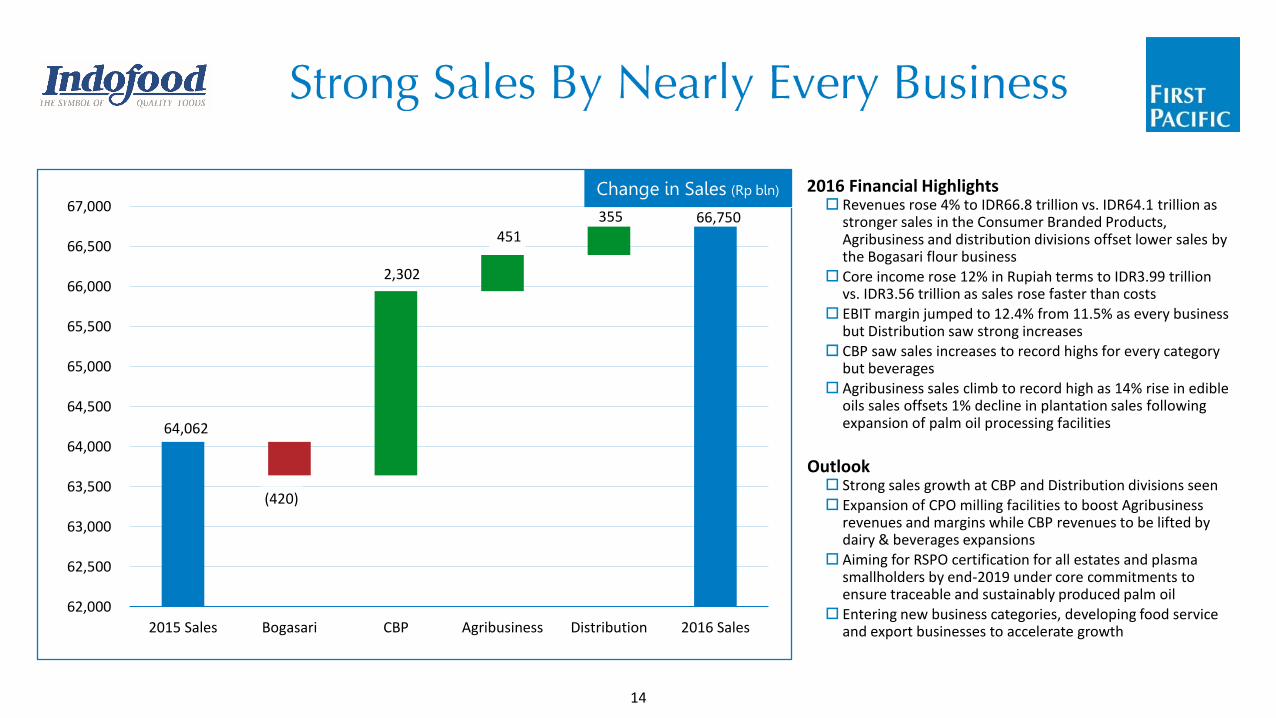
Change in Sales (Rp bln)
64,062
66,750
(420)
2,302
451 355
62,000
62,500
63,000
63,500
64,000
64,500
65,000
65,500
66,000
66,500
67,000
2015 Sales Bogasari CBP Agribusiness Distribution 2016 Sales
Change in Sales (Rp bln) 2016 Financial Highlights Revenues rose 4% to IDR66.8 trillion vs. IDR64.1 trillion as
stronger sales in the Consumer Branded Products, Agribusiness and distribution divisions offset lower sales by the Bogasari flour business
Core income rose 12% in Rupiah terms to IDR3.99 trillion vs. IDR3.56 trillion as sales rose faster than costs
EBIT margin jumped to 12.4% from 11.5% as every business but Distribution saw strong increases
CBP saw sales increases to record highs for every category but beverages
Agribusiness sales climb to record high as 14% rise in edible oils sales offsets 1% decline in plantation sales following expansion of palm oil processing facilities
Outlook Strong sales growth at CBP and Distribution divisions seen Expansion of CPO milling facilities to boost Agribusiness
revenues and margins while CBP revenues to be lifted by dairy & beverages expansions
Aiming for RSPO certification for all estates and plasma smallholders by end-2019 under core commitments to ensure traceable and sustainably produced palm oil
Entering new business categories, developing food service and export businesses to accelerate growth
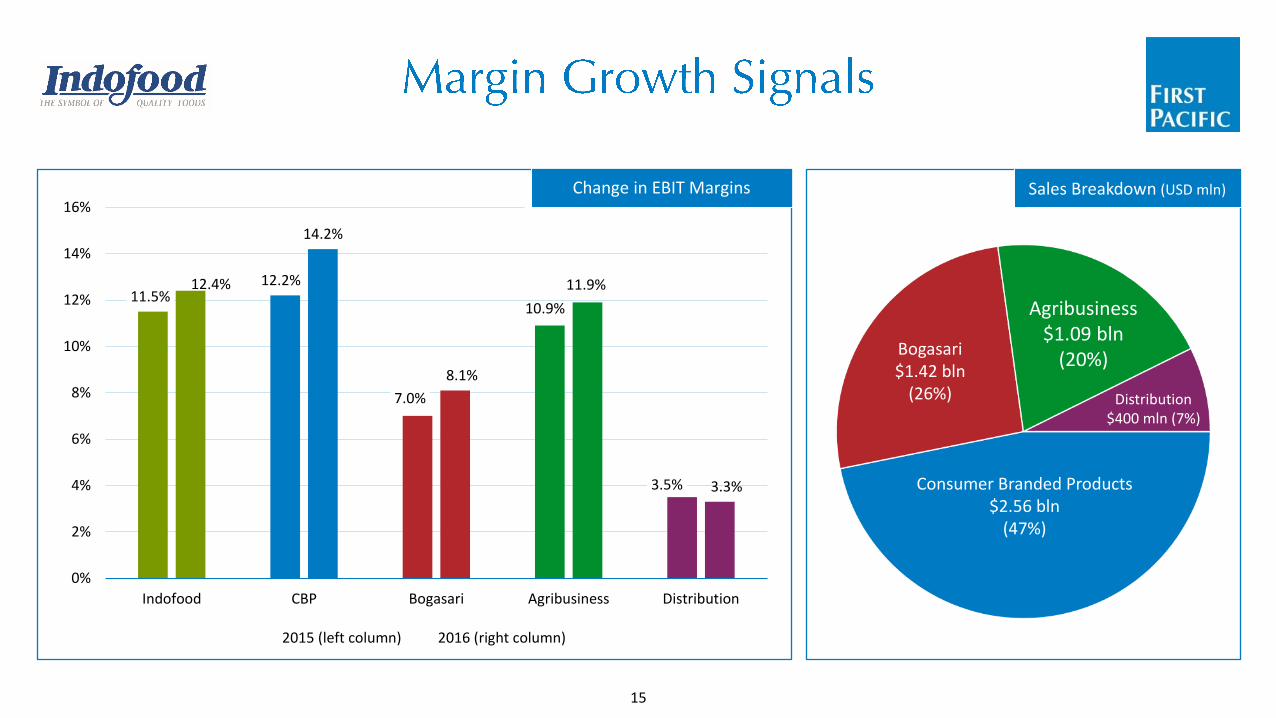
11.5% 12.2%
7.0%
10.9%
3.5%
12.4%
14.2%
8.1%
11.9%
3.3%
0%
2%
4%
6%
8%
10%
12%
14%
16%
Indofood CBP Bogasari Agribusiness Distribution
2015 (left column) 2016 (right column)
Change in EBIT Margins
15
Sales Breakdown (USD mln)
Bogasari $1.42 bln
(26%)
Agribusiness $1.09 bln
(20%)
Consumer Branded Products $2.56 bln
(47%)
Distribution $400 mln (7%)
15%
11%
6%
0%
2%
4%
6%
8%
10%
12%
14%
16%
18%
International New Zealand Australia
16
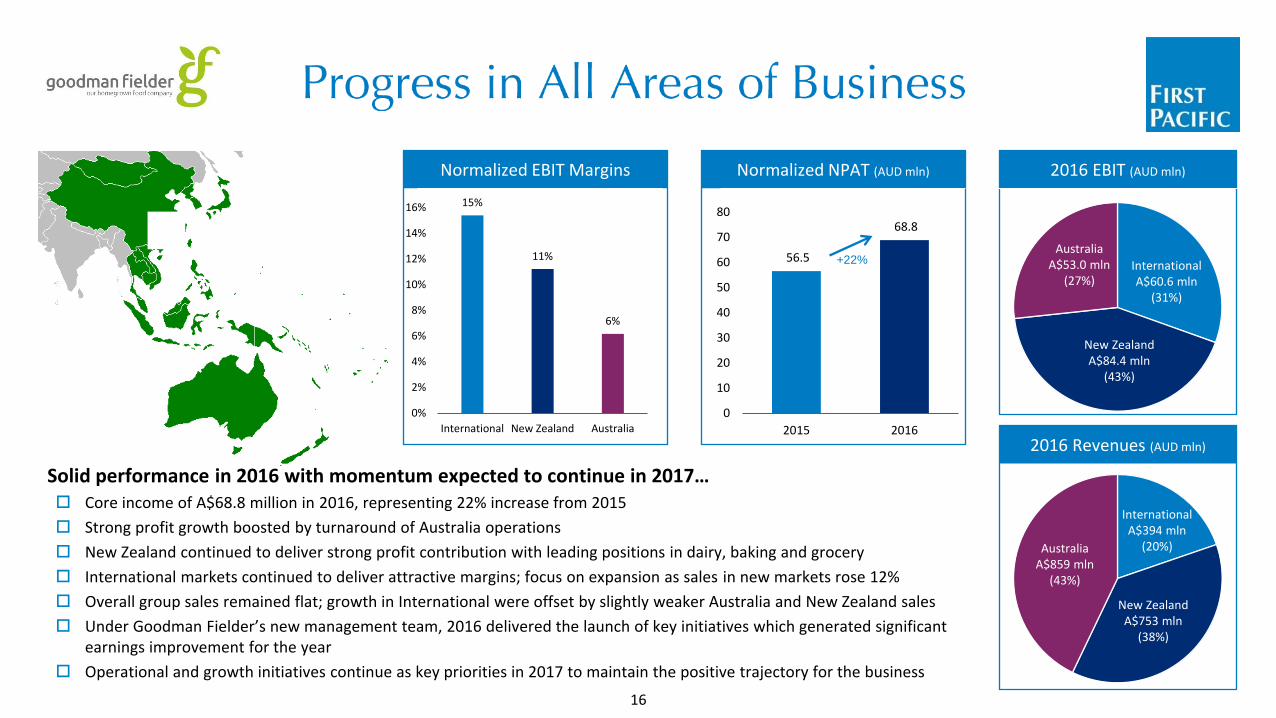
2016 Revenues (AUD mln)
2016 EBIT (AUD mln)
Australia A$859 mln
(43%)
International A$394 mln
(20%)
New Zealand A$753 mln
(38%)
Australia A$53.0 mln
(27%) International A$60.6 mln
(31%)
New Zealand A$84.4 mln
(43%)
56.5
68.8
0
10
20
30
40
50
60
70
80
2015 2016
Normalized NPAT (AUD mln) Normalized EBIT Margins
+22%
Solid performance in 2016 with momentum expected to continue in 2017… Core income of A$68.8 million in 2016, representing 22% increase from 2015
Strong profit growth boosted by turnaround of Australia operations
New Zealand continued to deliver strong profit contribution with leading positions in dairy, baking and grocery
International markets continued to deliver attractive margins; focus on expansion as sales in new markets rose 12%
Overall group sales remained flat; growth in International were offset by slightly weaker Australia and New Zealand sales
Under Goodman Fielder’s new management team, 2016 delivered the launch of key initiatives which generated significant earnings improvement for the year
Operational and growth initiatives continue as key priorities in 2017 to maintain the positive trajectory for the business
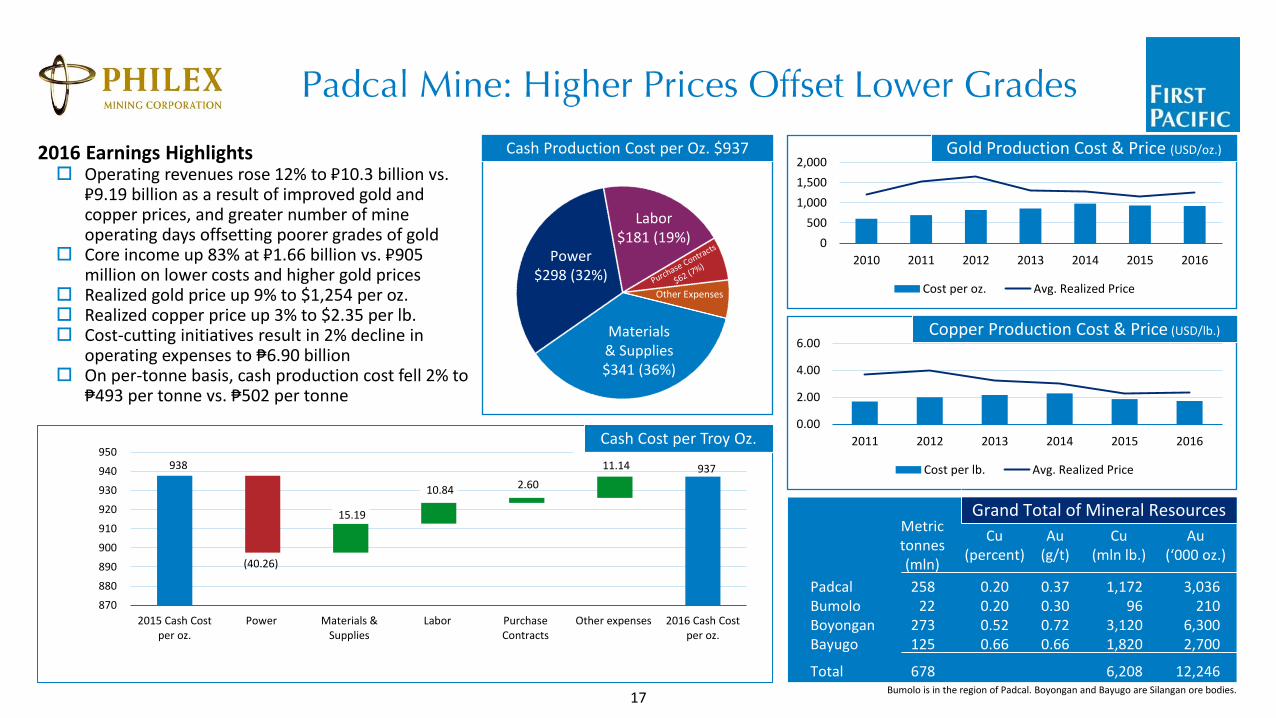
938 937
(40.26)
15.19
10.84 2.60
11.14
870
880
890
900
910
920
930
940
950
2015 Cash Costper oz.
Power Materials &Supplies
Labor PurchaseContracts
Other expenses 2016 Cash Costper oz.
Cash Cost per Troy Oz.
17
0.00
2.00
4.00
6.00
2011 2012 2013 2014 2015 2016
Cost per lb. Avg. Realized Price
0
500
1,000
1,500
2,000
2010 2011 2012 2013 2014 2015 2016
Cost per oz. Avg. Realized Price
Gold Production Cost & Price (USD/oz.)
Bumolo is in the region of Padcal. Boyongan and Bayugo are Silangan ore bodies.
Grand Total of Mineral Resources Metric tonnes (mln)
Au (‘000 oz.)
0.20 0.20
0.52 0.66
258 22
273 125
678
Padcal Bumolo Boyongan Bayugo
Total
1,172 96
3,120 1,820
6,208
Cu (mln lb.)
Au (g/t)
Cu (percent)
0.37 0.30
0.72 0.66
3,036 210
6,300 2,700
12,246
Copper Production Cost & Price (USD/lb.)
Cash Production Cost per Oz. $937
Materials & Supplies $341 (36%)
Power $298 (32%)
Labor $181 (19%)
Other Expenses
2016 Earnings Highlights Operating revenues rose 12% to ₽10.3 billion vs.
₽9.19 billion as a result of improved gold and copper prices, and greater number of mine operating days offsetting poorer grades of gold
Core income up 83% at ₽1.66 billion vs. ₽905 million on lower costs and higher gold prices
Realized gold price up 9% to $1,254 per oz. Realized copper price up 3% to $2.35 per lb. Cost-cutting initiatives result in 2% decline in
operating expenses to ₱6.90 billion On per-tonne basis, cash production cost fell 2% to
₱493 per tonne vs. ₱502 per tonne

First Pacific combines access to our unrivaled portfolio of strong businesses in emerging Asia with the security of Hong Kong’s legal system and listing rules, in an effective US dollar security
We have nearly four decades of history delivering robust returns to our shareholders – our experience in investing in our markets is hard to match
Our focus remains on seeking returns in emerging Asia within our chosen areas of business to deliver strong growth in upturns and defensive returns in downturns to deliver stable and strong returns over the long term
Our investments are well positioned for growth in 2017 and beyond
First Pacific’s NAV discount is unjustified by the Company’s prospects and offers an attractive opportunity to invest in our portfolio
Management is identifying assets not meeting return targets for possible disposal with proceeds to apply towards share repurchases and debt reduction to signal confidence in our prospects
18

Full-Year and End-Year Data (USD mln)
Maynilad
MPTC
MERALCO
Global Business Power
Hospital Group
MPIC*
PLDT
Philex Mining (Conso)
PXP Energy (Conso)
Roxas Holdings Inc.
First Coconut
Indofood*
ICBP
IndoAgri
Goodman Fielder
FPM Power
TOTAL
302
160
712
180
91
-
1,380
80
(0)
33
(1)
821
422
252
145
15
4,591
Core EBITDA
424
250
5,395
370
412
940
3,298
215
2
229
35
5,011
2,587
1,091
1,488
575
22,323
Turnover
142
65
403
55
37
240
420
33
(0)
-
-
311
270
38
36
(79)
1,972
Net Profit
Net Debt
373
596
(970)
403
(38)
652
2,943
185
(12)
188
(6)
674
(471)
567
347
471
5,903
Capex
200
186
240
87
63
-
898
55
3
28
3
234
82
99
65
2
2,245
Gross Debt
537
651
811
729
45
739
3,721
195
-
196
-
1,669
152
746
428
522
11,140 *Includes results of operating companies also listed here.
150
69
411
60
37
254
584
35
(1)
5
(1)
299
278
35
51
(64)
2,203
Core Profit
20

Salim Group 45%
Brandes 7.6%
All Others
10%
Shareholder Breakdown
Lazard 7.0%
GIC 3.8%
Brandes Investment Partners
Lazard Asset Management
Deutsche Bank Private WM
GIC Asset Management
Marathon Asset Management
Kabouter Management
City of London IM (Singapore)
BlackRock Fund Advisors
Thompson Siegel & Walmsley
Templeton Asset Management
The Vanguard Group,
Ohio Public Employees
Nordea Investment Management
ATR KimEng Asset Management
Maple-Brown Abbott,
Dimensional Fund Advisors
Oldfield Partners
Asset Value Investors
State Street Global Advisors
Letko, Brosseau & Associates,
Invesco Canada
Mackenzie Financial Corporation
Quantitative Management
Legal & General IM
BlackRock Advisors
7.6%
7.0%
4.0%
3.8%
1.8%
1.8%
1.8%
1.5%
1.5%
1.2%
1.1%
1.0%
0.97%
0.95%
0.83%
0.82%
0.73%
0.60%
0.56%
0.55%
0.54%
0.50%
0.46%
0.37%
0.37%
1
2
3
4
5
6
7
8
9
10
11
12
13
14
15
16
17
18
19
20
21
22
23
24
25
327
298
170
162
79
77
78
64
64
49
48
44
41
41
35
35
31
26
24
24
23
21
20
16
16
Institution Mln Shares %
IPREO data as at 30 December 2016. Institutional investors only. Analysis performed for First Pacific counts 240 institutional shareholders owning 2,147,690,535 shares. Total shares out: 4,281,679,008.
21

22
Core Profit F’casts (USD mln)
Citigroup
CLSA
HSBC
Mizuho
Price Targets for First Pacific (HKD/Share)
$7.20
$6.40
$6.50
$7.50
Target
Buy
Outperform
Buy
Buy
Rating
31 May 2016
31 Mar 2016
9 Dec 2015
21 Aug 2016
Date
Average
2018
314
393
321
2017
276
346
346
198
279
2016
272
308
311
151
241 $6.90
Geography
USA 52%
Singapore 19%
UK 10%
HK & China 3% Canada 4% Japan 2% RoW 4%
Concentration Investment Style
The Rest 7%
Turnover
Next 15 20%
Next 25 10%
of all shares held by institutional investors are held by
the top 10.
Value 59%
Growth 16%
Index 11%
Yield 2%
Other 8%
Top 10 63%
Alternative 3%
Very Active 3% N/A 12%
Low 73%
Medium 12%
Very Active 0.2% High 2%
Holding period philosophy: Low: Longer than 3 years Medium: 2-3 years High: 1-2 years Very Active: <1 year
IPREO data as at 30 December 2016. Institutional investors only. Analysis performed for First Pacific counts 240 institutional shareholders owning 2,147,690,535 shares. Total shares out: 4,281,679,008.

(i) After taxation and non-controlling interests, where appropriate. (ii) The Group has restated its 2015 contribution from Indofood to US$123.9 million from US$130.3 million and changes in fair value of biological assets to a gain of US$0.2 million from a loss of US$1.7 million following its adoption of the amendments to HKAS 16 and 41
“Agriculture: Bearer Plants” with effect from 1 January 2016. Accordingly, the Group’s 2015 recurring profit has been restated to US$287.5 million from US$293.9 million and its 2015 profit attributable to owners of the parent has been restated to US$80.6 million from US$85.1 million. Details of the changes are set out in Note 1 to the consolidated financial statements.
(iii) Associated companies. (iv) Joint venture. (v) Contribution from operations represents the recurring profit contributed to the Group by its operating companies. (vi) Recurring profit represents the profit attributable to owners of the parent excluding the effects of foreign exchange and derivative losses, gain on changes in fair value of biological assets and non-recurring items. (vii) Foreign exchange and derivative losses represent the losses on foreign exchange translation differences on the Group’s unhedged foreign currency denominated net borrowings and payables and the changes in the fair values of derivatives. (viii) Non-recurring items represent certain items, through occurrence or size, which are not considered as usual operating items. 2016’s non-recurring losses of US$155.2 million mainly represent the Group’s impairment provisions for assets, including FPM Power’s goodwill
related to its investments in PLP (US$44.8 million), PLDT’s investment in Rocket Internet shares and other intangible assets (US$35.4 million), Philex’s deferred exploration costs and other assets (US$31.4 million) and MPIC’s investments in Landco Pacific Corporation (US$6.8 million), PLP’s provision for onerous contracts (US$6.0 million) and MPIC’s project expenses (US$3.8 million).
For the year ended 31 December US$ millions PLDT(iii)
Indofood MPIC FPW(iv)
Philex(iii)
FPM Power FP Natural Resources Contribution from operations(v)
Head Office items: – Corporate overhead – Net interest expense – Other expenses Recurring profit(vi)
Foreign exchange and derivative losses(vii)
Gain on changes in fair value of biological assets Non-recurring items(viii)
Profit attributable to owners of the parent
2016
- 5,010.5
940.2 - -
575.3 253.0
6,779.0
2016
127.7 137.9 117.2
24.0 10.2
(13.9) (2.9)
400.2
(28.4) (95.7) (11.2) 264.9
(9.1) 2.6
(155.2) 103.2
Contribution to Group profit(i) Turnover
2015
- 4,763.4
816.5 - -
663.5 193.6
6,437.0
2015 (Restated)(ii)
180.7 123.9 118.2
13.3 4.9
(10.7) (3.8)
426.5
(31.8) (94.4) (12.8) 287.5 (48.5)
0.2 (158.6)
80.6
23
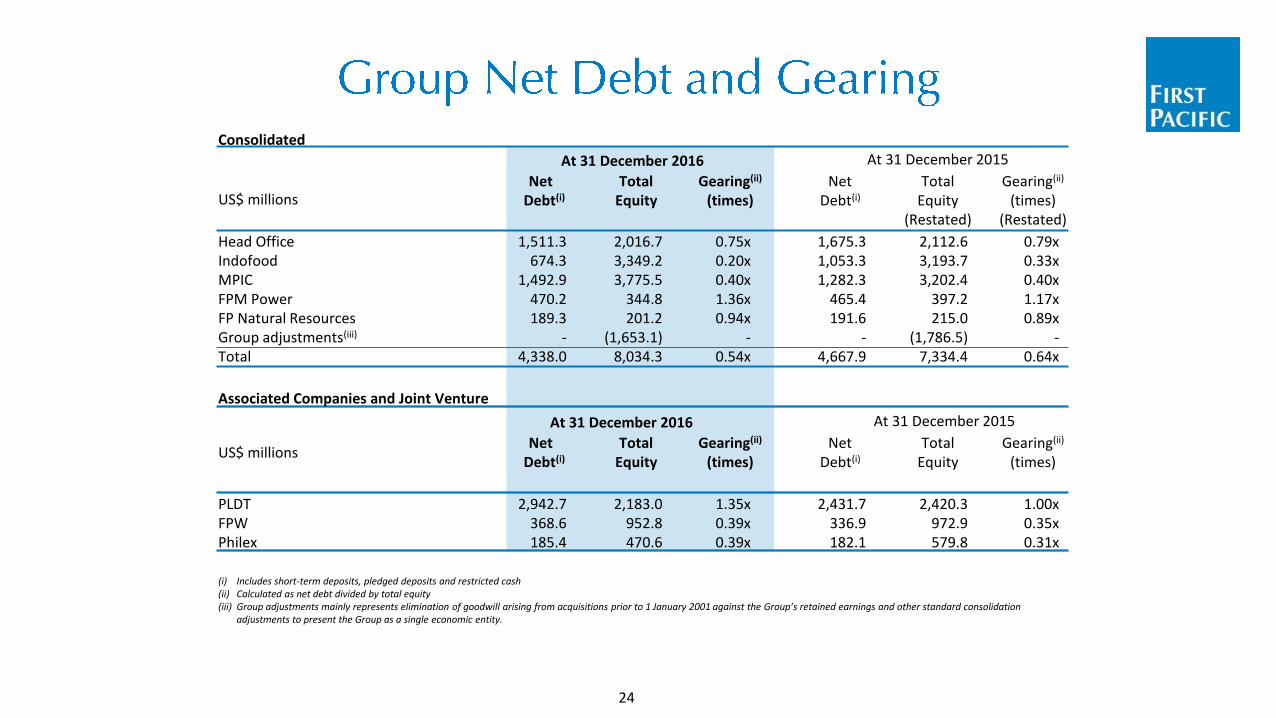
Consolidated
(i) Includes short-term deposits, pledged deposits and restricted cash (ii) Calculated as net debt divided by total equity (iii) Group adjustments mainly represents elimination of goodwill arising from acquisitions prior to 1 January 2001 against the Group’s retained earnings and other standard consolidation
adjustments to present the Group as a single economic entity.
At 31 December 2016 At 31 December 2015
Head Office Indofood MPIC FPM Power FP Natural Resources Group adjustments(iii)
Total
US$ millions
Associated Companies and Joint Venture
At 31 December 2016 At 31 December 2015
PLDT FPW Philex
Net Debt(i)
Net Debt(i)
1,511.3 674.3
1,492.9 470.2 189.3
- 4,338.0
2,942.7 368.6 185.4
Total Equity
Total Equity
2,016.7 3,349.2 3,775.5
344.8 201.2
(1,653.1) 8,034.3
2,183.0 952.8 470.6
Gearing(ii)
(times)
Gearing(ii)
(times)
0.75x 0.20x 0.40x 1.36x 0.94x
- 0.54x
1.35x 0.39x 0.39x
Net Debt(i)
Net Debt(i)
1,675.3 1,053.3 1,282.3
465.4 191.6
- 4,667.9
2,431.7 336.9 182.1
Total Equity
(Restated)
Total Equity
2,112.6 3,193.7 3,202.4
397.2 215.0
(1,786.5) 7,334.4
2,420.3 972.9 579.8
Gearing(ii)
(times) (Restated)
Gearing(ii)
(times)
0.79x 0.33x 0.40x 1.17x 0.89x
- 0.64x
1.00x 0.35x 0.31x
US$ millions
24

For the year ended 31 December US$ millions Dividend and fee income Head Office overhead expense Net cash interest expense Net Cash Inflow from Operating Activities Net proceeds on sale of an investment(i)/(net investments)(ii)
Financing activities - Dividend paid - (Repayment of loans)/borrowings - Repurchase of shares - Others Increase/(decrease) in Cash and Cash Equivalents Cash and cash equivalents at 1 January Cash and Cash Equivalents at 31 December
2016
199.7 (27.6) (91.7)
80.4 163.2
(74.2) (36.0)
- 0.5
133.9 102.6 236.5
2015
268.9 (27.6) (94.2) 147.1
(456.6)
(115.5) 49.7
(19.0) (0.3)
(394.6) 497.2 102.6
(i) Excludes pledged deposits and restricted cash as at 31 December 2016 of US$11.7 million (31 December 2015: US$11.5 million and 1 January 2015: US$11.3 million).
(ii) Principally represents the net proceeds from the sale of 1.3 billion common shares in MPIC. (iii) 2015’s net investments represent principally the investments in an additional 40.2% effective interest in Goodman Fielder
of US$423.4 million.
25

(i) Based on quoted share prices applied to the Group’s economic interests. (ii) Represents investment costs. (iii) Represents carrying costs at 31 December 2016 and investment costs at 31 December 2015. (iv) Mainly represents RHI (based on quoted share price applied to the Group’s effective economic interest) and the
Group’s economic interest in other assets (measured at cost). (v) Represents investment costs in SMECI’s convertible notes.
US$ millions PLDT Indofood MPIC Philex PXP FPW FPM Power FP Natural Resources Head Office - Other assets - Net debt Total Valuation Number of Ordinary Shares in Issue (millions) Value per share - U.S. dollars - HK dollars Company's closing share price (HK$) Share price discount to HK$ value per share (%)
At 31 December
2015
2,418.3 1,649.1 1,604.7
213.3 5.5
554.0 335.3
79.4 107.1
(1,675.3) 5,291.4 4,268.5
1.2 9.7 5.1
46.8
Basis (i) (i) (i) (i) (i) (ii) (iii) (iv) (v)
At 31 December
2016
1,516.7 2,593.0 1,771.2
394.6 37.0
554.0 230.0
50.1 101.4
(1,511.3) 5,736.7 4,281.7
1.3 10.5
5.4 48.1
26

First Pacific Company Limited (Incorporated with limited liability under the laws of Bermuda)
24th Floor, Two Exchange Square
8 Connaught Place, Central Hong Kong
Tel: +852 2842 4374 [email protected]
www.firstpacific.com
Top Related