


Languages
Pages
Legal


Controlling climate change after Copenhagen
Dr. Bert Metz
Former Co-chairman IPCC Working Group III
Fellow, European Climate Foundation
Woods Institute Energy Seminar, Stanford University, February 10, 2010

2
1. Climate change and its impacts2. Greenhouse gas emissions3. Keeping climate change within sustainable
limits; where to draw the line?4. Development First5. Energy supply6. Transportation7. Buildings8. Industry and waste management9. Land use, agriculture and forestry10. How does it fit together?11. Policies and measures12. International climate change agreements

COPENHAGEN OUTCOME
Controlling Climate Change 3

• Huge increase in awareness/ political attention• Inability to conclude 2 year negotiation
process• Acrimoneous process• Political declaration (not unanimous) >>
Copenhagen Accord as input in negotiations• Decisions to continue negotiations, aiming at
completion at COP 16/ Mexico (Nov/Dec2010)
Copenhagen
Controlling Climate Change 4

Copenhagen Accord(1/3)
5
In But Consequence
Recognising 2 degree limit •No reductioncommitments to get there;• Targets/actions likely to get in far below top end
We are on track to 3-4 degrees; chances of stayingbelow 2 degrees virtuallyzero
Review in 2015 with optionto tighten global limit to 1.5 degrees
No strengthening of 2020 reduction commitments
This is lip service to vulnerable countries; has nopractical impact; does notincrease chance to staybelow 2 degrees
Annex I countries to list their 2020 targets and non-Annex-I PART of theiractions by Feb 1, 2010
•Terms “developed” and “developing”(as in BaliAction Plan) disappeared; •Accounting rules NOT uniform; nothing aboutsurplus AAU; •No benchmark on howmuch they do
•Including “new developedcountries” impossible; •Big loopholes on value of targets; •No pressure on maximizingreductions
Controlling Climate Change

Copenhagen Accord (2/3)
6
In But Consequence
Stressing importance of adaptation and provide about half of $30 billionin support 2010-2012
Money likely to be at least partly relabelledODA
Vulnerable countries are getting financial support, while climate changeimpacts are getting muchworse
“we support the goal to mobilise $100 billion by2020 “; public and private money
•No commitment to deliver this money; •No mechanisms to generate funding; •No governance structureto manage effectivedisbursement
Unclear if there ever willbe significant money
Copenhagen ClimateFund established
•Nothing how to fill the fund•Nothing on governance(only Panel to studyresources)
Unclear if fund will ever beoperational

Copenhagen Accord (3/3)
7
In But Consequence
Establish a REDD + mechanism”
Nothing established and no process to establish it; no rules
Fast start money will partlyflow to countries to avoiddeforestation; rest unclear
Establish a technologymechanism
No detailsNegotiations aiming at administrative approach
No effective mechanism to promote technologytransfer
Develop marketapproaches
Nothing about reformingcarbon marketNo hard caps> nomarket?
No agreement on CDM reformInternational carbon marketuncertain
“provide incentives to developing countries to continue on a low emissions path”
Nothing about Low Carbon Growth Plans
No impact on producinglow carbon developmentplans

CopenhagenDecisions
8
In But Consequence
Decision to continue AWG-LCA and requestto deliver outcome byCOP16
No statement on legallybinding outcome; noprocess decisions; vague paragapah onMexico mandate
Totally unclear if there willbe serious negotiatingprocess (also in light of acrymoneous debates in CPH)
Decision to continue AWG-KP and request to deliver outcome at COP16
Demands of EU, Japan, Russia , Australia to have legally binding outcome (=Protocol) from LCA ignored; vague paragapah onMexico mandate
Kyoto Annex B countriesmay never agree with KP amendment or neverratify
Controlling Climate Change
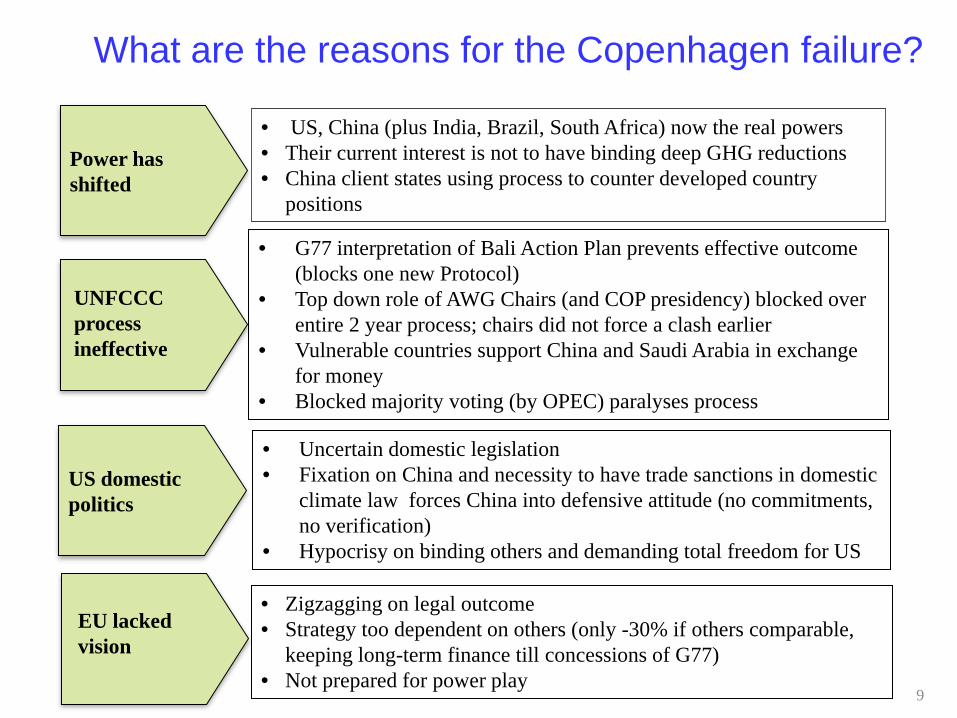
What are the reasons for the Copenhagen failure?
9
Power has shifted
UNFCCC process ineffective
US domestic politics
EU lacked vision
• G77 interpretation of Bali Action Plan prevents effective outcome (blocks one new Protocol)
• Top down role of AWG Chairs (and COP presidency) blocked over entire 2 year process; chairs did not force a clash earlier
• Vulnerable countries support China and Saudi Arabia in exchange for money
• Blocked majority voting (by OPEC) paralyses process
• US, China (plus India, Brazil, South Africa) now the real powers• Their current interest is not to have binding deep GHG reductions• China client states using process to counter developed country
positions
• Uncertain domestic legislation• Fixation on China and necessity to have trade sanctions in domestic
climate law forces China into defensive attitude (no commitments, no verification)
• Hypocrisy on binding others and demanding total freedom for US
• Zigzagging on legal outcome• Strategy too dependent on others (only -30% if others comparable,
keeping long-term finance till concessions of G77)• Not prepared for power play

WHY TAKING ACTION TO CONTROLCLIMATE CHANGE IS VERY URGENT
Controlling Climate Change 10

From Schneider, S., Nature, vol 458, April 30 2009, p 1104-1105
Climate change risks now seen as more serious
11Controlling Climate Change

From Schneider, S., Nature, vol 458, April 30 2009, p 1104-1105
Climate change risks now seen as more serious
Crop productivityin tropics reduced
Crop productivityin temperateregions reduced
Greenland Ice Sheet meltsIncreased
flooding/ droughts(millions)
Widespreadwater scarcity(millions
In-creasedrisk of forestfires
Large scale permafrost melt
12Controlling Climate Change

Where to draw the line and what that implies for GHG emissions?
00
Equi
libriu
m g
loba
l mea
n te
mpe
ratu
rein
crea
se o
ver p
rein
dust
rial(
°C)
GHG concentration stabilization level (ppmv CO2-eq)
00
Equi
libriu
m g
loba
l mea
n te
mpe
ratu
rein
crea
se o
ver p
rein
dust
rial(
°C)
GHG concentration stabilization level (ppmv CO2-eq)-5
0
5
10
15
20
25
30
35
2000 2010 2020 2030 2040 2050 2060 2070 2080 2090 2100
Wold
CO2 E
miss
ions (
GtC)
E: 850-1130 ppm CO2-eq
D: 710-850 ppm CO2-eqC: 590-710 ppm CO2-eq
B: 535-590 ppm CO2-eq
A2: 490-535 ppm CO2-eqA1: 445-490 ppm CO2-eq
Stabilization targets: Post-SRES (max)
Post-SRES (min)
-5
0
5
10
15
20
25
30
35
2000 2010 2020 2030 2040 2050 2060 2070 2080 2090 2100
Wold
CO2 E
miss
ions (
GtC)
E: 850-1130 ppm CO2-eq
D: 710-850 ppm CO2-eqC: 590-710 ppm CO2-eq
B: 535-590 ppm CO2-eq
A2: 490-535 ppm CO2-eqA1: 445-490 ppm CO2-eq
Stabilization targets: Post-SRES (max)
Post-SRES (min)
Copenhagen Accord limit

Mitigation efforts over the next two to three decades will have a large impact on opportunities
to achieve lower stabilization levels
Stababilizationlevel
(ppm CO2-eq)
Global Mean temperature
increase at equilibrium
(ºC)
Year global CO2 needs
to peak
Year global CO2
emissions back at
2000 level
Reduction in 2050 global CO2emissions
compared to 2000
445 – 490 2.0 – 2.4 2000 - 2015 2000- 2030 -85 to -50
490 – 535 2.4 – 2.8 2000 - 2020 2000- 2040 -60 to -30
535 – 590 2.8 – 3.2 2010 - 2030 2020- 2060 -30 to +5
590 – 710 3.2 – 4.0 2020 - 2060 2050- 2100 +10 to +60
710 – 855 4.0 – 4.9 2050 - 2080 +25 to +85
855 – 1130 4.9 – 6.1 2060 - 2090 +90 to +140

1990 1995 2000 2005 2010 2015 2020
55
50
45
40
10
65
60
44
61
Global GHG emissionsGt CO2e per year
Reference path-way "Business as Usual"
450 ppm pathway (with overshoot)
Low case of current proposals*
High case of current proposals*
Current pledges get us within 5 Gt of a 450 ppmpathway if nations deliver upper range of proposals
54
49
* E.g., 20% vs. 30% below 1990 emissions in the EU – taking into account the effect of the recession and lower expected emissions from deforestation and peat
Source: McKinsey Global GHG Abatement Cost Curve v2.0; Houghton; IEA; US EPA; den Elzen, van Vuuren; Project Catalyst analysis 15
Needed: 17 GT CO2eq/ yrbelow BAU by2020
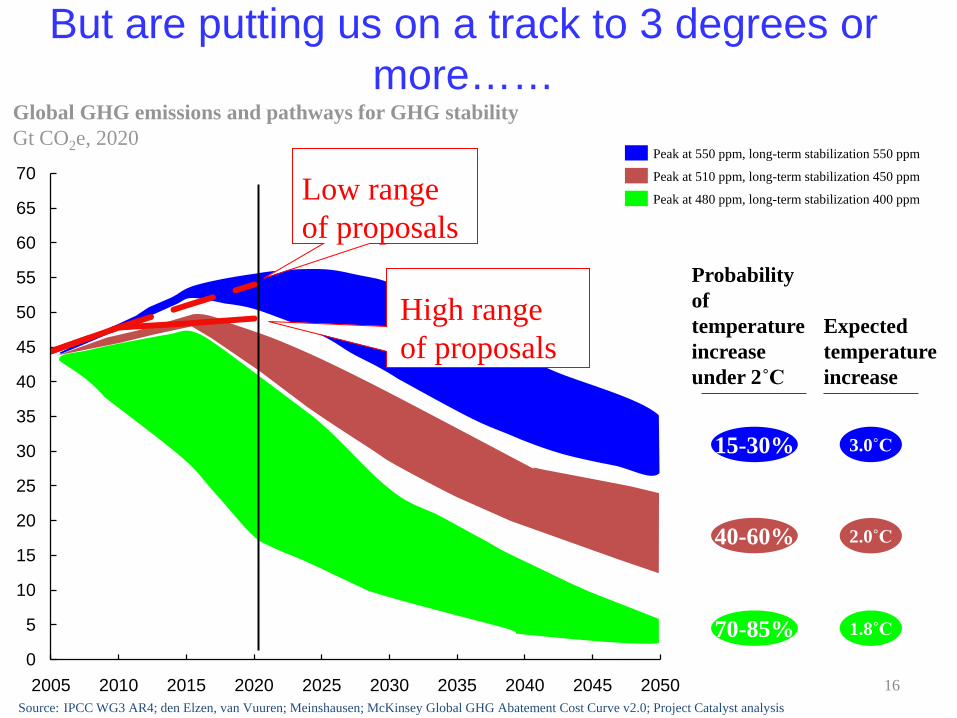
But are putting us on a track to 3 degrees or more……
0
5
10
15
20
25
30
35
40
45
50
55
60
65
70
2005 2010 2015 2020 2025 2030 2035 2040 2045 2050
Expected temperature increase
3.0˚C
2.0˚C
1.8˚C
Probability of temperature increase under 2˚C
15-30%
40-60%
70-85%
Low range of proposals
High range of proposals
Source: IPCC WG3 AR4; den Elzen, van Vuuren; Meinshausen; McKinsey Global GHG Abatement Cost Curve v2.0; Project Catalyst analysis
Global GHG emissions and pathways for GHG stabilityGt CO2e, 2020
Peak at 550 ppm, long-term stabilization 550 ppm
Peak at 510 ppm, long-term stabilization 450 ppm
Peak at 480 ppm, long-term stabilization 400 ppm
16

Implications for contributions by countries
Scenario category
Region 2020 2050
A-450 ppmCO2 –eq2)
Annex I -25% to -40% -80% to -95%
Non-Annex I 15-30% deviation from baseline in Latin America, Middle East, East Asia
Substantial deviation from baseline in all regions
B-550 ppm CO2 -eq
Annex I -10% to -30% -40% to -90%
Non-Annex I Deviation from baseline in Latin America and Middle East, East Asia
Deviation from baseline in most regions, especially in Latin America and Middle East
C-650 ppm CO2 -eq
Annex I 0% to -25% -30% to -80%
Non-Annex I Baseline Deviation from baseline in Latin America and Middle East, East Asia
IPCC, AR4, den Elzen and Hoehne, 200817Controlling Climate Change

Controlling Climate Change 18
Country pledges as of February 1, 2020 (source Ecofys/PIK/ClimateAnalytics)

HOW THE NECESSARY REDUCTIONS IN DEVELOPEDAND DEVELOPING COUNTRIES CAN BE REALISED
Controlling Climate Change 19
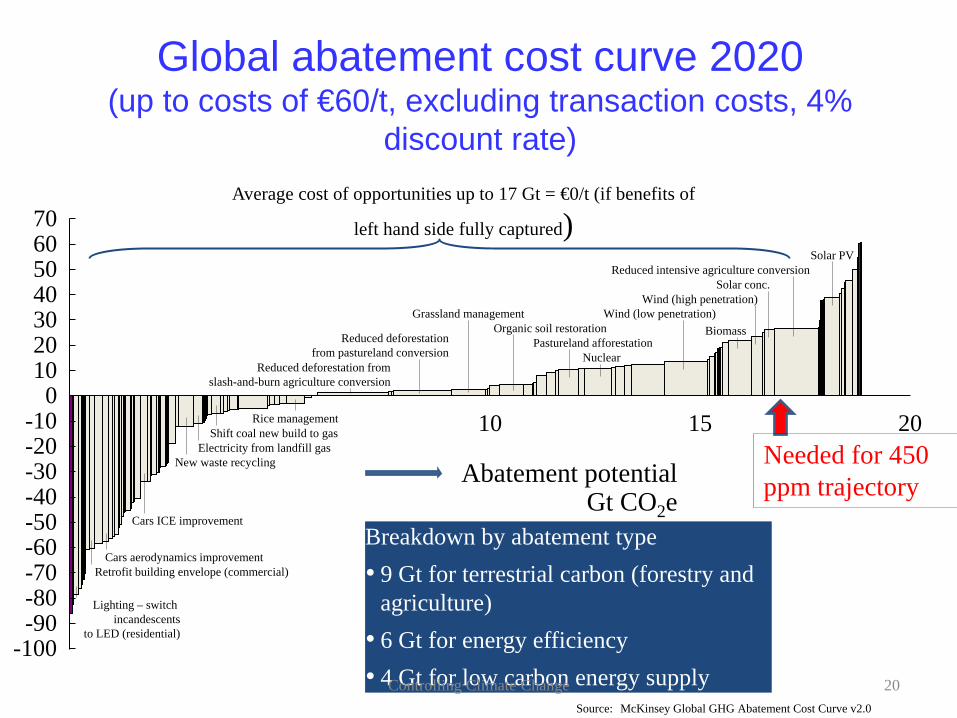
Global abatement cost curve 2020(up to costs of €60/t, excluding transaction costs, 4%
discount rate)
Nuclear
Wind (low penetration)Biomass
Wind (high penetration)Solar conc.
Reduced intensive agriculture conversionSolar PV
10 15
Abatement potentialGt CO2e
0
Organic soil restorationGrassland management
Reduced deforestationfrom pastureland conversion
Reduced deforestation fromslash-and-burn agriculture conversion
Pastureland afforestation
Rice managementShift coal new build to gas
Electricity from landfill gasNew waste recycling
Cars ICE improvement
Cars aerodynamics improvementRetrofit building envelope (commercial)
-10
-100
-20-30-40-50-60-70
70
-80 Lighting – switch incandescents
to LED (residential)
20
605040302010
-90
Average cost of opportunities up to 17 Gt = €0/t (if benefits of
left hand side fully captured)
Breakdown by abatement type• 9 Gt for terrestrial carbon (forestry and
agriculture)• 6 Gt for energy efficiency • 4 Gt for low carbon energy supply
Source: McKinsey Global GHG Abatement Cost Curve v2.0
Needed for 450 ppm trajectory
20Controlling Climate Change

Developing country abatement cost curve 2020
Energy efficiency, in buildings, transportation and industry
Emerging technologies
Source: McKinsey Global GHG Abatement Cost Curve v2.0 and project Catalyst
Agriculture and forestry
Developing country abatement cost curve, 2020 (up to costs of €60/t)
Power supply
8
Abatement potentialGt CO2e
0
20
40
60
-20 10 12 142 4 60
-80
-60
-40
Cost of abatement € / ton
1
2 3

How an equitable distribution of delivering 17 GtCO2eq reduction by 2020 can workRequired abatement for developed country target of 25%
Source: McKinsey Global GHG Abatement Cost Curve v2.0, Project Catalyst analysis
Potential abatement in developing countries
17
5
4
4
Developed countries’abatement <€60/t
Developingcountries’ abatement (NPV negative)
Required abatementfor 450ppm pathway
Flexible mechanism requiredto meet 25% target
5
Developing country abatement (NPV positive)
Support for incremental cost, e.g., concessional loans, grants, payments
Support for capacity building and loans for capital investment where required
Covering full incremental costs
3
17
22

Developing countries would need up to €65-100 billion/yr in incremental cost financing for 2010-20
Costs of 12 Gt of developing countries abatement
Adaptation cost (knowledge, planning and preparation, disaster management in all developing countries, climate resilient development in vulnerable countries)
Annual financing flows requirement for developing countries
Adaptation cost (climate resilient development in other developing countries)
35
5-30
7-117-11
~10-20
Required flows for abatementat cost to society*
10
Additional cost for higher developing country financing rate (10%)
5-30
Estimated transaction costs of €1-5 per tonne carbon abated
5
Financing need for high cost technology deployment
55-80
Total financing requirement for abate-ment in developing countries
2-9
Adaptation estimate**
55-80
2-9~65-100
Total financing requirement for developing countries
23Controlling Climate Change

DEVELOPMENT FIRST: WHYMAINSTREAMING CLIMATE CHANGE INTO DEVELOPMENT POLICY IS ESSENTIAL
Controlling Climate Change 24

Development and climate change
25Controlling Climate Change

Projected climate change Development path with
HIGH base emissions
Development path with
LOW emissions
2 degrees above pre-ind
26Controlling Climate Change

The response to climate change must be rooted in development
Development
Mitigation Adaptation
Climate-compatible
development
Climate-resilient
development • Development is essential for eradicating poverty
• Climate change can undermine development
• Low carbon and climate resilient development (“climate compatible development”) as the answer
Source: Project Catalyst 27Controlling Climate Change

Low carbon development is economically attractive
28Controlling Climate Change

• Modernising industry to become competitive• Improving energy security and reducing oil imports• Providing clean and efficient transport to people• Improving air quality to protect health• Ensuring a strong and sustainable agricluture and forestry
sector• Greening macro-economic policy• Providing electricity to the poor• Developing coastal regions sustainably• Building a good public health system• Protect nature and biodiversity
Mainstreaming climate change in development policies
29Controlling Climate Change

• Develop capacity for change• Start at the top• Coordinate actions• Climate proofing• Prepare long term low carbon, climate resilient
development plan (= green growth plan)
How to change development paths?
30Controlling Climate Change

Low carbon (and climate resilient) growth plans as a strategic instrument for all countries to plan their transition
Differentiation: Both developing + developed
Process: Ownership, participation, best practices, review,support,
Content: Priorities, transition strategies, policies/measures and international support•
Focus: Development, and mainstreamed mitigation + adaptation
LCGP (=low carbon/ climate resilient growth
plans)
Time horizon: Long term and short/medium term

• China:– Renewable Energy Law and the Tenth Five-Year Plan: reduce electricity sector
emissions by 5 % below BAU in 2020– Medium and Long Term Energy Conservation Plan:
• reduce cement sector emissions by 15 % below BAU levels in 2020• reduce iron and steel sector emissions by 9% below BAU levels in 2020
– Fuel efficiency standards for passenger cars, SUVs, and multi-purpose vans: reduce transportation sector emissions by 5% below BAU levels in 2020
• Brazil: – Program for Incentive of Alternative Electric Energy Sources (PROINFA):
reduce electricity sector emissions by 14 % below BAU levels in 2020– Brazil’s ethanol program (flex fuel vehicles and cost competitive ethanol):
reduce transportation emissions by 18 % below BAU levels in 2020– No net forest cover loss by 2015– GHG emissions 20% below 2005 by 2020
Low carbon development, examples
Source: CCAP, 200632Controlling Climate Change
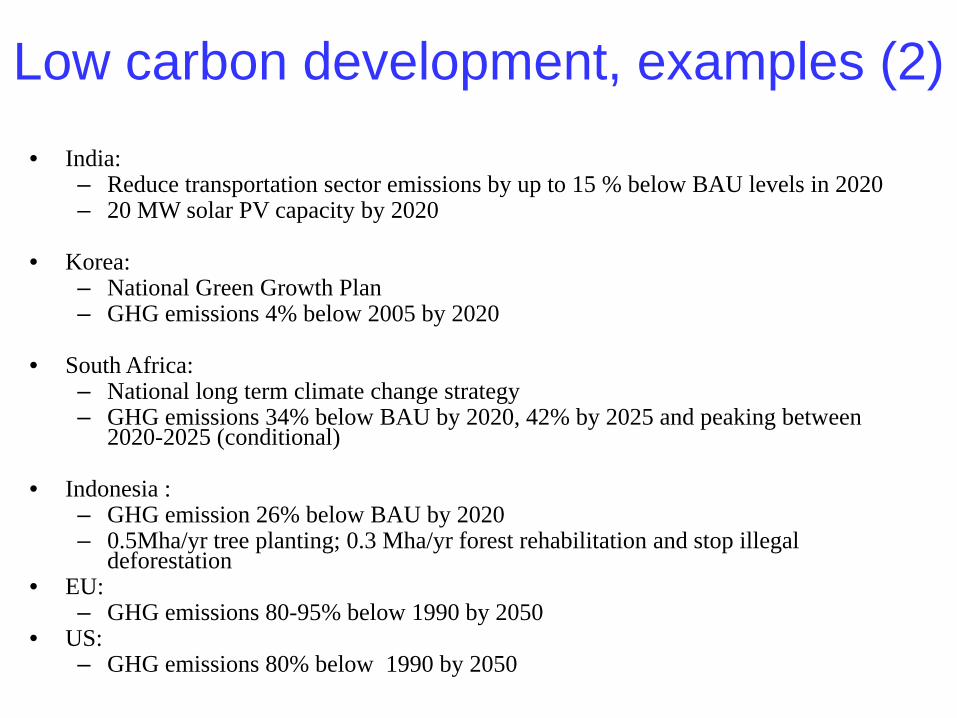
• India: – Reduce transportation sector emissions by up to 15 % below BAU levels in 2020– 20 MW solar PV capacity by 2020
• Korea:– National Green Growth Plan– GHG emissions 4% below 2005 by 2020
• South Africa:– National long term climate change strategy– GHG emissions 34% below BAU by 2020, 42% by 2025 and peaking between
2020-2025 (conditional)
• Indonesia :– GHG emission 26% below BAU by 2020– 0.5Mha/yr tree planting; 0.3 Mha/yr forest rehabilitation and stop illegal
deforestation• EU:
– GHG emissions 80-95% below 1990 by 2050• US:
– GHG emissions 80% below 1990 by 2050
Low carbon development, examples (2)
Source: CCAP, 2006

TECHNOLOGY TRANSFER
Controlling Climate Change 34

Technology follows investment
Energy efficiency, in buildings, transportation and industry
Demos/ investment in emerging technologies
Source: McKinsey Global GHG Abatement Cost Curve v2.0 and project Catalyst
Agriculture and forestry
Developing country abatement cost curve, 2020 (up to costs of €60/t)
Support to overcome barriers Support to compensate incremental costs
Support to compensate incremental costs,internationalcooperation
Power supply
8
Abatement potentialGt CO2e
0
20
40
60
-20 10 12 142 4 60
-80
-60
-40
Cost of abatement € / ton
1 2
3
GrantsCarbon marketLoans
Grants
Technology follows investment

• Major mechanisms:– Foreign Direct Investment– Export driven modernisation– Domestic green growth
• Supporting measures:– Regional centers of innovation– Investment Facilitation and Insurance– IPR licensing and protection promotion
• R&D:– Increase public R&D funding– Joint R&D centers– Joint demonstration programs
Technology transfer and development
Controlling Climate Change 36

IMPLICATIONS OF COPENHAGENFAILURE
Controlling Climate Change 37

What are the reasons for the Copenhagen failure?
38
Power has shifted
UNFCCC process ineffective
US domestic politics
EU lacked vision
• G77 interpretation of Bali Action Plan prevents effective outcome (blocks one new Protocol)
• Top down role of AWG Chairs (and COP presidency) blocked over entire 2 year process; chairs did not force a clash earlier
• Vulnerable countries support China and Saudi Arabia in exchange for money
• Blocked majority voting (by OPEC) paralyses process
• US, China (plus India, Brazil, South Africa) now the real powers• Their current interest is not to have binding deep GHG reductions• China client states using process to counter developed country
positions
• Uncertain domestic legislation• Fixation on China and necessity to have trade sanctions in domestic
climate law forces China into defensive attitude (no commitments, no verification)
• Hypocrisy on binding others and demanding total freedom for US
• Zigzagging on legal outcome• Strategy too dependent on others (only -30% if others comparable,
keeping long-term finance till concessions of G77)• Not prepared for power play

• Unclear how UNFCCC process can deliver ambitiouslegally binding treaty by COP16
• MEF/G20 not accepted• Focus may shift to like-minded country actions:
• REDD • Fast-Start Finance for adaptation and mitigation• Technology development• Policy coordination
• National actions become more important, and trademeasures more likely (self interest)
• Moving towards “low carbon prosperity” paradigm to unlock the situation
What are possible implications?
39Controlling Climate Change

THE CASE FOR POLICYCOORDINATION
Controlling Climate Change 40

We know what are effective policies
• Energy supply:
• Transportation:
• Buildings:
– Reduction of fossil fuel subsidies
– Taxes/ carbon charges
– Cap and trade systems
– Feed-in tariffs
– Renewable energy obligations
– Producer subsidies
– Fuel economy/ CO2 standards
– Biofuel blending obligations
– Taxes/ charges/ tax credits on vehicle purchase, registration, road use, parking
– Investing in public and non-motorised facilities
– Land-use and infrastructure planning
– Building codes
– Demand side management
– Appliance standards
– Public sector procurement
– Energy Service Companies41
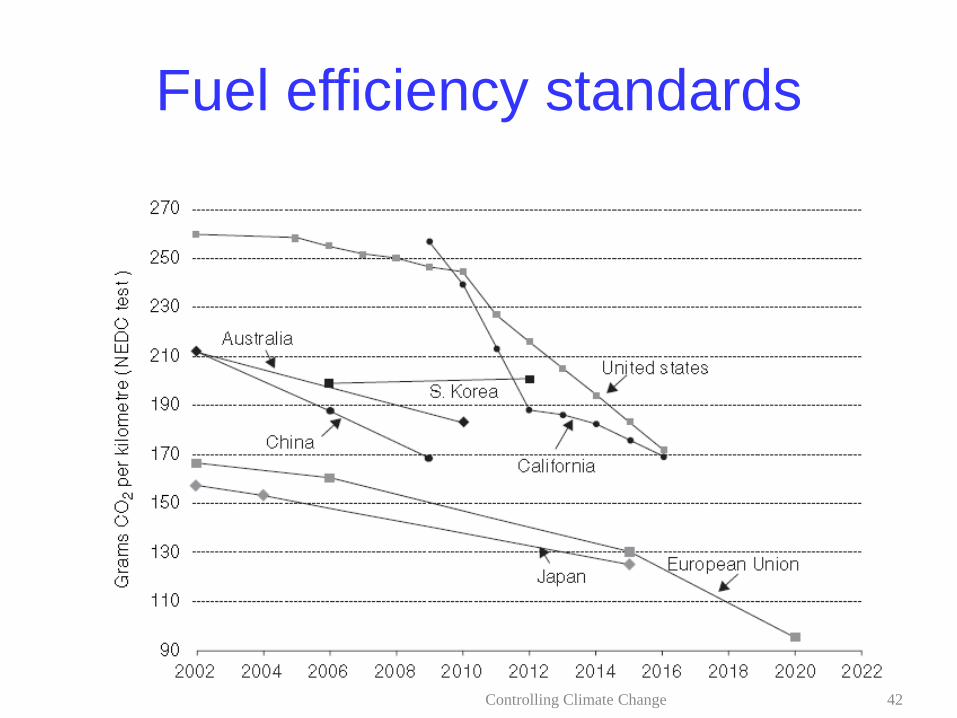
Fuel efficiency standards
42Controlling Climate Change

Building codes
43Controlling Climate Change

For more information:[email protected]
http://www.cup.cam.ac.uk/catalogue/catalogue.asp?isbn=9780521747844
Top Related