


Languages
Pages
Legal

CONTROL OF BRIDGE SCOUR BY SPUR DIKES
A Report for
Co E. 422 - Hydraulic Research(3 Credit Hours)
by
Robert Po AprnannSyed Mo Ali
Submitted to
Professor J 0 Bo Herbich
Bethlehem., Pennsylvania
May, 1962
ACKNOWLEDGEMENT
The present laboratory study is a part of the project on
spur dikes being conducted by the Hydraulics Division of Fritz
Engineering Laboratory~ Lehigh University, and sponsored in
part by Messrs. Modjeski and Masters, Consulting Engineers,
of Harrisburg, Pennsylvania 0
The authors feel deeply indebted to Professor J~ B.
Herbich, Chairman of the Hydraul~cs Division, for his kind
guidance and va'Iuable suggestions throughout the studyo They
are also gratefUl to Mrs. Nedalyn Stuart for her meticulous
typing', Mr o Elias Dittbrenner, and the Technical Staff of
Fritz Engineering Lab-oratory for their technical assistance 0

1.
3.
CONTENTS
INTRODUCTION
REVIEW .OF LITERATURE
PRE,VIOUS RESEARCH AT LEHIGHUNIVE,RSITY
RESEARCH PROGRAM
RESEARCH PROCEDURE AND APPARATUS
1
3
6
8.
10
6. ANALYSIS OF DATA
Dimensional AnalysisUse of the Continuity Equation
7 0 TESTING OF 600
SKEWED ABUTMENTS
1720
Obs ervationsConclusionsDesign, Recommendation
232526
8 0 TESTING OF 90° APPROACH FLOW
Performance Criteria andIndicators
ObservationsMathematical AnalysisCurved Dike TestsConclusions
90 MOVEA.BLE BED MODELS TESTS
2629333639
GeneralObservationsConclusions.Design Recommendation
39414748
10. SUMMARY
RESEARCH RECOMMENDATIONS,
49
50

LIST .OF FIGURES
Number Title Page
1 Typical Scour Pattern at Abutment 2
2 Definition Sketch for 90° Skewed Abutment 12
3 Definition Sketch for Skewed Abutment 13
4. Ott Current Meter Calibration Chart 14
5 Multipurpose Tank 15
6 Data Sheet 16
7 Definition Sketch for Coordinates 18
8 Deer'ease in Effective Opening 22
9 Curved Dike Attached to 600 (both sides) 27
10 Transrnis sien Effectivenes s 34
11 Percent Reduction in Mean Velocity 35
12 Velocity Gradient 37
13 Velocity at Head of Dike 38
14 Velocity Distribution with Curved Dikes 40
15 Grain Size Distribution 43
16 Depth of Flow versus Discharge 44Depth of Scour' vers'us Discha,rge
17 Contour Plot without Dikes 45
18 Contour Plot with Dikes 46
19 Best Shape for Curved Dikes 51
CONTROL ,OF BRIDGE SCOUR BY SPUR DIKES
1 0 INTRODUCTION
The hydraulic design of bridge openings is som.etimes
limited to finding the waterway area for a mean non- scouring
velocity; for the sake of economy some bridges are built to span
only part of the width of a stream and so constrict a major portion
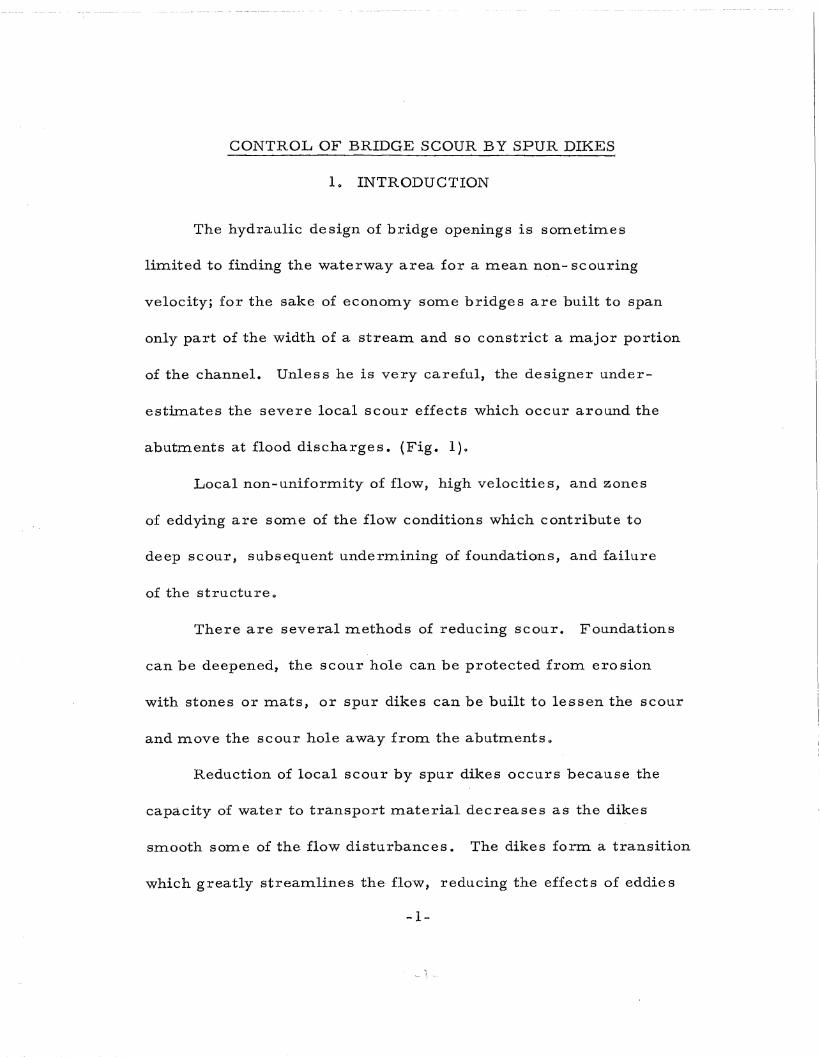
of the channel. Unless he is very careful, the designer under
estimates the severe local scour effects which occur around the
ab.utments at flood dischar'ges. {Fig. 1)0
Local non-uniformity of flow, high velocities, and zones
of eddying are some of the flow conditions which contribute to
deep scour, subsequent underlnining of foundations, and failure
of the structureo
There are several methods of reducing scour. Foundations
can be deepened, the, scour hole can be protected from era sion
with stones or mats, or s'pur dikes can be built to lessen the scour
and move the scour hole away from the abutments 0
Reduction of local scour by spur dikes occurs because the
capacity of water to transport material d.ecreases as the dikes
smooth some of the- flowdisturb.ances. The dikes form a transition
which greatly streamlines the flow, reducing the effects of e.ddies
.... 1-
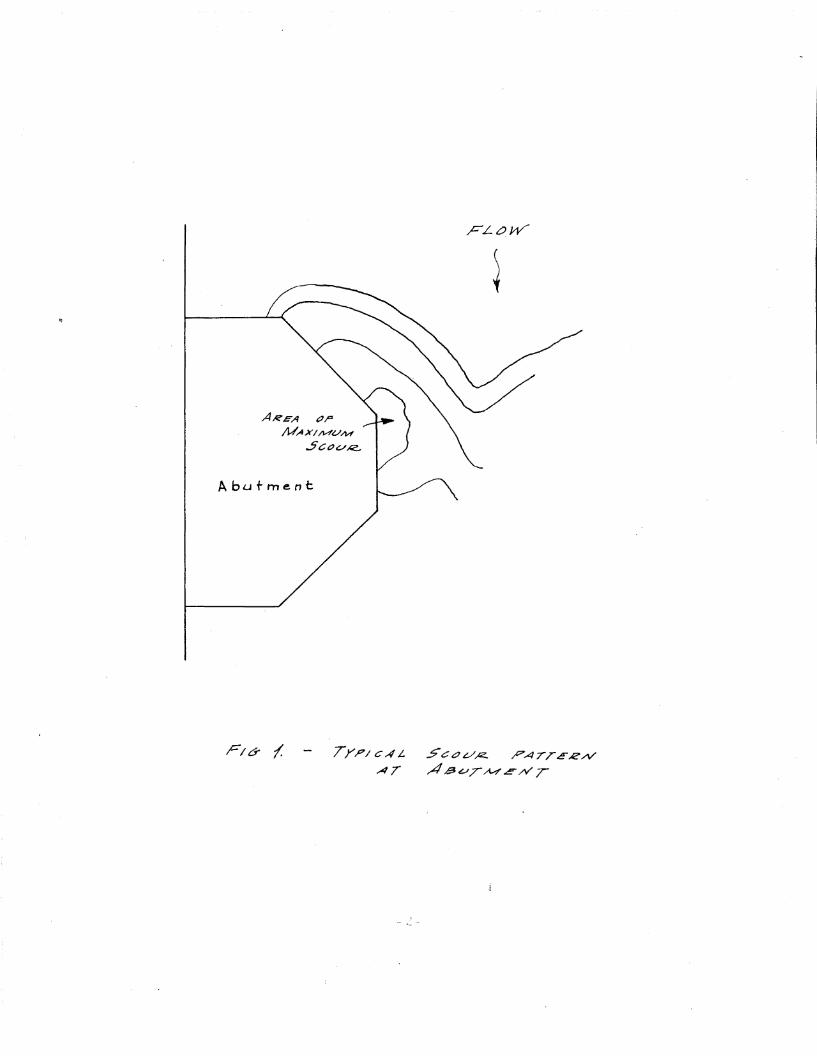
AJi?'EA t'r'
MAX//V'fU...w
.5cov~
Abutment
TYPICAL.
AT5ct:Jv/Z.. ?ArTE£/\/
A ,6JvTA.4'e/V T

and separation, and creates more uniform flow conditionso Spur
dikes also decrease the backwater depths upstream from. the con--
striction.
2. REVIEW OF LITERATURE
1)*The book, "GREA.TBRIDGES OF THE WORLDII, shows that
the cutwater, a form. of spur dike, has been used for centuries by
bridge designers. The Old London Bridge, completed in 1209, used
cutwaters to smoothly guide water, ice, and debris through the
narrow waterway openings; Oriental culture of the same period
conceived and built the wooden cantilever bridge of the type at
Srinagar" fudiao Most of these bridges were built on a soft
foundation which scoured easily, and the solution to er'osion was
the cutwater built around each pieroAnoth~r safety factor was
included" the building of piers of stacked logs forming an ope·n
network. During peak flow periods the river flowed through the
open piers\1
R,esearch on bridge scour has been done both to study the
scour phenoInena and to find lTI.eans to reduce scour.
Some early laboratory studies to understand scour were
carried out in 1873 in France and 1894 in Germany. In this country,
the Iowa Institute of Hydraulic Res-earch started working on the
):cSuperscript numerals refer- the reader to the bibliography at theend of the report.
-3-
problem. in 1947 and, after extensive research~) found ways of
predicting scour depth at the bridge pier 8-0 that foundations could
be de,signed accor'dinglyo Unfortunately, very little work was
done on abutments 0
It was found that depth of scour was independent of the
velocity of flow and the sediment size. However, it increased
with increased depth of flow and was proportional to the degree of
disturbanceo Rounding of abutment corners reduced the scour
depth. It was also s'uggested that an attempt should be made to
decrease the velocity in the vicinity of the abutITlent.
3)Professor Posey studied the scour around a pier in the
Rocky Mountain Hydraulic's Laboratory an,d introduced a unique
way of studying the effects of turbidity by observing its action
through a transparent pier made of glass. An a.dvantage in the
m.ethod was that the depths of scour could be instantly and accurately
determined, eliminating the changes which occurred after draining
the water from bed o In the same laboratory) experiments were
made with flexible mat around the pier and was shown that scour
can be reduced to a considerable degree therebyo
Along with these studies of pure understanding and evaluation
of scour phenom.ena, som.e work was done to reduce this scour by
-4-

using spur dikes 0 Initiating research in this country was the
Georgia fustitute of Technology:) where work was done on timber
dikes, showing the ability of spur dikes to improve the effectiveness
of the bridge openingo For spill-through type abutments, a dike 00 08
as long as the width of opening placed at a distance of O. 08 W from
the be-ginning of the abutment curve and at an angle of 0° to the
flow proved to be the best. No m.ention of discharge or percentage
opening was made"
Colorado State University and Lehigh University started
working on spur dikes almost siInultaneously. In contrast to
Colorado State University studies with moveable bed models, Lehigh
University worked with a fixed bed modelo
Using an elliptical dike, it was found out at Colorado51hat a
dike with ratio of 2-1/2: 1 gave the best resultso It was also found
that depth of scour at the abutment was inversely proportional to
the length of dike" It was als'o noticed that scour depth was a direct
function of embankment le~gth, or percentage contractiono Design
criteria were given for spiIl-thr'ough type ab.utmentso Knowing
discharge and length of em.bankment, a chart gives depth of scour
against length of dikps" A very limited study was rna.de of 45°
skewed openingso The depth of scour decreased with increase of
length of dike in ca-s-e of downstream skew, but for upstream. skew,
-5-

length of dike seeme,d to have no effect on the depth of scour o
6)Carle and Kable at Lehigh first studied the effects of dikes
7)on flow through bridge openings, and then Kable went ahead and
produced a curve giving length of dike against abutment opening.
8) .'Using a fixed bed, Hartzel and Kareymyr used spur dikes
to obtain uniform distribution of velocity. It was s.een that dike
10 cm away from. the abutment and 10° angle gave best results.
However, thes"e tests were not conclusive.
3. PREVIOUS RESEARCH AT LEHIGH UNIVERSITY
A review of previous- spur dike research at Lehigh is necessary
to understand the current re~-earch program. Three resea,rch
reports preceded the- start of the recent work:
Carle, R .• J.
Kable" J. Co
Herbich, J Q B 0
Apmann l Ro P.Ali, S. M.
THE EFFECT OF SPUR DIKESON FLOOD FLOWS THRO-UGHHIGHWAY BRIDGE ABUTMENTS
-THE DETERMINATION OF THELENGTH OF SPUR DIKES FORFLOOD FLOWS THROUGHHIGHWAY BRIDGE ABUTMENTS
STATUS REPORT OF RESEA,RCHPROJECT ON THE EFFECT OFSPUR DIKES ON FLOOD FLOWSTHROUGH HIGHWAY BRIDGEABUTMENTS 9)
6)Carle and Kable rep-orted the re suIts of tests of fixed bed
models of bridge abutments placed normal to the flow. For a
variety of flow conditions and abutment openings they obtained
-6-

velocity and depth data. They demonstrated the ability of spur
dikes to produce smoother flow conditions, and it was observed
the small stub dikes compensated for the eddying produced at the
downstream corners of the abutment by the addition of spur dikeso
It was argued by Kable71hat,
"if a spur dike can be extended upstream fro:m theab.utments until it intercepts a velocity which wouldnot cause scour a.round the dike itself, then. atransition could be form.ed which would channel theflow smoothly through the abutment opening 0 11
The velocity at which separation occurred at the end of dike was
taken to be the velocity which would just cause scour lJ Various
tests yielded a value of one foot per secondo Accordingly, calcula-
tions were made for various openings to fin.d the distance from. the
abutment upstream to a point where the velocity was just less than
one. foot per secondo FroIn these distances came a curve giving
length of dike versus width of abutment; the curve showed ,a need
for longer dikes with increasing width of opening.
Kable erred first in failing to realize that introducing spur
dikes into the flow changes its velocity and streamline pattern,
thereby negating'the entire basis for his determining the length
and s'hape of dike. He e.rred secondly in equating s,cour velocity
with separation velocitYq
-7-
40 RESEARCH PROGR,AM-
The ultimate objective of the present research was to pro
vide engineers with inforrn.ation to properly des-ignspur dikes 0
Leading to this objective was the more immediate goal of giving
direction to further research by determining the effects of flood
flow on selected abutment and dike s.hapes.
Because n,o analytical m.ethods were present for solving
the problem, it had to be attacked from an experimental view
point 0 -The choice of testing was between ,moveable and fixed bed
Inodels, the latter rn.ethod being' initially chosen for several
reasons; by eliminating SOITle g-eometric varia.bles the fixed h·ed
model simplified the problern.; by re.ducing the time ,and effort
taken for each test, the .rn.ethod allowed Inore tests to be rna.de;
the direction of moveable bed testing could be determ.ined by condi
tions" dev'eloped in fixed bed models Q
A general problem. exists in correlating the results, of tests
on fixed. bed and moveable bed modelso From answers obtained
in fixed bed tests, how can one foresee conditions in the moveable
bed test? In most case-s only qualitative relations- exist and for
each. exa,mple these relations need to be checked by performing
seve'ral tests under sim.ilar conditionso
-8-

The scour in a moveable bed model depends on various
things; flow disturbances, such as turbulent fluctuations and
eddies; and local non-uniformity of flow, velocity gradients and
changes in slope of the energy line. In a fixed bed model the
effects of these factors ~an be- seen by observing local disturbances
and measuring non-uniformity of velocities 0 For example, one
should expect deepe,r' scour at abutment corners and at the head
of dikes where large velocity gradients and depre.ssion of water
surface are encountered.
For the, fixed bed tests, we assumed the best effect of spur
dikes to be attained when a uniform. velocity distribution was
achieved across some important section of the openingo Con
sider'ation was also given to velocity readings m.ade at critical
points such as along and at the head of dikes 0 How well this
assumption was verified by actual testing in moveable bed models
is discussed in a later section of the report.
The research program was divided into two phases, one
in which 60° skewed abutments were tested, and another in
which abutme-nts placed normal to the flow were tested. In the
latt.er phase several moveable bed rn.odels were built to supplement
-9-
the fixed bed studies and check the assu,mption of identifying
uniformity of flow with erosive potential.
For 'ea,ah test phase, there were four significant parameters;
discharge, abutment opening, length of spur dike, and a dike angleo
For simplicity, one discharge, 3 cis, was chosen for all tests -
a discharge sufficiently large to yield severe flood conditions in
the prototypeo Also, most tests were run with straight dikes 0
P~imarily, tests were run for the following situations:
Skew Angle 60°
Lengths of dike:Dike Angle s:Abutment Opening:
18" 27 1f 36"0° 15° 30°
27-1/2 ff 41-1/21t 59-1/2"
Skew Angle 90°
Lengths of dike:Dike Angles:Abutment Opening:
iBtt0°
27-5/8"
27 1t
10°52-1/2 ft
36"20°
41-7/8"
In addition, tests were run without dike s for each opening.
50 RESEARCH PROCEDUR,E AND APPARATUS
Along with visual and photographic obs-ervations, velocity
and depth data were re-cor'ded. Readings were taken along the
centerline of abutments and at several p-oints along the dikeso
Some velocity and depth reading's were also taken upstreaITl in the
-10-'
channel centerlin,e. Because the flow variation was more con-
centrated near the abutments, velocities were rea,d at closer
spacings there. The 3 cfs discharge usually produced a depth of
about O. 4 feet at the center of abutments for a tailgate height of
2-1/2 ft •
In the previous reports, the effectiveness of using stub dikes-
had been shown, so that in ali the tests with spur dikes a stub dike
12 ft long was usedo Placenlent of the dikes is shown in the- de£ini-
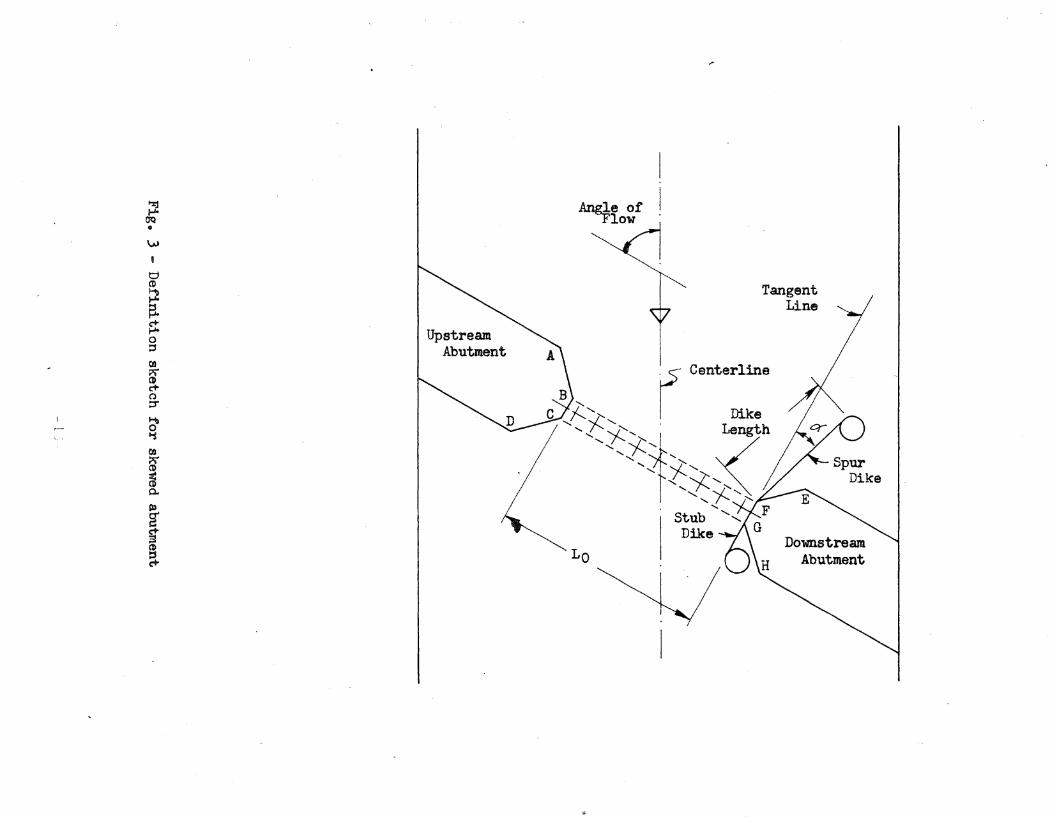
tion sketches, Figures 2 and 3 0
The spur and stub dikes" made of sheet metal, were ended
with 6" diameter circular concrete cylinders. A new rfOtt"
.Midget Laboratory current meter was put into service for which
the calibration chart is Figure 4.
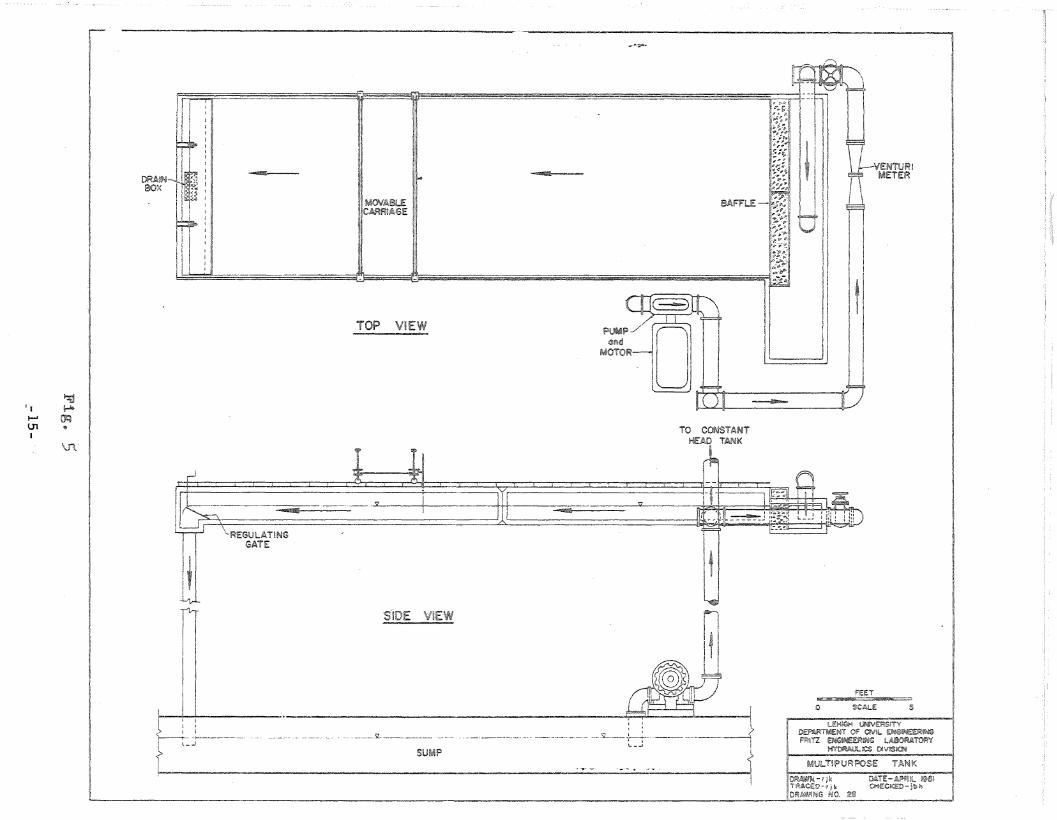
Figure 5 shows the multipurpose tank used for the experi-
ments. But, for the addition of an improved crushed stone baffle,
other fixtures are the same equipment used and, reported in
6) 7) 9)previous spur dike work.
Examples of the data taken are shown in Figure 6 \) The
remainder of the data is on file- in the Fritz Engineering Labora-
tory, Lehigh Universityo
-11 ....

Flow Direction
A
Tangent line
II Lo_'-----lI............I~Stub D
j-t- Dike
Dike
Length i
~.+++++1+-++++
MeasurementPoints
x
E
H
•.........---- L1' • 10 rest
oFig. 2 - Definition sketch for 90 approach now.
- 12 -
DownstreamAbutment
TangentLine
~ Centerline
I DikeLength
i-~:{....... !"'~;.....
" ~......... ;--...... Stub ...... " F
Dike - G
I
Aruzle of I"-1?low
La
UpstreamAbutment
w,tjco~~c+,...-a::scoPrCDc+o::rt-\o'1coX""CD
~0.
p.,
[~CD
~
to::!f-J
CiQ•

6 4 3 2 1 o
~Cl
,.... ~
~
HCD
~~
r-IOJ
8~~
~j
Velocity in f.p.s.
Fig. 4 - OTT Current Meter Calibration Chart
.- 14-
~
I
I
II
"
i
VENTURIMETER
~lCS Ol\l~~
'FEET!!@
C SCALE 5
~ULTIPUR?OSE TAN I( 1~~~AW~-fj~ DArE-AP-~l!- M~
I ~.A.C€D-q~ CHECv.ED-.lb0J J,DRM..li/\;JG ~jO. 2~ ,..",,,,,J
HI I
, I_ 1j I
11 I IflU~
BAFFLE
TO CONSTANT
PUMP-../'end
MOTOR
~
VIEWTOP
___________ -",L ..~~ ._ _ . __ " _" : :SUl4P ---- ,-,-- ;,,;,'Q--t::':t ---------- --------~==- ----.:.:::..::;.-..-~___:..::.:...:....---'" ~-".~._--iI
___-'iL i ~;! "Pl I~~:ililll@fl J -_._--ttt ll!li!lI: 11'~::,,~m, 1.\::::- _ j ,,-, ',' _
f1
II, I
L_J jl : ~
I ~ _1--------t--- --:I l_..J
L _
ri
I
\11
~\'. ~
}-l (JqU1 9
I


6. ,ANALYSIS OF ,DATA
60 1 Dimensional Analysis
In designing the research projects and analyzing data, it was
natural to turn primarily to the ,methods of dimensional analysis-,
for the complexity of the problem prohibited the use p£ the purely
mathernaticalmethods I) Dimensional analysis yielded parameters
which enabled quantitative reduction of empirical data o
The variables involved were:
Geometry
x,y,z
Dynamics _
= Shape of Dike
= Shape of Abutment
= Angle of Abutment Skew
= Angle of Dike
= Waterway Width
.~' Width of Abutment Opening
= Length of Dike
= Coordinate Axe-s- (See Fig. 7)
v
fv
=
=
-17-
Velocity
Velocity Distribution

y
x
RIG H T
Dimensionless Coordinates: xlLo ' z/Lo
Fig. - Definition sketch for coordinate axes.
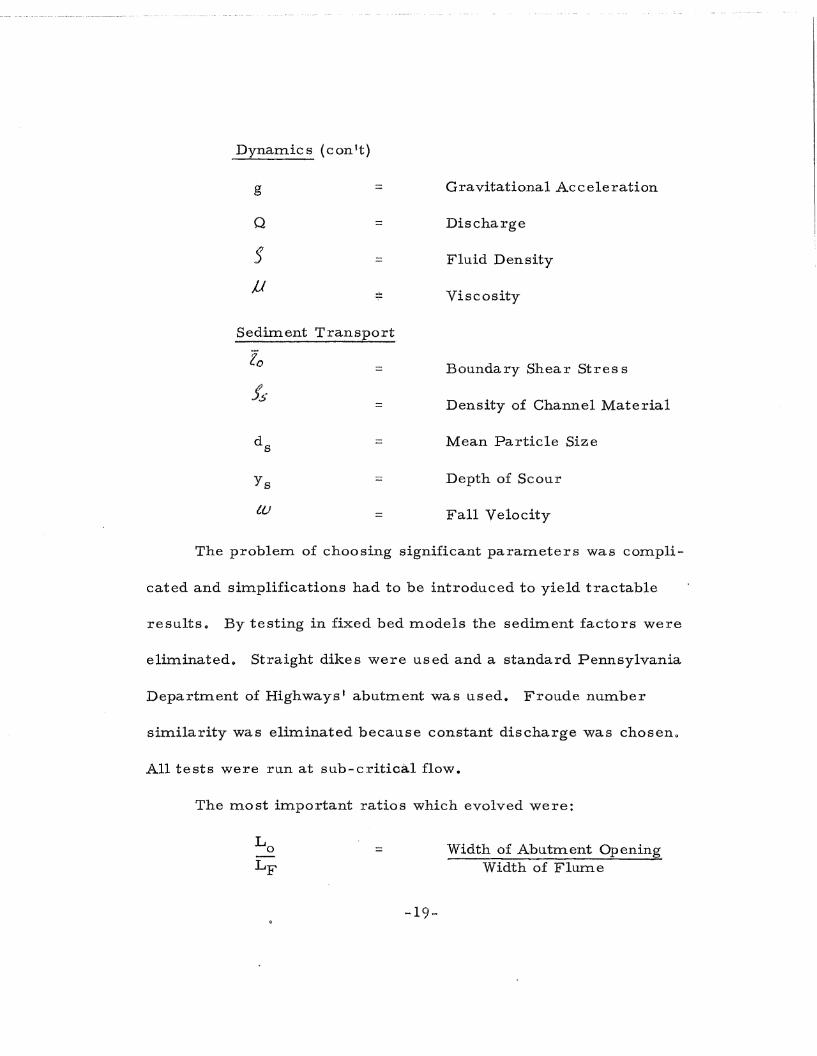
Dynamics (can't)
g
Q
Sif
=
=
=
Gravitational Acceleration
Discharge
Fluid Density
Viscos.ity
Sediment Transport.
1a= Boundary Shear Stres s
fs~Density of Channel ,Material=
d s = Mean Particle Size
Ys = Depth of Scour
tu = Fall Velocity
The problem. of choosing significant parameters was compli-
cated and simplifications had to b,e introduced to yield tractable
resultso By testing in fixed bed models the sediment factors were
eliminated~ Straight dikes were used and a standard Pennsylvania
Dep'artment of Highways' abutment was used. Froude number
similarity was eliminated because constant discharge was chosen o
All tests were run at sub-critical flow.
The most important ratios which evolved were:
=
-19-
Width of Abutm.ent OpeningWidth of Flume

X
La
vVo
=
=
=
=
=
Length of DikeWidth of .. Abutment Opening
WidthWidth of Abutment Op'ening
LengthWidth of Abutm.ent Opening
Velocity at a PointUniform Approach Velocity
Velocity at a Point with Dike sVelocity at a Point without Dike s
6 0 2 Use of Continuity Equation
For alr,ectangula.r channel the continuity equation may be written.
Q = Vby,
where Q = discharge, V = m.ean velocity over the section, b =width,
and y = depth.
When the equation is written in terms of naturalloga,rithrrls,
it is 1 nQ = 1 n V + In b + In y,
and when differentiated, we have
dQQ
= dV-'V+ dlb
b= dy
y
If the discharge is constant, as in our tests, then dQ = o.
-20-

Thus., dV +dyV y
=dbb
In a uniform flow situation, the velocity and depths are con-
stant over the whole eros s- section. Altho.ugh in the testing this
did not actually occur, sufficient data was taken to ena,bIe the, deter-
mination of mean velocity and depth over the centerline cross-sectiono
Thus, ,after some computation, it was pos,sible to treat the channel
as one of uniform flow.
In a cha,nnel the width of flow calculated on the basis of
uniform velocity and depth ma.y not be the sam.e a.s the actual width
of the channelo Because of turb.ulence, eddying, separation, and
convergence of streamlines, the efficiency of transnlission or
conveyance of the chann.el will be decreased.
When spur dikes are added to the channel contraction the
effectiveness of conveyance increases, because the spur dikes
channel the water into smoother flow patterns (Fig. 8)0 If the
effective width of the channel without spur dikes is called b o and
the effective width of the channel with spur dikes is called b, then
the difference between the two is
b - b o ;:: nbo - bo' whe.re n is a ITleasure of the effective
ness of transmission of the channelo The diffe-rence will be positive,
-21-

Eddy
EffectiveOpening,b
Actual OpeningLo
Fig. 9 - Decrease in effectiveness of actual abutment opening, Lo»due to separation and eddies.
) ,0,\
--. G t'~ ._-
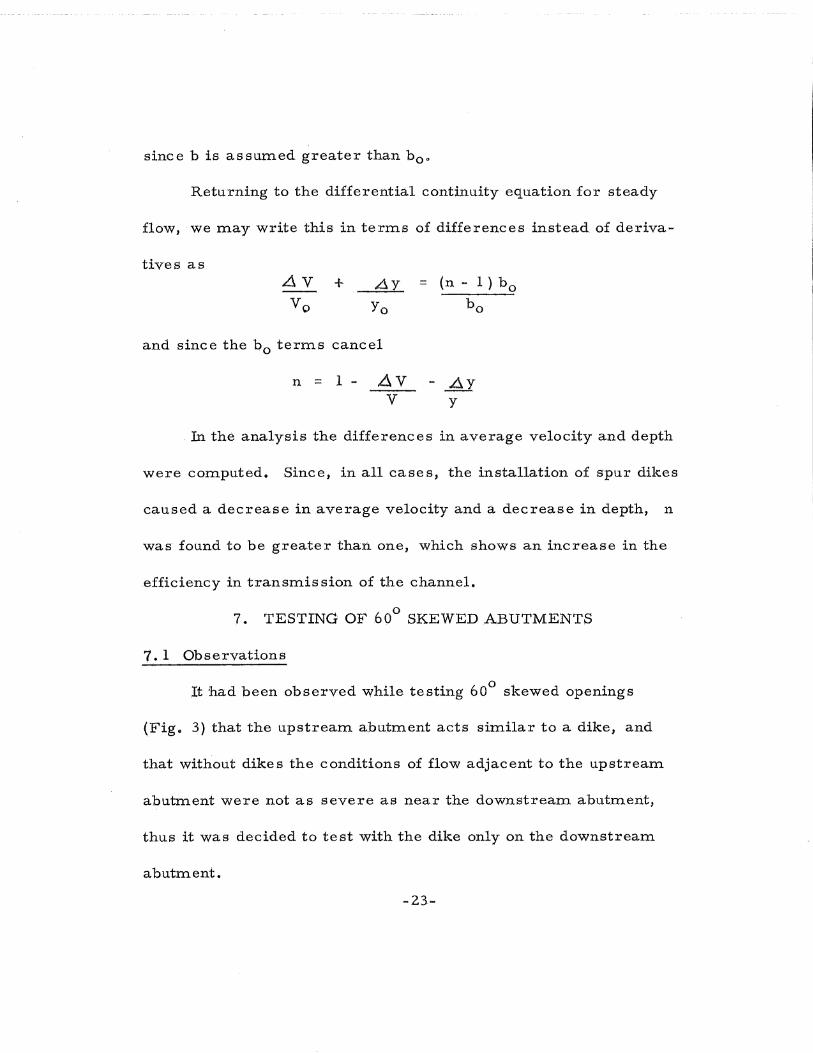
since b is assumed greater than bOl)
Returning to the differential continuity equation for steady
flow, we may write this in terms of differences instead. of deriva-
tives as.L1 y = (n - 1) b oYo b·o
and since the b o terms cancel
n = 1- AVv
- 4Yy
. In the analysis the differences in average velocity and depth
were computed. Since, in all case s, the installation of spur dikes
caused a decrease in average velocity and a decrease in depth, n
was found to be greater than one, which shows an iner'ease in the
,efficiency in transmis sion of the channel.
7. TESTING OF 60° SKEWED ABUTMENTS
7. 1 Observations
oIt Ihad been observed while. testing 60 skewed openings
(Figo 3) that the upstream abutment acts similar to a. dike, and
that without dikes the conditions of flow adjacent to the upstream
abutment were not as severe as near the downstream ab.ut.rnent,
thus it was de-cided t.o test with the dike only on the downstream
ab.utment.
-23-

Three ope-nings (27 -1/ 2 1t , 41-1/ Zit, and 59 -1/ 21t ) were te sted
with three lengths of straight dikes (Ld = 18", 27 r" and 36")0 Angle
oe.. was varied from 0° to 30°, but after one test it was found that
e;,t... =,30°, produced local high velocities and eddying, at Point F.
After that only two angles,o . 0
0'< = 0 and e><... == 15 , were teste.d o
oBecause the flow is more complex than the case of 90
ap.proach, velocity measureme.nts along one line x-x (centerline of
abutment) would have been insufficient, thus velocities were also
taken along the line B-F and C'-Go
Observations showed that using a dike only on the downstream
a.hutment, while irnpr'oving th_e conditions of flow on the downstream
side, worsene.d the conditions on upstr-earn side as compared to
flow condition without any dike. It was seen that the narrowed is
the opening the ,more pronounced is this effect. For a wide opening,
a spur dike on the downstream side did not change the flow near the
upstream abutm.ento
Noting th,e improvement ca.used by a dike on the flow in the
vicinity of the downstream. abutm.ent, it was decided to lYlake tests
with dikes on both sideso Two openings (59-l/2 1f , 41-1/2 1t ) were
used. ,It was found that dikes on both. sides produce much more
-24-
favorable flow as com.pared to dike on one side"
7. 2 Conclusions
In testing one straight spur dike atta,ched. to the downstream
abutment, analysis of data led to the following conclusions:
1) There is no significant difference in the action of the
different lengths of dikeo Some m.inimum length of dike exists,
but this length cannot be found from the datao
2) The effect ,of different dike angles is s:-.mall, but as the
opening increases the angle should be slightly increased!) While
ozero angle is better for the narrow openin,gs, 15 is best for the
widest.
3}As the opening decrea-ses the dike effect becomes more
prono-unced on the upstream (ri,ght) side in increas.e of velocities,
while the velocity reduction on the left is about the salne for' all
openings.
4) Spur dikes us.ed only on one side could be detrimental
by causing locally higher velocities in the severely constricted
case.s.
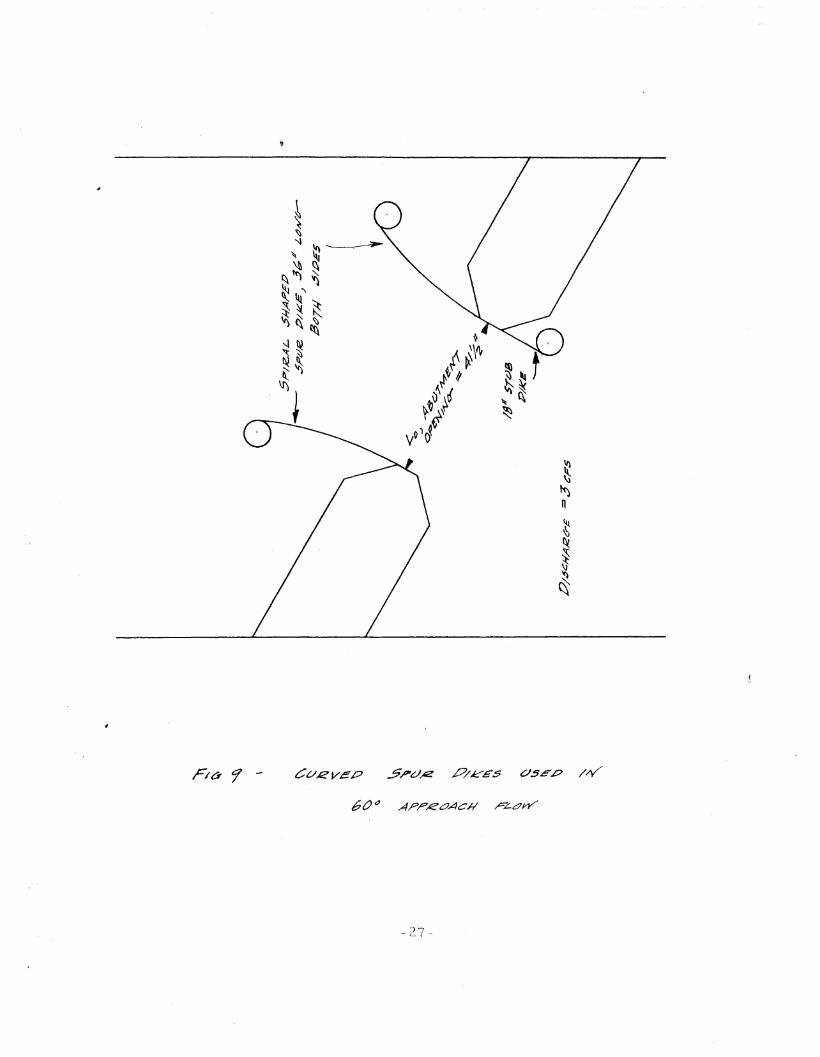
After testing two dikes. attached to the abutments and shaped
as in Fig"o 9, two more conclusions were drawn:
5) The shap.e and placement of dikes is highly importanto
-25-

6) The use of dikes on both abutments significantly lowers
the velocities on the upstream abutment. Their action on the
downstream abutment is not too different from the use of a single
dike. In addition, a very uniform velocity distrib.ution is obtained
with the curved dikes.
7. 3 Design Recommendation
In placing spur dikes on 60° skew ab:utrnents, it is recolnrn.ended
that two dikes be constructed (Fig. 9). T,he downstream dike
should be only very slightly curved and the upstream dike given
lnore sharp curvature o Bothm.ust b,e built tangent to the ab·utment
faceo A spiral curvature will be satisfactory.
8. TESTING OF 90° APPROACH F,LOW
80 1 Performance Criteria. and Indicators'
The pe.rformance of spur dikes should be measure.d on the
ability to limit scour abo~t abutments and dike s to a safe value t
for when a dike is built it become-s a part of the whole bridge
structure and thus should be so designed that it not only shields
abutments from excessive scour but is itself stable.
Unlike moveable bed models, the fixed bed model is unable
to denJ.onstrate the performance by amounts of scour and deposition
-26>-
at significant points in the model; some different indicators ITlust
be chosen. to analyze the effectiveness of dikes" Four indicators
measured the perfortnance of dikes in the fixed bed models:
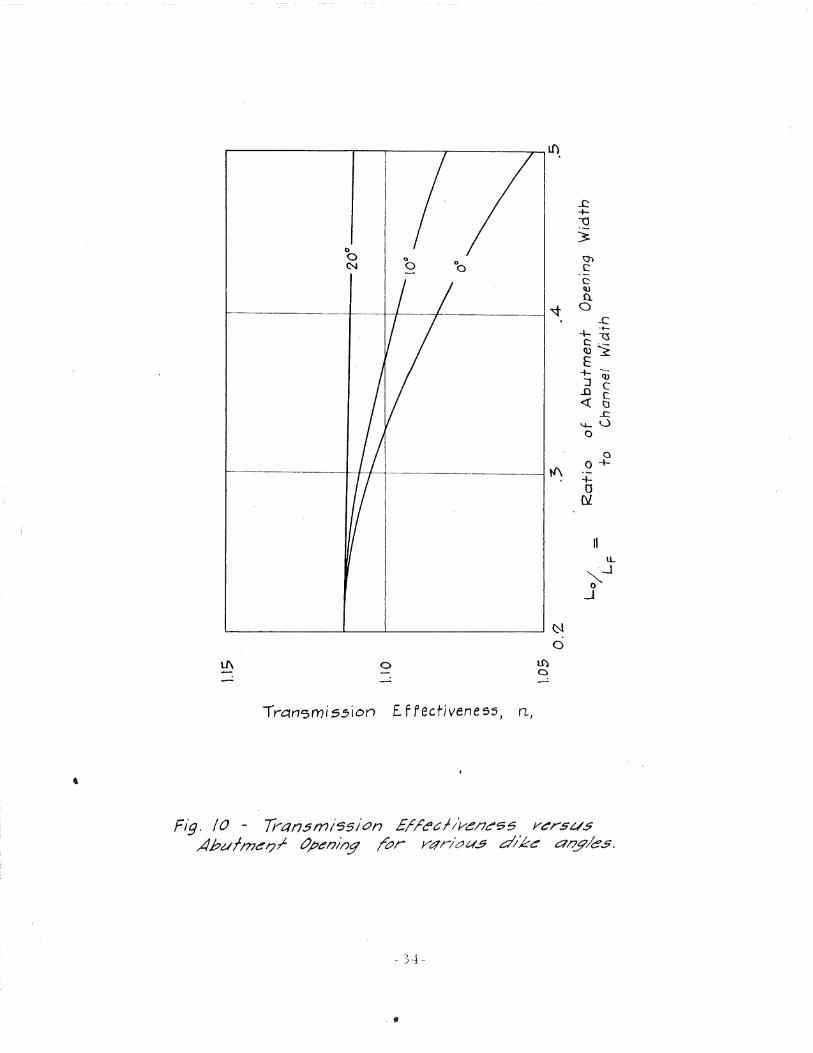
1. Transmission effectiveness, no
2. Reduction of m.ean velocitie s along the
centerline of abutments.
3 0 Velocity distribution along the abutment
centerline 0
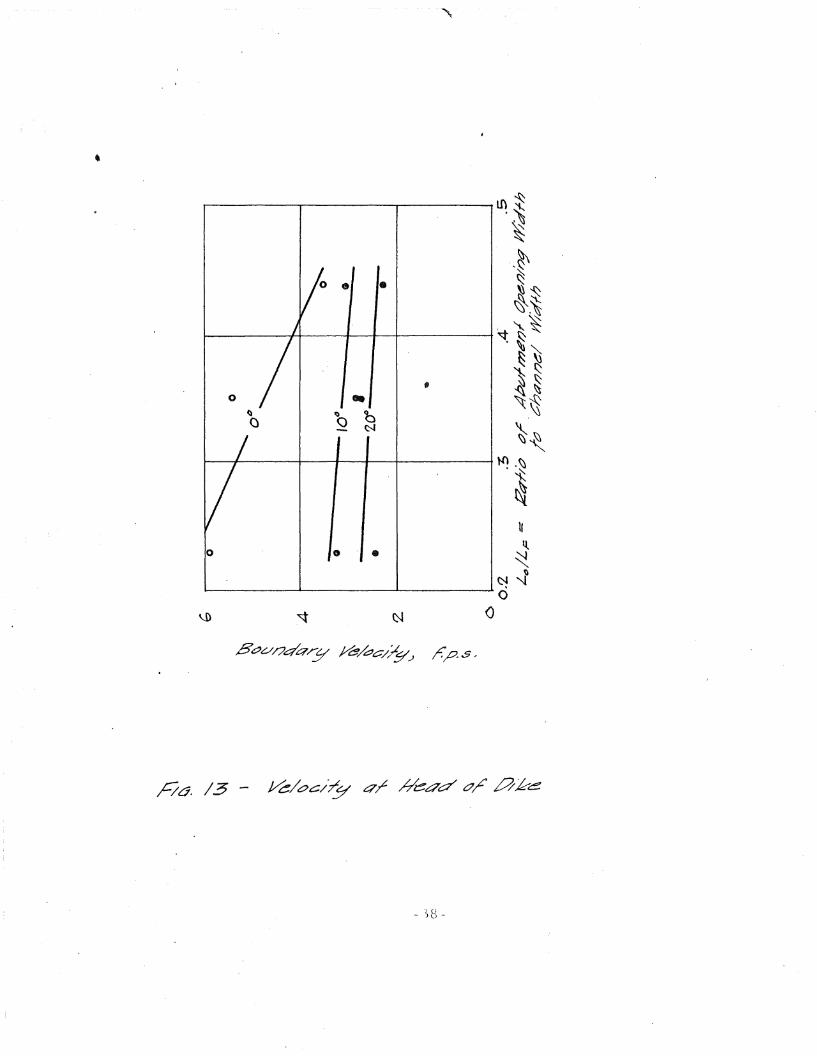
4. Velocity at the head of the dike.
The first indicato,r, transmission effectiveness, n, was.
derived in a previous section of the report from considerations
of continuity ofrnass flow. It describes the change. in effective
width of the flow passage a.fter b.uilding spur dikeso Values of n
greater than 1 0 0 indicate an, increase in effective width of ope.ningo
Referring to Figure 8, one sees that the parameter is related to
the effect of eddie s on the flow 0
The second indicator, reduction of mean v"elocities along the
ab.utment centerline, shows the ability of dikes to generally lower
velocities in that section. However, it does not. show whether one
or an,other spur dike configuration produces the lowest absolute
-28-
mean velocities orwheth.er the postulated desirable uniformity
of velocity ha,s been achieved. For this reason, the velocity distri
bution along the abutment centerline should be considered as an
important indicator; an indication of velocity uniformity comes
from ratio of Inaximum to minimum velocitie s mea,s-ured in th,e
centerline section. The lo.west value of the ratio is indicative of
na.rrowest range of velocities and thus the rn.ost uniform. distribu
tiono
The first three indicators w'ere measured across the center
line of abutments, that se.etlon being in the critical a,rea of
abutment scour and thus of great importanc,e o Sta.bility of the
dike is also important and the velocity at the head of the dike
wasrneasured and considered an important indicator of conditions
in that area.
8 0 2 Observations
Visual and photographic observations showed the occurence
of similar flow patterns in all the tests Q While the phenomena were
sim.ilar, the degree of severity seemed to depend on, the angle at
whic.h dikes w·ere placed.
Three significant phenomena developed in the rnodelI
-29-

1. An abrupt change in water surface elevation occurred
at the head of dike (Photo Noso 1 and 2). It was here that the
flow direction was rapidly changed by the model geom.etry; this
resulted in high velocities and, curvature of streamlines. The
effect diminishe,d when the dike angle 0< was inc.reased, since
that produced a wider mouth for the constriction and the flow
transition becam.e less abruptQ
2. The depression of water surface where dike wa,s
attached to the abutment (Photo No~ 3) had similar causes; the
geometric dis.continuity at that point caus.ed high velocities.
Again, the amount of water surface depres sian depended on dike
angle. When 0< = 0, there was no depression (Ph.ota Noo 2)
since the dike joined the abutment by a tangento By)increasing
dike angle, the depression was inc.reased; when 0< = 45 1 that is,
when no dikes were p.resent, the depression was greatestQ
Thus, an inverse relation exists between water surface
elevation at these two points 0 When the dike angle is increased,
co-nditions are b-ettered at the head of the dike, but worsened at its
point ofi.ntersection with the abutment o
3 q Eddies were generated at two points in the m.odel: the
-30-

Photo No. 1 - Showing Flow Conditions at Head of Dike
Photo No. 2 - Showing Flow Conditions at Head of Dike
and Top of Abutment
-31-

Photo No. 3 - Showing Flow Conditionsfor c/.... = 20 0
•
-32-

head of dike and at its intersection point with the abutment. As
discuss.ed before, the extent and intensity of the eddies interferred
with th,e efficient passage of fluid through the constriction. The dike
angle <><. affected the eddy formation in the same m.anner as it did
to the water surface depres sion. That is, increasing the angle
decreased the am.ount of eddying from. the dIke head, but increased
the eddying from the intersection point.
8. 3 Mathematical Analysis
In Figure 10 the tra.nsmis sion effectiveness, n, is plotted for
various abutment opening widths. For smaller percentage openings
the three dike angles tend to be equally effective in increasing the
efficiency of the openin,g. However, at the large openings the. curves
diverg"e and one sees that a 20° angled dike, in yielding a constant n,
is more useful in this respect than zero degree angled dike o
The pe,rcent reduction in mean velocity was calculated by
1 _ Mean Velocity with D1.kes .. ) x 100Mean Velocity without Dikes)
for the cross-section at the abutment centerlineo From Figure 11,
we see that for the range in data all dikes reduced mean velocity,
but that each dike was- most effective in this res,pect at a certain
range of abutm.ent Q,penings.o
-33-
r--------.,---,------r--------1l)
.J::+--0
3:0a 0 enC'J 0 0
0 c:~c:un.
~0
-C4--t-c~Q.)~
E-+- -:J Q)
...Q c<t: §
...c::~0
Q
atl\
0++0
OJ.
IIu..
~-J0
-l
~
0
Ll\ 0 lJ)a- - -
Transmis.5ion Effectiveness, rl J
Fig. /0 - TrClnsmissiCJn £/;:~cf/'vel7~t55 f/~r5t/5
Abull?7~l'J.f Opening ;:Or vt1r/'c?t.I..9 aJke C7l7g/es.
- f!I

,..---r---_-~__---__---_Lf)
Ht7. // nrcC'l?/ &dvc//C:J/J //~ #~c?17 ;6ft,c/7dC;-C?55 4P~//J/~/?/ cJFd/?/~ wr Y4r/~?-'S cVk ;;~~3

Typical velocity distribution plots are shown in Figure 60
It is seen that, without dikes, the velocity is non- uniform and has
its highest values near the abutment. On the other hand, spur
dikes decre.ased boundary velocities and create.d !nore uniform
velocitie So
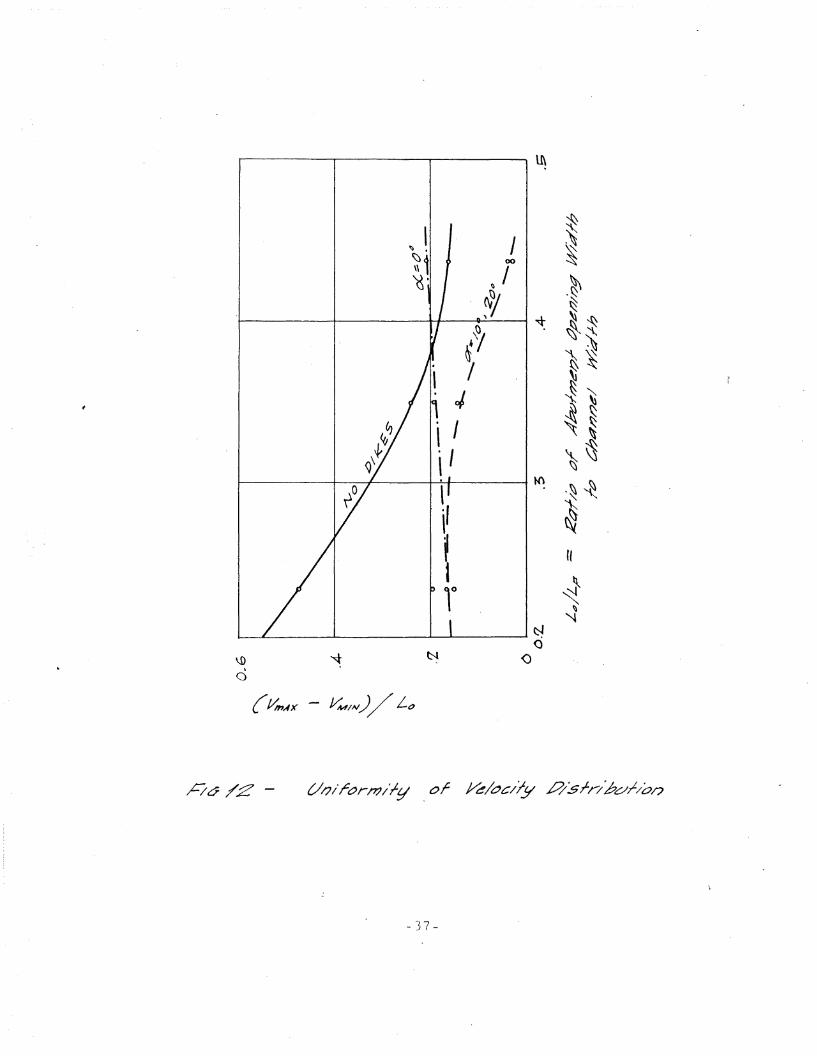
An .analysis of uniform.ity of velocity distribution is plotted
in Figur-e 12 0 The difference between maximum and ITlinimum
velocities measured across the ab,utme,nt centerline was divided by
the width of opening, thus yielding a mea-sure of the rate of change
of velocity across the section. The plot shows the more uniforITl
velocity distribution to occur with dikes., and particularly with
o 0dike angle s 10 and 20 •
The velocity at the head of dikes wasmea,s-ured and is shown
in FIgure 130 Except for zero-degree angled dike, the abutment
op.enin~g S.eerns unimportant, the dike an.gle being !nore significant.
It seems r'easonable to a-s sume that greater sco·ur would occur at
the he,ad ofa zero-a.ngled dike than in the other ca,ses.
8.4 Curved Dike Tests
The ob:servationsof flow patterns discus-sed in section -8. 2
s.ug'gested two improvements in dike s-hape; first, the discontinuity
-36-
.-------.---.---------- U\
t-lJ-----,lL..------ --L------L.------' <i
()
-37-
..
o
o
trIt~
t;)
~'.J'--------L--------l-----..Lo
()

at the abutment corner should be eliminated by making the dike
tan.gent to the abutment~ second, the dike should be curved gradually
from the tangent up·stream to its head. Besides providing a
gradually increasing rate of transition to the flow, a. curved shape
helps suppress the growth of eddieso
Indeed, when such dikes made in the shape of a spiral, were
tested, it was found that a very uniform velocity distribution
resulted (Figure 14) and eddies were virtually eliminated. From
the test r'esults it was decided t.o use this. shape in the moveable
bed rn.odel o
80 5 Conclusions
From the tests it was concluded that:
1) Of the st.raight dike configuration thos.e joining abutment
at angle C?< = 20 with the flow direction most nearly fulfilled
the performance crite.ria, altho-ugh they were only slightly as effec
tive as the spiral curved dike
2) The spiral curved dike joined to the a.butment by a tangent
was effective in fulfilling the performance criteriao
9Q MOVE.ABLE BED STUDIES
9.1 General
For- the moveable h,ed model tests a fairly uniform medium
-3.9-

7
sta.tion
6 5
70
so
Without dikes
36" Curved dike
2111 Curved dike
(a) Velocity distribution for different length curved dikes
Station
7 6
10
30
-- ....... _-, -- --. -- --.......--.,....
I
2.92 CFS
- - - - 2.50 CFS
--- 2.00 CFS
(b) Velocity distribution for different discharges
Fig. l.:'l - Velocity distributions' for cUr'Ved dikes.
-,4 c-

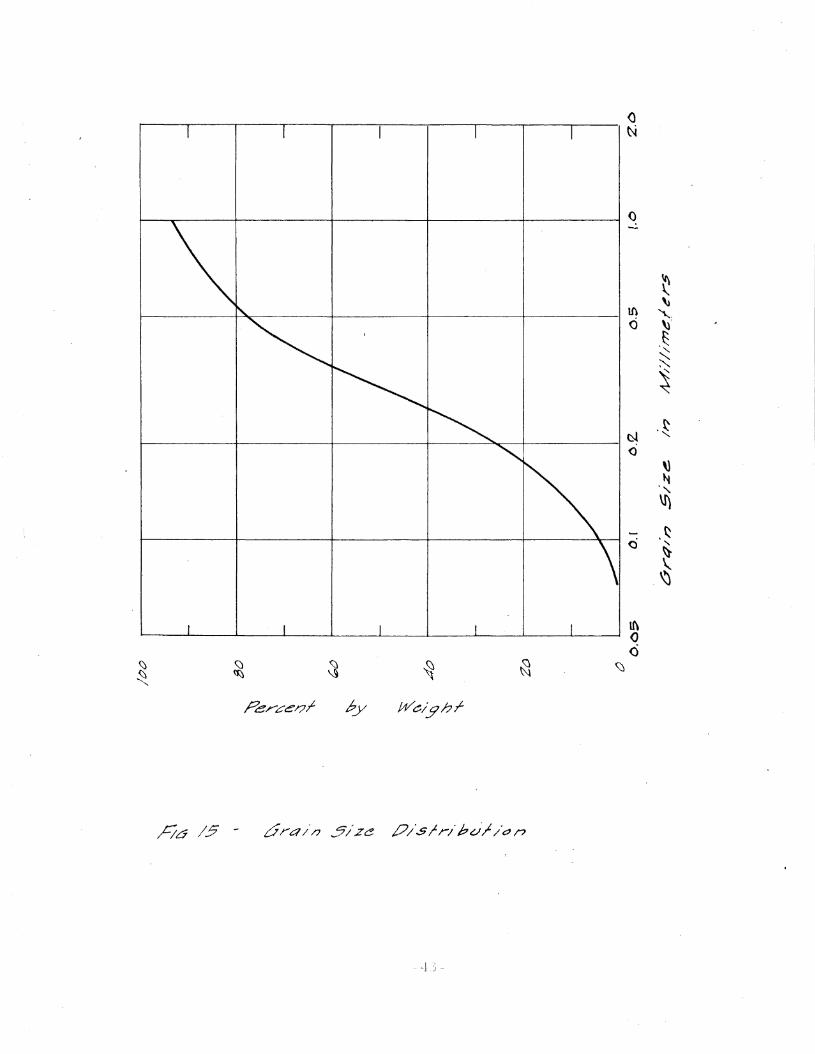
san,d ,(Fig<l 15.) waS purchased from a local supply house and the
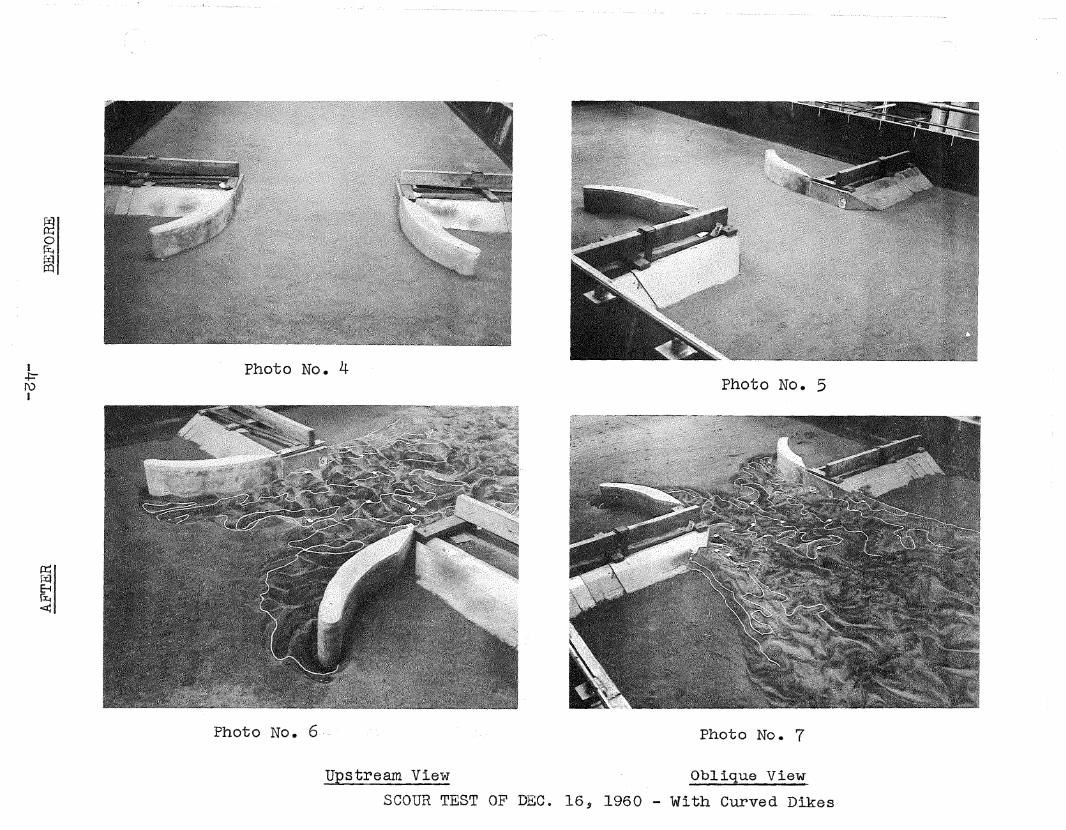
flume modified for the tests. A discharge (0.955 ciso) was chosen
which would just not s·cour the bed of the flume without the model
in place (Photo No.4). The tail ,gate was adjusted to give a depth
of 00 25 feet at the center of the abutrnento After running the model
until equilib.rium wa.. s reached (about two hours) wool yarn was used
to describ'e the conto·urs of scour and. deposition (Photo No. 5-7)0
In one s.pur dike configuration two discha.rges were used
(1.32 ciso and 0 0 955 cis.) and an analysis of scour depths was
orn.a.de o In the case of 10 angled dikes, it was found that the mean
depth va,ries- as. the 2/3. power of the discharge (Fig. No. 16). The
proportionality is the saxne found by Leopold and Wolman10)for scour
betw,een bridge piers on the Powder River> ,Arvada" Wyoming.
The local scour at the head of dikes was found to be proportional
to th,e discharge (Fig. No. 16).
9. 2 Obser'vations
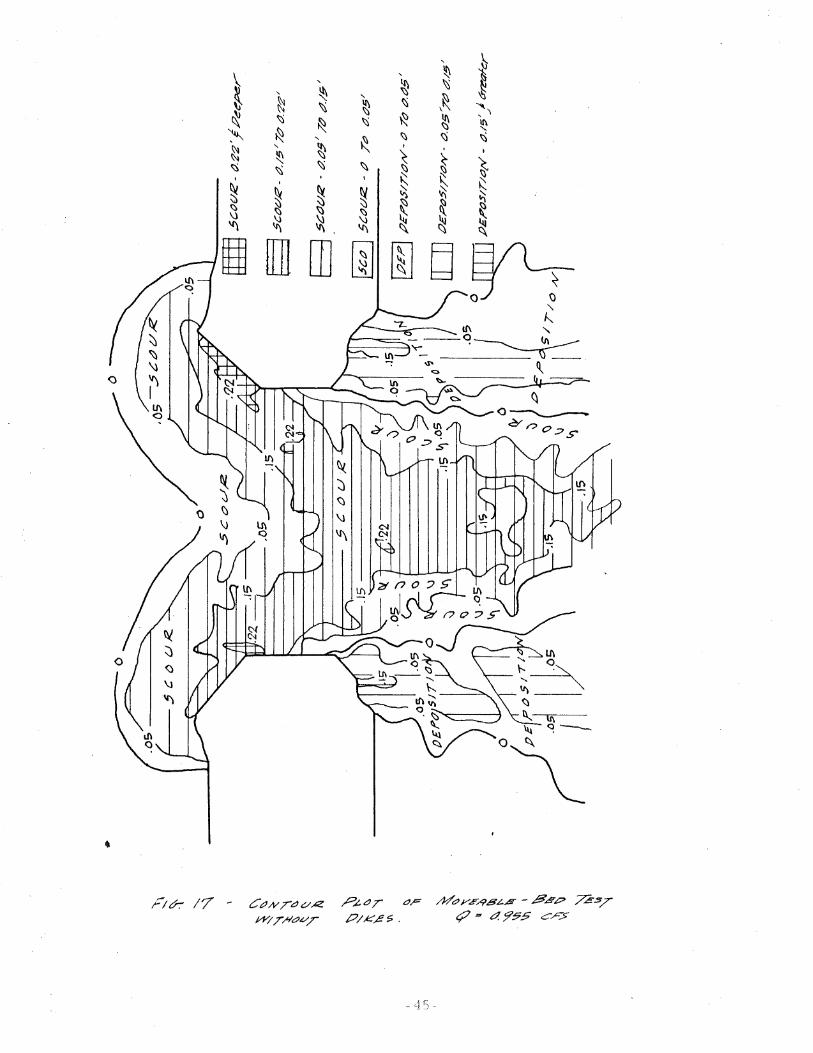
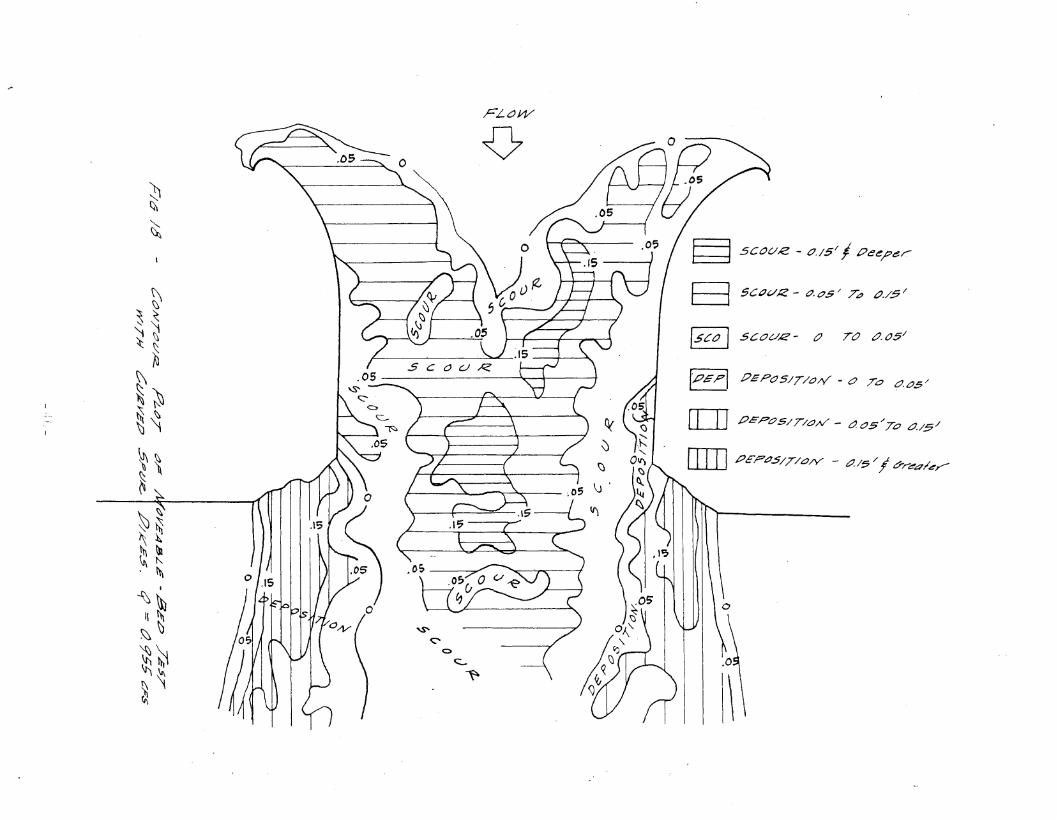
The contour plots which are shown in figures 17 and 18
readily describ.e the erosion patterns I)
It will be noticed that without dikes deep. scour occurred
along the abutments, pa.rticularly at the upstream corners of both
-41-
I+=f\)J
r:r1~oIXif:rl~
0::~E-tIi.<
Photo No.4
Photo No.6,"
upstream View
Photo No. 5
Photo No. 7
Oblique View
SCOUR TEST OF DEC. 16, 1960 - With Curved Dikes
()r-----r-----,----.-----r----.------;----r------,--------. ~
t-------.:-------ii--------+----.----+----~----~()
~\)
1l)
"0 \)'
.~~~
~
~.~
()
\)~
"
\I)
- ,~ti "
~U\00
~ <J ~ ~ ~ 'J~ ~
Perce.!?} Py WC:;/.9hr

0.4M~4n Pe/:'-h
cJ/ PawacrcJ.:7!!J4bv~m~/7/5
(reel)0.'2
()
.5 1.5
1.51.0,5
o __--:..------1------&...----------'
o
(/ee6)
Pe,Pfh of' r/awQf
Ht::qcl ,=,,,c P/:ke
04
Q
5c.C'L/r -- 17/5co a~.57e R~/~,t/·C)ns
MtJJ/~ t:?b/~ - gee! ~s/-.5
... b
R... ~
~" ~ ~.... ~~ " \~~ ~ ~
~ :"~ ~
~ ~ ~ ~ ~~ ~ " ~
'~ \) ~
~ " ~,
~ ~I
~ ~~ ~ ~ ~
I ~ K~
t
~~
~ ~ ~ ~ ~~
~ \)~ ~ ~ ~\l
~ ~, ~ ~"l 't\ ~
9 [ll OJ [ill ~
U\~ ----
~/V:" /7 - CPNTOVR
M'lT/7'c?V,r
~CJT ar A/OYF~8L..P-P.4P ~.57
P/K~$. cP::::I ~;?75 CF5
FL(Jj/J,/
§ SCOc/Z - 0./5/ I Peef7er-
fp.G",;,,"I PEPOS/T/PN - <:7 To o.ps/
B sc(lv.tz - o. PS / T~ c:1./.5/
TO tJ.CJ5//seo I SCOV2 - tJ
o=JJ PEPOS/T/PN - t:JPS"To 0./5/
OJ] PEP05/T/o/v - 0./5/1 ch-~d/er
v
'\oS'
<:'C)
C-
~
o
~~
~
~.
~~~ ~
~ ~· t\\~l
II ~~~
~~~ ~V\
~~~~ ~
~S\~~N ~~'i
~~~
abutments; in the fixed bedrnodel1ocal high velocities and
depression of water surface occurred at same corners. In contrast,
the curved dike considerably decreased the scour along the abut
ments o In both case's, deposition occurred at the downstream
corners, thus rem,oving the need for stub dikesG
A teet, run with straight dikes angled at 10° showed a
lessening of scour about the. abutments, but severe scour occurred
at the upstream end of the dikeB, while straight spur' dikes may
reduce the velocities. at different abutment sections" they do not
offer a continuous transition into the abutment, and in sharply
intercepting the flow they create locally deeper scour than original
abutment situation o Although in some cases it may be advantageous
to protect abutments by failure of a dike, it is alm.ost always a
waste of time and effort to construct dikes which a.re poorly
designed and offer little security.
9• 3 Conclusions
Further c.onsideration of the test of the spiral shaped dikes
leads to several conclusions:
1 0 The curved dike, in providing a smooth transition for
the flow was extremely effective in reducing scour effects at the
abutments. At some points" deposition occurred along the abutments
-47-

where, without dikes, scour would have developed.
2. Less scour occurred along the dike than occurred at
the acbutment corners- when the lnode! was tested without dikeso
3. Construction of a properly designed dike will signi
ficantly increase the safety of bridge abutments against scour
while producing a. safe dike o
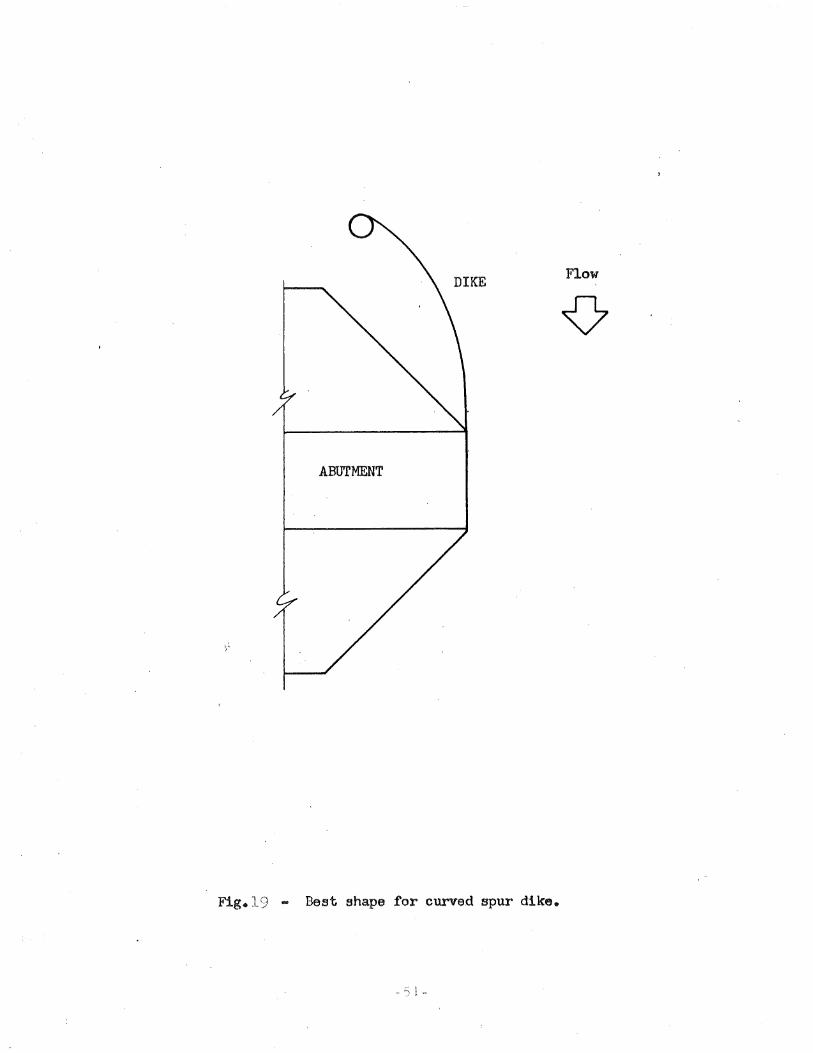
904 Design Recommendation
loA correct shap--e of curved dike eliminates eddying at
the head of dike, at the junction of dike and ab-utment" and makes
the velocities uniformo
2. Testing s-hows that a spiral is a suitable shape to ful
fill the requirements 0
3. The length of dike boy itself is not important. Length
is required to develop a certain shape. That shape is a curve,
tangent at the abutment, slowly turning away from. the main stream.
lines to a point having a distance of D-ne-tenth or one-eighth of the
full width of channel from. the edge of abutment.
4 q The dike shape should be determined for m.aximurn
flow to be expectedo This will give a satisfactory flow for lower
discharges.
-48-
50 Shape and length of dike depends upon dis.charge o In
case of high discharge, the shape of the dike should change very
gradually 0 This will m.ake the di.ke longer than for low discharge
where the transition nee,d not be so gradual.
60 It should be borne in mind that highe st velocitie s in
the transition would be along the dikes. Measures should be taken
against it while designing and building a dikeo
10. SUMMARY
Tests. of spirally shaped spur dikes attached to a. bridge
abutment model showed the p.otential of spur dikes. to protect the
abutment from. damage due to scour o Not only did the dikes
significantly reduce Jnaximum sea·ur depths, but they rn.oved the
points of deep s.cour away from the ab.utmentso
The assumptions made in the fixed bed rn.odel testing that
uniformity of flow and reduction of eddies p·roduced less scour
were verified by themove,able bed model testing.
oFor abutments placed normal to the flow and at 6-0 to the
flow1 the b.est shape of dike arrived at was a spiral. In both cases
it should be tangential to the ,abutment.o
It was found in 60 skewed
abutments that, for best results, dikes should be used on both sides
of abutments.
-49-
11 0 RESEARCH RECOMMENDATIONS
In further research on m.oveable bed models, answers
should be sought to the following questions:
1. What relation exists between prototype scour depths
and model scour depths?
2. For different abutment openings, what curvature and
m.inimum length of spiral dike will produce the optimum conditions?
-50-
..~
Flow
ABUTMENT
Fig.19 .. Best shape for curve,d spur dike.
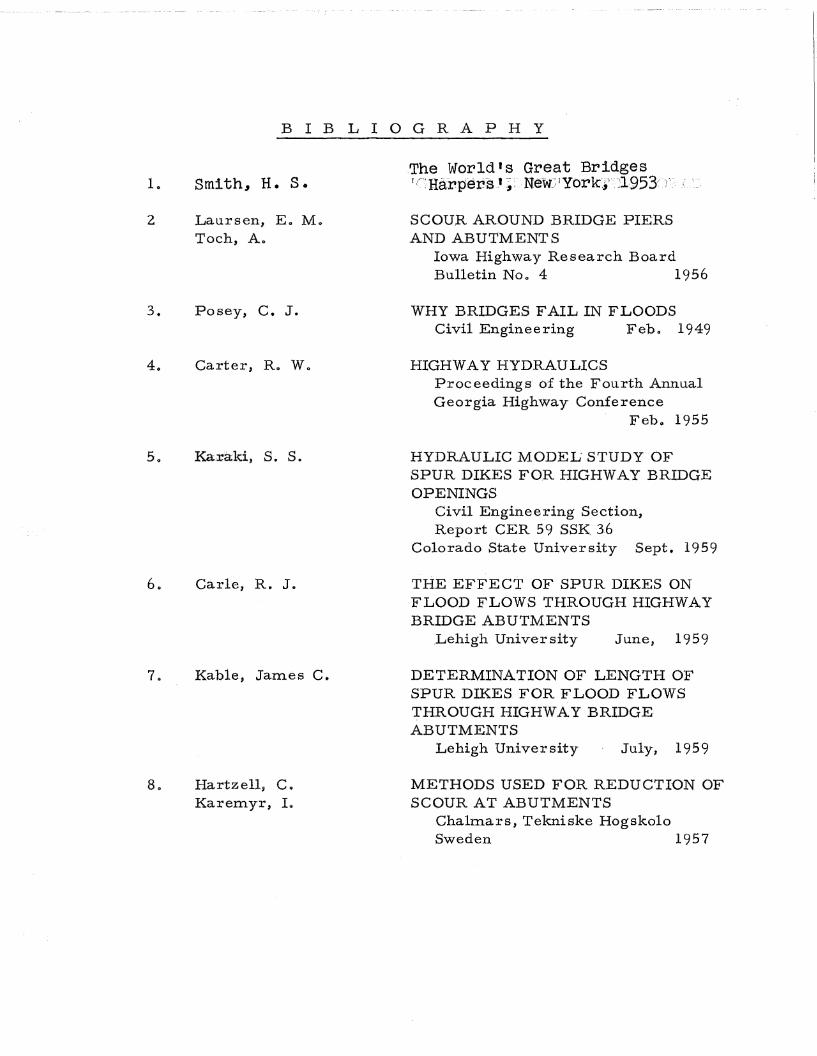
BIB LIOGRAPHY
2
3.
Smith, H. S.
Laursen, Eo M~
Tech, Ao
Posey, C. J.
Carter, Ro W 0
Carle, R. J.
Kable, James C.
Hartzell,9 CoKaremyr, 10
-The World's Great BridgesI r':'Harper:s.I~., NeW~'~ IYOrkr.~1·':Jl,953/>i'\:',
SCOUR AR,QUND BRIDGE PIERSA,NDABUTMENTS
Iowa Highway Research Boar'dBulletin Noo 4 1956
WHY BRIDGES FAIL IN FLOODSCivil Engineering Febo 1949
HIGHWAY HYDRAULICSProceedings' of the Fourth AnnualGeorgia Highway Conference
Febo 1955
HYDRAULIC MODEL' STUDY OFSPUR DIKES FO,R HIGHWAY BRIDGEOPENINGS
Civil Engineering Section,Report CER 59 SSK,3-6
Colorado State University Sept. 1959
THE EFFECT OF SPUR DIKES ONFLOOD FLOWS THROUGH HIGHWAYBRIDGE ABUTMENTS
,Lehigh University June, 1959
DETERMINA,TION OF LENGTH OFSPUR DIKES FOR FLOOD FLOWSTHROUGH HIGHWAY BRIDGEABUTMENTS
Lehi,gh University July, 1959
METHODS USED FOR R,EDUCTION OFSCOUR AT ABUTMENTS
Chalmars, Tekniske HogskoloSweden 1957
Herbich, J. B.Apman, Ro PoAli, So Mo
STATUS REPORT OF RESEARCHPR,OJECT ON THE EFFEC-T OFSPUR DIKES ON FLOOD FLOWSTHROUGH-HIGHWAY BRIDGEABUTMENTS
Lehigh University Feb-o 1961
10. Le-opold & Wolman PROFESSIONAL PAPER 252U 0 S I) Geological Survey 196-0

Top Related