


Languages
Pages
Legal


https://www.aigroup.com.au/resourcecentre/economics/
Construction downturn eases in January
2020 as house building activity improves
The Australian Industry Group/Housing Industry Association Australian
Performance of Construction Index (Australian PCI®) increased by 2.4
points to 41.3 points in January (seasonally adjusted), indicating that the
construction industry declined at a slightly slower pace at the start of 2020.
Results under 50 points in the Australian PCI® indicate deteriorating
conditions, with lower results indicating a faster pace of decline.
The milder decline in the Australian PCI® in January reflected less
pronounced reductions in activity and new orders. However, both
employment and deliveries from suppliers contracted at steeper rates.
Across the four sectors in the Australian PCI®, house building expanded
mildly in January, following stability in the previous two months (trend).
Elsewhere conditions were more subdued, with further falls in activity across
the apartments, commercial and engineering construction sectors.
There were positive reports from residential builders indicating that home
buyer demand is being supported by low interest rates and an easing in bank
lending restrictions. However, other building businesses noted ongoing
caution among prospective home buyers due to the slow and uncertain
domestic economy. Concerns were expressed about strong competition for
the available work and about bushfire-related disruptions to activity.
Australian PCI® (seasonally adjusted and trend)
JANUARY 2020
MEDIA CONTACT
Tony Melville
Australian Industry Group
Tel: 0419 190 347
Australian PCI®
▲ 2.4 points
(seasonally adjusted) 41.3
Australian PCI®
▼ 0.4 points (trend) 40.5
Activity ▲ 5.8 points (seasonally adjusted)
42.3
New orders ▲ 4.0 points
(seasonally adjusted) 40.9
Employment ▼ 1.1 points (seasonally adjusted)
41.7
House building ▲ 1.0 points (trend) 51.7
Apartments ▲ 0.1 points (trend) 37.0
Engineering activity ▲0.5 points (trend) 34.2
Commercial activity ▼ 1.1 points (trend) 39.9

For more detail about the Ai Group Australian PCI® visit: https://www.aigroup.com.au/resourcecentre/economics/
Construction sectors: House building was the best performing of the four construction sectors in January (51.7 points,
trend), with activity lifting above 50 points and indicating mild expansion and stablility continuing in new orders. In contrast,
apartment building (37.0 points, trend) remained firmly negative, indicating a rate of decline that was largely unchanged
from the previous month. Across the major project areas, commercial construction (39.9 points, trend) recorded an 18th
month of contraction amid continued weakness in demand. The index for engineering construction (34.2 points, trend) also
indicated a further fall in the month, but at a rate that was marginally slower than the previous month.
Construction wages and prices: Input price inflation in the Australian PCI® picked-up in January to its highest level in 12
months. The input prices index increased by 8.2 points to 73.1 points, indicating that cost pressures in the construction of
building projects (including higher imported input prices from a lower Australian dollar) intensified during the month. The
selling prices sub-index in the Australian PCI® decreased by 2.2 points to 45.8 points in January, signaling a slightly steeper
rate of contraction in output prices.This highlights the strong competition between builders and the constraints in recovering
rising input costs. The wide gap between these price series in the Australian PCI® also demonstrates that profit margins
remain tight for many construction businesses.
Construction activity: Across the construction industry, both activity (42.3 points) and new orders (40.9) continued to
contract in January, although at slower rates relative to the previous month. However, there were steeper falls in deliveries
of inputs from suppliers (39.4 points) while employment also recorded further contraction (41.7 points) indicating a general
reluctance by businesses to increase their workforce capacity amid ongoing soft demand at an aggregate level.
Construction highlights: The Australian PCI® suggests that the housing sector has improved tentatively at the start of
2020 following two months of stable conditions. The commercial construction sector is continuing to detract from industry
wide performance, although higher approvals in some key project areas are likely to be supportive of activity in 2020.
Engineering activity is also continuing to decline amid reports of a slow roll-out of new infrastructure projects, although
some businesses noted higher workloads in the month.
Construction concerns: Survey respondents continue to indicate significant margin pressures from a highly competitive
tendering environment. There are concerns about currrent and prospective supplier price rises for imported materials due
to the depreciation of the Australian dollar which is resulting in sharper input price inflation. Some businesses also pointed
to soft economic growth and uncertainty about the outlook as having a negative effect on their order books as a result of
increased risk aversion and lower spending among clients.
AUSTRALIAN PCI® KEY NUMBERS
Index this
month
Change from last month
12-month average
Index this
month
Change from last month
12-month average
Seasonally adjusted Trend
Australian PCI® 41.3 2.4 42.1 Australian PCI® 40.5 -0.4 42.0
Activity 42.3 5.8 41.8 House building 51.7 1.0 42.9
Employment 41.7 -1.1 42.8 Apartments 37.0 0.1 35.3
New Orders 40.9 4.0 41.1 Engineering construction 34.2 0.5 42.6
Supplier Deliveries 39.4 -2.0 43.8 Commercial construction 39.9 -1.1 44.2
Input Prices 73.1 8.2 66.7
Selling Prices 45.8 -2.2 39.9 Seasonally adjusted % ppt %
Average Wages 58.7 1.6 59.2 Capacity Utilisation (%) 74.7 -1.8 75.6
Results above 50 points indicate expansion. All indexes for sectors in the Australia PCI® are reported in trend terms (Henderson 13-month filter).
CONSTRUCTION REPORT CARD: Latest ABS data Level change q/q change y/y Share of total, %
Latest ABS data, seasonally adjusted $bn % % %
Nom. value of residential building approvals, $bn, year to Dec 2019 65.1 - -14.0 56.4% of building approvals
Nom. value of non-residential building approvals, $bn, year to Dec 2019 50.2 - 14.1 43.6% of building approvals
Real value of building work done, $bn, year to Sep 2019 121.7 -0.5 -5.1 58.4% of all construction done
Real value of engineering work done, $bn, year to Sep 2019 86.2 -0.2 -9.6 41.6% of all construction done
Real value of all construction work done, $bn, year to Sep 2019 207.9 -0.4 -7.0 -
Real value-added output, $bn, year to Sep 2019 136.0 0.5 -3.3 7.2% of total GDP
Number of employed people, ‘000, November 2019, trend 1,188.8 1.7 2.7 9.1% of employed people
ABS data sources: National Accounts; Business Indicators; Labour Force Quarterly Detail; Building Approvals; Construction Work Done.
Summary
For more detail about the Ai Group Australian PCI® visit: https://www.aigroup.com.au/resourcecentre/economics/
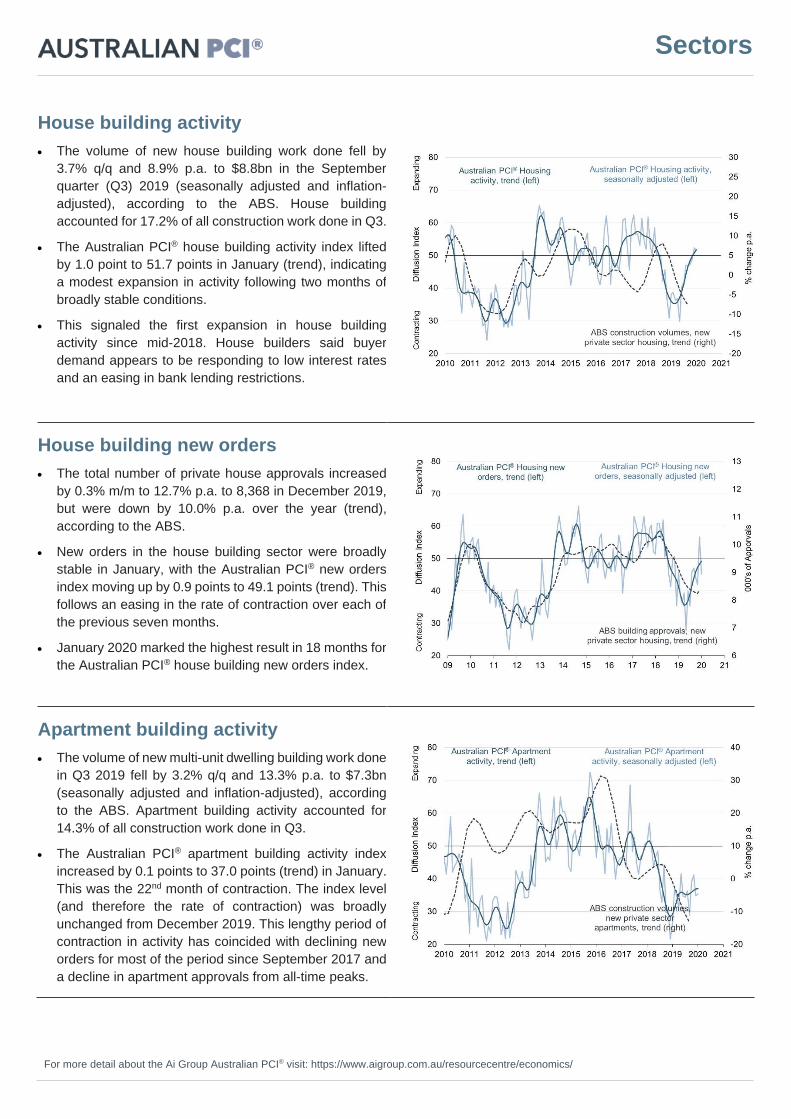
House building activity
• The volume of new house building work done fell by
3.7% q/q and 8.9% p.a. to $8.8bn in the September
quarter (Q3) 2019 (seasonally adjusted and inflation-
adjusted), according to the ABS. House building
accounted for 17.2% of all construction work done in Q3.
• The Australian PCI® house building activity index lifted
by 1.0 point to 51.7 points in January (trend), indicating
a modest expansion in activity following two months of
broadly stable conditions.
• This signaled the first expansion in house building
activity since mid-2018. House builders said buyer
demand appears to be responding to low interest rates
and an easing in bank lending restrictions.
House building new orders
• The total number of private house approvals increased
by 0.3% m/m to 12.7% p.a. to 8,368 in December 2019,
but were down by 10.0% p.a. over the year (trend),
according to the ABS.
• New orders in the house building sector were broadly
stable in January, with the Australian PCI® new orders
index moving up by 0.9 points to 49.1 points (trend). This
follows an easing in the rate of contraction over each of
the previous seven months.
• January 2020 marked the highest result in 18 months for
the Australian PCI® house building new orders index.
Apartment building activity
• The volume of new multi-unit dwelling building work done
in Q3 2019 fell by 3.2% q/q and 13.3% p.a. to $7.3bn
(seasonally adjusted and inflation-adjusted), according
to the ABS. Apartment building activity accounted for
14.3% of all construction work done in Q3.
• The Australian PCI® apartment building activity index
increased by 0.1 points to 37.0 points (trend) in January.
This was the 22nd month of contraction. The index level
(and therefore the rate of contraction) was broadly
unchanged from December 2019. This lengthy period of
contraction in activity has coincided with declining new
orders for most of the period since September 2017 and
a decline in apartment approvals from all-time peaks.
Sectors
For more detail about the Ai Group Australian PCI® visit: https://www.aigroup.com.au/resourcecentre/economics/
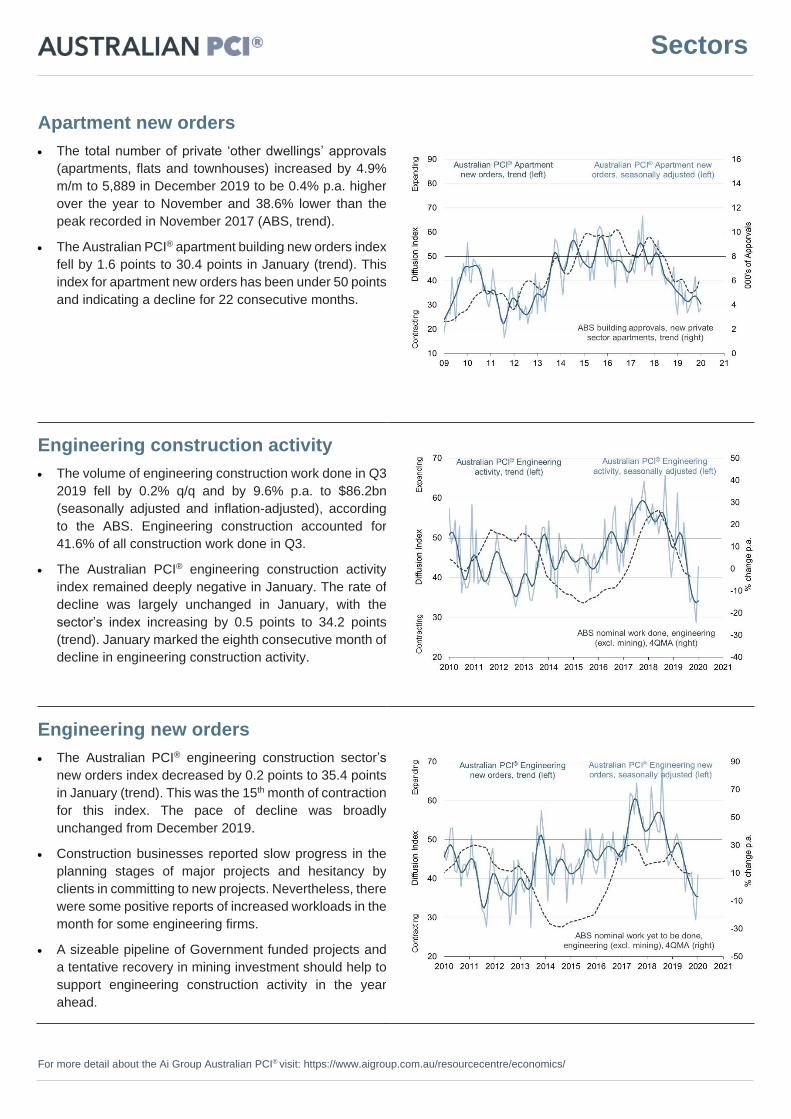
Apartment new orders
• The total number of private ‘other dwellings’ approvals
(apartments, flats and townhouses) increased by 4.9%
m/m to 5,889 in December 2019 to be 0.4% p.a. higher
over the year to November and 38.6% lower than the
peak recorded in November 2017 (ABS, trend).
• The Australian PCI® apartment building new orders index
fell by 1.6 points to 30.4 points in January (trend). This
index for apartment new orders has been under 50 points
and indicating a decline for 22 consecutive months.
Engineering construction activity
• The volume of engineering construction work done in Q3
2019 fell by 0.2% q/q and by 9.6% p.a. to $86.2bn
(seasonally adjusted and inflation-adjusted), according
to the ABS. Engineering construction accounted for
41.6% of all construction work done in Q3.
• The Australian PCI® engineering construction activity
index remained deeply negative in January. The rate of
decline was largely unchanged in January, with the
sector’s index increasing by 0.5 points to 34.2 points
(trend). January marked the eighth consecutive month of
decline in engineering construction activity.
Engineering new orders
• The Australian PCI® engineering construction sector’s
new orders index decreased by 0.2 points to 35.4 points
in January (trend). This was the 15th month of contraction
for this index. The pace of decline was broadly
unchanged from December 2019.
• Construction businesses reported slow progress in the
planning stages of major projects and hesitancy by
clients in committing to new projects. Nevertheless, there
were some positive reports of increased workloads in the
month for some engineering firms.
• A sizeable pipeline of Government funded projects and
a tentative recovery in mining investment should help to
support engineering construction activity in the year
ahead.
Sectors
For more detail about the Ai Group Australian PCI® visit: https://www.aigroup.com.au/resourcecentre/economics/
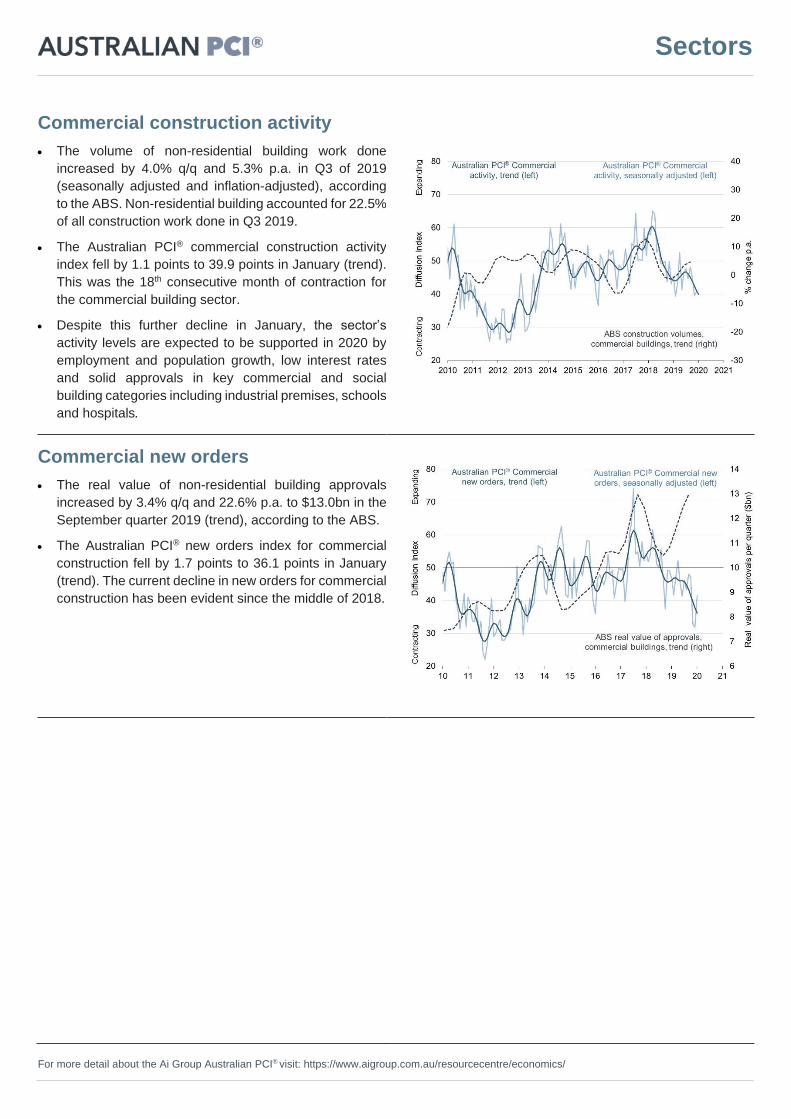
Commercial construction activity
• The volume of non-residential building work done
increased by 4.0% q/q and 5.3% p.a. in Q3 of 2019
(seasonally adjusted and inflation-adjusted), according
to the ABS. Non-residential building accounted for 22.5%
of all construction work done in Q3 2019.
• The Australian PCI® commercial construction activity
index fell by 1.1 points to 39.9 points in January (trend).
This was the 18th consecutive month of contraction for
the commercial building sector.
• Despite this further decline in January, the sector’s
activity levels are expected to be supported in 2020 by
employment and population growth, low interest rates
and solid approvals in key commercial and social
building categories including industrial premises, schools
and hospitals.
Commercial new orders
• The real value of non-residential building approvals
increased by 3.4% q/q and 22.6% p.a. to $13.0bn in the
September quarter 2019 (trend), according to the ABS.
• The Australian PCI® new orders index for commercial
construction fell by 1.7 points to 36.1 points in January
(trend). The current decline in new orders for commercial
construction has been evident since the middle of 2018.
Sectors

For more detail about the Ai Group Australian PCI® visit: https://www.aigroup.com.au/resourcecentre/economics/
Input prices
• House construction industry input prices rose by 0.6%
p.a. in Q4 2019, according to the ABS Producer Price
Index.
• The Australian PCI® points to rising input cost pressures
heading into 2020, with the input prices index increasing
by 8.2 points to 73.1 points in January.
• Respondents said that input prices are being driven
higher by local supplier price rises, the lower Australian
dollar and ongoing pressure from high energy prices.
Selling prices
• Building construction industry output (selling) prices rose
by 0.8% p.a. in Q4 of 2019, according to the ABS
Producer Price Index. This is well below headline
consumer inflation of 1.8% p.a. over the same period.
• The selling prices index in the Australian PCI® fell by 2.2
points to 45.8 points in January.
• This indicates that rising input costs are not, on average,
being passed on to customers. This reflects strong
competition among builders in an environment of slower
demand in most sectors, compared with previous peaks.
Average wages
• Average wage rates in private sector construction rose
by 0.5% q/q and 1.9% p.a. in Q3 of 2019, according to
the ABS wage price index.
• Wages in approved EBA’s in the construction industry
rose by an average of 3.3% in Q2 2019 (above the
average of 2.7% for all industries), according to the
Department of Education, Employment and Workplace
Relations’ Federal Enterprise Bargaining Trends report.
• The Australian PCI® wages index increased by 1.6 points
to 58.7 points in January. It remains a touch below its
recent average of 59.2 points over the past 12 months.
Prices and wages
For more detail about the Ai Group Australian PCI® visit: https://www.aigroup.com.au/resourcecentre/economics/
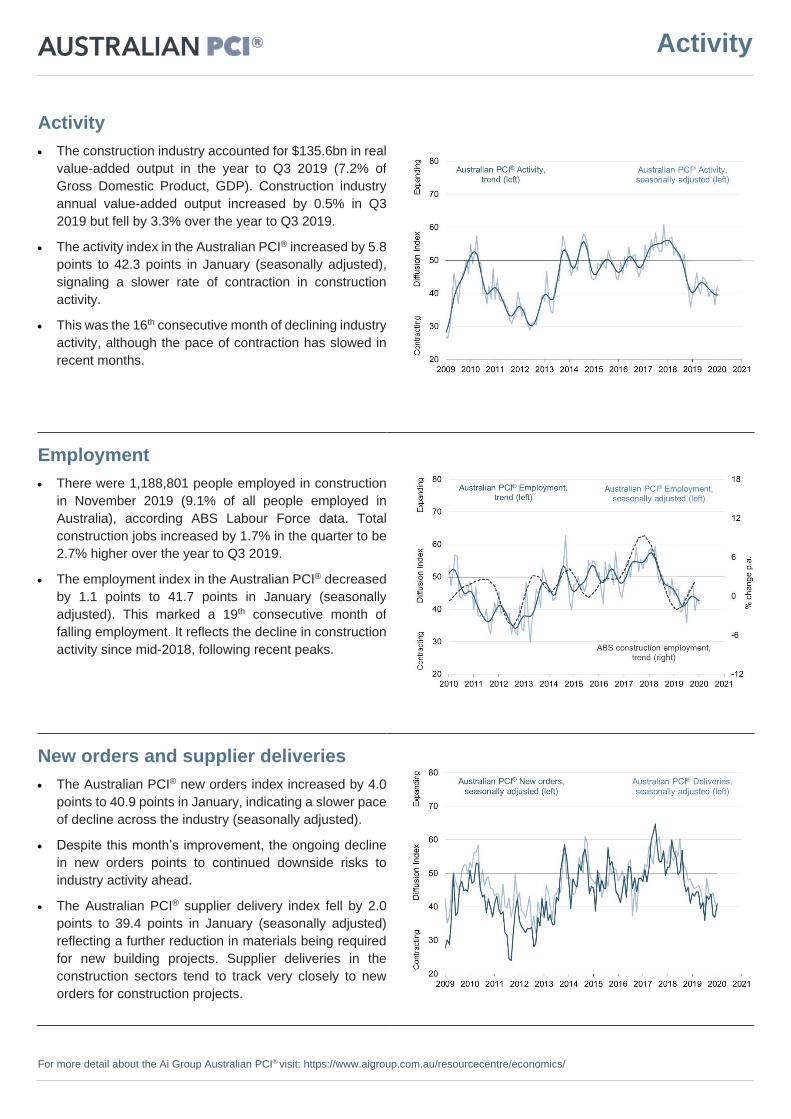
Activity
• The construction industry accounted for $135.6bn in real
value-added output in the year to Q3 2019 (7.2% of
Gross Domestic Product, GDP). Construction industry
annual value-added output increased by 0.5% in Q3
2019 but fell by 3.3% over the year to Q3 2019.
• The activity index in the Australian PCI® increased by 5.8
points to 42.3 points in January (seasonally adjusted),
signaling a slower rate of contraction in construction
activity.
• This was the 16th consecutive month of declining industry
activity, although the pace of contraction has slowed in
recent months.
Employment
• There were 1,188,801 people employed in construction
in November 2019 (9.1% of all people employed in
Australia), according ABS Labour Force data. Total
construction jobs increased by 1.7% in the quarter to be
2.7% higher over the year to Q3 2019.
• The employment index in the Australian PCI® decreased
by 1.1 points to 41.7 points in January (seasonally
adjusted). This marked a 19th consecutive month of
falling employment. It reflects the decline in construction
activity since mid-2018, following recent peaks.
New orders and supplier deliveries
• The Australian PCI® new orders index increased by 4.0
points to 40.9 points in January, indicating a slower pace
of decline across the industry (seasonally adjusted).
• Despite this month’s improvement, the ongoing decline
in new orders points to continued downside risks to
industry activity ahead.
• The Australian PCI® supplier delivery index fell by 2.0
points to 39.4 points in January (seasonally adjusted)
reflecting a further reduction in materials being required
for new building projects. Supplier deliveries in the
construction sectors tend to track very closely to new
orders for construction projects.
Activity
For more detail about the Ai Group Australian PCI® visit: https://www.aigroup.com.au/resourcecentre/economics/
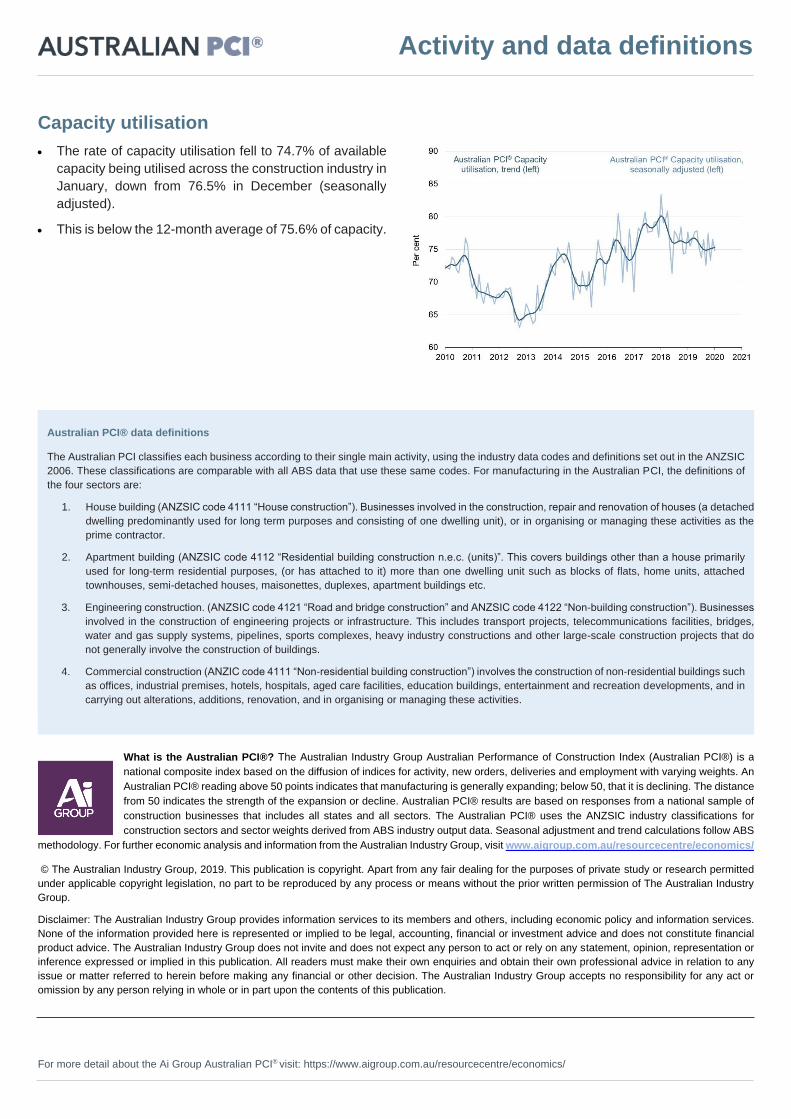
Capacity utilisation
• The rate of capacity utilisation fell to 74.7% of available
capacity being utilised across the construction industry in
January, down from 76.5% in December (seasonally
adjusted).
• This is below the 12-month average of 75.6% of capacity.
Australian PCI® data definitions
The Australian PCI classifies each business according to their single main activity, using the industry data codes and definitions set out in the ANZSIC
2006. These classifications are comparable with all ABS data that use these same codes. For manufacturing in the Australian PCI, the definitions of
the four sectors are:
1. House building (ANZSIC code 4111 “House construction”). Businesses involved in the construction, repair and renovation of houses (a detached
dwelling predominantly used for long term purposes and consisting of one dwelling unit), or in organising or managing these activities as the
prime contractor.
2. Apartment building (ANZSIC code 4112 “Residential building construction n.e.c. (units)”. This covers buildings other than a house primarily
used for long-term residential purposes, (or has attached to it) more than one dwelling unit such as blocks of flats, home units, attached
townhouses, semi-detached houses, maisonettes, duplexes, apartment buildings etc.
3. Engineering construction. (ANZSIC code 4121 “Road and bridge construction” and ANZSIC code 4122 “Non-building construction”). Businesses
involved in the construction of engineering projects or infrastructure. This includes transport projects, telecommunications facilities, bridges,
water and gas supply systems, pipelines, sports complexes, heavy industry constructions and other large-scale construction projects that do
not generally involve the construction of buildings.
4. Commercial construction (ANZIC code 4111 “Non-residential building construction”) involves the construction of non-residential buildings such
as offices, industrial premises, hotels, hospitals, aged care facilities, education buildings, entertainment and recreation developments, and in
carrying out alterations, additions, renovation, and in organising or managing these activities.
What is the Australian PCI®? The Australian Industry Group Australian Performance of Construction Index (Australian PCI®) is a
national composite index based on the diffusion of indices for activity, new orders, deliveries and employment with varying weights. An
Australian PCI® reading above 50 points indicates that manufacturing is generally expanding; below 50, that it is declining. The distance
from 50 indicates the strength of the expansion or decline. Australian PCI® results are based on responses from a national sample of
construction businesses that includes all states and all sectors. The Australian PCI® uses the ANZSIC industry classifications for
construction sectors and sector weights derived from ABS industry output data. Seasonal adjustment and trend calculations follow ABS
methodology. For further economic analysis and information from the Australian Industry Group, visit www.aigroup.com.au/resourcecentre/economics/
© The Australian Industry Group, 2019. This publication is copyright. Apart from any fair dealing for the purposes of private study or research permitted
under applicable copyright legislation, no part to be reproduced by any process or means without the prior written permission of The Australian Industry
Group.
Disclaimer: The Australian Industry Group provides information services to its members and others, including economic policy and information services.
None of the information provided here is represented or implied to be legal, accounting, financial or investment advice and does not constitute financial
product advice. The Australian Industry Group does not invite and does not expect any person to act or rely on any statement, opinion, representation or
inference expressed or implied in this publication. All readers must make their own enquiries and obtain their own professional advice in relation to any
issue or matter referred to herein before making any financial or other decision. The Australian Industry Group accepts no responsibility for any act or
omission by any person relying in whole or in part upon the contents of this publication.
Activity and data definitions
Top Related