


Languages
Pages
Legal

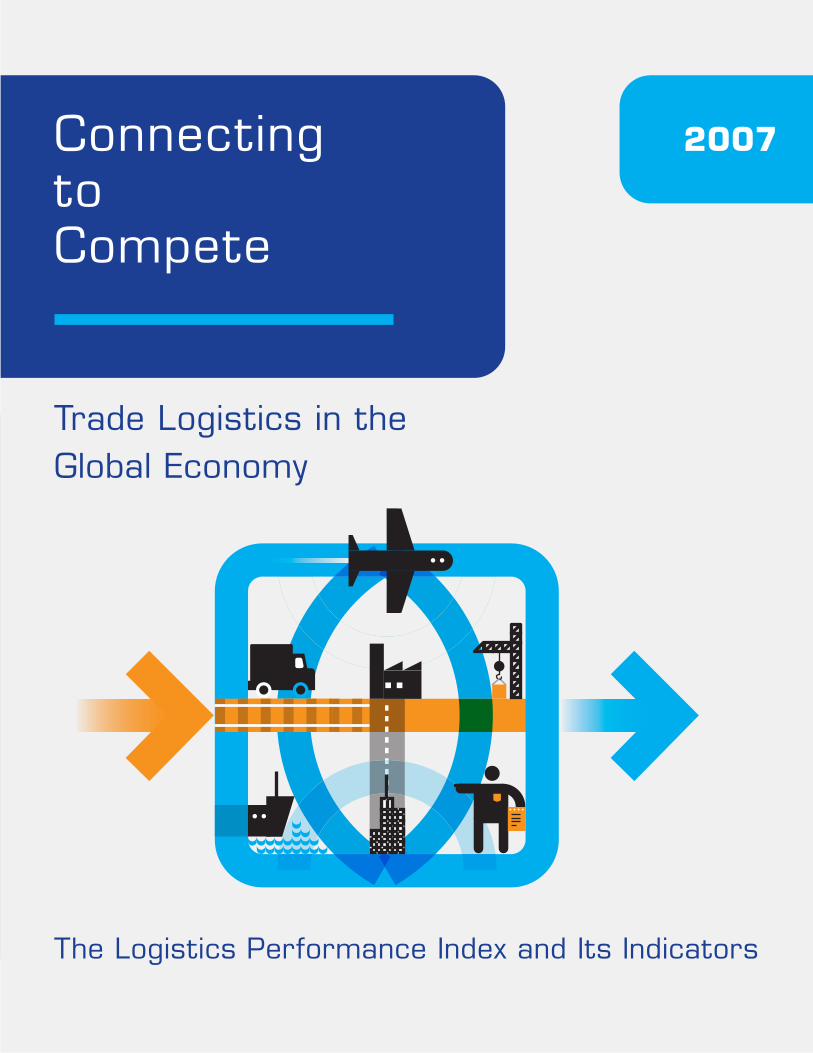
ConnectingtoCompete
2007
Trade Logistics in the Global Economy
The Logistics Performance Index and Its Indicators
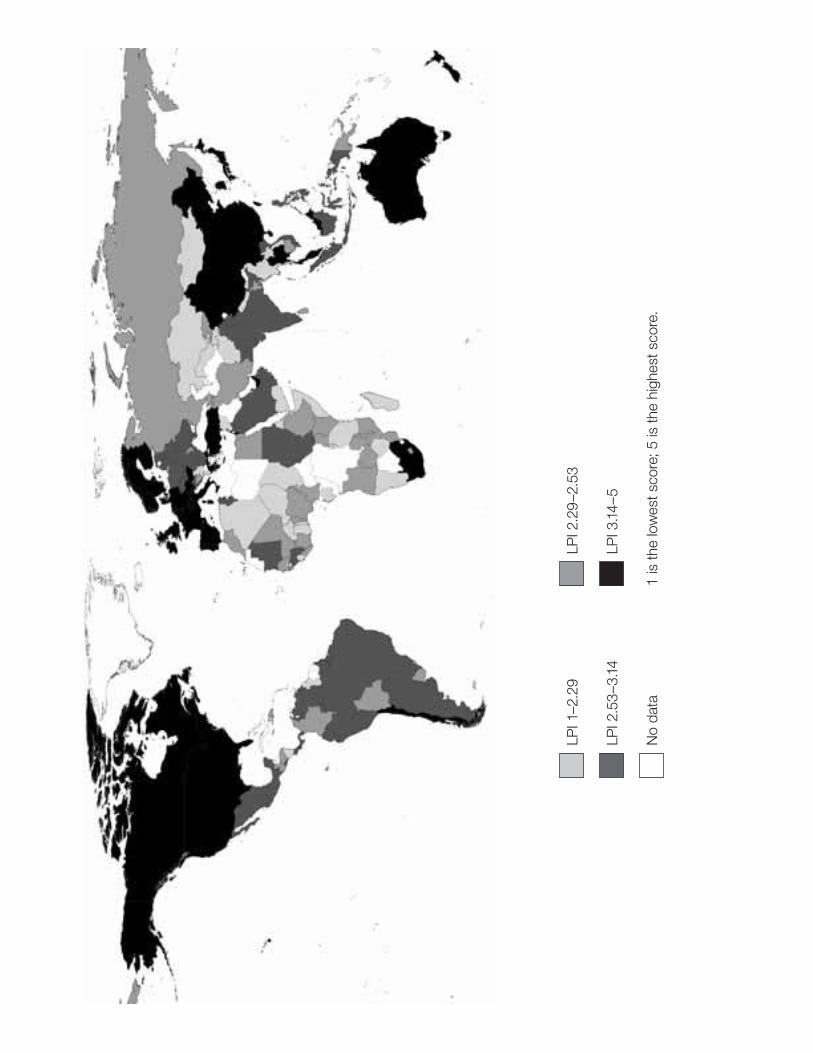
LPI 1
–2.2
9LP
I 2.2
9–2
.53
LPI 2
.53–
3.14
LPI 3
.14–
5
No
data
1 is
the
low
est s
core
; 5 is
the
high
est s
core
.
Connecting to CompeteTrade Logistics in the Global Economy
The Logistics Performance Index and Its Indicators
Jean-François ArvisThe World Bank
Monica Alina MustraThe World Bank
John PanzerThe World Bank
Lauri OjalaTurku School of Economics
Tapio NaulaTurku School of Economics

© 2007 The International Bank for Reconstruction and Development / The World Bank1818 H Street NWWashington DC 20433Telephone: 202-473-1000Internet: www.worldbank.orgE-mail: [email protected]
All rights reserved
The findings, interpretations, and conclusions expressed herein are those of the authors and do not necessarily reflect the views of the Executive Directors of the International Bank for Reconstruc-tion and Development / The World Bank or the governments they represent.The World Bank does not guarantee the accuracy of the data included in this work. The boundar-ies, colors, denominations, and other information shown on any map in this work do not imply any judgment on the part of The World Bank concerning the legal status of any territory or the endorsement or acceptance of such boundaries.
Rights and PermissionsThe material in this publication is copyrighted. Copying and/or transmitting portions or all of this work without permission may be a violation of applicable law. The International Bank for Reconstruction and Development/The World Bank encourages dissemination of its work and will normally grant permission to reproduce portions of the work promptly.For permission to photocopy or reprint any part of this work, please send a request with complete information to the Copyright Clearance Center Inc., 222 Rosewood Drive, Danvers, MA 01923, USA; telephone: 978-750-8400; fax: 978-750-4470; Internet: www.copyright.com.
If you have any questions or comments about this report, please contact:
International Trade DepartmentThe World Bank1818 H Street NW, Room MSN MC2-201, Washington, DC 20433 USATelephone: 202-473-8922E-mail: [email protected] site: www.worldbank.org or www.worldbank.org/lpi
All other queries on rights and licenses, including subsidiary rights, should be addressed to the Office of the Publisher, The World Bank, 1818 H Street NW, Washington, DC 20433, USA; fax: 202-522-2422; e-mail: [email protected].

CONNECTING TO COMPETE: TRADE LOGIST ICS IN THE GLOBAL ECONOMY III
Foreword
Technological progress and worldwide trade andinvestment liberalization are presenting new opportunities for countries to harness global markets for growth and poverty reduction. Butwith the advent of global supply chains, a new premium is being placed on being able to move goods from A to B rapidly, reliably, and cheaply.Being able to connect to what has been referred to as the “physical internet” is fast becoming a key determinant of a country’s competitiveness. For those able to connect, the physical internet brings access to vast new markets; but for those whose links to the global logistics web are weak,the costs of exclusion are large and growing.Whether a cause or a consequence, no country has grown successfully without a large expan-sion of its trade.
This report aims to shed light on how dif-ffferent countries are doing in the area of tradelogistics, and what they can do to improve their performance. It is based on a worldwidesurvey of the global freight forwarders and ex-xxpress carriers who are the most active in interna-tional trade. The Logistics Performance Index (LPI) and its underlying indicators constitutea unique dataset to measure country perfor-rrmance across several dimensions of logistics and to benchmark that logistics performanceagainst 150 countries. It provides the empiricalbasis to understand and compare differences in trade logistics as well as to inform policy withrespect to difficult bottlenecks and tradeoffs. As a tool for policymakers, professionals, develop-ment agencies, and other stakeholders, it will directly support the fast-growing agenda for
reforms and investments in trade and transport facilitation.
The report provides some insightson the cost of poor logistics to country competitiveness—and the sources of those higher costs. Beyond cost and time taken to deliver goods, the predictability and reliability of supply chains is increasingly important in a world of just-in-time production sharing. Costs related to hedging against uncertainty are sig-nificant. Equally, cost and quality of logistics are determined not just by infrastructure andthe performance of public agencies, but also by the availability of quality and competitive pri-vate services. Moreover, in many developing countries, problems of adverse geography are compounded by a weak modern services sectordue to poor institutions or over-regulation. The report closes with some practical insights, advo-cating a comprehensive, integrated approach to ensure that actions in one area are not rendered ineffective by bottlenecks in another.
We hope that this initiative will be a valu-able addition to the set of tools the World Bank provides to enable countries to assess and bench-mark their performance in this critical area, and that it will, in a modest way, promote growth, poverty reduction, and economic development.
Danny LeipzigerVice President and Head of Network
Poverty Reduction and Economic management

IV CONNECTING TO COMPETE: TRADE LOGIST ICS IN THE GLOBAL ECONOMY
The survey would not have been possible without the support and participation of the International Federation of Freight Forward-ers Associations (www.fiata.com), the Global Express Association (www.global-express.org), the Global Facilitation Partnership for Transportation and Trade (www.gfptt.org), and ten major international logistics com-panies. The survey was designed and imple-mented with Finland’s Turku School of Economics (www.tukkk.fi/english/), which worked with the Bank to develop the concept in 2003.
This is the first report presenting the Logis-tics Performance Index (LPI) and indicators. The survey will be conducted each year to improve the reliability of the indicators and to build a dataset comparable across countries and over time.
The authors express their gratitude to the hundreds of employees of freight forwarding and express carrier companies around the world who took the time to respond to the survey. Their par-ticipation was central to the quality and credibil-ity of the project, and their continuing involve-ment and feedback will be essential as we develop and refine the survey and the LPI in future years.
Acknowledgments

CONNECTING TO COMPETE: TRADE LOGIST ICS IN THE GLOBAL ECONOMY V
This report has been prepared under the leadership of Jean-François Arvis, Monica Alina Mustra, and John Panzer (sector manager) with a core team of external partners, including Lauri Ojala and Tapio Naula. Additional con-tributions were made by Julia Nielson (includ-ing help in drafting parts of the report) and Jean Pierre Chaffour. Liliya Repa contributed to the data analysis and the data appendix.
Several reviewers offered extensive advice and comments throughout the conceptualization stages. These included Aart Kray, Robin Carru-thers, and Najy Benhassine. Extensive and excel-lent advice was received from Marc Juhel, Antonio Estache, Gerard McLinden, Peter Walkenhorst, Simeon Djankov, and Mariem Malouche.
The accompanying LPI website was pro-duced by the World Bank Institute Multime-dia Team which included Steffen Soulejman Janus, Arseny Malov, and under the guidance of Monica Alina Mustra.
Communications Development Incorpo-rated provided overall design, editing, and lay-out, led by Bruce Ross-Larson, Laura Peterson Nussbaum, and Amye Kenall. Elaine Wilson created the graphics and typeset the book. Peter Grundy, of Peter Grundy Art & Design, pro-vided the cover design. Monica Alina Mustra managed the publication process and the dis-semination activities.
The work was conducted under the general guidance of Uri Dadush.
Authors

VI CONNECTING TO COMPETE: TRADE LOGIST ICS IN THE GLOBAL ECONOMY
Foreword iiiAcknowledgments ivAuthors v
Executive summary 1
Overview: Connecting to compete 3
Measuring logistics performance 7The Logistics Performance Index and its indicators 8Assessing the performance gap 8Overachievers and underachievers: Examples of the logistics gap 9The LPI gap, trade, and FDI: Good logistics performers benefit more from globalization 11
Key factors in logistics performance 13Factors determining logistics performance 13Logistics and competitiveness: Why predictability and reliability matter more than costs 16
Lessons for reform 18Reforms must be comprehensive 18Some areas of reform are tackled more than others 19Implementing reform is not easy 19While integrated reforms are essential, priorities and strategies may differ 19
Table of contents
CONNECTING TO COMPETE: TRADE LOGIST ICS IN THE GLOBAL ECONOMY VII
Technical notesTechnical note 1: Selection of countries 22Technical note 2: The Logistics Performance Index and multivariate regressions 23
BoxesBox 1.1 The LPI and other international indicators 7Box 1.2 Building the Logistics Performance Index 8Box 1.3 How precise is the LPI estimate? 9Box 2.1 Modernizing border processes 15Box 2.2 Delivering on schedule 15
FiguresFigure 1.1 High income countries are generally top performers, but there are big
differences between countries at other income levels 9Figure 1.2 Performance of selected middle income countries 10Figure 1.3 Performance of selected low income countries 11Figure 1.4 Logistics performance is associated with the diversification of exports, 2005 11Figure 1.5 Trade expansion of non-oil-exporting developing countries
and logistics performance, 1992–2005 12Figure 2.1 Structure of logistics costs supported by traders 16Figure 2.2 Direct freight costs versus induced costs assessed by respondent 16Figure 3.1 High performers are consistent performers:
Discrepancies across factors of performance 18Figure 3.2 Vicious and virtuous logistics 20Figure 3.3 Logistics typology 21
TablesTable 1 The first Logistics Performance Index 2Table 1.1 Top 10 countries, by income group 10Table 2.1 How logistics professionals assess institutions and processes 13Table 3.1 Percent of respondents acknowledging positive trends in developments
for the following areas, during the last three years 19Table 3.2 Identify the severity of constraints to overall performance 21Technical note table 1.1 Six country selection rules 22Technical note table 1.2 Regional coverage of the Logistics Performance Index 22Technical note table 2.1 23
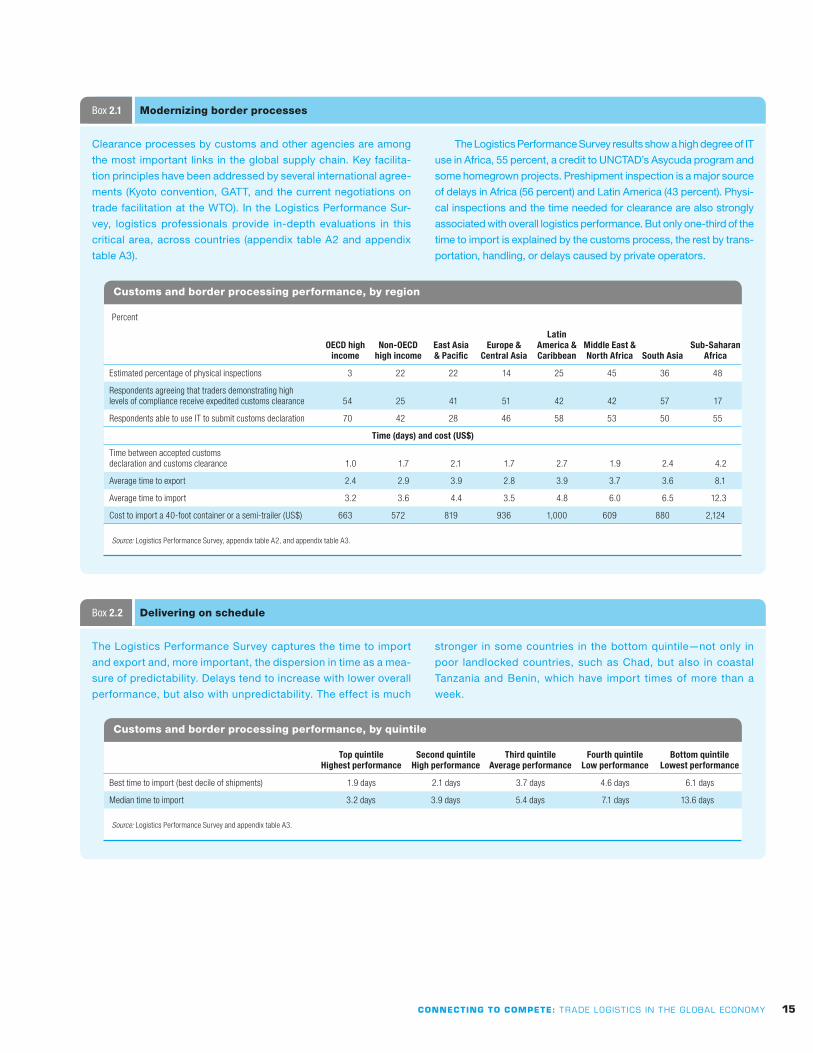
Appendix tablesTable A1 Country rankings on the Logistics Performance Index and indicators 26Table A2 Country-specific environment and institutions data
averages, by income group and region 34Table A3 Country-specific performance data, by country 36


CONNECTING TO COMPETE: TRADE LOGIST ICS IN THE GLOBAL ECONOMY 1
Connecting to compete—trade logistics in the global economy—is critical for developing coun-tries to harness global trade and reap the benefits of globalization. Success in integrating global supply chains starts with the ability of firms to move goods across borders rapidly, reliably, and cheaply.
The Logistics Performance Index (LPI) and its indicators provide the first in-depth cross-country assessment of the logistics gap among countries. Drawing on the first-hand knowledge of logistics professionals worldwide, it provides a comprehensive picture of supply chain performance—from customs procedures, logistics costs, and infrastructure qual-ity to the ability to track and trace shipments, timeli-ness in reaching destination, and the competence of the domestic logistics industry.
Using a 5-point scale, the LPI aggregates more than 5,000 country evaluations. It is complemented by a number of qualitative and quantitative indica-tors of the domestic logistics environment, institu-tions, and performance of supply chains (such as costs and delays).
The LPI and its indicators point to significant differences in logistics performance across countries and regions. It reflects not only expected disparities between developed and developing countries, espe-cially the least-developed, landlocked countries, but more important, significant differences among de-veloping countries at similar levels of development. Countries that top the LPI ranking are typically key players in the logistics industry, while those at the bottom are often trapped in a vicious circle of overregulation, poor quality services, and under-investment. Among developing countries, logistics overachievers are also those experiencing economic growth led by manufactured exports.
A key insight from the survey of logistics profes-sionals is that, while costs and timeliness are of para-while costs and timeliness are of para-mount importance, traders are primarily concerned with the overall reliability of the supply chain. Costs related to hedging against uncertainty have become a significant part of logistics costs in many developing
countries. Country performance is largely influ-enced by the weakest link in the supply chain: poor performance in just one or two areas can have serious repercussions on overall competitiveness.
Although much progress has been made in tele-tele-communications and information technology, most logistics professionals are not satisfi ed with the qual-professionals are not satisfied with the qual-ity of the physical infrastructure in many developing countries. Even where customs has been modern-. Even where customs has been modern- Even where customs has been modern-ized, the coordination of border procedures between customs and other agencies remains an important concern. Logistics performance is more and more determined by the availability of quality, competi-tive private services—such as trucking, customs bro-trucking, customs bro-kering, and warehousing.
The LPI suggests that policymakers should look beyond the traditional “trade facilitation” agenda that focuses on road infrastructure and information technology in customs to also reform logistics ser-vices markets and reduce coordination failures, espe-cially those of public agencies active in border con-trol. This demands a more integrated, comprehensive approach to reforms all along the supply chain.
Indeed, there are strong synergies among reforms to customs, border management, infrastructure, and transport regulations because reforms usually rein- rein-force each other. Countries performing well typi-Countries performing well typi-cally have a comprehensive approach that improves key factors in logistics performance in parallel, while countries with a piecemeal approach tend not to demonstrate lasting improvements.
In turn, cross-cutting reforms need to be sup-ported by broad constituencies. International com-panies can bring global knowledge, but the support of local exporters, operators, and public agencies is crucial.
The LPI rankings and indicators provide robust benchmarks that may help build the case for reform. By shining a light on the costs of poor logistics per-formance, the LPI and its indicators can help coun-tries break out of the vicious circle of logistics un-friendliness to effectively access global markets.
Executive summary

2 CONNECTING TO COMPETE: TRADE LOGIST ICS IN THE GLOBAL ECONOMY
Country
Logistics Performance Index
Country
Logistics Performance Index
Country
Logistics Performance Index
Rank Score Rank Score Rank Score
Singapore 1 4.19 Romania 51 2.91 Senegal 101 2.37
Netherlands 2 4.18 Jordan 52 2.89 Côte d’Ivoire 102 2.36
Germany 3 4.10 Vietnam 53 2.89 Kyrgyz Republic 103 2.35
Sweden 4 4.08 Panama 54 2.89 Ethiopia 104 2.33
Austria 5 4.06 Bulgaria 55 2.87 Liberia 105 2.31
Japan 6 4.02 Mexico 56 2.87 Moldova 106 2.31
Switzerland 7 4.02 São Tomé and Principe 57 2.86 Bolivia 107 2.31
Hong Kong, China 8 4.00 Lithuania 58 2.78 Lesotho 108 2.30
United Kingdom 9 3.99 Peru 59 2.77 Mali 109 2.29
Canada 10 3.92 Tunisia 60 2.76 Mozambique 110 2.29
Ireland 11 3.91 Brazil 61 2.75 Azerbaijan 111 2.29
Belgium 12 3.89 Guinea 62 2.71 Yemen, Rep. 112 2.29
Denmark 13 3.86 Croatia 63 2.71 Burundi 113 2.29
United States 14 3.84 Sudan 64 2.71 Zimbabwe 114 2.29
Finland 15 3.82 Philippines 65 2.69 Serbia and Montenegro 115 2.28
Norway 16 3.81 El Salvador 66 2.66 Guinea-Bissau 116 2.28
Australia 17 3.79 Mauritania 67 2.63 Lao PDR 117 2.25
France 18 3.76 Pakistan 68 2.62 Jamaica 118 2.25
New Zealand 19 3.75 Venezuela, RB 69 2.62 Togo 119 2.25
United Arab Emirates 20 3.73 Ecuador 70 2.60 Madagascar 120 2.24
Taiwan, China 21 3.64 Paraguay 71 2.57 Burkina Faso 121 2.24
Italy 22 3.58 Costa Rica 72 2.55 Nicaragua 122 2.21
Luxembourg 23 3.54 Ukraine 73 2.55 Haiti 123 2.21
South Africa 24 3.53 Belarus 74 2.53 Eritrea 124 2.19
Korea, Rep. 25 3.52 Guatemala 75 2.53 Ghana 125 2.16
Spain 26 3.52 Kenya 76 2.52 Namibia 126 2.16
Malaysia 27 3.48 Gambia, The 77 2.52 Somalia 127 2.16
Portugal 28 3.38 Iran, Islamic Rep. 78 2.51 Bhutan 128 2.16
Greece 29 3.36 Uruguay 79 2.51 Uzbekistan 129 2.16
China 30 3.32 Honduras 80 2.50 Nepal 130 2.14
Thailand 31 3.31 Cambodia 81 2.50 Armenia 131 2.14
Chile 32 3.25 Colombia 82 2.50 Mauritius 132 2.13
Israel 33 3.21 Uganda 83 2.49 Kazakhstan 133 2.12
Turkey 34 3.15 Cameroon 84 2.49 Gabon 134 2.10
Hungary 35 3.15 Comoros 85 2.48 Syrian Arab Republic 135 2.09
Bahrain 36 3.15 Angola 86 2.48 Mongolia 136 2.08
Slovenia 37 3.14 Bangladesh 87 2.47 Tanzania 137 2.08
Czech Republic 38 3.13 Bosnia and Herzegovina 88 2.46 Solomon Islands 138 2.08
India 39 3.07 Benin 89 2.45 Albania 139 2.08
Poland 40 3.04 Macedonia, FYR 90 2.43 Algeria 140 2.06
Saudi Arabia 41 3.02 Malawi 91 2.42 Guyana 141 2.05
Latvia 42 3.02 Sri Lanka 92 2.40 Chad 142 1.98
Indonesia 43 3.01 Nigeria 93 2.40 Niger 143 1.97
Kuwait 44 2.99 Morocco 94 2.38 Sierra Leone 144 1.95
Argentina 45 2.98 Papua New Guinea 95 2.38 Djibouti 145 1.94
Qatar 46 2.98 Dominican Republic 96 2.38 Tajikistan 146 1.93
Estonia 47 2.95 Egypt, Arab Rep. 97 2.37 Myanmar 147 1.86
Oman 48 2.92 Lebanon 98 2.37 Rwanda 148 1.77
Cyprus 49 2.92 Russian Federation 99 2.37 Timor-Leste 149 1.71
Slovak Republic 50 2.92 Zambia 100 2.37 Afghanistan 150 1.21
Table 1 The first Logistics Performance Index

CONNECTING TO COMPETE: TRADE LOGIST ICS IN THE GLOBAL ECONOMY 3
High logistics costs
and—more particularly—
low levels of service are a
barrier to trade and foreign
direct investment—and
thus to economic growth
Overview: Connecting to compete
The increase in global production sharing, the shortening of product life cycles, and the inten-sification of global competition all highlight logistics as a strategic source of competitive advantage. Since the advent of modern trade several centuries ago, the international move-ment of goods has been primarily organized by freight forwarders, typically large networks of companies with worldwide coverage, capable of handling and coordinating the diverse actions required to move goods across long distances and international borders. More recently, the rise of express carriers and third-party logistics providers has expanded the scope of services available to traders. Freight forwarders and express carriers are at the heart of the present wave of globalization: they facilitate an ever-more demanding system that connects firms, suppliers, and consumers on what The Econo-mist characterizes as “the physical internet.”1
The physical internet is global, but the ability of countries to access it depends on the quality of their national infrastructure as well as the effec-tiveness of their policies and institutions.
Technological advances and economic lib-eralization have created new opportunities for countries to harness global markets for eco-nomic growth and development. But expanded supply chains and global production networks put a new premium on moving goods in a pre-dictable, timely, and cost-effective way. Well connected countries can have access to many more markets and consumers: a country as dis-tant from most major markets as Chile can be a major player in the high-end world food market, supplying fresh fish and perishable fruits to con-sumers in Asia, Europe, and North America. But for the poorly connected, the costs of exclu-sion are considerable and growing, and the risks of missed opportunities loom large, especially
for the poorest landlocked countries, many of them in Africa.
In this highly competitive world, the qual-ity of logistics can have a major bearing on a firm’s decisions about which country to locate in, which suppliers to buy from, and which consumer markets to enter. High logistics costs and—more particularly—low levels of service are a barrier to trade and foreign direct invest-ment and thus to economic growth. Countries with higher overall logistics costs are more likely to miss the opportunities of globalization.
Take landlocked Chad. Importing a 20-foot container from Shanghai to its capi-tal N’djamena takes about ten weeks at a cost of $6,500. Importing the same container to a landlocked country in western or central Eu-rope would take about four weeks and cost less than $3,000. The shipping costs and delays from Shanghai to Douala, the gateway for Chad, and to West European ports are essentially the same. And the same international freight forward-ing company would handle the container from Douala to N’djamena and within Europe. But what accounts for the large difference in time and cost?
The answer lies in better processes, higher quality services, and the operating environ-ment. The forwarder in Europe would use a seamless, paperless system to manage the inland shipment from its eight-hectare campus in the gateway port of Le Havre. The transport inside Europe would take less than three days. And to add value for its client and generate more busi-ness, the forwarder would provide additional services, such as improving the client’s internal distribution practices.
In Chad the process would be different. While only five days should be needed to move the container from Douala to N’djamena, the

4 CONNECTING TO COMPETE: TRADE LOGIST ICS IN THE GLOBAL ECONOMY
The LPI suggests that
there are strong synergies
among reforms to customs,
border management,
infrastructure, and
transport regulations
actual time would likely be as long as five weeks. In a difficult governance and security environ-ment, the freight forwarding company would be trying simply to avoid a breakdown in its client’s supply chain. It would maintain company staff along the trade corridor to physically track the goods and trade documents. And it would have to be ready to mediate with the trucking syn-dicate, the security forces, and myriad govern-ment agencies.
Freight forwarders and express carriers are in a privileged position to assess how countries perform on logistics. They manage operations from factory and warehouse to port, from port to overland transit, and through one or more borders to destination, with each link testing a country’s logistics infrastructure performance. The logistics performance survey taps the first-hand knowledge of the operational staff of logis-tics companies worldwide.
Complementing existing international sets of competitiveness indicators—such as the World Bank’s Doing Business measures and the World Economic Forum’s Global Competitive-ness Index—the Logistics Performance Index and its indicators propose a comprehensive approach to supply chain performance. It pro-vides the first in-depth cross-country assess-ment of the logistics gap and constraints facing countries. It elaborates on several areas of per-formance, such as trade procedures, infrastruc-ture, services, and reliability. Based on a 1 to 5 scale (lowest to highest performance), it aggre-gates more than 5,000 country evaluations by professionals trading with the country on vari-ous dimensions of performance. These evalua-tions, by individuals located outside the country being evaluated, are used to compute the Logis-tics Performance Index (LPI) and its underlying indicators (table 1 and appendix table A1).
In addition to the LPI, for each country, the survey combines qualitative and quantitative assessments of the domestic logistics environ-ment, institutions, and performance of domes-tic supply chains (costs, delays) by international professionals located in the country evaluated (appendix tables A2 and A3). This additional information is used to reinforce and interpret the results of the LPI and underlines the major
messages about priorities for reform and effec-tive ways of reforming.
The LPI and its indicators underscore signif-icant differences in logistics performance across countries and regions. These differences reflect the disparities between developed and emerg-ing economies (such as Singapore, which ranks first) and other developing countries, especially the least-developed or landlocked countries (Afghanistan ranks last). Countries that top the LPI rankings are typically hubs and/or key players in the logistics industry.
While performance outcomes such as do-mestic costs or the time taken to reach a destina-tion are important, traders mostly value the per-formance of logistics services available to them: reliability and predictability of the supply chain matter most. For example, traditional measures of performance such as direct freight costs and average delays, while important, may not cap-ture the overall logistics performance and thus the ability of countries to use trade for growth. The predictability and reliability of shipments, while more difficult to measure, are more im-portant for firms and may have a more dramatic impact on their ability to compete.
Indeed, professionals view the friendliness of border processes primarily in terms of the transparency and the predictability of clear-ance procedures. Even where countries have already implemented a customs moderniza-tion program, the coordination of border pro-cedures between customs and other agencies (responsible say, for sanitary and phytosanitary standards) is an important concern. The avail-ability and competence of trucking, customs brokering, and warehousing services are also critical performance factors that vary widely across countries. While telecommunications and information technology infrastructure, in-creasingly the key to successful trade operations, have improved rapidly in most countries, most professionals remain concerned about the qual-ity of physical infrastructure.
In terms of the way forward, the LPI sug-gests that there are strong synergies among reforms to customs, border management, infrastructure, and transport regulations. Re-e-forms in these different areas have a mutually

CONNECTING TO COMPETE: TRADE LOGIST ICS IN THE GLOBAL ECONOMY 5
Countries performing well
have a comprehensive
approach, improving
all the key logistics in
parallel, while those with
a piecemeal approach,
targeting a single link in
the logistics chain, may
see initial results but no
lasting improvements
reinforcing effect along all links in the logistics supply chain, directly contributing to predict-ability and performance. Countries perform-Countries perform-ing well have a comprehensive approach, im-proving all the key logistics in parallel, while those with a piecemeal approach, targeting a single link in the logistics chain, may see initial results but no lasting improvements. A com- A com-prehensive reform of logistics and trade facil-logistics and trade facil-itation is thus essential. But too few develop-ing countries have created a virtuous circle of improvements. Countries at the bottom of the LPI ranking are typically trapped in a vicious circle of overregulation, poor quality services, and underinvestment.
The LPI suggests that policymakers should look beyond the traditional “facilitation agenda” focused on trade-related infrastructure and in-formation technology in customs. To close the logistics gap, they should also look to reforms in the markets for logistics services, reduce coordi-nation failures (especially those of public agen-cies active in border control), and build strong domestic constituencies to support reform. This effort will demand a more integrated, compre-hensive approach to reforms all along the sup-ply chain. For the most severely constrained countries—typically landlocked countries in Africa and Central Asia—innovative solutions may need to be found, and international donors will have an important role.
The LPI rankings and indicators provide ro-bust benchmarks that may help policymakers—and particularly the private sector—build the
case for reform. By showing countries how they compare with their competitors, and shining a light on the costs of poor logistics performance, it is hoped that the LPI and its indicators may help countries break out of the vicious circle of “logistics unfriendliness”. In identifying the key areas of problems and constraints, the LPI and its indicators also aim to help guide the prepa-ration of the more in-depth, country-specific assessments and strategies, such as trade and transport facilitation audits (Raven 2001), that will be needed to generate concrete improve-ments in logistics performance.
Section 1 introduces the overall concept of the LPI and the methodology underlying its construction. It also presents examples that point to some of the critical factors behind a country’s logistics performance. It introduces a broad typology of country groups, revealing the large disparities in performance among countries at similar incomes. It examines this logistics gap and shows that good logistics per-formers experience greater and more diversified trade flows. Section 2 draws upon the qualita-tive information provided by international op-erators based in the countries being evaluated to provide insights on the key institutions and processes determining logistics performance and analyzes the importance of reliability in logistics performance for competitiveness. Sec-tion 3 offers some ideas on the way forward for policymakers and development agencies, setting priorities for comprehensive reforms according to the current level of performance.


CONNECTING TO COMPETE: TRADE LOGIST ICS IN THE GLOBAL ECONOMY 7
International logistics
encompasses an
array of actions,
from transportation,
consolidation of cargo,
warehousing, and
border clearance to
in-country distribution
and payment systems
Measuring logistics performanceSEC
TIO
N
1
Improving logistics performance has become an important development policy objective. The per-formance of customs, trade-related infrastructure, inland transit, logistics services, information sys-tems, and port efficiency are all critical to whether countries can trade goods and services on time and at low cost. And this trade competitiveness is central to whether countries can harness global-ization’s new opportunities for development.
Governments, often at the urging of the pri-vate sector, are now ramping up projects to fa-cilitate trade and transportation, supported by increased assistance from the World Bank and other development agencies. But the scarcity of performance indicators to benchmark and assess country logistics performance is making it dif-ficult for policymakers and private sector stake-holders to quantify the constraints they face in connecting to global markets and also to inform and reinforce constituencies for reform.
International logistics encompasses an array of actions, from transportation, consolidation of cargo, warehousing, and border clearance to in-country distribution and payment systems.
This sequence cannot be easily summarized in a single indicator. Nor is it easy to collect on a global basis the information to build a per-formance measure. Information on time and costs associated with some important logistics processes—such as port time, time to clear cus-toms, and transport—provides a good starting point and in many cases is readily available. But this information, even when complete, cannot be easily aggregated in a single consistent cross-country dataset because of essential differences in the supply chain structure among countries.
Perhaps more important, many critical ele-ments for good logistics performance—such as the transparency of processes and the quality, pre-dictability, and reliability of services—cannot be captured from the information available on time and costs. So the World Bank, with its profes-sional and academic partners, has produced the (first) Logistics Performance Index (LPI) to start closing the knowledge gap and help countries de-velop logistics reform programs to enhance their competitiveness. The LPI complements existing measures of competitiveness (box 1.1).
The International Finance Corporation and the World Bank jointly
maintain the Doing Business database. This major initiative pro-
vides objective measures of business regulations and enforcement
(www.doingbusiness.org). Doing Business 2008 presents quan-
titative indicators on business regulations and the protection of
property rights that can be compared across 175 economies and
over time.
For trade activities, Doing Business focuses on red tape obsta-
cles to the movement of goods across borders and the ease of ex-
port and import for small and medium sized enterprises. It looks, for
example, at the number of documents and signatures for imports
and exports. The LPI uses a broader and comprehensive approach
to supply-chain performance to measure some of the critical fac-
tors of trade logistics performance, including the quality of infra-
structure and logistics services, the security of property from theft
and looting, the transparency of government procedures, macro-
economic conditions, and the underlying strength of institutions.
The Global Competitiveness Index 2006–2007 (GCI), produced
by World Economic Forum (www.weforum.org), is a composite index
based on macro and micro data as well as interviews with key busi-
ness and societal stakeholders featuring the 12 pillars of competi-
tiveness. It contains detailed profiles of 125 economies and data
tables with global rankings covering more than 100 indicators in nine
areas: institutions, infrastructure, macroeconomy, health and primary
education, higher education and training, market efficiency, techno-
logical readiness, business sophistication, and innovation. Several
indicators are directly relevant to trade facilitation and logistics.
The added value of the LPI is that it provides a global bench-
mark of logistics efficiency and service quality not treated specifi-
cally in the GCI or in Doing Business.
Box 1.1 The LPI and other international indicators

8 CONNECTING TO COMPETE: TRADE LOGIST ICS IN THE GLOBAL ECONOMY
The Logistics Performance
Index and its indicators
are based on a survey
of multinational freight
forwarders and express
carriers—professionals
whose views matter
The Logistics Performance Index and its indicators
The Logistics Performance Index and its indi-cators have been constructed from informa-tion gathered in a worldwide survey of the companies responsible for moving goods and facilitating trade around the world—the mul-tinational freight forwarders and the main express carriers. It relies on the experience and knowledge of professionals. Their views mat-ter: they have a direct impact on the choice of shipping routes and gateways and can influ-ence the firms’ decisions about the location of production, choice of suppliers and selection of target markets.
The indicators summarize the performance of countries in seven areas that capture the cur-rent logistics environment (box 1.2). They range from traditional areas such as customs proce-dures, logistics costs (such as freight rates), and infrastructure quality to new areas like the abil-ity to track and trace shipments, timeliness in reaching a destination, and the competence of the domestic logistics industry. None of these areas alone can ensure good logistics perfor-mance. The selection of these areas is based on the latest theoretical and empirical research2
and on extensive interviews with logistics
professionals involved in international freight logistics.3 The LPI synthesizes this information in a composite index to allow for comparisons (see appendix table A1).
The LPI and its indicators are given on a numerical scale, from 1 (worst) to 5 (best). This scale can also be used to interpret performance outcomes measures. For example, the analysis based on the additional country information gathered in the survey, indicates that, on aver-age, having an LPI lower by one point (say, 2.5 rather than 3.5) implies six additional days for getting imports from the port to a firm’s ware-house and three additional days for exports. It also implies that a shipment is five times more likely to be subject to a physical inspection at entry.
Assessing the performance gap
Countries that top the LPI rankings are major global transport and logistics hubs (Singapore) or the base for a strong logistics service industry (Switzerland). Logistics services in these coun-tries tend to benefit from economies of scale and are often sources of innovation and technologi-cal change. The scores for the top performers are fairly close, yet in many cases the differences are statistically significant (box 1.3).
The Logistics Performance Index (LPI) is built on information from
a web-based questionnaire completed by more than 800 logistics
professionals worldwide—the operators or agents of the world’s
largest logistics service providers. Each respondent was asked to
rate performance in seven logistics areas for eight countries with
which they conduct business. For each respondent, the eight coun-
tries were automatically generated by the survey engine based on
trade flows, income level, geographical position of respondent
countries (coastal or landlocked), and random selection.4 The
country selection matrix is presented in technical note 1. Perfor-
mance was evaluated using a 5-point scale (1 for the lowest score,
5 for the highest).
The seven areas of performance are:5
Efficiency of the clearance process by customs and other
border agencies.
Quality of transport and information technology infra-
structure for logistics.
Ease and affordability of arranging international shipments.
Competence of the local logistics industry.
Ability to track and trace international shipments.
Domestic logistics costs.
Timeliness of shipments in reaching destination.
More than 5,000 individual country evaluations were used to
prepare the Logistics Performance Index, which covers 150 coun-
tries (see appendix table A1). The LPI was aggregated as a weighted
average of the seven areas of logistics performance.6 The index is
constructed using the Principal Component Analysis method in
order to improve the confidence intervals.
Each respondent was also asked to evaluate the logistics per-
formance and the environment and institutions in support of logis-
tics operations in the country in which they are based (appendix
table A2) and to provide time and cost data (appendix table A3).
This wealth of additional information on different aspects of logis-
tics was used to interpret the LPI as well as validate and cross-
check the information underlying the LPI. The questionnaire is avail-
able at www.worldbank.org/lpi.
Box 1.2 Building the Logistics Performance Index

CONNECTING TO COMPETE: TRADE LOGIST ICS IN THE GLOBAL ECONOMY 9
Many of the oil exporting
countries tend to
underperform logistically
At the other extreme are low-income coun-tries, often landlocked and geographically iso-lated, or countries afflicted by conflict or severe governance problems. Landlocked developing countries, especially in Africa and Central Asia, are the most logistically constrained. They typi-cally suffer not only from geographical disad-vantages resulting in high transport costs and delays but also from limited access to competi-tive markets for logistics services and depen-dence upon the performance of other transit countries.
While all developed countries are top per-formers, there are significant differences among developing countries at similar incomes (fig-ure 1.1). For example, China—a middle income country—ranks 30th of 150, while countries in higher income groups, such as oil produc-ers, perform below their potential. Moreover, countries doing fairly well in logistics are also likely to do well in growth and competitiveness, export diversification, and trade expansion, as discussed further below.
For developing countries where trade has been an important factor in accelerating growth, logistics performance is also significantly bet-ter than in other countries at similar incomes. Examples include South Africa (24), Malaysia (27), Chile (32), and Turkey (34) among the upper middle income countries; China (30) and Thailand (31) among the lower middle income; and India (39) and Vietnam (53) among the low income (table 1.1).
Overachievers and underachievers: Examples of the logistics gap
Performance is assessed against comparable countries, notably those at similar levels of development (figures 1.2 and 1.3). Overachiev-ers and underachievers can be identified by whether they exhibit a positive or negative LPI gap compared with their potential, extrapolated from their level of development (gross national income per capita).
Many of the oil exporting countries tend to underperform logistically. Algeria (140) lags sig-nificantly behind its neighbors Tunisia (60) and Morocco (94). The same applies to Bahrain (36), Saudi Arabia (41), Kuwait (44), and Qatar (46), which underperform relative to the rest of the high income group. One reason for this may be the relative absence in these countries of incen-tives and pressure from the private sector to im-plement institutional reforms for trade and trans-port—reflecting the dominance of oil in their exports. By contrast, for some emerging econo-mies where export-oriented manufacturing has been a major factor in growth, the private sector has been a prime proponent of logistics reforms.
The LPI is a robust combination of the vari-
ous dimensions from the international assess-
ments, built by standard econometric tech-
niques to maximize significance and improve
confidence intervals, which are computed at
a 10 percent level. The average confidence in-
terval on the 1–5 scale is 0.16, the equivalent
of eight places in the LPI ranking. These calcu-
lated intervals are larger for small markets that
have few respondents. For instance, Mauritius
has a surprisingly low ranking (137), but a wide
confidence interval of 0.25. An upper-range
reading of its index would give it the same
ranking as Sri Lanka (97).
Box 1.3 How precise is the LPI estimate?
Top quintile, highest performance
Second quintile, high performance
Distribution of countries by income groups across LPI quintiles (%)
Third quintile, average performance
Fourth quintile, low performance
Bottom quintile, lowest performance
Source: The Logistics Performance Survey.
Figure 1.1 High income countries are generally top performers, but there are big differences between countries at other income levels
0
25
50
75
100
Lowincome
Lowermiddleincome
Uppermiddleincome
High incomenon-OECD
High incomeOECD

10 CONNECTING TO COMPETE: TRADE LOGIST ICS IN THE GLOBAL ECONOMY
Morocco and Tunisia. Close to the EU mar-ket, both Morocco and Tunisia have developed manufacturing activities as part of production chains with European multinational corpora-tions, in areas such as garments, auto parts, and electronics (figure 1.2). Policymakers in both countries have been very sensitive to logistics reform and investments in ports, customs, and foreign participation in logistics services.
So, why does Morocco (94) score lower on the LPI than Tunisia (60) and other competi-tors, such as Romania (51) and Bulgaria (55)?
While implementing exemplary customs and port reforms, Morocco has not yet reaped the benefits of recent measures to develop the do-mestic logistics industry, notably trucking and warehousing (Arvis, Bellier, and Raballand 2006). At the same time, Tunisia not only im-plemented some of the core reforms earlier than Morocco but also developed an electronic data interchange system that dramatically simpli-fied the customs clearance process by integrat-ing several procedures. And their Eastern Euro-pean competitors have directly benefited from the EU accession process.
Nigeria, Senegal, and Ghana. Among the low income countries (figure 1.3), Senegal (105) and Ghana (129) rank significantly lower than Nigeria (97). Senegal and Ghana have both implemented rather successful customs reform, with the African showcase of IT systems for rev-enue agencies (Gainde in Senegal and CGnet in Ghana) to improve customs clearing (De Wulf and Sokol 2004). By contrast, Nigeria initiated its customs reforms only recently. Forwarders praise the clearance system in Senegal (76 on border processing), but are overwhelmingly negative for Nigeria (96 on border processing). However, they have the opposite opinion for the quality of support services (such as ports and trucking), where Nigeria has benefited from efficient port operations, thanks to privatiza-tion of the main container terminals.
Top 10 countries
Upper middle income
Top 10 countries
Lower middle income
Top 10 countries
Low income
Country
Logistics
Performance Index
Country
Logistics
Performance Index
Country
Logistics
Performance Index
Rank Score Rank Score Rank Score
South Africa 24 3.53 China 30 3.32 India 39 3.07
Malaysia 27 3.48 Thailand 31 3.31 Vietnam 53 2.89
Chile 32 3.25 Indonesia 43 3.01 São Tomé and Principe 57 2.86
Turkey 34 3.15 Jordan 52 2.89 Guinea 62 2.71
Hungary 35 3.15 Bulgaria 55 2.87 Sudan 64 2.71
Czech Republic 38 3.13 Peru 59 2.77 Mauritania 67 2.63
Poland 40 3.04 Tunisia 60 2.76 Pakistan 68 2.62
Latvia 42 3.02 Brazil 61 2.75 Kenya 76 2.52
Argentina 45 2.98 Philippines 65 2.69 Gambia, The 77 2.52
Estonia 47 2.95 El Salvador 66 2.66 Cambodia 81 2.50
Table 1.1 Top 10 countries, by income group
Logistics Performance Index
Note: The fit line shows the expected LPI ranking given its GNI.
Source: Logistics Performance Survey and World Development Indicators 2005.
Figure 1.2 Performance of selected middle income countries
1,000 2,000 3,000 4,000 5,000
2
3
4
5
Gross national income per capita (US $)
China
Argentina
Kazakhstan
Algeria
Philippines
Morocco
TunisiaBulgaria
Brazil
Romania
Colombia
RussianFederation

CONNECTING TO COMPETE: TRADE LOGIST ICS IN THE GLOBAL ECONOMY 11
Uganda, Malawi, and
Zambia are landlocked,
yet they rank among
the top 15 performers
of the 39 Sub-Saharan
African countries
Significant differences can be observed even among countries facing the most severe logistical challenges—landlocked countries in Africa and Central Asia. In East Africa, Uganda, Malawi, and Zambia are landlocked, yet they rank among the top 15 performers of the 39 Sub-Saharan African countries. Each is served by a fairly efficient logistics indus-try operating in a reasonably competitive en-vironment. Malawi and Zambia also benefit
from being connected to the South African gateway. By contrast, landlocked countries in West and Central Africa ranked lower in the index are poorly served by a fragmented and largely overregulated services industry (characterized by practices such as the tour de role).7
The LPI gap, trade, and FDI: Good logistics performers benefit more from globalization
The LPI gap (the difference between a country’s actual LPI ranking and its expected ranking based on its level of income) also highlights the association between logistics performance and trade and foreign direct investment (FDI) out-comes. Good logistics performers benefit more from globalization. Logistically friendly coun-tries are more likely to have better global value chain integration and attract export-oriented FDI. Since trade and FDI are the key chan-nels for the international diffusion of knowl-edge, poor logistics may impede access to new technology and know-how and slow the rate of productivity growth. Conversely, increased trade creates demand for good logistics, putting pressure on facilitating reforms and sustaining a market for modern services.
This is demonstrated by cross-country analy-ses of the relationship between growth, export
Logistics Performance Index
Note: The fit line shows the expected LPI ranking of a low income country given
its GNI.
Source: Logistics Performance Survey and World Development Indicators 2005.
Figure 1.3 Performance of selected low income countries
200 400 600 800 1,0002.0
2.5
3.0
3.5
Gross national income per capita (US $)
Madagascar
Tanzania
Ghana
Cameroon
Côte d’Ivoire
India
Vietnam
Pakistan
Senegal
Kenya
Nigeria
Percent of top 10 exports in total exports
Source: UNCOMTRADE and authors’ calculations.
Figure 1.4 Logistics performance is associated with the diversification of exports, 2005
Logistics Performance Index
1 2 3 4 520
40
60
80
100

12 CONNECTING TO COMPETE: TRADE LOGIST ICS IN THE GLOBAL ECONOMY
diversification, or trade expansion, and the LPI. Countries ranked highly on the LPI also tended to have more diversified exports. For non-oil-exporting developing countries the standard
deviation of this gap is 0.3, while overachievers have a LPI gap of at least 0.5 (figure 1.4).
Likewise, countries undergoing trade expan-sion (increasing trade—imports and exports—to GDP) tended to also be those outperform-ing on the LPI relative to their level of income (those with a positive LPI gap). A logistics over-achiever with an LPI gap of 0.5 experiences 2 percent more trade expansion, 1 percent more annual growth, or export 40 percent more vari-ety of products (figure 1.5 and technical note 2) than other countries at the same income level.
These significant correlations should be in-terpreted in terms of their association rather than causality. Improvements in the supply chain contribute significantly to competitive-ness by reducing transaction costs. At the same time, a growing, diversifying economy is likely to have the will and the means to improve its logistics performance.
Countries seeking to benefit more from globalization need to identify the key aspects of logistics performance, in particular in terms of their impact on competitiveness. This is the subject of the next section.
Annual increase in trade openness (%)
Source: World Development Indicators 2005 and authors’ calculations.
Figure 1.5 Trade expansion of non-oil-exporting developing countries and logistics performance, 1992–2005
Logistics Performance Index
–15
–10
–5
0
5
10
15
–0.8 –0.6 –0.4 –0.2 0.0 0.2 0.4 0.6 0.8

CONNECTING TO COMPETE: TRADE LOGIST ICS IN THE GLOBAL ECONOMY 13
Reliability is the biggest
concern of logistics
professionals
Key factors in logistics performance
To provide a more complete picture of the key factors determining logistics performance, the Logistics Performance Survey asked logistics professionals about the institutions and pro-cesses supporting logistics operations in the countries they are based in (table 2.1). It asked them to assess critical attributes of the supply chain including: timeliness of deliveries, quality of transport and IT infrastructure, efficiency of border clearance processes, competence of the local logistics industry, and domestic costs of services (see appendix table A2) as well as pro-vide time and cost data (appendix table A3).
The questions delved into the quality of infrastructure, the competence of private and public logistics service providers, the roles of customs and other border agencies, such gover-nance issues as corruption and transparency, and the reliability of the trading system and supply chains.8 Reliability (measured by the predict-ability of the clearance process and the timely delivery of shipments) emerged as a key concern,
with the difference in satisfaction between the high and low performing countries much larger than for any other question in the survey. Some of the reasons for this are discussed at the end of this section.
Factors determining logistics performance
Quality of infrastructure. Telecommunications and IT infrastructure are an essential compo-nent of modern trade processes. The physical movement of goods now entails the efficient and timely exchange of information. In coun-tries in the LPI’s top two quintiles, logistics operators rarely have any issues with the quality of the telecommunications and IT infrastruc-ture, but close to half of them express concerns in countries ranging from average to lowest performers. In Sub-Saharan Africa 43 percent of respondents see this as an issue (appendix table A2).
SEC
TIO
N
2
Percent of respondents
Top quintile
Highest
performance
Second quintile
High
performance
Third quintile
Average
performance
Fourth quintile
Low
performance
Bottom quintile
Lowest
performance
Concerned about the quality of telecommunications and IT infrastructure 6 7 41 27 46
Concerned about the quality of the physical transport infrastructure (ports, roads, warehouses) 17 28 59 46 57
Satisfied with customs 55 32 19 18 11
Satisfied with other border government agencies 38 13 10 9 18
Satisfied with private logistics servicesa 59 34 18 16 11
Satisfied with professional organizations 46 28 6 21 17
Concerned with frequent solicitation of informal payments 6 23 34 49 56
Satisfied with transparency of border processesb 72 44 38 33 26
Imports cleared and delivered as scheduled 87 69 32 39 13
a. Aggregation of customs brokers, distributors, and road operators.
b. Aggregation of the results on the predictability of changes in regulations and transparency of customs clearance process.
Source: Logistics Performance Survey, appendix table A2, appendix table A3.
Table 2.1 How logistics professionals assess institutions and processes

14 CONNECTING TO COMPETE: TRADE LOGIST ICS IN THE GLOBAL ECONOMY
The way the local market
for logistics services is
regulated directly affects
a country’s ability to use
the physical internet to
connect to global markets
The quality of transport infrastructure re-mains a concern in close to or more than half of the logistics operators in average, low, and lowest performers. That concerns also exist in even the highest and high performing countries reflects the challenge of maintaining physical infrastructure at a level able to satisfy rapidly growing demands.
Competence of private and public logistics service providers. The performance of the supply chain depends on the quality of services delivered by the private sector through customs brokers and road transport operators—and on the compe-tence and diligence of public agencies in charge of border procedures. In these areas, the three bottom quintiles generally fare much worse than the top quintile, and the differences in quality are as significant as those for infrastruc-ture (see table 2.1). For example, the satisfaction with customs brokers is fairly high for the upper middle income countries (around 50 percent), but it is only 8 percent for private providers in Sub-Saharan Africa (see appendix table A2). For the lower performers, the dissatisfaction with the quality of trade logistics services applies to both the private and public sector. In those countries where logistics performance is high, there is more satisfaction with private providers than with public providers. The negative view of private providers in the lower performers is an important insight. Too often in developing countries, and notably in Africa, inadequate regulations and the absence of competition lead to corruption or poor services—such as those provided by “suitcase businessmen” at border posts. Often the mere presence of these operators disturbs the clearance process and hinders the emergence of competent local logis-tics operators who can work with international operators.
Customs and other border agencies. Clearance at the border is not only a matter of customs diligence. Law enforcement agencies and min-istries of agriculture and industry also intervene in the process. Customs performance tends to be better than that of other border agencies; on average, customs clearance accounts for a third
of import time (box 2.1). This underscores the importance of addressing the coordination of border agencies, especially in countries that already have attained good customs clearance.
Corruption and transparency. Logistics perfor-mance also depends on broader policy dimen-sions, including the overall business environ-ment, the quality of regulation for logistics services, and most important, on overall gov-ernance. The way the local market for logistics services is regulated directly affects a country’s ability to use the physical internet to connect to global markets. The transparency of govern-ment procurement, the security of property from theft and looting, the macroeconomic conditions, and the underlying strength of insti-tutions are critical factors in determining logis-tics performance. Unsurprisingly, ratings of the domestic environment in such areas as cor-ruption and the transparency of processes and regulation reflect these findings. The rating for transparency of border processes consistently declines along with LPI scores for these groups of countries: poor performers in the LPI were also poor performers on transparency of border processes (see table 2.1). Solicitation of informal payments is rare among the top 30 countries but common among lower performers (close to or more than 50 percent of responses).
Reliability of the trading system and supply chains.For traders at the origin or the destination of the supply chain, what matters most is the qual-ity and reliability of logistics services, measured by the predictability of the clearance process and timely delivery of shipments to destination. The difference in satisfaction between the high and low performing countries on this question is much larger than for any other question in the survey. Performance data derived from the survey on the time (days) for delivery of goods confirms the same phenomenon (box 2.2).
Taken together, all these factors—quality of infrastructure, the competence of private and public logistics service providers, the roles of customs and other border agencies, governance issues such as corruption and transparency, and
CONNECTING TO COMPETE: TRADE LOGIST ICS IN THE GLOBAL ECONOMY 15
Clearance processes by customs and other agencies are among
the most important links in the global supply chain. Key facilita-
tion principles have been addressed by several international agree-
ments (Kyoto convention, GATT, and the current negotiations on
trade facilitation at the WTO). In the Logistics Performance Sur-
vey, logistics professionals provide in-depth evaluations in this
critical area, across countries (appendix table A2 and appendix
table A3).
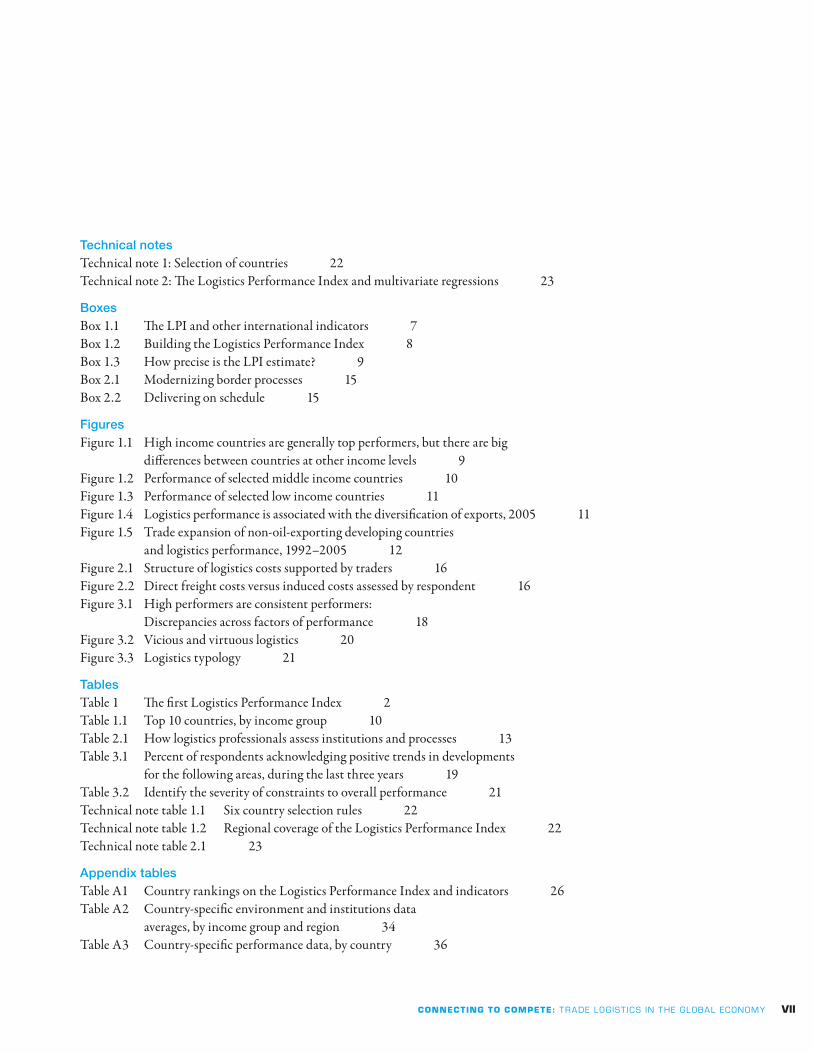
The Logistics Performance Survey results show a high degree of IT
use in Africa, 55 percent, a credit to UNCTAD’s Asycuda program and
some homegrown projects. Preshipment inspection is a major source
of delays in Africa (56 percent) and Latin America (43 percent). Physi-
cal inspections and the time needed for clearance are also strongly
associated with overall logistics performance. But only one-third of the
time to import is explained by the customs process, the rest by trans-
portation, handling, or delays caused by private operators.
Box 2.1 Modernizing border processes
Percent
OECD high
income
Non-OECD
high income
East Asia
& Pacific
Europe &
Central Asia
Latin
America &
Caribbean
Middle East &
North Africa South Asia
Sub-Saharan
Africa
Estimated percentage of physical inspections 3 22 22 14 25 45 36 48
Respondents agreeing that traders demonstrating high
levels of compliance receive expedited customs clearance 54 25 41 51 42 42 57 17
Respondents able to use IT to submit customs declaration 70 42 28 46 58 53 50 55
Time (days) and cost (US$)
Time between accepted customs
declaration and customs clearance 1.0 1.7 2.1 1.7 2.7 1.9 2.4 4.2
Average time to export 2.4 2.9 3.9 2.8 3.9 3.7 3.6 8.1
Average time to import 3.2 3.6 4.4 3.5 4.8 6.0 6.5 12.3
Cost to import a 40-foot container or a semi-trailer (US$) 663 572 819 936 1,000 609 880 2,124
Source: Logistics Performance Survey, appendix table A2, and appendix table A3.
Customs and border processing performance, by region
The Logistics Performance Survey captures the time to import
and export and, more important, the dispersion in time as a mea-
sure of predictability. Delays tend to increase with lower overall
performance, but also with unpredictability. The effect is much
stronger in some countries in the bottom quintile—not only in
poor landlocked countries, such as Chad, but also in coastal
Tanzania and Benin, which have import times of more than a
week.
Box 2.2 Delivering on schedule
Top quintile
Highest performance
Second quintile
High performance
Third quintile
Average performance
Fourth quintile
Low performance
Bottom quintile
Lowest performance
Best time to import (best decile of shipments) 1.9 days 2.1 days 3.7 days 4.6 days 6.1 days
Median time to import 3.2 days 3.9 days 5.4 days 7.1 days 13.6 days
Source: Logistics Performance Survey and appendix table A3.
Customs and border processing performance, by quintile

16 CONNECTING TO COMPETE: TRADE LOGIST ICS IN THE GLOBAL ECONOMY
Suppliers to the same
automobile manufacturer
will carry 7 days of
inventory in Italy but
35 days in Morocco. Some
retailers in African countries
maintain three months
of inventories or more
the reliability of the trading system and supply chains—confirm once again that logistics per-formance is about predictability (see table 2.1). Predictability is central to the overall costs that companies incur in logistics and thus to their competitiveness in global supply chains.
Logistics and competitiveness: Why predictability and reliability matter more than costs
Just as strong logistics performance is associ-ated with increased trade in developing coun-tries (section 1), firm-level competitiveness is extremely sensitive to the quality of the logis-tics environment in which it operates. A firm’s competitiveness is influenced by cost and per-formance of its supply chain and thus depends on the overall logistics environment—but the main impact is less through cost than through the predictability of the deliveries.
Firms have to bear the direct costs associ-ated with moving goods, such as freight costs, port and handling charges, procedural fees (such as bonds), agent fees, and side payments. But they also have to absorb the induced costs associated with hedging for the lack of predict-ability and reliability of the supply chain (Arvis and others 2007) (figure 2.1). They may need to carry higher inventories of supplies or finished products, or switch to more expensive modes of transportation to be sure to meet delivery schedules (Guasch 2003).
Induced costs are inversely related to pre-dictability and also tend to rise steeply with declining logistics performance. For example, suppliers to the same automobile manufacturer will carry 7 days of inventory in Italy but 35 days in Morocco. Some retailers in African countries maintain three months of inventories or more. Bangladesh has to ship, on average, 10 percent
of its garment production by air to be certain to meet the schedules of European buyers.
The high induced costs of unpredictability in the international supply chain are a major constraint for companies and countries trying to diversify into higher value production. In global production chains countries face a dou-ble challenge of maintaining an efficient chain not just for exports but also for imported inputs and components. This can be a particular bur-den for least developed countries, where inputs often cannot be sourced regionally.
Improvements in the quality of the supply chain can thus open new opportunities to entre-preneurs, even in otherwise constrained coun-tries. Southern Mali and Burkina Faso can con-sider diversifying into exports of fresh mangoes (three-week shelf life) as well as cotton exports (typically stored at ports for months), thanks to greater cooperation between local operators and international logistics providers and better per-formance of the railroad from Abidjan, follow-ing a well executed privatization program.
Induced costs in countries with good lo-gistics performance are much lower than those for countries with low logistics performance (figure 2.2), differences that can determine a
Figure 2.1 Structure of logistics costs supported by traders
Direct costsFreight and other costs
associated to shipment
Induced costsCost of nondelivery or
avoidance of nondelivery,
storage, delivery
Normalized scale
Note: The normalized scale is a nonmonetary measure of the relative level of costs
across countries, as assessed by respondents in the survey. The curves are fitted
to a logistics model, with a utility quadratic in the LPI. Induced costs = percent of
respondents saying that import shipments are not cleared and delivered on time.
Direct costs = percent of respondents saying that overall direct logistics costs are
high by international standards.
Figure 2.2 Direct freight costs versus induced costs assessed by respondent
Logistics Performance Index
1 2 3 4 50.0
0.2
0.4
0.6
0.8
1.0
Induced costs
Direct freight costs

CONNECTING TO COMPETE: TRADE LOGIST ICS IN THE GLOBAL ECONOMY 17
The large differences
observed between
countries can be explained
by the fact that the
overall performance
of a country is largely
influenced by the weakest
link in its supply chain
product’s competitiveness in international mar-kets. By contrast, direct logistics costs tend to be much more similar across countries and across different logistics performance levels. They are less of a differentiating factor in a country’s ability to compete. Domestic freight services are tradable, at least regionally. The costs of capital and some direct inputs, such as fuel, are also fairly comparable, even in countries at very different levels of development. For developing countries the lower cost of labor may be offset by lower productivity, hence the U curve for di-rect costs.
Excluding landlocked countries, the average inland costs (port and hauling) of importing a 40-foot container or semi-trailer, for all coun-tries in the survey, is about $700: typically 1.5 percent of the value of goods or the equivalent of two weeks of inventories, much less than the actual costs in many developing countries once large induced costs are factored in.9 This aver-age masks wide differences. Large coastal coun-tries, such as Russia and the United States, have higher costs due to long domestic distances. Other countries are primarily trading overland, as in Eastern Europe, increasing the costs.
Higher overall import costs are observed in low logistics performers. In Africa, even in the larger coastal economies of Nigeria and Kenya, the cost of importing or exporting a 40-foot container is in excess of $2,000. Costs are also
increased by the low economies of scale for mul-timodal infrastructure or structural imbalances of volumes of trade along corridors. In some re-gions, especially in Africa and Central Asia, the freight costs are augmented by a proliferation of official and unofficial payments. In western Africa facilitating payments and mandatory procedural fees double the direct cost of trans-portation (Arvis and others 2007).
The competitive position of countries at an intermediate development level tends to be eroded if they have low logistics performance and thus much higher induced costs. Firms in lowest performing countries are even worse off, since they have to support both high freight costs and very high induced costs (see figure 2.2).
The above trends show that the higher lo-gistics costs borne by traders in poor environ-ments are only partially associated with freight transport. And because of their endogenous na-ture, they can thus be lowered by better domes-tic systems and policies. The large differences observed between countries can be explained by the fact that the overall performance of a country is largely influenced by the weakest link in its supply chain. Poor performance, even in only one or two areas, can have very strong implications for overall country perfor-mance. This insight is also important for the design of effective reforms, the subject of the next section.

18 CONNECTING TO COMPETE: TRADE LOGIST ICS IN THE GLOBAL ECONOMY
SEC
TIO
N
3
Traditional measures of
performance such as direct
freight costs and average
delays, while important,
may not capture the overall
logistics performance and
thus the ability of countries
to use trade for growth
Lessons for reform
By providing a comprehensive assessment of the gaps and constraints in logistics performance, the LPI and other information derived from the Logistics Performance Survey can help policy-makers, private stakeholders, and international organizations quantify the constraints coun-tries face in connecting globally.
The LPI and its indicators also suggest that policymakers may have to expand the traditional “facilitation agenda,” focused on trade-related infrastructure and customs in-formation technology, and pursue improve-ments in the markets for logistics services. Reforms to improve logistics should follow an integrated approach, focusing on the in-teraction between infrastructure and public and private services, addressing coordination failures and identifying constituencies for re-form. To be effective, reforms should improve the predictability and reliability of shipments and not just focus on reducing average costs and delays.
For instance, traditional measures of perfor-mance such as direct freight costs and average delays, while important, may not capture the overall logistics performance and thus the abil-ity of countries to use trade for growth. The pre-dictability and reliability of shipments, while more difficult to measure, are more important for firms and may have a much greater impact on their ability to compete.
Reforms must be comprehensive
A gradual approach targeting a single fac-tor of supply chain performance (trade infra-structure or a customs procedure) can bring some initial results, but ultimately may prove limited or unsustainable. For example, poor integration among the agencies involved in
border processes may neutralize the benefit of a customs modernization program (DeWulf and Sokol 2005). Facilitation initiatives for trade corridors may not produce visible effects without modernization of the private services and supporting the market (Arvis and others 2007).
The synergies between the various areas of reform—such as customs, border management, infrastructure, and transport regulation—are supported by further analysis of the Logistics Performance Survey dataset. For instance, the consistency between the different dimensions in logistics performance is lower for lower performing countries: high performers are consistently high performers across all indi-cators, while low performers are inconsistent (figure 3.1).
Ranking discrepancies between performance areas
Note: The indicator used to illustrate the consistency in performance is the
standard deviation of country ranking along the seven component indicators of the
LPI. While there is less correlation among the various factors of performance, the
effect in this chart is amplified by the fact that the LPI values for countries in the
bottom quintile have more “noise” due to a smaller number of assessments.
Figure 3.1 High performers are consistent performers: Discrepancies across factors of performance
Logistics Performance Index
5 4 3 2 10
5
10
15
20
Top quintileHighest performance
Second quintileHigh performance
Third quintileAverage performance
Fourth quintileLow performance
Bottom quintileLowest performance

CONNECTING TO COMPETE: TRADE LOGIST ICS IN THE GLOBAL ECONOMY 19
Some areas of reform are tackled more than others
Most governments are carrying out policy reforms and furthering public investments in critical areas of the supply chain (table 3.1). But facilitation efforts appear to have had sig-nificantly higher impact in customs than in the other border agencies. As seen from the Logis-tics Performance Survey results, for most coun-tries surveyed, improvements in IT are more widespread than in the other areas, followed by the increased availability of private services.
Performance is improving in the majority of areas surveyed in Europe and Central Asia, in the Middle East and North Africa, and in South Asia (table 3.1). But the perception of trends in Sub-Saharan Africa and East Asia is not as strong. Logistics operators in Africa may still be looking for basic improvements, while those in East Asia look for continuing improve-ments to keep up with fast-growing demand.
Implementing reform is not easy
Creating an effective logistics environment requires consistent improvements and the con-tinuing participation of all stakeholders, who can demand concrete and practical improve-ments in performance. Although the problems to be addressed are rather specific, the ability to tackle them depends largely on a country’s over-all governance and institutional context.
Poor logistics environments are often char-acterized by rent-seeking, which creates power-ful vested interests working to maintain the
status quo. Countries become trapped in a vi-cious circle where rent-seeking leads to poor logistics services, often leading to fraud and giving rise to over regulation and unfriendly procedures. This in turn discourages investment and the entry of more efficient service providers, completing a vicious circle of rent-seeking and poor performance (figure 3.2).
Improving logistics requires the capacity to move toward the virtuous circle—connect-ing services, infrastructure investments, and streamlined administrative processes. This en-compasses the technical capacity to undertake reforms in each sub-area and the ability to over-come the political constraints to effective and comprehensive reforms. Change needs to be supported by a wide constituency, so countries with a large and diverse export community have a tremendous advantage over others, such as oil exporters. Unsurprisingly, logistics operators in India and Vietnam are twice as positive as those in other low income countries about the role of business groups in trade facilitation (appendix table A2).
While integrated reforms are essential, priorities and strategies may differ
A comprehensive reform of logistics and trade facilitation is essential. To close the logistics gap, policymakers should pursue improve-ments in the markets for logistics services, reduce coordination failures (especially those of public agencies active in border control), and build strong constituencies to support reform.
High income OECD
& non-OECD
East Asia
& Pacific
Europe &
Central Asia
Latin America
& Caribbean
Middle East &
North Africa South Asia
Sub-Saharan
Africa
Overall business environment 57 44 66 61 68 64 38
Availability of private sector services 58 54 82 70 81 78 51
Quality of telecommunications infrastructure 85 47 89 65 98 71 62
Quality of transport infrastructure 56 41 57 38 67 40 33
Other border crossing-related government
agencies clearance procedures 43 26 62 28 38 30 42
Customs clearance procedures 65 38 69 58 70 60 48
Source: Logistics Performance Survey and appendix table A2.
Table 3.1 Percent of respondents acknowledging positive trends in developments for the following areas, during the last three years

20 CONNECTING TO COMPETE: TRADE LOGIST ICS IN THE GLOBAL ECONOMY
International companies
can bring global knowledge
and pressure for change.
But the support of local
constituencies of exporters,
operators, and public
agencies is crucial
This effort will demand more integrated supply chain-related reforms, according to the perfor-mance of countries, with implications for poli-cymakers and development agencies. For the most severely constrained countries—typically landlocked countries in Africa and Central Asia—innovative solutions may need to be found, and international donors will have an important role.
The Logistics Performance Survey indicates that the differences in the logistics performance between the third and fourth quintiles are often very small and also much smaller than with the others. As a result these two quintiles have been grouped together. Much bigger differences in values are seen for the top two quintiles and the bottom quintile.
The following four groups of countries can be identified in terms of the transition from the vicious circle to the virtuous circle:
Logistics friendly (corresponding to the top quintile).Comprehensive reformers—emerg-ing economies in East Asia and Latin America, new EU member states, South Africa, India (corresponding to the second quintile).Partial reformers—oil producers, most countries in Africa, South Asia, and the Middle East (corresponding to the third and fourth quintile).
Logistics unfriendly—countries with difficult geography (landlocked), least developed countries, or both (corre-sponding to the fifth quintile).
This classification of countries is a broad typology. Given the confidence intervals and the methodology employed, it is indicative of a country’s logistics performance, but should not be inferred directly from the LPI ranking for any specific country. The association with the quintiles should instead be considered a useful guide for setting reform priorities (fig-ure 3.3).
This typology of countries implies that the agenda for reforms, the priorities, and imple-mentation strategies may vary dramatically ac-cording to the broader logistics environment, even though the basic ingredients of success-ful component reforms, such as for customs or ports, may be the same (see table 3.3).
Cross-cutting reforms need to be supported by broad constituencies. International compa-nies can bring global knowledge and pressure for change. But the support of local constituen-cies of exporters, operators, and public agencies is crucial. However, these constituencies tend to be weak in partial reformers and nonexistent in the logistics unfriendly countries.
The LPI rankings and indicators pro-vide robust benchmarks that may help policymakers—and particularly the private
Source: Arvis and others 2007.
Figure 3.2 Vicious and virtuous logistics
Fraud and
need to control
Low quality
fragmented
services
Over-regulation
rents
Inadequate
market
structure
No incentive
to invest
Unfriendly
procedures
Liberalized
market
Incentive
to invest
Integrity and
compliance
High quality
services
Scale
economies
Seamless
process
Trade and transportfacilitation measures
Viciouscircle
Virtuouscircle

CONNECTING TO COMPETE: TRADE LOGIST ICS IN THE GLOBAL ECONOMY 21
sector—to build the case for reform. By show-ing countries how they compare with their competitors and shining a light on the costs of poor logistics performance, it is hoped that the LPI and its indicators may help countries break out of the vicious circle of logistics unfriendliness.
In identifying the key problem areas and constraints, the LPI and its indicators also aim to help guide the preparation of more in-depth, country-specific assessments and strategies, such as trade and transport facilitation audits (Raven 2001), that are needed to generate concrete im-provements in logistics performance.
Areas for reform Logistics friendly
Comprehensive
reformers Partial reformers Logistics unfriendly
Trade-related physical infrastructure × ×× ×× ×××
IT trade-related infrastructure × × ××
Customs × ×× ×××
Other border processes ×× ××× ××× ×××
Reliability of support services × ×× ×××
Other governance-related constraints × ×× ××× ×××
Constituency for reform × × ×× ×××
× = mild constraint ×× = medium constraint ××× = severe constraint
Table 3.2 Identify the severity of constraints to overall performance
Logistics friendly
Seamless procedures and high-quality infrastructure.
Strong, globally integrated service industry.
Comprehensive reformer
Strong coalitions for change implementing core reforms (customs, infrastructure, services).
Working across administrative silos to consistently implement the reforms.
Lowering barriers to entry and favoring a competitive service industry.
Partial reformer
Have implemented some of the core reforms.
Difficulties in working across sectors.
Resistance to change.
Governance problems.
Barriers to entry.
Logistics unfriendly
Trapped in the vicious circle.
Basic reforms in customs or key infrastructure difficult to design and implement.
No incentive to invest in quality services.
Extensive governance problems.
Weak coalition for changes.
Figure 3.3 Logistics typology

22 CONNECTING TO COMPETE: TRADE LOGIST ICS IN THE GLOBAL ECONOMY
Technical note 1Selection of countries
Technical note table 1.1 presents the matrix of how the eight countries are selected based on the respondent’s country of work.
The LPI methodology uses the World Bank Classification of Countries.10 Technical note table 1.2 classifies all World Bank member countries (184) and all other economies with populations of more than 30,000 (208). The country coverage by the logistics performance index (150 total) is also shown.
For operational and analytical purposes, economies are divided among income groups according to 2005 gross national income (GNI) per capita, calculated using the World Bank Atlas method. The groups are: low income, $875 or less; lower middle income, $876–3,465; upper middle income, $3,466–10,725; and high income, $10,726 or more. Other analyti-cal groups based on geographic regions are also used.
Respondents from low
income countries
Respondents from middle
income countries
Respondents from high
income countries
Respondents
from coastal
countries
Five most important
export partner countries
+Three most important
import partner countries
Three most important
export partner countries
+The most important import
partner country
+Four countries randomly, one
from each country group
a) Africa
b) East Asia + Central Asia
c) Latin America
d) Europe less Central Asia + OECD
Four countries randomly out of
one list of five most important
export partner countries
and five most important
import partner countries
+Four countries randomly, one
from each country group:
a) Africa
b) East Asia + Central Asia
c) Latin America
d) Europe less Central
Asia + OECDRespondents
from
landlocked
countries
Four most important
export partner countries
+Two most important
import partner countries
+Two landlocked countries
Three most important
export partner countries
+One most important import
partner country
+Two landlocked countries
+Two countries randomly, one
from each country group:
a) Africa + East Asia + Central
Asia + Latin America and
b) Europe less Central Asia + OECD
Technical note table 1.1 Six country selection rules
Income groups/world regions
Total countries
in group/region
Number of countries
ranked in LPI
LPI’s coverage of
group/ region (%)
Low income 54 51 94
Middle income 98 65 66
Lower middle income 58 41 71
Upper middle income 40 24 60
Low & middle income 152 116 76
East Asia & Pacific 24 13 54
Europe & Central Asia 27 25 93
Latin America & Caribbean 31 21 68
Middle East & North Africa 14 11 79
South Asia 8 7 88
Sub-Saharan Africa 48 39 81
High income 56 34 61
European Monetary Union 12 12 100
High income (OECD) 24 23 96
High income (non-OECD) 32 10 31
Heavily indebted poor countries (HIPC) 40 37 93
Least developed countries (UN classification) 49 41 84
Landlocked developing countries (UN classification) 31 26 84
Commonwealth of Independent States 12 10 83
Transitional 24 22 92
Organization of Petroleum Exporting Countries 12 10 83
Total countries 208 150 72
Technical note table 1.2 Regional coverage of the Logistics Performance Index

CONNECTING TO COMPETE: TRADE LOGIST ICS IN THE GLOBAL ECONOMY 23
Technical note 2The Logistics Performance Index and multivariate regressions
Straightforward econometric analyses point to significant association between the LPI and outcomes such as:
Medium term growth over 1992–2005.Trade expansion, defined as the overall annual change in trade openness over the same period. It is excess of trade growth over GDP growth.The index of trade diversification—the Theil index, which can be interpreted
as the natural logarithm of the number of exported varieties.
The sample of countries excludes high in-come countries and oil exporters. The results are robust to other choices of period (technical note table 2.1). Regression 1 measures the LPI against the level of development (Log [GNI/cap] 2005). The residual measures how much the countries are performing logistically against their potential (the standard deviation in LPI gap is 0.3). Regressions 2 to 6 measure one of the growth, trade expansion, or diversification variables against the LPI index and Log (GNI/cap), or against the sole LPI gap.
Independent variable
Dependent variable
Regression 1
LPI
Regression 2
Growth
Regression 3
Growth
Regression 4
Trade
expansion
Regression 5
Trade
expansion
Regression 6
Theil index
LPI 2.0% 3.7% 1.05
(2.8)** (3.5)** (3.5)**
Log(GNI/cap) 0.422 –0.8% –2.1% 0.95
(7.1)** (–1.5) (–2.7)** (4.4)**
LPI gap 2.0% 3.7%
(2.8)** (3.5)**
R² 0.35 0.08 0.08 0.12 0.11 0.44
F 50.9 3.9 7.8 6.4 12.1 38.5
Number of countries 97 97 97 97 97 97
*Significant at the 5 percent level.
**Significant at the 1 percent level.
Technical note table 2.1

24 CONNECTING TO COMPETE: TRADE LOGIST ICS IN THE GLOBAL ECONOMY
Notes
Makillie (2006).1.The methodology developed by Daley and Murphy in 1993—using 2.a survey format, a 4-point scale, and open-ended questions—set
out to measure the perceived importance and influence of different
component attributes that affect the logistical friendliness of
countries. In a follow up study by Ojala and Qeiroz (2004) only
those characteristics identified as best encapsulating logistics
performance were included for evaluation.
These interviews were conducted in the context of the Trade and 3.Transport Facilitation Audits (TTFA) performed by the World Bank
and others (Raven 2001) and contributed substantially to refining
the methodology.
While respondents know best the countries with which they trade 4.most, relying on trade statistics alone would leave small and low
income economies uncovered.
In appendix table A1, the short names for these seven areas of 5.performance are: customs, infrastructure, international shipments,
logistics competence, tracking and tracing, domestic logistics
costs, and timeliness.
Domestic costs were found to be uncorrelated to the other areas 6.in the LPI. Therefore, being less significant, this component was
dropped from the composition of the index.
Tour de role7. refers to a heavily regulated freight allocation system
where truckers are queuing to get loads in turns. Price is typically
set by collusion between transport unions and the government.
In appendix table A2, performance is evaluated in 30 subareas 8.for which LPI quintiles, regional, or income group averages allow
for meaningful comparisons. For most countries the number of
respondents in this section of the survey is too small to warrant a
country statistic.
The typical value of a container of consumer goods is $50,000, 9.while the inventory value is about 0.1 percent per day (Arvis and
others 2007).
For detailed information on the World Bank Classification of 10.Countries, visit www.worldbank.org/data/.
References
Arvis, Jean-François, Michel Bellier, and Gaël Raballand. 2006.“Success factors for improving logistics in a middle-income country.”
Transport Notes Series 35. World Bank, Washington, D.C.
Arvis, Jean-François, Gaël Raballand, and Jean-François Marteau. 2007. “The cost of being landlocked: logistics costs and supply
chain reliability.” Policy Research Working Paper 4258. World Bank,
Washington, D.C.
Daley, James M., Douglas R. Dalenberg, and Paul R. Murphy. 1993.“Doing business in global markets: Perspectives of international
freight forwarders.” Journal of Global Marketing 6 (4): 53–68.
Daley, James M., and Paul R. Murphy. Spring 1999. “Revisiting
logistical friendliness: perspectives of international freight forwarders.”
Journal of Transportation Management: 65–71.
De Wulf, Luc and José Sokol, eds. 2004. Customs modernization
initiatives: case studies. Washington, D.C.: The World Bank.
———. 2005. Customs modernization handbook. Washington, D.C.: The
World Bank.
Guasch, J., and Joseph Luis Kogan. 2003. “Just in case inventories: a
cross country analysis.” Policy Research Working Paper 3012. World
Bank, Washington, D.C.
Labaste, Patrick. 2003. “Linking farmers to market, exporting Malian
Mangoes to Europe.” Working Paper 60. World Bank, Africa Region,
Washington, D.C.
Makillie, Paul. 2006. “The physical internet.” The Economist. June 15.
Ojala L., and C. Qeiroz, eds. 2004, March. “Transport Sector
Restructuring in the Baltic States towards EU accession.” Working
Paper 31123. World Bank, Washington, D.C.
Ojala, Lauri, Tapio Naula, and Torsten Hoffmann. 2005. “Trade and
transport facilitation: audit of the Baltic States (TTFBS).” Working
Paper 31121. World Bank, Europe and Central Asia Region,
Washington, D.C.
Raven, John. 2001. Trade and transport facilitation: a toolkit for audit,
analysis, and remedial action. Washington, D.C.: The World Bank.
Rodrigues, Bowersox, and Calantone. 2005. “Estimation of global
and national logistics expenditures: 2002 Data Update.” Journal of
business logistics 26 (2):1–16.
Wilson, John, Tsunehiro Otsuki, and Catherine Mann. 2004.“Assessing the potential benefit of trade facilitation: a Global
perspective.” Policy Research Working Paper 3224. World Bank,
Washington, D.C.
World Bank. 2005. World Development Indicators 2005. Washington D.C.:
World Bank.

CONNECTING TO COMPETE: TRADE LOGIST ICS IN THE GLOBAL ECONOMY 25
Appendix
Table A1 Country rankings on the Logistics Performance Index and indicators 26
Table A2 Country-specific environment and institutions data averages, by income group and region 34
Table A3 Country-specific performance data, by country 36

26 CONNECTING TO COMPETE: TRADE LOGIST ICS IN THE GLOBAL ECONOMY
Country
Logistics Performance Index Customs Infrastructure International shipments
LPI rank Score Confidence interval Rank Score Rank Score Rank Score
Singapore 1 4.19 0.05 3 3.90 2 4.27 2 4.04
Netherlands 2 4.18 0.04 1 3.99 1 4.29 1 4.05
Germany 3 4.10 0.03 4 3.88 3 4.19 4 3.91
Sweden 4 4.08 0.08 5 3.85 5 4.11 5 3.90
Austria 5 4.06 0.11 8 3.83 9 4.06 3 3.97
Japan 6 4.02 0.03 11 3.79 6 4.11 9 3.77
Switzerland 7 4.02 0.08 6 3.85 4 4.13 14 3.67
Hong Kong, China 8 4.00 0.04 7 3.84 8 4.06 7 3.78
United Kingdom 9 3.99 0.03 13 3.74 10 4.05 6 3.85
Canada 10 3.92 0.05 9 3.82 12 3.95 8 3.78
Ireland 11 3.91 0.11 10 3.82 19 3.72 11 3.76
Belgium 12 3.89 0.05 16 3.61 11 4.00 16 3.65
Denmark 13 3.86 0.10 2 3.97 14 3.82 15 3.67
United States 14 3.84 0.03 19 3.52 7 4.07 20 3.58
Finland 15 3.82 0.13 14 3.68 17 3.81 30 3.30
Norway 16 3.81 0.09 12 3.76 15 3.82 19 3.62
Australia 17 3.79 0.09 17 3.58 20 3.65 12 3.72
France 18 3.76 0.05 21 3.51 16 3.82 18 3.63
New Zealand 19 3.75 0.12 18 3.57 22 3.61 10 3.77
United Arab Emirates 20 3.73 0.08 20 3.52 18 3.80 13 3.68
Taiwan, China 21 3.64 0.09 25 3.25 21 3.62 17 3.65
Italy 22 3.58 0.05 29 3.19 23 3.52 21 3.57
Luxembourg 23 3.54 0.30 15 3.67 13 3.86 45 3.00
South Africa 24 3.53 0.10 27 3.22 26 3.42 22 3.56
Korea, Rep. 25 3.52 0.07 28 3.22 25 3.44 24 3.44
Spain 26 3.52 0.08 30 3.17 24 3.51 23 3.45
Malaysia 27 3.48 0.07 23 3.36 28 3.33 26 3.36
Portugal 28 3.38 0.11 26 3.24 31 3.16 33 3.23
Greece 29 3.36 0.15 31 3.06 35 3.05 37 3.11
China 30 3.32 0.04 35 2.99 30 3.20 28 3.31
Thailand 31 3.31 0.10 32 3.03 32 3.16 32 3.24
Chile 32 3.25 0.08 24 3.32 34 3.06 34 3.21
Israel 33 3.21 0.17 43 2.73 37 3.00 31 3.27
Turkey 34 3.15 0.13 33 3.00 39 2.94 42 3.07
Hungary 35 3.15 0.11 34 3.00 33 3.12 41 3.07
Bahrain 36 3.15 0.18 22 3.40 27 3.40 27 3.33
Slovenia 37 3.14 0.18 40 2.79 29 3.22 36 3.14
Czech Republic 38 3.13 0.15 36 2.95 36 3.00 43 3.06
India 39 3.07 0.08 47 2.69 42 2.90 39 3.08
Poland 40 3.04 0.11 38 2.88 51 2.69 52 2.92
Saudi Arabia 41 3.02 0.06 45 2.72 38 2.95 50 2.93
Latvia 42 3.02 0.16 58 2.53 58 2.56 29 3.31
Indonesia 43 3.01 0.13 44 2.73 45 2.83 44 3.05
Kuwait 44 2.99 0.52 59 2.50 46 2.83 76 2.60
Argentina 45 2.98 0.09 51 2.65 47 2.81 49 2.97
Qatar 46 2.98 0.19 67 2.44 55 2.63 46 3.00
Table A1 Country rankings on the Logistics Performance Index and indicators

CONNECTING TO COMPETE: TRADE LOGIST ICS IN THE GLOBAL ECONOMY 27
Logistics competence Tracking & tracing Domestic logistics costs Timeliness
Rank Score Rank Score Rank Score Rank Score
2 4.21 1 4.25 113 2.70 1 4.53
1 4.25 4 4.14 120 2.65 5 4.38
3 4.21 5 4.12 135 2.34 8 4.33
6 4.06 3 4.15 129 2.44 4 4.43
4 4.13 12 3.97 141 2.24 3 4.44
5 4.12 7 4.08 148 2.02 6 4.34
8 4.00 9 4.04 139 2.26 2 4.48
9 3.99 8 4.06 119 2.66 7 4.33
7 4.02 6 4.10 143 2.21 11 4.25
12 3.85 11 3.98 91 2.84 13 4.19
11 3.93 15 3.96 121 2.65 9 4.32
10 3.95 14 3.96 122 2.62 10 4.25
15 3.83 17 3.76 128 2.52 18 4.11
13 3.85 10 4.01 144 2.20 19 4.11
14 3.85 2 4.17 142 2.22 15 4.18
17 3.78 20 3.67 147 2.08 12 4.24
18 3.76 13 3.97 97 2.80 20 4.10
19 3.76 16 3.87 136 2.34 23 4.02
16 3.82 19 3.68 89 2.86 22 4.05
20 3.67 23 3.61 98 2.80 17 4.12
23 3.58 24 3.60 42 3.10 14 4.18
21 3.63 21 3.66 132 2.39 27 3.93
33 3.22 26 3.56 85 2.88 25 4.00
25 3.54 18 3.71 124 2.61 31 3.78
22 3.63 25 3.56 110 2.73 30 3.86
24 3.55 22 3.63 107 2.75 29 3.86
26 3.40 28 3.51 36 3.13 26 3.95
34 3.19 30 3.44 102 2.78 21 4.06
28 3.33 27 3.53 88 2.87 16 4.13
27 3.40 31 3.37 72 2.97 36 3.68
29 3.31 36 3.25 25 3.21 28 3.91
35 3.19 37 3.17 114 2.68 44 3.55
32 3.23 29 3.46 145 2.17 41 3.58
30 3.29 34 3.27 112 2.71 52 3.38
37 3.07 44 3.00 57 3.00 34 3.69
59 2.75 47 3.00 140 2.25 84 3.00
36 3.09 52 2.91 32 3.18 33 3.73
42 3.00 35 3.27 10 3.40 42 3.56
31 3.27 42 3.03 46 3.08 47 3.47
38 3.04 40 3.12 23 3.23 40 3.59
51 2.88 43 3.02 106 2.76 39 3.65
48 2.94 41 3.06 73 2.94 35 3.69
50 2.90 33 3.30 92 2.84 58 3.28
47 3.00 32 3.33 130 2.40 32 3.75
44 3.00 46 3.00 93 2.84 46 3.50
43 3.00 38 3.17 56 3.00 38 3.67
28 CONNECTING TO COMPETE: TRADE LOGIST ICS IN THE GLOBAL ECONOMY
Country
Logistics Performance Index Customs Infrastructure International shipments
LPI rank Score Confidence interval Rank Score Rank Score Rank Score
Estonia 47 2.95 0.11 42 2.75 41 2.91 56 2.85
Oman 48 2.92 0.22 46 2.71 43 2.86 79 2.57
Cyprus 49 2.92 0.13 41 2.77 40 2.91 51 2.92
Slovak Republic 50 2.92 0.17 55 2.61 52 2.68 38 3.09
Romania 51 2.91 0.18 56 2.60 50 2.73 35 3.20
Jordan 52 2.89 0.13 54 2.62 56 2.62 40 3.08
Vietnam 53 2.89 0.18 37 2.89 60 2.50 47 3.00
Panama 54 2.89 0.15 48 2.68 48 2.79 58 2.80
Bulgaria 55 2.87 0.15 66 2.47 63 2.47 59 2.79
Mexico 56 2.87 0.05 60 2.50 53 2.68 53 2.91
São Tomé and Principe 57 2.86 0.49 61 2.50 95 2.20 25 3.40
Lithuania 58 2.78 0.21 52 2.64 80 2.30 48 3.00
Peru 59 2.77 0.15 49 2.68 57 2.57 54 2.91
Tunisia 60 2.76 0.15 39 2.83 44 2.83 55 2.86
Brazil 61 2.75 0.07 74 2.39 49 2.75 74 2.61
Guinea 62 2.71 0.24 62 2.50 75 2.33 85 2.50
Croatia 63 2.71 0.20 78 2.36 61 2.50 67 2.69
Sudan 64 2.71 0.19 79 2.36 72 2.36 68 2.67
Philippines 65 2.69 0.15 53 2.64 86 2.26 63 2.77
El Salvador 66 2.66 0.13 75 2.38 68 2.42 61 2.78
Mauritania 67 2.63 0.19 70 2.40 96 2.20 77 2.60
Pakistan 68 2.62 0.16 69 2.41 71 2.37 65 2.72
Venezuela, RB 69 2.62 0.08 77 2.37 59 2.51 66 2.69
Ecuador 70 2.60 0.26 88 2.25 73 2.36 72 2.64
Paraguay 71 2.57 0.15 100 2.20 64 2.47 113 2.29
Costa Rica 72 2.55 0.11 64 2.49 67 2.43 82 2.53
Ukraine 73 2.55 0.15 97 2.22 74 2.35 83 2.53
Belarus 74 2.53 0.25 50 2.67 54 2.63 126 2.13
Guatemala 75 2.53 0.18 87 2.27 104 2.13 73 2.62
Kenya 76 2.52 0.17 81 2.33 100 2.15 60 2.79
Gambia, The 77 2.52 0.32 89 2.25 76 2.33 69 2.67
Iran, Islamic Rep. 78 2.51 0.20 63 2.50 66 2.44 78 2.59
Uruguay 79 2.51 0.10 86 2.29 70 2.38 100 2.40
Honduras 80 2.50 0.11 65 2.48 79 2.32 93 2.48
Cambodia 81 2.50 0.12 104 2.19 81 2.30 95 2.47
Colombia 82 2.50 0.10 116 2.10 85 2.28 75 2.61
Uganda 83 2.49 0.16 99 2.21 99 2.17 98 2.42
Cameroon 84 2.49 0.25 57 2.57 114 2.00 110 2.33
Comoros 85 2.48 0.15 85 2.30 65 2.46 108 2.33
Angola 86 2.48 0.22 71 2.40 88 2.25 87 2.50
Bangladesh 87 2.47 0.18 125 2.00 82 2.29 96 2.46
Bosnia and Herzegovina 88 2.46 0.17 84 2.32 87 2.26 86 2.50
Benin 89 2.45 0.21 142 1.80 134 1.89 62 2.78
Macedonia, FYR 90 2.43 0.24 126 2.00 83 2.29 70 2.67
Malawi 91 2.42 0.26 90 2.25 105 2.13 81 2.56
Sri Lanka 92 2.40 0.14 91 2.25 106 2.13 112 2.31
Table A1 Country rankings on the Logistics Performance Index and indicators (continued)

CONNECTING TO COMPETE: TRADE LOGIST ICS IN THE GLOBAL ECONOMY 29
Logistics competence Tracking & tracing Domestic logistics costs Timeliness
Rank Score Rank Score Rank Score Rank Score
45 3.00 58 2.84 18 3.29 53 3.35
67 2.67 63 2.80 20 3.25 24 4.00
58 2.77 51 2.92 76 2.92 62 3.25
40 3.00 55 2.87 44 3.09 60 3.26
52 2.86 56 2.86 123 2.62 66 3.18
41 3.00 57 2.85 77 2.92 68 3.17
56 2.80 53 2.90 17 3.30 65 3.22
61 2.73 49 2.93 26 3.21 49 3.43
53 2.86 39 3.14 80 2.91 43 3.56
57 2.80 48 2.96 101 2.79 51 3.40
39 3.00 45 3.00 2 3.67 76 3.00
64 2.70 74 2.60 60 3.00 50 3.40
60 2.73 67 2.70 59 3.00 80 3.00
88 2.43 60 2.83 30 3.20 105 2.80
49 2.94 65 2.77 126 2.58 72 3.10
68 2.67 59 2.83 29 3.20 45 3.50
54 2.83 87 2.46 49 3.08 48 3.45
55 2.83 50 2.92 58 3.00 67 3.17
70 2.65 69 2.65 19 3.27 70 3.14
78 2.53 61 2.82 74 2.94 73 3.06
65 2.70 62 2.80 41 3.11 71 3.10
63 2.71 76 2.57 90 2.86 88 2.93
74 2.59 79 2.54 115 2.68 75 3.03
71 2.64 89 2.45 12 3.36 59 3.27
73 2.63 68 2.67 38 3.13 63 3.23
89 2.43 78 2.57 48 3.08 90 2.89
90 2.41 81 2.53 21 3.25 55 3.31
120 2.13 66 2.71 37 3.13 78 3.00
79 2.50 90 2.43 65 3.00 64 3.23
104 2.31 73 2.62 108 2.75 89 2.92
46 3.00 99 2.33 67 3.00 132 2.50
66 2.69 125 2.00 75 2.93 106 2.80
84 2.45 77 2.57 103 2.78 82 3.00
91 2.41 91 2.41 86 2.88 93 2.88
82 2.47 80 2.53 27 3.21 74 3.05
86 2.44 71 2.63 81 2.91 86 2.94
77 2.55 100 2.33 3 3.63 56 3.29
109 2.25 85 2.50 64 3.00 57 3.29
72 2.64 83 2.50 62 3.00 117 2.67
81 2.50 92 2.38 66 3.00 100 2.83
103 2.33 88 2.46 50 3.08 54 3.33
98 2.37 105 2.29 9 3.41 77 3.00
75 2.56 54 2.89 24 3.22 107 2.78
101 2.33 84 2.50 63 3.00 99 2.83
76 2.56 126 2.00 39 3.13 79 3.00
85 2.45 75 2.58 47 3.08 113 2.69

30 CONNECTING TO COMPETE: TRADE LOGIST ICS IN THE GLOBAL ECONOMY
Country
Logistics Performance Index Customs Infrastructure International shipments
LPI rank Score Confidence interval Rank Score Rank Score Rank Score
Nigeria 93 2.40 0.09 94 2.23 92 2.23 92 2.49
Morocco 94 2.38 0.22 101 2.20 77 2.33 64 2.75
Papua New Guinea 95 2.38 0.24 127 2.00 123 2.00 80 2.57
Dominican Republic 96 2.38 0.10 82 2.33 97 2.18 107 2.34
Egypt, Arab Rep. 97 2.37 0.24 119 2.08 119 2.00 111 2.33
Lebanon 98 2.37 0.31 106 2.17 102 2.14 88 2.50
Russian Federation 99 2.37 0.06 136 1.94 93 2.23 94 2.48
Zambia 100 2.37 0.27 120 2.08 120 2.00 102 2.40
Senegal 101 2.37 0.18 76 2.38 108 2.09 130 2.09
Côte d’Ivoire 102 2.36 0.23 98 2.22 94 2.22 127 2.13
Kyrgyz Republic 103 2.35 0.14 102 2.20 112 2.06 106 2.35
Ethiopia 104 2.33 0.21 109 2.14 135 1.88 97 2.43
Liberia 105 2.31 0.23 72 2.40 101 2.14 57 2.83
Moldova 106 2.31 0.19 110 2.14 128 1.94 105 2.36
Bolivia 107 2.31 0.12 128 2.00 111 2.08 99 2.42
Lesotho 108 2.30 0.35 73 2.40 115 2.00 89 2.50
Mali 109 2.29 0.14 107 2.17 132 1.90 119 2.23
Mozambique 110 2.29 0.18 95 2.23 109 2.08 118 2.25
Azerbaijan 111 2.29 0.22 96 2.23 116 2.00 90 2.50
Yemen, Rep. 112 2.29 0.19 105 2.18 110 2.08 123 2.20
Burundi 113 2.29 0.36 103 2.20 62 2.50 84 2.50
Zimbabwe 114 2.29 0.21 138 1.92 136 1.87 114 2.27
Serbia and Montenegro 115 2.28 0.13 83 2.33 98 2.18 116 2.25
Guinea-Bissau 116 2.28 0.23 111 2.14 89 2.25 120 2.22
Lao PDR 117 2.25 0.21 121 2.08 121 2.00 103 2.40
Jamaica 118 2.25 0.11 80 2.35 113 2.03 128 2.13
Togo 119 2.25 0.20 117 2.10 90 2.25 101 2.40
Madagascar 120 2.24 0.15 93 2.24 107 2.13 117 2.25
Burkina Faso 121 2.24 0.23 115 2.13 133 1.89 71 2.67
Nicaragua 122 2.21 0.14 112 2.14 137 1.86 124 2.18
Haiti 123 2.21 0.13 122 2.08 103 2.14 122 2.20
Eritrea 124 2.19 0.26 113 2.14 117 2.00 135 2.00
Ghana 125 2.16 0.25 129 2.00 91 2.25 115 2.25
Namibia 126 2.16 0.28 114 2.14 118 2.00 125 2.14
Somalia 127 2.16 0.22 68 2.43 147 1.63 141 1.88
Bhutan 128 2.16 0.13 134 1.95 127 1.95 134 2.06
Uzbekistan 129 2.16 0.14 137 1.94 124 2.00 133 2.07
Nepal 130 2.14 0.17 141 1.83 144 1.77 131 2.09
Armenia 131 2.14 0.23 118 2.10 142 1.78 140 2.00
Mauritius 132 2.13 0.25 130 2.00 84 2.29 121 2.20
Kazakhstan 133 2.12 0.13 139 1.91 138 1.86 129 2.10
Gabon 134 2.10 0.36 92 2.25 69 2.40 147 1.67
Syrian Arab Republic 135 2.09 0.20 108 2.17 131 1.91 138 2.00
Mongolia 136 2.08 0.20 131 2.00 129 1.92 91 2.50
Tanzania 137 2.08 0.17 123 2.07 122 2.00 132 2.08
Solomon Islands 138 2.08 0.19 144 1.73 126 2.00 104 2.36
Table A1 Country rankings on the Logistics Performance Index and indicators (continued)
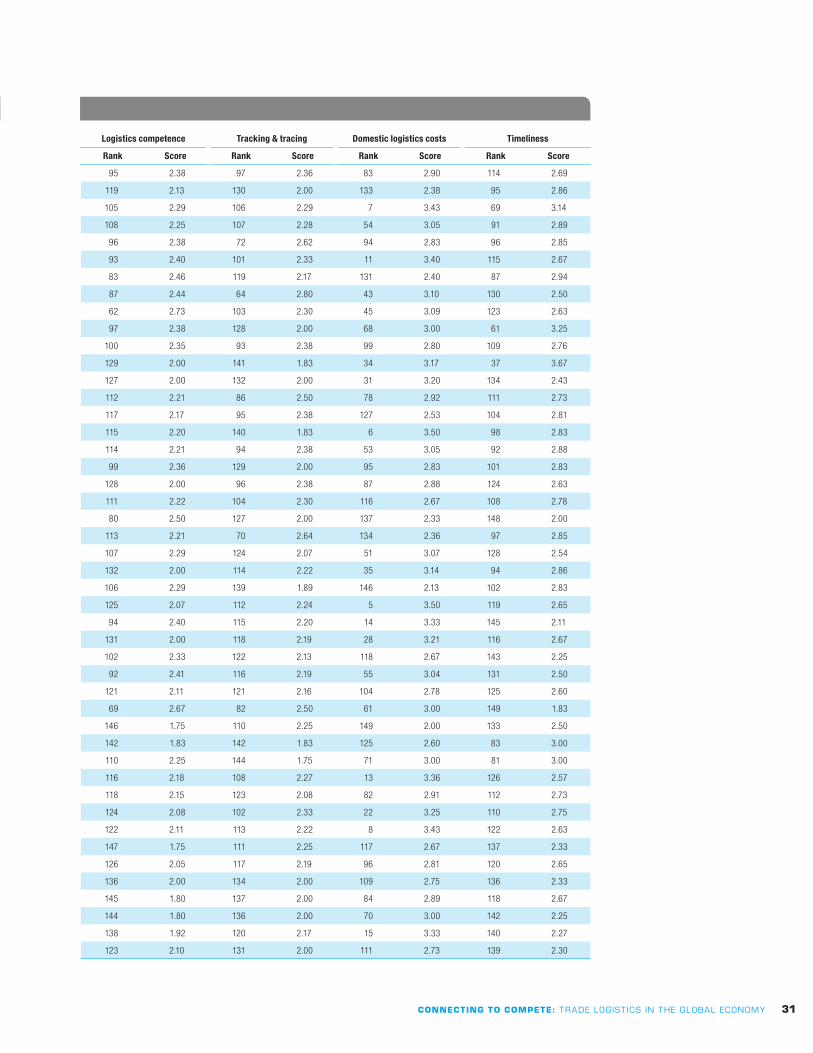
CONNECTING TO COMPETE: TRADE LOGIST ICS IN THE GLOBAL ECONOMY 31
Logistics competence Tracking & tracing Domestic logistics costs Timeliness
Rank Score Rank Score Rank Score Rank Score
95 2.38 97 2.36 83 2.90 114 2.69
119 2.13 130 2.00 133 2.38 95 2.86
105 2.29 106 2.29 7 3.43 69 3.14
108 2.25 107 2.28 54 3.05 91 2.89
96 2.38 72 2.62 94 2.83 96 2.85
93 2.40 101 2.33 11 3.40 115 2.67
83 2.46 119 2.17 131 2.40 87 2.94
87 2.44 64 2.80 43 3.10 130 2.50
62 2.73 103 2.30 45 3.09 123 2.63
97 2.38 128 2.00 68 3.00 61 3.25
100 2.35 93 2.38 99 2.80 109 2.76
129 2.00 141 1.83 34 3.17 37 3.67
127 2.00 132 2.00 31 3.20 134 2.43
112 2.21 86 2.50 78 2.92 111 2.73
117 2.17 95 2.38 127 2.53 104 2.81
115 2.20 140 1.83 6 3.50 98 2.83
114 2.21 94 2.38 53 3.05 92 2.88
99 2.36 129 2.00 95 2.83 101 2.83
128 2.00 96 2.38 87 2.88 124 2.63
111 2.22 104 2.30 116 2.67 108 2.78
80 2.50 127 2.00 137 2.33 148 2.00
113 2.21 70 2.64 134 2.36 97 2.85
107 2.29 124 2.07 51 3.07 128 2.54
132 2.00 114 2.22 35 3.14 94 2.86
106 2.29 139 1.89 146 2.13 102 2.83
125 2.07 112 2.24 5 3.50 119 2.65
94 2.40 115 2.20 14 3.33 145 2.11
131 2.00 118 2.19 28 3.21 116 2.67
102 2.33 122 2.13 118 2.67 143 2.25
92 2.41 116 2.19 55 3.04 131 2.50
121 2.11 121 2.16 104 2.78 125 2.60
69 2.67 82 2.50 61 3.00 149 1.83
146 1.75 110 2.25 149 2.00 133 2.50
142 1.83 142 1.83 125 2.60 83 3.00
110 2.25 144 1.75 71 3.00 81 3.00
116 2.18 108 2.27 13 3.36 126 2.57
118 2.15 123 2.08 82 2.91 112 2.73
124 2.08 102 2.33 22 3.25 110 2.75
122 2.11 113 2.22 8 3.43 122 2.63
147 1.75 111 2.25 117 2.67 137 2.33
126 2.05 117 2.19 96 2.81 120 2.65
136 2.00 134 2.00 109 2.75 136 2.33
145 1.80 137 2.00 84 2.89 118 2.67
144 1.80 136 2.00 70 3.00 142 2.25
138 1.92 120 2.17 15 3.33 140 2.27
123 2.10 131 2.00 111 2.73 139 2.30

32 CONNECTING TO COMPETE: TRADE LOGIST ICS IN THE GLOBAL ECONOMY
Country
Logistics Performance Index Customs Infrastructure International shipments
LPI rank Score Confidence interval Rank Score Rank Score Rank Score
Albania 139 2.08 0.17 132 2.00 78 2.33 109 2.33
Algeria 140 2.06 0.22 148 1.60 139 1.83 139 2.00
Guyana 141 2.05 0.15 135 1.95 143 1.78 144 1.80
Chad 142 1.98 0.16 133 2.00 141 1.80 142 1.83
Niger 143 1.97 0.23 145 1.67 149 1.40 145 1.80
Sierra Leone 144 1.95 0.21 149 1.58 140 1.83 143 1.82
Djibouti 145 1.94 0.16 146 1.64 130 1.92 137 2.00
Tajikistan 146 1.93 0.19 140 1.91 125 2.00 136 2.00
Myanmar 147 1.86 0.17 124 2.07 145 1.69 146 1.73
Rwanda 148 1.77 0.13 143 1.80 148 1.53 148 1.67
Timor-Leste 149 1.71 0.23 147 1.63 146 1.67 149 1.50
Afghanistan 150 1.21 0.10 150 1.30 150 1.10 150 1.22
Table A1 Country rankings on the Logistics Performance Index and indicators (continued)

CONNECTING TO COMPETE: TRADE LOGIST ICS IN THE GLOBAL ECONOMY 33
Logistics competence Tracking & tracing Domestic logistics costs Timeliness
Rank Score Rank Score Rank Score Rank Score
130 2.00 145 1.67 105 2.78 144 2.13
139 1.92 109 2.27 33 3.17 103 2.82
137 1.95 98 2.35 4 3.50 129 2.50
143 1.82 138 1.91 1 4.00 127 2.56
134 2.00 133 2.00 150 1.67 85 3.00
140 1.91 135 2.00 69 3.00 121 2.64
133 2.00 143 1.82 100 2.80 138 2.30
141 1.90 146 1.67 138 2.33 146 2.11
135 2.00 149 1.57 79 2.92 147 2.08
148 1.67 148 1.60 52 3.07 135 2.38
149 1.60 147 1.67 16 3.33 141 2.25
150 1.25 150 1.00 40 3.13 150 1.38
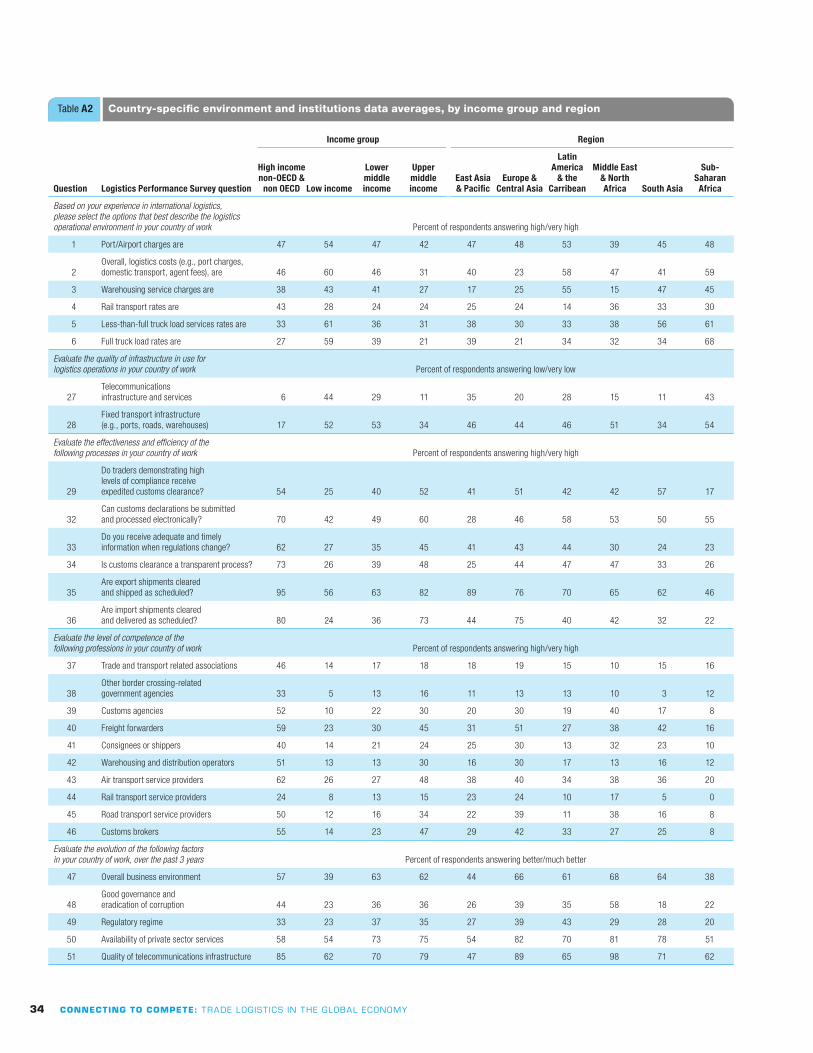
34 CONNECTING TO COMPETE: TRADE LOGIST ICS IN THE GLOBAL ECONOMY
Question Logistics Performance Survey question
Income group Region
High income
non-OECD &
non OECD Low income
Lower
middle
income
Upper
middle
income
East Asia
& Pacific
Europe &
Central Asia
Latin
America
& the
Carribean
Middle East
& North
Africa South Asia
Sub-
Saharan
Africa
Based on your experience in international logistics,
please select the options that best describe the logistics
operational environment in your country of work Percent of respondents answering high/very high
1 Port/Airport charges are 47 54 47 42 47 48 53 39 45 48
2
Overall, logistics costs (e.g., port charges,
domestic transport, agent fees), are 46 60 46 31 40 23 58 47 41 59
3 Warehousing service charges are 38 43 41 27 17 25 55 15 47 45
4 Rail transport rates are 43 28 24 24 25 24 14 36 33 30
5 Less-than-full truck load services rates are 33 61 36 31 38 30 33 38 56 61
6 Full truck load rates are 27 59 39 21 39 21 34 32 34 68
Evaluate the quality of infrastructure in use for
logistics operations in your country of work Percent of respondents answering low/very low
27
Telecommunications
infrastructure and services 6 44 29 11 35 20 28 15 11 43
28
Fixed transport infrastructure
(e.g., ports, roads, warehouses) 17 52 53 34 46 44 46 51 34 54
Evaluate the effectiveness and efficiency of the
following processes in your country of work Percent of respondents answering high/very high
29
Do traders demonstrating high
levels of compliance receive
expedited customs clearance? 54 25 40 52 41 51 42 42 57 17
32
Can customs declarations be submitted
and processed electronically? 70 42 49 60 28 46 58 53 50 55
33
Do you receive adequate and timely
information when regulations change? 62 27 35 45 41 43 44 30 24 23
34 Is customs clearance a transparent process? 73 26 39 48 25 44 47 47 33 26
35
Are export shipments cleared
and shipped as scheduled? 95 56 63 82 89 76 70 65 62 46
36
Are import shipments cleared
and delivered as scheduled? 80 24 36 73 44 75 40 42 32 22
Evaluate the level of competence of the
following professions in your country of work Percent of respondents answering high/very high
37 Trade and transport related associations 46 14 17 18 18 19 15 10 15 16
38
Other border crossing-related
government agencies 33 5 13 16 11 13 13 10 3 12
39 Customs agencies 52 10 22 30 20 30 19 40 17 8
40 Freight forwarders 59 23 30 45 31 51 27 38 42 16
41 Consignees or shippers 40 14 21 24 25 30 13 32 23 10
42 Warehousing and distribution operators 51 13 13 30 16 30 17 13 16 12
43 Air transport service providers 62 26 27 48 38 40 34 38 36 20
44 Rail transport service providers 24 8 13 15 23 24 10 17 5 0
45 Road transport service providers 50 12 16 34 22 39 11 38 16 8
46 Customs brokers 55 14 23 47 29 42 33 27 25 8
Evaluate the evolution of the following factors
in your country of work, over the past 3 years Percent of respondents answering better/much better
47 Overall business environment 57 39 63 62 44 66 61 68 64 38
48
Good governance and
eradication of corruption 44 23 36 36 26 39 35 58 18 22
49 Regulatory regime 33 23 37 35 27 39 43 29 28 20
50 Availability of private sector services 58 54 73 75 54 82 70 81 78 51
51 Quality of telecommunications infrastructure 85 62 70 79 47 89 65 98 71 62
Table A2 Country-specific environment and institutions data averages, by income group and region
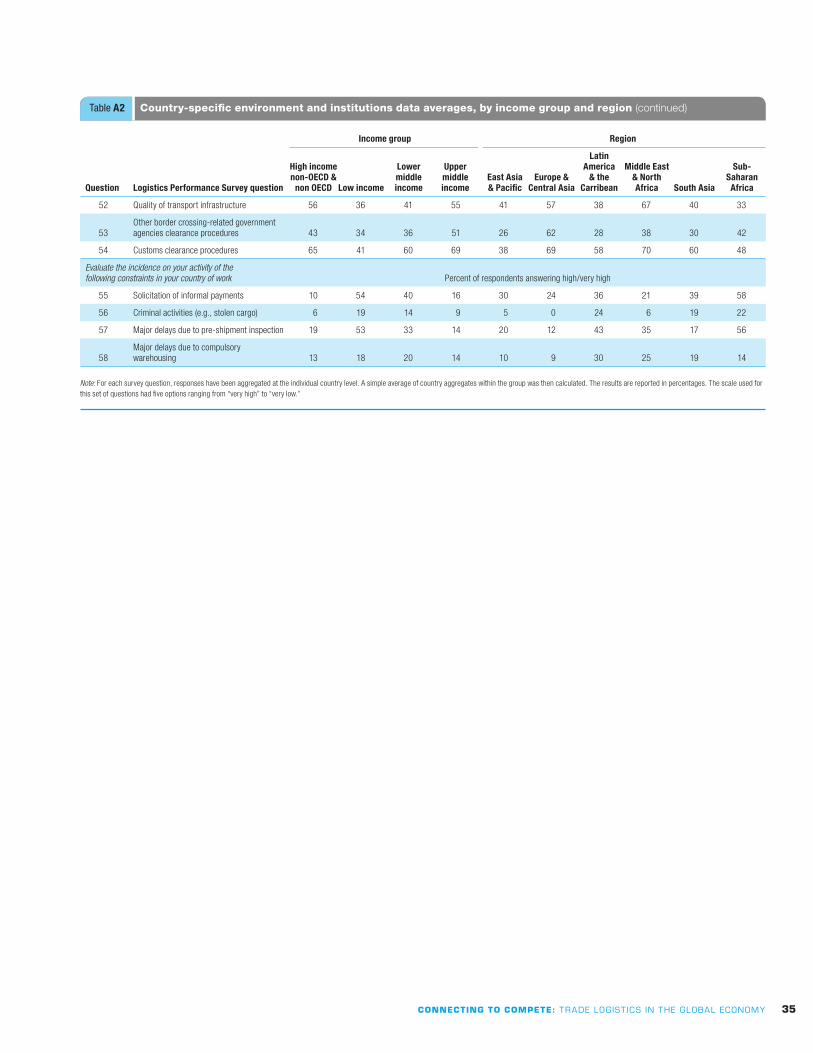
CONNECTING TO COMPETE: TRADE LOGIST ICS IN THE GLOBAL ECONOMY 35
Question Logistics Performance Survey question
Income group Region
High income
non-OECD &
non OECD Low income
Lower
middle
income
Upper
middle
income
East Asia
& Pacific
Europe &
Central Asia
Latin
America
& the
Carribean
Middle East
& North
Africa South Asia
Sub-
Saharan
Africa
52 Quality of transport infrastructure 56 36 41 55 41 57 38 67 40 33
53
Other border crossing-related government
agencies clearance procedures 43 34 36 51 26 62 28 38 30 42
54 Customs clearance procedures 65 41 60 69 38 69 58 70 60 48
Evaluate the incidence on your activity of the
following constraints in your country of work Percent of respondents answering high/very high
55 Solicitation of informal payments 10 54 40 16 30 24 36 21 39 58
56 Criminal activities (e.g., stolen cargo) 6 19 14 9 5 0 24 6 19 22
57 Major delays due to pre-shipment inspection 19 53 33 14 20 12 43 35 17 56
58
Major delays due to compulsory
warehousing 13 18 20 14 10 9 30 25 19 14
Note: For each survey question, responses have been aggregated at the individual country level. A simple average of country aggregates within the group was then calculated. The results are reported in percentages. The scale used for
this set of questions had five options ranging from “very high” to “very low.”
Table A2 Country-specific environment and institutions data averages, by income group and region (continued)
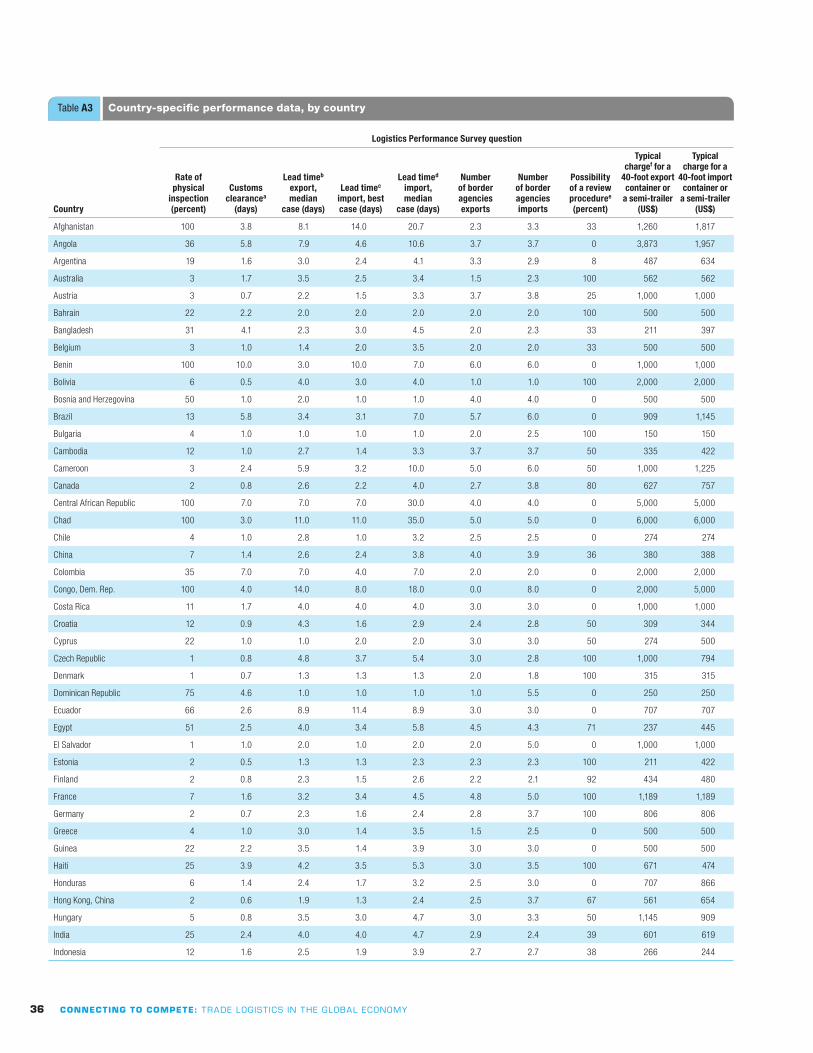
36 CONNECTING TO COMPETE: TRADE LOGIST ICS IN THE GLOBAL ECONOMY
Country
Logistics Performance Survey question
Rate of
physical
inspection
(percent)
Customs
clearancea
(days)
Lead timeb
export,
median
case (days)
Lead timec
import, best
case (days)
Lead timed
import,
median
case (days)
Number
of border
agencies
exports
Number
of border
agencies
imports
Possibility
of a review
proceduree
(percent)
Typical
chargef for a
40-foot export
container or
a semi-trailer
(US$)
Typical
charge for a
40-foot import
container or
a semi-trailer
(US$)
Afghanistan 100 3.8 8.1 14.0 20.7 2.3 3.3 33 1,260 1,817
Angola 36 5.8 7.9 4.6 10.6 3.7 3.7 0 3,873 1,957
Argentina 19 1.6 3.0 2.4 4.1 3.3 2.9 8 487 634
Australia 3 1.7 3.5 2.5 3.4 1.5 2.3 100 562 562
Austria 3 0.7 2.2 1.5 3.3 3.7 3.8 25 1,000 1,000
Bahrain 22 2.2 2.0 2.0 2.0 2.0 2.0 100 500 500
Bangladesh 31 4.1 2.3 3.0 4.5 2.0 2.3 33 211 397
Belgium 3 1.0 1.4 2.0 3.5 2.0 2.0 33 500 500
Benin 100 10.0 3.0 10.0 7.0 6.0 6.0 0 1,000 1,000
Bolivia 6 0.5 4.0 3.0 4.0 1.0 1.0 100 2,000 2,000
Bosnia and Herzegovina 50 1.0 2.0 1.0 1.0 4.0 4.0 0 500 500
Brazil 13 5.8 3.4 3.1 7.0 5.7 6.0 0 909 1,145
Bulgaria 4 1.0 1.0 1.0 1.0 2.0 2.5 100 150 150
Cambodia 12 1.0 2.7 1.4 3.3 3.7 3.7 50 335 422
Cameroon 3 2.4 5.9 3.2 10.0 5.0 6.0 50 1,000 1,225
Canada 2 0.8 2.6 2.2 4.0 2.7 3.8 80 627 757
Central African Republic 100 7.0 7.0 7.0 30.0 4.0 4.0 0 5,000 5,000
Chad 100 3.0 11.0 11.0 35.0 5.0 5.0 0 6,000 6,000
Chile 4 1.0 2.8 1.0 3.2 2.5 2.5 0 274 274
China 7 1.4 2.6 2.4 3.8 4.0 3.9 36 380 388
Colombia 35 7.0 7.0 4.0 7.0 2.0 2.0 0 2,000 2,000
Congo, Dem. Rep. 100 4.0 14.0 8.0 18.0 0.0 8.0 0 2,000 5,000
Costa Rica 11 1.7 4.0 4.0 4.0 3.0 3.0 0 1,000 1,000
Croatia 12 0.9 4.3 1.6 2.9 2.4 2.8 50 309 344
Cyprus 22 1.0 1.0 2.0 2.0 3.0 3.0 50 274 500
Czech Republic 1 0.8 4.8 3.7 5.4 3.0 2.8 100 1,000 794
Denmark 1 0.7 1.3 1.3 1.3 2.0 1.8 100 315 315
Dominican Republic 75 4.6 1.0 1.0 1.0 1.0 5.5 0 250 250
Ecuador 66 2.6 8.9 11.4 8.9 3.0 3.0 0 707 707
Egypt 51 2.5 4.0 3.4 5.8 4.5 4.3 71 237 445
El Salvador 1 1.0 2.0 1.0 2.0 2.0 5.0 0 1,000 1,000
Estonia 2 0.5 1.3 1.3 2.3 2.3 2.3 100 211 422
Finland 2 0.8 2.3 1.5 2.6 2.2 2.1 92 434 480
France 7 1.6 3.2 3.4 4.5 4.8 5.0 100 1,189 1,189
Germany 2 0.7 2.3 1.6 2.4 2.8 3.7 100 806 806
Greece 4 1.0 3.0 1.4 3.5 1.5 2.5 0 500 500
Guinea 22 2.2 3.5 1.4 3.9 3.0 3.0 0 500 500
Haiti 25 3.9 4.2 3.5 5.3 3.0 3.5 100 671 474
Honduras 6 1.4 2.4 1.7 3.2 2.5 3.0 0 707 866
Hong Kong, China 2 0.6 1.9 1.3 2.4 2.5 3.7 67 561 654
Hungary 5 0.8 3.5 3.0 4.7 3.0 3.3 50 1,145 909
India 25 2.4 4.0 4.0 4.7 2.9 2.4 39 601 619
Indonesia 12 1.6 2.5 1.9 3.9 2.7 2.7 38 266 244
Table A3 Country-specific performance data, by country
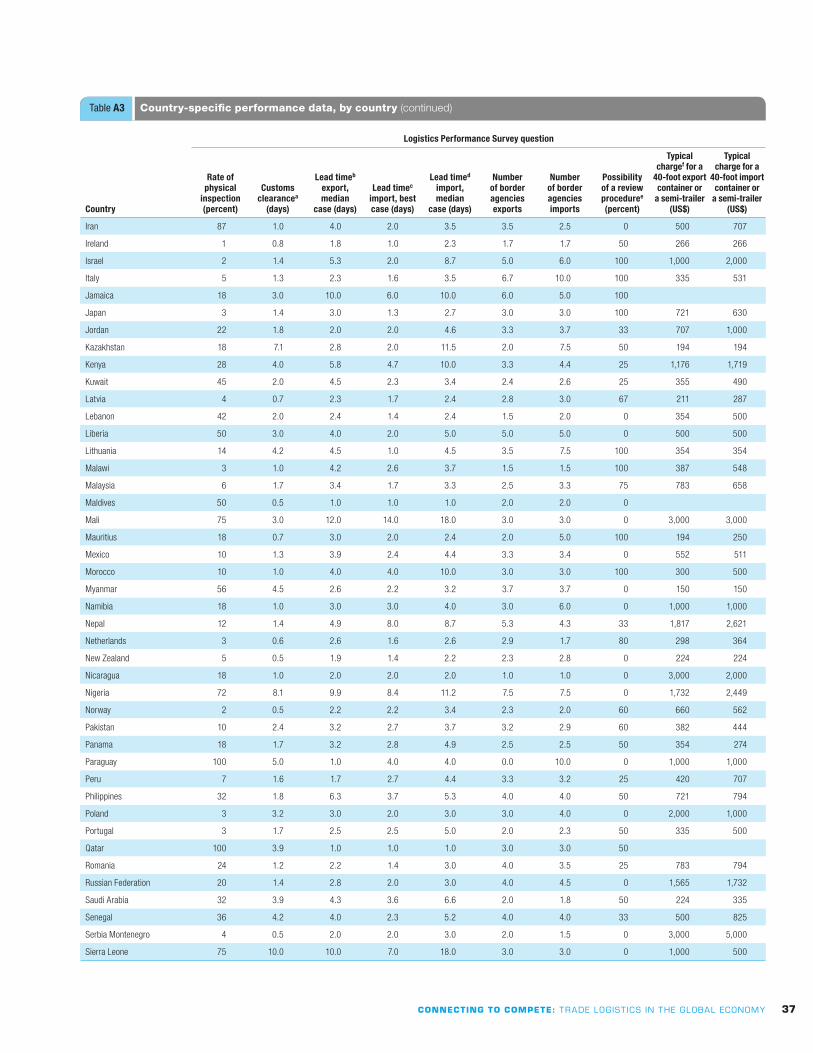
CONNECTING TO COMPETE: TRADE LOGIST ICS IN THE GLOBAL ECONOMY 37
Country
Logistics Performance Survey question
Rate of
physical
inspection
(percent)
Customs
clearancea
(days)
Lead timeb
export,
median
case (days)
Lead timec
import, best
case (days)
Lead timed
import,
median
case (days)
Number
of border
agencies
exports
Number
of border
agencies
imports
Possibility
of a review
proceduree
(percent)
Typical
chargef for a
40-foot export
container or
a semi-trailer
(US$)
Typical
charge for a
40-foot import
container or
a semi-trailer
(US$)
Iran 87 1.0 4.0 2.0 3.5 3.5 2.5 0 500 707
Ireland 1 0.8 1.8 1.0 2.3 1.7 1.7 50 266 266
Israel 2 1.4 5.3 2.0 8.7 5.0 6.0 100 1,000 2,000
Italy 5 1.3 2.3 1.6 3.5 6.7 10.0 100 335 531
Jamaica 18 3.0 10.0 6.0 10.0 6.0 5.0 100
Japan 3 1.4 3.0 1.3 2.7 3.0 3.0 100 721 630
Jordan 22 1.8 2.0 2.0 4.6 3.3 3.7 33 707 1,000
Kazakhstan 18 7.1 2.8 2.0 11.5 2.0 7.5 50 194 194
Kenya 28 4.0 5.8 4.7 10.0 3.3 4.4 25 1,176 1,719
Kuwait 45 2.0 4.5 2.3 3.4 2.4 2.6 25 355 490
Latvia 4 0.7 2.3 1.7 2.4 2.8 3.0 67 211 287
Lebanon 42 2.0 2.4 1.4 2.4 1.5 2.0 0 354 500
Liberia 50 3.0 4.0 2.0 5.0 5.0 5.0 0 500 500
Lithuania 14 4.2 4.5 1.0 4.5 3.5 7.5 100 354 354
Malawi 3 1.0 4.2 2.6 3.7 1.5 1.5 100 387 548
Malaysia 6 1.7 3.4 1.7 3.3 2.5 3.3 75 783 658
Maldives 50 0.5 1.0 1.0 1.0 2.0 2.0 0
Mali 75 3.0 12.0 14.0 18.0 3.0 3.0 0 3,000 3,000
Mauritius 18 0.7 3.0 2.0 2.4 2.0 5.0 100 194 250
Mexico 10 1.3 3.9 2.4 4.4 3.3 3.4 0 552 511
Morocco 10 1.0 4.0 4.0 10.0 3.0 3.0 100 300 500
Myanmar 56 4.5 2.6 2.2 3.2 3.7 3.7 0 150 150
Namibia 18 1.0 3.0 3.0 4.0 3.0 6.0 0 1,000 1,000
Nepal 12 1.4 4.9 8.0 8.7 5.3 4.3 33 1,817 2,621
Netherlands 3 0.6 2.6 1.6 2.6 2.9 1.7 80 298 364
New Zealand 5 0.5 1.9 1.4 2.2 2.3 2.8 0 224 224
Nicaragua 18 1.0 2.0 2.0 2.0 1.0 1.0 0 3,000 2,000
Nigeria 72 8.1 9.9 8.4 11.2 7.5 7.5 0 1,732 2,449
Norway 2 0.5 2.2 2.2 3.4 2.3 2.0 60 660 562
Pakistan 10 2.4 3.2 2.7 3.7 3.2 2.9 60 382 444
Panama 18 1.7 3.2 2.8 4.9 2.5 2.5 50 354 274
Paraguay 100 5.0 1.0 4.0 4.0 0.0 10.0 0 1,000 1,000
Peru 7 1.6 1.7 2.7 4.4 3.3 3.2 25 420 707
Philippines 32 1.8 6.3 3.7 5.3 4.0 4.0 50 721 794
Poland 3 3.2 3.0 2.0 3.0 3.0 4.0 0 2,000 1,000
Portugal 3 1.7 2.5 2.5 5.0 2.0 2.3 50 335 500
Qatar 100 3.9 1.0 1.0 1.0 3.0 3.0 50
Romania 24 1.2 2.2 1.4 3.0 4.0 3.5 25 783 794
Russian Federation 20 1.4 2.8 2.0 3.0 4.0 4.5 0 1,565 1,732
Saudi Arabia 32 3.9 4.3 3.6 6.6 2.0 1.8 50 224 335
Senegal 36 4.2 4.0 2.3 5.2 4.0 4.0 33 500 825
Serbia Montenegro 4 0.5 2.0 2.0 3.0 2.0 1.5 0 3,000 5,000
Sierra Leone 75 10.0 10.0 7.0 18.0 3.0 3.0 0 1,000 500
Table A3 Country-specific performance data, by country (continued)

38 CONNECTING TO COMPETE: TRADE LOGIST ICS IN THE GLOBAL ECONOMY
Country
Logistics Performance Survey question
Rate of
physical
inspection
(percent)
Customs
clearancea
(days)
Lead timeb
export,
median
case (days)
Lead timec
import, best
case (days)
Lead timed
import,
median
case (days)
Number
of border
agencies
exports
Number
of border
agencies
imports
Possibility
of a review
proceduree
(percent)
Typical
chargef for a
40-foot export
container or
a semi-trailer
(US$)
Typical
charge for a
40-foot import
container or
a semi-trailer
(US$)
Singapore 3 1.1 2.4 1.2 2.2 1.5 1.7 67 311 311
Slovak Republic 6 0.8 2.6 2.2 3.0 2.3 2.0 100 707 707
Slovenia 3 1.0 3.7 2.0 3.9 4.0 2.5 100 500 500
Solomon Islands 50 4.0 9.0 5.0 11.0 10.0 10.0 100
South Africa 2 1.9 2.2 1.9 4.0 4.5 3.2 60 619 515
South Korea 1 1.0 2.0 1.8 2.7 2.3 2.7 67 630 630
Spain 3 1.5 2.6 1.7 3.1 5.2 5.2 33 595 595
Sri Lanka 20 1.8 1.9 1.9 2.5 2.4 2.8 20 245 263
Sweden 1 0.7 1.9 1.7 2.6 2.6 3.4 80 758 794
Switzerland 2 0.5 1.6 2.1 3.8 3.3 4.0 33 1,225 1,225
Taiwan, China 11 1.0 2.0 1.4 3.0 3.0 6.0 50 1,000 707
Tanzania 22 7.8 11.2 11.2 21.2 2.3 3.5 0 354 612
Thailand 9 1.9 3.4 1.4 2.3 4.3 4.3 0 422 422
Tunisia 61 3.0 5.9 2.4 10.0 3.5 6.5 50 500 500
Turkey 10 1.9 2.5 1.5 2.4 5.0 4.8 40 917 1,286
Uganda 61 4.5 14.0 10.0 14.0 2.0 2.0 100 3,000 3,000
Ukraine 40 1.0 2.4 2.0 2.4 4.7 5.3 67 250 500
United Arab Emirates 3 0.9 3.5 2.2 4.1 3.6 3.6 71 291 298
United Kingdom 3 0.8 3.3 3.2 3.4 4.2 4.1 75 777 1,147
United States 3 1.1 3.6 2.5 3.9 2.9 3.2 64 861 1,008
Uruguay 11 1.7 5.0 2.2 5.0 2.5 3.5 100 671 671
Venezuela 38 4.4 4.7 4.9 6.4 2.4 3.6 0 715 490
Vietnam 14 1.4 2.8 2.6 4.0 4.5 4.0 57 194 294
Zambia 44 2.0 9.2 5.2 9.9 2.0 2.0 67 4,217 5,000
Zimbabwe 50 2.0 25.0 14.0 18.0 3.0 2.0 100 4,000 4,000
a. Time taken between the submission of an accepted customs declaration and customs clearance.
b. From shipper to port of loading, median case = 50 percent of shipments.
c. From port of discharge to consignee, best case = 10 percent of shipments.
d. From port of discharge to consignee, median case = 50 percent of shipments.
e. The percentages reported in this column represent the proportion of respondents answering that a simple and inexpensive review procedure is available.
f. Total cost to transport and port services.
Note: Country-specific data is not available for all 150 countries in the index. Blank cells indicate no data available.
Table A3 Country-specific performance data, by country (continued)


What is the Logistics Performance Index?
Based on a worldwide survey of global freight forwarders and express carriers, the
Logistics Performance Index is a benchmarking tool developed by the World Bank that
measures performance along the logistics supply chain within a country. Allowing for
comparisons across 150 countries, the index can help countries identify challenges
and opportunities and improve their logistics performance.
Technological progress and worldwide trade and investment liberalization are presenting
new opportunities for countries to harness global markets for growth and poverty
reduction. But with the advent of global supply chains, a new premium is being placed
on being able to move goods from A to B rapidly, reliably, and cheaply. Countries able to
connect to the global logistics web have access to vast new markets; but those whose
links are weak face the large and growing costs of exclusion.
Trade facilitation has been recognized as key to economic devel-opment, but research on this topic has suffered from a lack of good quantitative measures. By introducing a comprehensive new index of logistics performance, Connecting to Compete:
Trade Logistics in the Global Economy makes an important contribution to the literature and offers new insights into the factors limiting the globalization gains accruing to the poorest countries of the world.
Thomas W. HertelDistinguished Professor and Executive Director
Center for Global Trade Analysis, Purdue University
The establishment of the Logistics Performance Index under-lines the importance of logistics in a globalized world. The index delivers a comprehensive and consistent view on the dif ferent national logistics markets and supports the process of continual improvement of service levels related to logistics.
Klaus-Michael Kuehne, Executive ChairmanKuehne + Nagel International AG
For developing countries such as Pakistan, there is need of such studies that give some indication and guidance on how and what countries should improve to become competitive and reach the level of developed countries. We were glad to be able to contribute to this important initiative of the World Bank.
Muhammad Khalid Paracha, Managing DirectorMAP Enterprises, Karachi, Pakistan
Top Related