


Languages
Pages
Legal


TEKNILLINEN KORKEAKOULUTEKNISKA HÖGSKOLANHELSINKI UNIVERSITY OF TECHNOLOGYTECHNISCHE UNIVERSITÄT HELSINKIUNIVERSITE DE TECHNOLOGIE D'HELSINKI
TEKNILLINEN KORKEAKOULUTEKNISKA HÖGSKOLANHELSINKI UNIVERSITY OF TECHNOLOGYTECHNISCHE UNIVERSITÄT HELSINKIUNIVERSITE DE TECHNOLOGIE D'HELSINKI
Helsinki University of Technology
Laboratory of Forest Products Chemistry, ReportsSeries A18
Espoo 2004
CONFOCAL RAMAN MICROSCOPY IN CHEMICAL AND
PHYSICAL CHARACTERIZATION OF COATED AND PRINTED
PAPERS
Jouko Vyörykkä
Helsinki University of Technology
Laboratory of Forest Products Chemistry, Reports Series A18
Espoo 2004
CONFOCAL RAMAN MICROSCOPY IN CHEMICAL AND
PHYSICAL CHARACTERIZATION OF COATED AND PRINTED
PAPERS
Jouko Vyörykkä
Helsinki University of Technology
Department of Forest Products Technology
Laboratory of Forest Products Chemistry
Teknillinen korkeakoulu
Puunjalostustekniikan osasto
Puunjalostuksen kemian laboratorio
Dissertation for the degree of Doctor of Science in Technology to be presented with due permission of the
Department of Forest Products Technology for public examination and debate in Auditorium V1 at
Helsinki University of Technology (Espoo, Finland) on the 22nd of October 2004, at 12 noon.

Distribution:
Helsinki University of Technology
Laboratory of Forest Products Chemistry
P.O.Box 6300
FIN-02015 HUT, Finland
URL: http://www.hut.fi/Units/Forestpc/
Tel. +358 9 4511
Fax +358 9 451 4259
© 2004 Jouko Vyörykkä
ISBN 951-22-7230-X
ISBN 951-22-7231-8 (PDF)
ISSN 1457-1382
ISSN 1795-2409 (E)
URL: http://lib.hut.fi/Diss/2004/isbn9512272318/
Picaset Oy
Helsinki 2004

HELSINKI UNIVERSITY OF TECHNOLOGYP.O. BOX 1000, FIN-02015 HUThttp://www.hut.fi
ABSTRACT OF DOCTORAL DISSERTATION
Author
Name of the dissertation
Date of manuscript Date of the dissertation
Monograph Article dissertation (summary + original articles)
Department
Laboratory
Field of research
Opponent(s)
Supervisor
(Instructor)
Abstract
Keywords
UDC Number of pages
ISBN (printed) ISBN (pdf)
ISBN (others) ISSN
Publisher
Print distribution
The dissertation can be read at http://lib.hut.fi/Diss/
Jouko Vyörykkä
Confocal Raman Microscopy in Chemical and Physical Characterization of Coated and Printed Papers
28.5.2004 22.10.2004
✔
Department of Forest Products Technology
Laboratory of Forest Products Chemistry
Forest Products Chemistry
Dr. Umesh P. Agarwal
Professor Tapani Vuorinen
Professor Tapani Vuorinen
In offset printing on coated papers an uneven print, mottling, is a serious problem. Uneven styrene-butadiene (SB) latex distribution may be the reason for the mottled print. In this work, confocal Raman microscopy methods were developed for chemical and physical characterization of printed and coated papers. The main emphasis was laid on analysis of the SB-latex distribution in x-y-z direction.
A depth profiling method was developed. An immersion method was found to be essential in the depth profiling of light scattering coated papers. Model samples were employed to obtain a better understanding of the depth profiling method. The method was applied in the analysis of SB-latex migration and measurement of the thickness of paper coating layers and ink films.
Lateral mapping of paper coatings was developed for bulk and surface analysis. In mapping of coating bulk, the whole coating layer was measured and the analysis could be done through print. Lateral mapping of the bulk layer provided information on SB-latex distribution, and variations in coat weight and ink density could be mapped simultaneously. Bulk mapping was combined with light microscopy images acquired from the same area.
A higher magnification objective gave the means to measure the outermost 1-2 µm of the coating layer. Analysis of the coating surface is important because of the ink–coating interaction taking place on the coating surface. In the surface analysis, SB-latex content and its variation in different scales were of interest. The total areas analysed contained many areas of 1 mm x 1 mm.
Raman, depth profiling, immersion, mapping, coating, binder, migration
672.2:676.014:676.017:543.4 70+28
951-22-7230-X 951-22-7231-8
1457-1382
Helsinki Univeristy of Technology, Laboratory of Forest Products Chemistry
Helsinki University of Technology
✔
Preface
I first became acquainted with confocal Raman microscopy in late 1998 when I began work
on my master’s thesis at HUT. I would like to thank Professors Per Stenius and Tapani
Vuorinen for giving me the opportunity to work in their research group and continue my
studies on Raman spectroscopy after graduation. I would also like to thank Hanna Iitti for her
skilful experimental work and the good working atmosphere she created. Mari Tenhunen,
Jussi Tenhunen and Katri Vikman contributed in a major way through fruitful discussions and
co-operation. Professor Douglas Bousfield kindly gave me the opportunity to participate in
the Paper Surface Science Program at the University of Maine. My colleagues in the
Laboratory of Forest Products Chemistry at HUT made working there a great experience. I
am indebted to all of you. Finally warmest thanks to my parents and my wife Jonna for their
invaluable support and patience during the years it took to complete this work.
TEKES (National Technology Agency of Finland) and other partners (Eka Polymer Latex,
KCL, Metso automation, Metso paper, M-real, Myllykoski Paper, Raisio Chemicals,
Specialty Minerals, Specialty Minerals Nordic, Stora Enso, UPM and VTT Electronics) are
acknowledged for their contribution through TEKES projects (Profile 1998-2001, Mappi
2002 and Pinkki 2003-2004) and various contract jobs.
Jouko Vyörykkä

2
List of Publications
This dissertation is a review of the author’s work for the development of confocal Raman
microscopy methods for chemical and physical characterization of coated and printed paper
products. The work comprises this summary, with supplementary unpublished results, and the
following publications, hereafter referred to by their Roman numbers I-IV:
I
Vyörykkä, J., Halttunen, M., Iitti, H., Tenhunen, J., Vuorinen, T. and Stenius, P.,
Characteristics of immersion sampling technique in confocal Raman depth profiling, Applied
Spectroscopy, 56(6), 2002, p. 776
II
Vyörykkä, J., Paaso, J., Tenhunen, M., Tenhunen, J., Iitti, H., Vuorinen, T. and Stenius, P.,
Analysis of depth profiling data obtained by confocal Raman microspectroscopy, Applied
Spectroscopy, 57(9), 2003, p. 1123
III
Vyörykkä, J., Bousfield, D.W. and Vuorinen, T., Confocal Raman microscopy: A non
destructive method to analyze depth profiles of coated and printed papers, Nordic Pulp and
Paper Research Journal, 19(2), 2004, p. 218
IV
Vyörykkä, J., Juvonen, K., Bousfield, D.W. and Vuorinen, T., Raman microscopy in lateral
mapping of chemical and physical composition of paper coating, Tappi Journal, 3(9), 2004, p.
19

3
Author’s Contribution
The work reported in this Doctoral thesis was mainly done in the Laboratory of Forest
Products Chemistry of the Helsinki University of Technology during the period 2000-2004.
The author was one of the main inventors of the immersion technique and its application in
confocal Raman microscopy. A patent application dealing with the immersion depth profiling
method was filed by the author and co-workers in 1999 (FI 19992439, Nov. 12, 1999). The
author was responsible for experimental design, programming the instrument and
development of the data analysis. The manuscripts were mainly written by the author. He has
also presented the results at several international conferences and in conference proceedings†.
† oral presentations at international conferences, reported in conference proceedings
1. Vyörykkä, J., Halttunen, M., Tenhunen, J., Paaso, J., Kenttä, E. and Stenius P., Confocal
Raman spectroscopy in the depth profiling of paper coating colours, Paper and Coating
Chemistry Symposium, Stockholm, 2000, p. 74
2. Vyörykkä, J., Halttunen, M. Iitti, H., Vuorinen, T. and Stenius, P., Confocal Raman
analysis method to study binder depth profiles in coating layers, TAPPI Coating and
Graphic Arts Conference and Trade Fair, San Diego, USA, 2001, p. 193
3. Vyörykkä, J., Iitti, H., Vuorinen, T. and Stenius, P., Raman microspectroscopy in the
lateral mapping of paper coating composition, TAPPI Coating and Graphic Arts
Conference and Trade Fair, Orlando, USA, 2002, p. 265
4. Vyörykkä, J., Alasaarela, I., Halttunen, M., Iitti, H., Tenhunen, J., Vuorinen, T. and
Stenius, P., Benefits of immersion optics in confocal Raman microscopy, The XVIIth
Conference on Raman Spectroscopy, Budapest, Hungary, 2002, p. 239
4
Contents
1 INTRODUCTION....................................................................................................................................... 7
1.1 MOTTLING IN OFFSET PRINTING ............................................................................................................ 7
1.2 RAMAN SPECTROSCOPY ...................................................................................................................... 10
1.3 OBJECTIVE OF THE STUDY................................................................................................................... 11
2 MATERIALS AND METHODS.............................................................................................................. 12
2.1 CONFOCAL RAMAN MICROSCOPY ....................................................................................................... 12
2.2 SAMPLES............................................................................................................................................. 14
3 RESULTS AND DISCUSSION................................................................................................................ 18
3.1 QUANTIFICATION................................................................................................................................ 18
3.2 DEPTH RESOLUTION............................................................................................................................ 23
3.2.1 Effect of light refraction on depth resolution ................................................................................ 23
3.2.2 Effect of light scattering on depth resolution ................................................................................ 24
3.2.3 Determination of depth resolution ................................................................................................ 26
3.2.4 Layer thickness analysis below the nominal depth resolution ...................................................... 29
3.2.5 Depth resolution in binder migration studies ............................................................................... 31
3.3 SPATIAL RESOLUTION IN LATERAL MAPPING....................................................................................... 33
3.4 DEPTH PROFILING OF COATED AND PRINTED PAPERS........................................................................... 36
3.4.1 Analysis of binder migration......................................................................................................... 37
3.4.2 Coating thickness analysis ............................................................................................................ 38
3.4.3 Determination of ink layer thickness............................................................................................. 40
3.5 LATERAL ANALYSIS OF PAPER COATINGS............................................................................................ 44
3.5.1 Surface mapping of paper coatings............................................................................................... 44
3.5.2 Imaging of light scattering and reflection..................................................................................... 48
3.5.3 Bulk mapping of paper coatings ................................................................................................... 50
3.6 LIMITATIONS OF RAMAN MICROSCOPY IN PAPER COATING ANALYSIS ................................................. 54
4 CONCLUSIONS........................................................................................................................................ 55
5 LITERATURE........................................................................................................................................... 57
6 APPENDIX ................................................................................................................................................ 66
5
List of Abbreviations and Mathematical Symbols
Abbreviations
AFM Atomic force microscopy
ATR Attenuated total reflectance
CLC Cylindrical laboratory coater
CMC Carboxymethyl cellulose
CCD Charge coupled device
ESEM Environmental scanning electron microscopy
FWHM Full width at half maximum
GCC Ground calcium carbonate
HUT Helsinki University of Technology
IR Infrared
KCL Oy Keskuslaboratorio – Centrallaboratorium AB
LIPS Laser induced plasma spectroscopy
LWC Light weight coated paper
MSP Metered size press
NA Numerical aperture
NIR Near infrared
PCC Precipitated calcium carbonate
PET Poly(ethylene terephthalate)
PSD Particle size distribution
PSF Point-spread function
PPH Parts per hundred (of dry pigment)
SEM Scanning electron microscopy
SEM-BSE Scanning electron microscopy with backscattered electron mode
SEM-EDS Scanning electron microscopy with energy dispersive spectrometry
SB Styrene-butadiene
Tg Glass transition temperature
UV Ultraviolet
XPS X-ray photoelectron spectroscopy

6
Mathematical symbols
DS Small area variation of SB-latex content (150 µm x 150 µm)
DL Large area variation of SB-latex content (1 mm x 1 mm)
Dx Lateral resolution
Dz Depth resolution
e Neper’s number
W Solid angle
h Planck’s constant
I Intensity of measured light
I0 Intensity of incoming light
l Laser wavelength
n0 Frequency of incident light
nv Frequency of vibrational state
N Number of scattering molecules per unit area
n Refractive index
NA Numerical aperture
s Raman scattering cross-section
s Focusing depth
s´ Depth of measurement
Stdev Standard deviation
xn SB-latex:CaCO3 band height ratios in an area of 1 mm x 1 mm

7
1 Introduction
Pigmented paper coatings mainly consist of calcium carbonate or kaolin pigments and latex or
starch binders. Thickeners and other additives are applied in smaller amounts (Lehtinen
2000). Air might also be considered an important component of porous paper coatings, since
it makes a contribution to the optical, mechanical and fluid absorption properties (Lepoutre
1989). Coated paper grades are of particular importance for multicolour printed magazines
and brochures. Offset printing is the most common printing method in the printing industry
and the method used for the printing of large numbers of copies of magazines, brochures,
posters, catalogues, etc. Uneven print quality, mottling, is considered as a serious problem in
offset printing on coated paper grades.
1.1 Mottling in offset printing
In offset printing, changes are made to the surface chemistry of lithographic printing plates;
image areas are made hydrophobic and non-image areas hydrophilic (Oittinen and Saarelma
1998). Fountain water, which adheres to hydrophilic areas, is applied first (Hird 1995). Ink
then covers the hydrophobic areas, which were not covered by the fountain water. The
adhesion of ink in the non-image area should be lower than the ink cohesion. The presence of
fountain water in the non-printing areas weakens the ink adhesion, and the force needed to
remove the ink from the non-printing areas is much lower than the force needed to remove it
from the printing areas (Oittinen and Saarelma 1998). Hence non-printing areas remain ink-
free. From the printing plate the image is transferred to a rubber blanket and from the blanket
to paper.
In multicolour offset printing, wet on wet printing, several colours are printed successively
and there may not be enough time for the ink to dry completely between the printing units. A
part of the ink layer is thus split and backtrapped in the blanket of the next unit (Engström
1994). If the ink sets unevenly, the backtrap will be uneven, as will the final print. The result
is called backtrap mottle. Backtrap is stronger in the first down colours as these will pass
through the following printing units (Engström 1994).
Another type of mottle, fountain water mottle, appears if the paper does not have enough time
to absorb the fountain water applied to the non-printed area before entering the next unit
8
(Engström and Rigdahl 1993). The adsorption of fountain water on the paper may be uneven.
The unabsorbed water prevents proper and even ink transfer in the second or later units,
leading to a mottled print unit (Engström and Rigdahl 1993). Fountain water mottle is the
most common type of mottle in offset printing (Engström and Rigdahl 1993).
The underlying cause of print mottle is believed to be uneven latex and pigment distribution
(Lee and Whalen-Shaw 1993, Zang and Aspler 1998). These uneven distributions emerge
before coating consolidation due to high absorbance of base stock or unfavourable drying
conditions (Lepoutre 1989, Yamazaki et al. 1993, Engström 1994). Kim et al. (1998) studied
the drying of coated paper and found, by using scanning electron microscopy (SEM), X-ray
photoelectron spectroscopy (XPS) and cryo-SEM, that print mottle could be reduced by a
more uniform distribution of coating chemicals and a more even microstructure on the coating
surface. Coating colour dispersions having clustered latex particles have been reported to lead
to a non-uniform structure of the dry coating (Van Gilder 2004). Arai et al. (1988) applied
XPS in surface and depth directional investigations of pigment and binder distribution and
found a correlation between fountain water mottle and non-uniform surface distribution of
pigments and binders. No correlation was found with depth directional distributions. Contrary
to this, computer simulations suggest that smaller latex particles enrich at the surface during
coating application (Ragner 1999, Gagnon et al. 2001).
Coating thickness distribution has a major influence on the paper quality. It affects opacity,
brightness, print mottle, blistering and print gloss, making coating structure analysis of great
importance (Kent et al. 1986). The non-uniformity of the base paper causes variations in coat
weight and creates the conditions for non-uniform binder distribution (Lee and Whalen-Shaw
1993). Using UV absorption spectroscopy for binder analysis, Engström and Lafaye (1992)
concluded that uneven coat weight is associated with uneven binder distribution at the coating
surface. Allem (1998) found by SEM method a direct correlation between print quality and
coating thickness uniformity of light weight coated papers. Gane (1989) reported that only
gross variations in base sheet absorbency cause binder migration that independently leads to
print mottle, while heterogeneity in the coating structure and drying are the more likely
causes of macroscopic print mottle.

9
Recent publications suggest that print mottle may be related more to the structural properties
of the paper coating than to latex migration. Xiang and Bousfield (2001) found ink setting
rates to decrease with increasing coat weight. Groves et al. (2001) found water soluble
components of coating colours to enrich in the top layer of the paper coating and suggested
that several earlier studies may have mistakenly measured water soluble surfactants rather
than latex content. Xiang et al. (2000) showed that mottle appeared in papers with “closed”
regions on the surface while the latex distribution was uniform.
Several methods have been applied in styrene-butadiene (SB) latex analysis. UV absorption
spectroscopy has been applied in the determination of content, but the depth sampled and the
structural properties of the sample have an effect on the results (Fujiwara and Kline 1987).
Many of the experimental methods applied to determine SB-latex content in depth direction
require grinding or physical sectioning of the sample, and in several cases binder labelling is
needed (Zimmermann et al 1995, Guyot et al 1995, Häkkänen 1998, Kenttä et al. 2000, He et
al. 2002). Surface analysis of coated papers by XPS gives a sampling depth (5-10 nm) that in
SB-latex measurement could be sensitive to the migration of water-soluble surfactants and
dispersants (Groves et al. 2001). Kugge (2003) employed a combination of atomic force
microscopy (AFM) and environmental secondary electron microscopy (ESEM) to measure
SB-latex film formation and migration. The analysis area of AFM is limited, however, and
there are limitations in quantification. Attenuated total reflectance infrared spectroscopy
(IR/ATR) has a sampling depth of approximately 2 µm and it has been applied in SB-latex
analysis (Halttunen et al. 2001). The method requires a multivariate calibration, however, and
the SB-latex signal is relatively weak. In sum, all of the earlier methods employed in SB-latex
analysis have limitations in giving quantitative information from heterogeneous paper
coatings. Although many studies have been done on print mottle, a lot of questions are
unanswered and the need for better method remains.
The burnout method is frequently applied in the analysis of coat weight distribution. In a
recent investigation SEM employed in backscattered electron mode (SEM-BSE) was
preferred to burnout because the base paper contributes to the burnout results (Forsström
2003). Laser induced plasma spectroscopy (LIPS) reveals coat weight distribution without the
need for physically sectioning of the sample before the measurement (Häkkänen 1999).
10
Vibrational states
hn0
hn0
Rayleigh
Virtual states
Stokes anti-Stokes
hn0 hn0
h(n0 -nv) hn0 h(n0 +nv)
IR0
1
1.2 Raman spectroscopy
The Raman effect was discovered in 1928 and the first Raman microscopes were described in
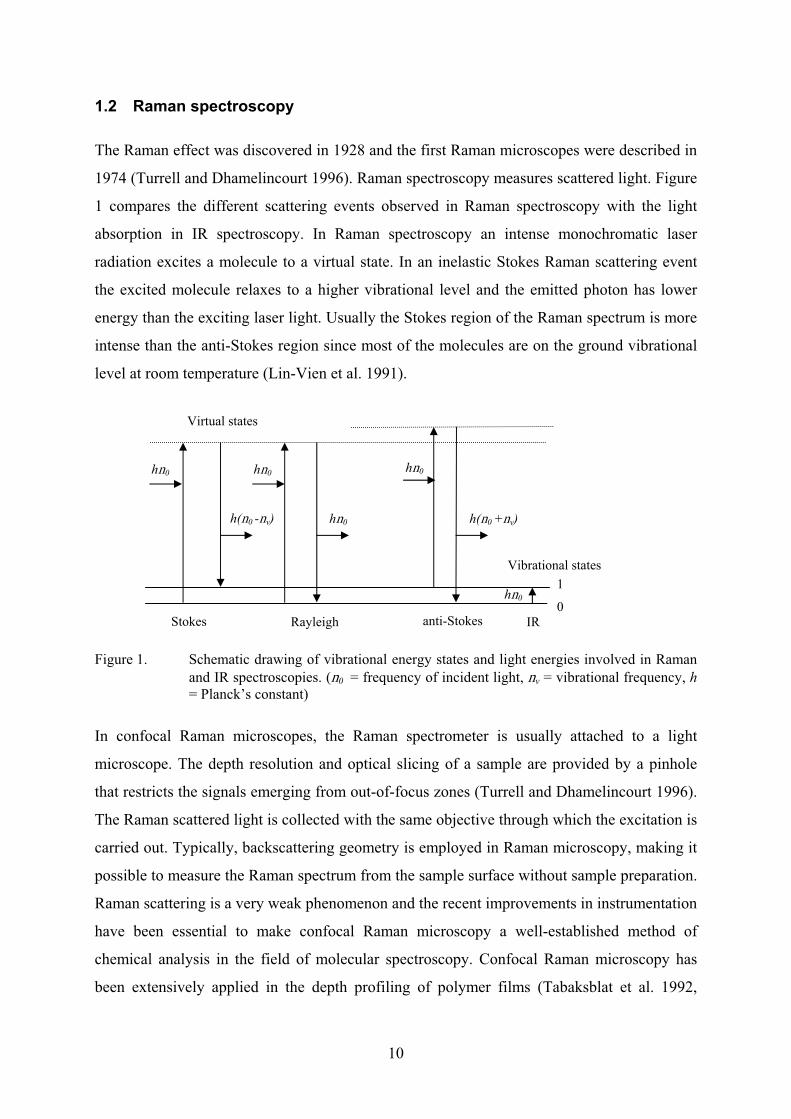
1974 (Turrell and Dhamelincourt 1996). Raman spectroscopy measures scattered light. Figure
1 compares the different scattering events observed in Raman spectroscopy with the light
absorption in IR spectroscopy. In Raman spectroscopy an intense monochromatic laser
radiation excites a molecule to a virtual state. In an inelastic Stokes Raman scattering event
the excited molecule relaxes to a higher vibrational level and the emitted photon has lower
energy than the exciting laser light. Usually the Stokes region of the Raman spectrum is more
intense than the anti-Stokes region since most of the molecules are on the ground vibrational
level at room temperature (Lin-Vien et al. 1991).
Figure 1. Schematic drawing of vibrational energy states and light energies involved in Raman and IR spectroscopies. (n0 = frequency of incident light, nv = vibrational frequency, h= Planck’s constant)
In confocal Raman microscopes, the Raman spectrometer is usually attached to a light
microscope. The depth resolution and optical slicing of a sample are provided by a pinhole
that restricts the signals emerging from out-of-focus zones (Turrell and Dhamelincourt 1996).
The Raman scattered light is collected with the same objective through which the excitation is
carried out. Typically, backscattering geometry is employed in Raman microscopy, making it
possible to measure the Raman spectrum from the sample surface without sample preparation.
Raman scattering is a very weak phenomenon and the recent improvements in instrumentation
have been essential to make confocal Raman microscopy a well-established method of
chemical analysis in the field of molecular spectroscopy. Confocal Raman microscopy has
been extensively applied in the depth profiling of polymer films (Tabaksblat et al. 1992,

11
Hajadoost and Yarwood 1996, Hajadoost et al. 1997, Schrof and Häußling 1997, Sacristán et
al. 2000, Belaroui et al. 2000).
The number of investigations where Raman spectroscopy is applied to the analysis of paper
products is increasing. Older Raman studies focused on the identification of constituents of
old paintings, manuscripts and artwork (Turrell and Dhamelincourt 1996). More recently
Raman spectroscopy has been used to identify pigments such as calcium carbonate, talc,
gypsum, titanium dioxide and kaolin in recycled paper pulp (Niemelä et al. 1999). It has also
been extensively applied in pulp and bleaching investigations (Agarwal and Atalla 1995,
Halttunen et al. 2001). A Raman microscope was employed in the analysis of the spatial
distribution of SB-latex at the surface of a paper coating layer (Guyot et al. 1995), and
confocal Raman microscopy has several times been utilized in SB-latex distribution analysis
in x-y-z direction (Vyörykkä 1999, He et al. 2002, Sundqvist 2003, Bitla et al. 2003, Paper
III, Paper IV). Very recent confocal Raman microscopic depth profiling work has focused on
ink jet and electrophotographic printed paper products (Vikman and Sipi 2003).
1.3 Objective of the study
The objective of the present work was to develop Raman microscopy for chemical and
structural analysis of paper coatings in x-y-z direction. The main focus was quantitative
analysis of the distribution of SB-latex. The work falls roughly into two parts: development of
depth profiling and development of lateral mapping methods. The lateral mapping can further
be divided into surface mapping and bulk mapping of paper coatings.

12
2 Materials and Methods
2.1 Confocal Raman microscopy
The majority of the Raman spectra were collected with a dispersive Kaiser Optical Systems
HoloLab Raman microscope (Figure 2). The exciting light from a 785 nm GaAlAs diode laser
was coupled to an Olympus BX 60 microscope with an optical fibre. This set-up gave a
random laser light polarization at the sample. The laser power at the sample stage was 35
mW. The pinhole size was determined by the core diameter of the collection fibre (15 µm). In
the HoloLab Raman microscope, the combination of a multiplexed transmission grating and a
multichannel CCD array detector allows simultaneous collection of the spectral range 100-
3500 cm-1 at 4 cm-1 spectral resolution. A typical collection time for a Raman spectrum of a
paper coating with cosmic ray removal was 20 seconds.
Figure 2. HoloLab Raman microscope.
Another confocal Raman microscope employed in this work was a Renishaw RM 1000. The
excitation source was a diode laser operating at wavelength of 785 nm. The measured laser
power at the sample stage was 16 mW. The confocal pinhole was replaced by a combination
of a slit and CCD area (Williams et al. 1994). In the RM 1000 instrument the spectral range of
a static scan measurement is limited to approximately 560 wavenumbers. Extended scan
mode would have given the whole wavenumber range, but the measurement would have been
relatively time consuming. A typical collection time for a static scan Raman spectrum of a
paper coating was 60-90 seconds.
13
Depth profiling measurements were carried out by stepwise (1 µm) focusing of the exciting
laser inside the sample and the collection of a separate Raman spectra at each z-slice. The
depth axis zero point was the starting point of the depth profiling and the distance between the
starting point and the actual surface varied in the measurements.
Immersion depth profiling measurements were carried out with a 100X (NA 1.30) oil-
immersion objective (Olympus, universal plan fluorite) having 100 µm working distance. In
the HoloLab Raman instrument the movement of the focal point in the z-direction was
accomplished with a Physik Instrumente PIFOC piezo objective scanner (P-721.10) having
100 µm scanning range and a full range repeatability of °20 nm. The RM 1000 Raman
instrument was supplied with an encoded motorized x-y-z stage with 0.1 µm repeatability.
In studies in the lateral direction, the sample stage of the HoloLab Raman instrument was
controlled with a Coherent EncoderDriver actuator system (37-0486). The unidirectional
repeatability of this system was 0.1 mm and the stroke length of the x-y stage was 9 mm. In
lateral mapping of the paper coating surface with the HoloLab instrument, a second motorized
x-y stage (Physik Instrumente, M.410GC & M.415GC) having 100 mm x 150 mm stroke
length was used. In surface mapping, automatic focusing was accomplished with the piezo
objective scanner that was also used in the depth profiling.
Light scattering and reflection images were acquired with the light microscope attached to the
HoloLab Raman instrument. A standard polarizer and an analyser were obtained from
Olympus. The polarization plane of the analyser could be rotated. A digital camera (Olympus,
DP12) was installed to the microscope for imaging. A low magnification objective (Olympus,
5X) was applied to cover larger areas in a single measurement.

14
2.2 Samples
Below is the list of samples that were used for calibration purposes and spatial resolution
measurements and the samples that were obtained from industry to demonstrate the new
Raman depth profiling and mapping methods.
Sample set 1. Coatings containing SB-latex, needed to calibrate the HoloLab instrument, were
prepared from two pigment mixtures. The applied SB-latex (Dow, DLL 966) contents were 3,
6, 9, 12, 15 and 18 parts per hundred (pph) of dry pigment. In one series, the pigment was 100
pph of CaCO3 (Omya, Hydrocarb 90) and in the other the pigment mixture was 50 pph of
CaCO3 and 50 pph of kaolin (Huber, Hydragloss 92). All the coatings contained 1 pph of
carboxymethyl cellulose (CMC) (Noviant, Finnfix 10). The coating colours were applied on a
glossy PET (polyethylene terephthalate) film with a laboratory coater using a 60 µm slit rod.
The samples were dried at room temperature.
Sample set 2. Coatings containing CaCO3 pigments (Omya: Hydrocarb 60, Hydrocarb 90 and
Setacarb 97% < 2 µm) and 12 pph of SB-latex (Dow, DLL 966) were prepared for Raman
intensity study on different pigment sizes. These samples were spread on a glossy PET with a
laboratory slit rod coater using a 60 µm rod. The samples were dried at room temperature.
Sample set 3. SB-latex (Dow) samples with different Tg values and gel contents were dried
and measured with the HoloLab Raman microscope to determine the effect of type of SB-
latex. The Tg values were 4 ºC, 20 ºC and 24 ºC. The gel content was high for the samples
having Tg 5 ºC and 24 ºC and medium for the sample with Tg 20 ºC.
Sample 4. A model coating contained 100 pph of CaCO3 (Omya, Hydrocarb 90), 12 pph of
SB-latex (Dow, DLL 966) and 1 pph of CMC (Noviant, Finnfix 10) was used to demonstrate
the difference between traditional and immersion depth profiling of a paper coating. The
coating was spread on a 10 µm PET film with a laboratory slit rod coater. The coating
thickness was approximately 5 µm.
Sample 5. A 12 µm PET film (Wihuri Wipak) was used for determination of the point-spread
function (PSF).
15
Sample 6. A double coated paper with the target coat weight of 2x9 g/m2 per side was
prepared for cross-section analysis. The coating contained 100 pph of CaCO3 (Omya,
Hydrocarb 90), 12 pph of SB-latex (Dow, DLL 966) and 1 pph of CMC (Noviant, Finnfix
10). Coatings were produced with a cylindrical laboratory coater (CLC) at a rate of 600
m/min using constant IR drying conditions.
Sample set 7. Two double coated samples A and B obtained from Specialty Minerals Nordic
Oy AB were used for depth profiling through print. The coating formulation and base papers
were the same, but different drying conditions were applied. The precoating contained ground
calcium carbonate (GCC) with a steep particle size distribution as a pigment and SB-latex as
a binder. In the top coating the pigment was precipitated calcium carbonate (PCC) and the
binder was SB-latex. These samples were printed in a five-colour sheet-fed offset press and
depth profiled through the magenta ink test area (100% coverage). Twenty depth profiles
were measured from each sample.
Sample set 8. Two double coated samples provided by Specialty Minerals Inc were used for
measurement of thickness profiles. One sample was precoated with a metered size press
(MSP, 900 m/min) and the other with a jet applicator followed by metering with a blade
(1000 m/min). The precoating applied with MSP consisted of 100 pph of calcite PCC, 8 pph
of SB-latex (Dow, CP 620NA) and 8 pph of starch (Penford, 280). The particle size
distribution (PSD) of the calcite PCC was such that 90% of the particles by weight were
smaller than 1.10 µm (i.e. PSD90 = 1.10 µm) and PSD20 was 0.35 µm. The precoating
applied with blade coater was similar. The coat weights of both precoatings were 6.5 g/m2.
The top coating of both samples was applied with a blade coater (1000 m/min) and the coat
weight was again 6.5 g/m2. The top coating recipes were the same, 100 pph of aragonite PCC
(PSD90 = 0.86 µm, PSD20 = 0.18 µm), 9 pph of SB-latex (Dow, CP 620NA) and 7 pph of
starch (Penford, 280). The top coat calendering (1000 m/min) was performed by a gentle on-
line soft nip calender at 250 ºC (Nip 1: 110 kN/m, Nip 2: 40kN/m). According to the
manufacturer, typical mean pore size for the calcite PCC is 0.110 µm and for the aragonite
PCC 0.095 µm. In another set of similar samples, also provided by Specialty Minerals Inc, 10
pph of rutile TiO2 was present in the precoating, which was an additional marker to
differentiate between the top coating and precoating.

16
Sample set 9. The relationship between coating thickness and Raman intensity was explored
with coatings spread with a laboratory slit rod coater on a glossy PET substrate. Average
thicknesses were 1.5 µm, 2.5 µm, 7.5 µm, 11.5 µm and 19 µm. These coatings contained 100
pph of CaCO3 (Omya, Hydrocarb 90) and 12 pph of SB-latex (Dow, DLL 966).
Sample 10. A lateral map was measured from a printed paper sample. A fine paper containing
calcium carbonate was coated on a pilot coater at 800 m/min at KCL, Espoo, Finland. The
coating colour contained 50 parts pph of calcium carbonate (Omya, Hydrocarb 90), 50 pph of
kaolin (Huber, Hydragloss 90), 15 pph of SB-latex (Dow, DLL 966), and 0.7 pph of CMC
(Noviant, Finnfix 10). The solids content of the coating colour was 65% and the target coat
weight was 12 g/m2. The coated paper was calendered and printed in a four-colour sheet-fed
offset press at KCL. Lateral mapping was performed from an area having 40% coverage of
magenta ink.
Sample 11. A coated paper sample obtained from industry was used for measurement of a
map from an area of coating bulk 1.75 mm x 2.25 mm. The coating contained CaCO3 and SB-
latex. Raman mapping was done from a printed area having 100% coverage of magenta.
Sample 12. An unprinted sample obtained from Specialty Minerals Nordic Oy AB was used
for large area mapping of coating bulk and light scattering measurements. The sample
composition was otherwise the same as given in the description of sample set 7.
Sample 13. A pilot coated paper sample with strong mottle (expert ranking: 5, scale 1-5) was
measured in high and low print density areas. The paper was coated at 22 g/m2 per side with
50 pph of high brightness clay, 10 pph of calcined clay, 40 pph of GCC, 14 pph of SB-latex, 2
pph of starch and smaller amounts of other typical additives. The drying consisted of gentle
IR drying immediately after the coating and subsequent hard air drying. The sample was the
same as employed in earlier studies by Xiang et al. (1999) and Xiang et al. (2000) (their
sample G).
Sample 14. A sample coated with a pilot coater equipped with a jet applicator at KCL, at a
coater speed of 1500 m/min, was used to demonstrate the surface analysis. Pilot coated paper
was supercalandered using constant speed (850 m/min) and nip load (200 kN/m). The base
17
paper was 41 g/m2 mechanical LWC-base paper from a Finnish paper mill. The coating
consisted of 100 pph of CaCO3 (Omya, Hydrocarb 60), 11 pph of SB-latex (Dow, DL 940)
and 1.5 pph of starch (Raisio Chemicals, Raisamyl 150 E), 0.4 pph of CMC (Noviant,
Finnfix 10) and 0.3 pph of optical brightener (Bayer, Blankophor P). The target solids content
of coating colour was 64% and the target pH was 8. The analysed coat weight was 12.9 g/m2
and the mean pore diameter of the coating layer was 0.149 µm.
Sample 15. This sample was produced in similar conditions to sample 14, but it had finer
CaCO3 pigment (Omya, Setacarb). The sample was employed in surface analysis. The
analysed coat weight was 12.7 g/m2 and the mean pore diameter of the coating layer was
0.070 µm.
18
3 Results and Discussion
3.1 Quantification
The intensity of Raman scattering is described by the equation
ö÷õ
æçåW
ÖÖºd
dINI
s0 , (1)
where N is the number of scattering molecules per unit volume, I0 is the intensity of the
incident laser beam and Wd
ds is the differential scattering cross-section (Spiekermann 1995).
If the intensity of the laser beam is constant the intensity of the scattering is directly
proportional to the number of scattering molecules. Quantitative work with Raman
spectroscopy relies on linear superposition where single component Raman spectra make up
the Raman spectrum of the mixture. Chemical interactions may change the molecular
specimen, and in such cases linear superposition will not work (Pelletier 2003). Usually the
intensities of the bands are proportional to molecular concentrations (Schrader 1995).
Raman intensities are affected by many experimental factors and thus internal standards are
usually required in quantitative work (Hendra 1996). Often a compound already present in the
sample can be employed as the internal standard. Sometimes an internal standard can be
added. Quantification based on the use of an external standard employs unnormalised Raman
spectra and controlled measurement conditions are required. While controlled conditions can
be achieved in a single measurement, they are more difficult to achieve in automatic mapping.
In principle, the use of external standards easily becomes impossible if the external standard
and the sample do not fill the measurement volume. The measurement volume is readily
changed by light scattering, and this is the case in SB-latex analysis. In the present work
analysis was made of the SB-latex band at 998 cm-1 originating from the ring breathing of the
styrene unit (Lin-Vien et al. 1991) and the CaCO3 band at 1084 cm-1 originating from C=O in
phase stretching (Bougeard 1995). The latter can be used as an internal standard in the
quantitative analysis as, generally, the coating recipe is given as the dry amount of various
components relative to the dry amount of pigment (Lehtinen 2000).
19
1084
1028
998.2 709.8
619
279
0
500
1000
1500
2000
3000 2500 2000 1500 1000 500 0 Arbitrary / Raman Shift (cm-1)
Raman shift (cm-1)
1084
1028
998.2 709.8
619
279
0
500
1000
1500
2000
3000 2500 2000 1500 1000 500 0 Arbitrary / Raman Shift (cm-1)
Raman shift (cm-1)
Usually band areas are preferred over band heights in quantitative analysis (Spiekermann
1995). However, the signal to noise ratio may be lower for band areas than band heights if the
dominating noise is random variation in the baseline (Pelletier 2003). Band height analysis
gives more reliable results when partial overlapping of two Raman bands occurs (Pelletier
2003). Partial overlapping of bands of cellulose (1094 cm-1) and CaCO3 (1084 cm-1) occurs
frequently due to the vicinity of the fibres in the base paper and the coating. In our case, better
repeatability was obtained for coated paper samples by using band heights. Moreover,
heterogeneous paper coating samples tend to have variable baselines from point to point,
which means that finding general fitting parameters for band area calculations would be
complicated. For small numbers of Raman spectra, individual fitting would overcome these
problems, but for Raman maps containing hundreds or even thousands of Raman spectra the
work would be time consuming. Moreover, slightly different parameters for curve fitting
would lead to different results each time.
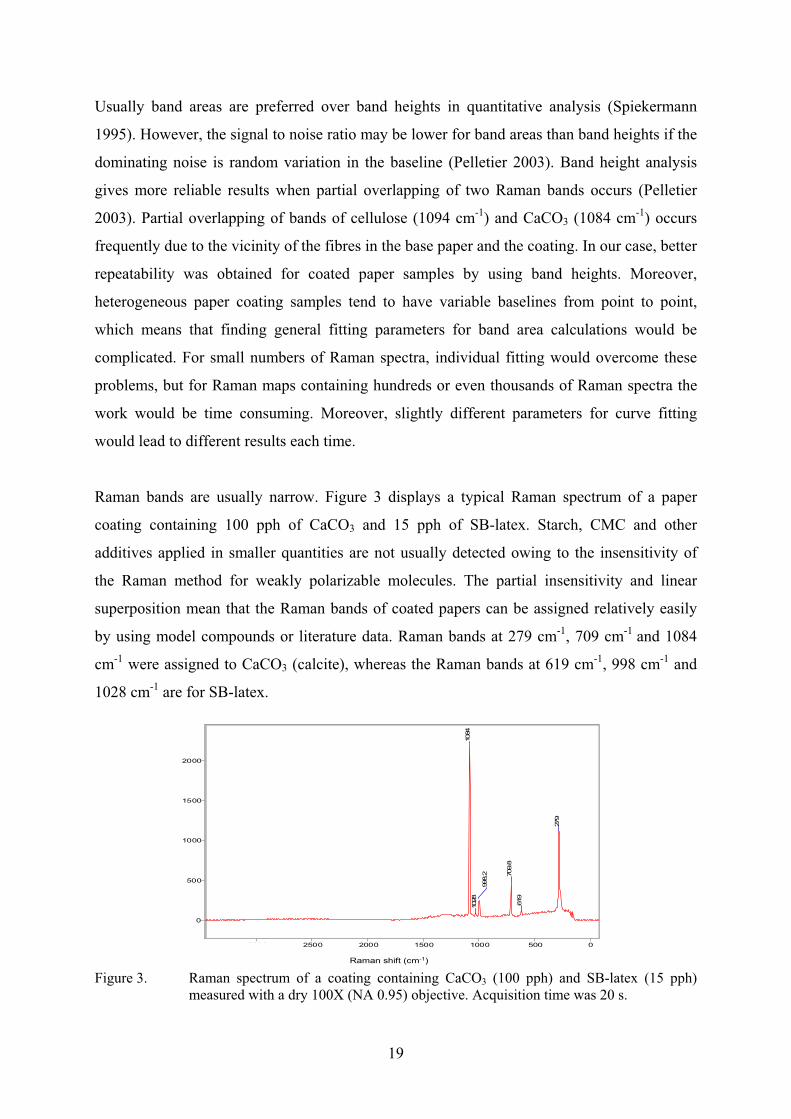
Raman bands are usually narrow. Figure 3 displays a typical Raman spectrum of a paper
coating containing 100 pph of CaCO3 and 15 pph of SB-latex. Starch, CMC and other
additives applied in smaller quantities are not usually detected owing to the insensitivity of
the Raman method for weakly polarizable molecules. The partial insensitivity and linear
superposition mean that the Raman bands of coated papers can be assigned relatively easily
by using model compounds or literature data. Raman bands at 279 cm-1, 709 cm-1 and 1084
cm-1 were assigned to CaCO3 (calcite), whereas the Raman bands at 619 cm-1, 998 cm-1 and
1028 cm-1 are for SB-latex.
Figure 3. Raman spectrum of a coating containing CaCO3 (100 pph) and SB-latex (15 pph) measured with a dry 100X (NA 0.95) objective. Acquisition time was 20 s.
20
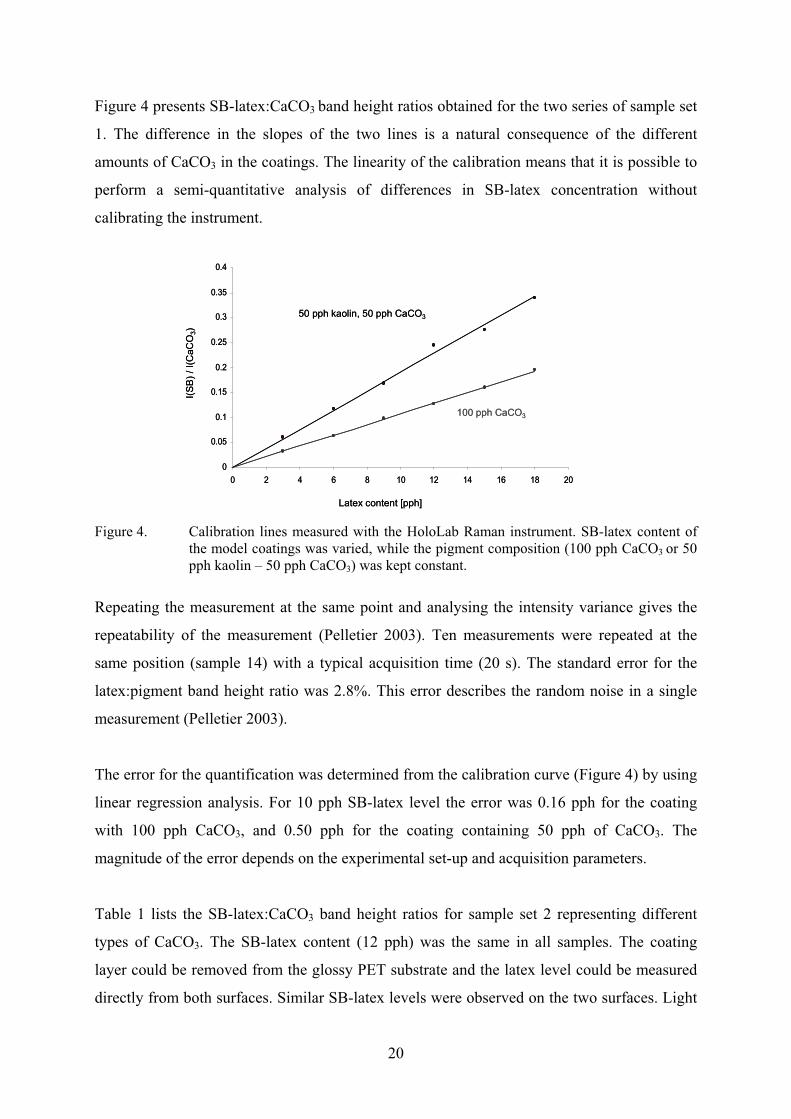
Figure 4 presents SB-latex:CaCO3 band height ratios obtained for the two series of sample set
1. The difference in the slopes of the two lines is a natural consequence of the different
amounts of CaCO3 in the coatings. The linearity of the calibration means that it is possible to
perform a semi-quantitative analysis of differences in SB-latex concentration without
calibrating the instrument.
Figure 4. Calibration lines measured with the HoloLab Raman instrument. SB-latex content of the model coatings was varied, while the pigment composition (100 pph CaCO3 or 50 pph kaolin – 50 pph CaCO3) was kept constant.
Repeating the measurement at the same point and analysing the intensity variance gives the
repeatability of the measurement (Pelletier 2003). Ten measurements were repeated at the
same position (sample 14) with a typical acquisition time (20 s). The standard error for the
latex:pigment band height ratio was 2.8%. This error describes the random noise in a single
measurement (Pelletier 2003).
The error for the quantification was determined from the calibration curve (Figure 4) by using
linear regression analysis. For 10 pph SB-latex level the error was 0.16 pph for the coating
with 100 pph CaCO3, and 0.50 pph for the coating containing 50 pph of CaCO3. The
magnitude of the error depends on the experimental set-up and acquisition parameters.
Table 1 lists the SB-latex:CaCO3 band height ratios for sample set 2 representing different
types of CaCO3. The SB-latex content (12 pph) was the same in all samples. The coating
layer could be removed from the glossy PET substrate and the latex level could be measured
directly from both surfaces. Similar SB-latex levels were observed on the two surfaces. Light
0
0.05
0.1
0.15
0.2
0.25
0.3
0.35
0.4
0 2 4 6 8 10 12 14 16 18 20
100 pph CaCO3
50 pph kaolin, 50 pph CaCO3
Latex content [pph]
I(S
B)
/ I(
CaC
O3)
0
0.05
0.1
0.15
0.2
0.25
0.3
0.35
0.4
0 2 4 6 8 10 12 14 16 18 20
100 pph CaCO3
50 pph kaolin, 50 pph CaCO3
Latex content [pph]
I(S
B)
/ I(
CaC
O3)
21
scattering was not expected to have an effect on the intensity ratios because the probability of
scattered light producing Raman scattered photons depends on the mass ratios of the
substances as in non-scattering case. This was observed experimentally in a comparison of
ratio values measured by immersion and traditional techniques. Any difference in the
calculated band height ratio should be then due to the CaCO3. A change in the crystalline
environment may give rise to a different response in Raman technique.
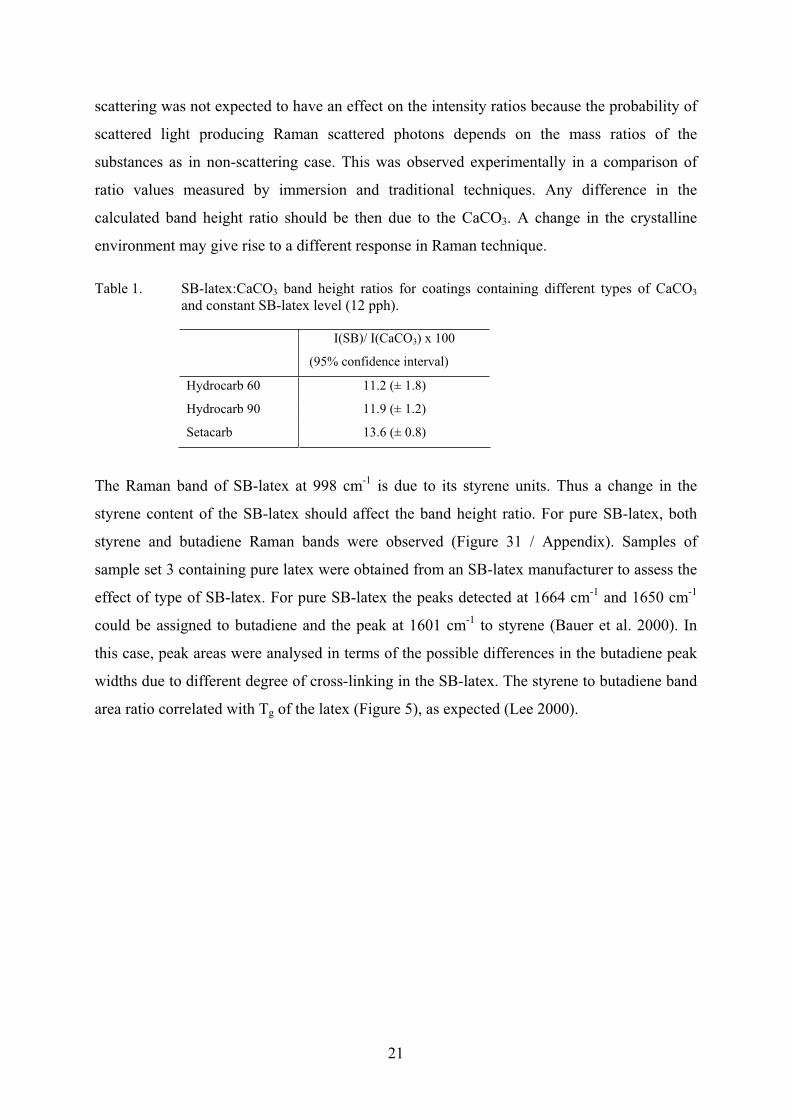
Table 1. SB-latex:CaCO3 band height ratios for coatings containing different types of CaCO3
and constant SB-latex level (12 pph).
I(SB)/ I(CaCO3) x 100
(95% confidence interval)
Hydrocarb 60 11.2 (± 1.8)
Hydrocarb 90 11.9 (± 1.2)
Setacarb 13.6 (± 0.8)
The Raman band of SB-latex at 998 cm-1 is due to its styrene units. Thus a change in the
styrene content of the SB-latex should affect the band height ratio. For pure SB-latex, both
styrene and butadiene Raman bands were observed (Figure 31 / Appendix). Samples of
sample set 3 containing pure latex were obtained from an SB-latex manufacturer to assess the
effect of type of SB-latex. For pure SB-latex the peaks detected at 1664 cm-1 and 1650 cm-1
could be assigned to butadiene and the peak at 1601 cm-1 to styrene (Bauer et al. 2000). In
this case, peak areas were analysed in terms of the possible differences in the butadiene peak
widths due to different degree of cross-linking in the SB-latex. The styrene to butadiene band
area ratio correlated with Tg of the latex (Figure 5), as expected (Lee 2000).

22
0.00
0.20
0.40
0.60
0.80
1.00
1.20
1.40
1.60
0.00 4.00 8.00 12.00 16.00 20.00 24.00 28.00
Tg [ºC]
Peak a
rea r
atio
[a.u
.]
I(1601) / I(1664+1650)
Linear (I(1601) / I(1664+1650))
I(1
601)
/ I(
16
64
+1
65
0)
Tg [ºC]
0.00
0.20
0.40
0.60
0.80
1.00
1.20
1.40
1.60
0.00 4.00 8.00 12.00 16.00 20.00 24.00 28.00
Tg [ºC]
Peak a
rea r
atio
[a.u
.]
I(1601) / I(1664+1650)
Linear (I(1601) / I(1664+1650))
I(1
601)
/ I(
16
64
+1
65
0)
Tg [ºC]
Figure 5. Styrene to butadiene peak area ratios of pure SB-latex samples measured with the HoloLab Raman instrument. The area of the 1601 cm-1 band for styrene and the sum of the areas of two bands (1664 cm-1, 1650 cm-1) for butadiene were employed. The gel content was high for Tg 5 ºC and 24 ºC, but for Tg 20 ºC it was medium.
In conclusion, differences in the type and composition of the pigment and Tg of the latex
cause differences in the SB-latex:CaCO3 band intensity ratio and have an effect on the
calibration. If the coating recipes are similar, however, semi-quantitative comparison of the
SB-latex content is possible because the calibration line is linear. If the recipes are different, a
set of calibration samples needs to be prepared and measured to obtain valid calibration
coefficients.

23
3.2 Depth resolution
In confocal Raman microscopy the depth resolution is, in principle, determined mainly by the
laser wavelength, the objective and the pinhole size that restricts the Raman scattering from
out-of-focus zones (Tabaksblat et al. 1992). The theory of depth resolution in confocal Raman
microscopy is essentially similar to the theory of confocal microscopy described by Wilson
(1990). For the depth resolution the physical limit can be estimated by
2)NA(2
4.4
pln
z ²D , (2)
where n is the refractive index of the sample, l is the laser wavelength and NA is the
numerical aperture of the objective (Turrell and Dhamelincourt 1996). A dry 100X objective
with NA = 0.95 and laser wavelength 785 nm gives a theoretical depth resolution of 0.9 µm
when the refractive index of the sample is 1.5.
3.2.1 Effect of light refraction on depth resolution
Light refraction at the air–sample interface affects the depth sampled and the nominal depth
resolution (Figure 6). Recently, several publications have suggested ways to calculate and
model the effects burdening confocal Raman depth profiling (Everall 2000, Baldwin and
Batchelder 2001, Reinecke et al. 2001, Baia et al. 2002). However, after a drastic decrease in
depth resolution due to refraction it is difficult to gain back the lost resolution
mathematically.
The air–sample interface can be removed by using an oil immersion objective. An oil
immersion objective for confocal Raman depth profiling has been introduced only very
recently (Vyörykkä et al. 1999, Vyörykkä 1999, Everall 2000, Paper I). These publications
report clear advantages of the immersion method over the traditional dry method. Recently,
depth profiling with the immersion method was successfully applied in investigations of light
and water fastness of ink jet prints and the adhesion of electrophotographic prints (Vikman
and Sipi 2003).
24
s´s
n
n2
n2>n
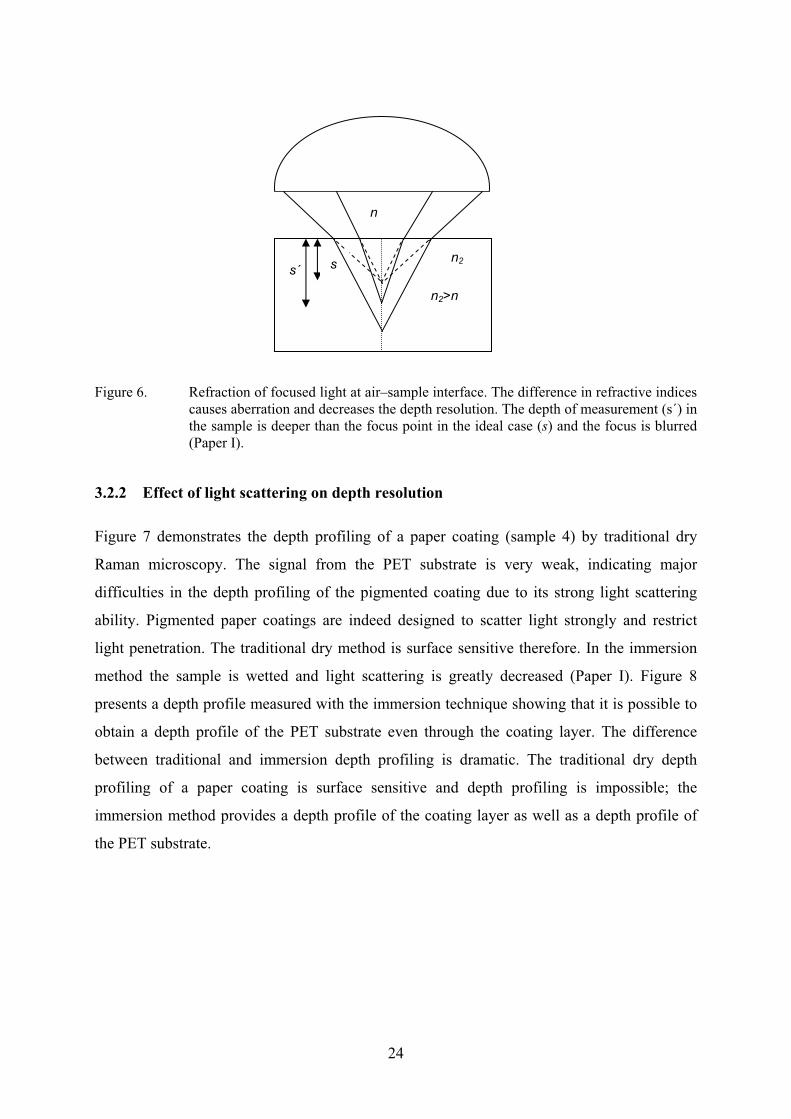
Figure 6. Refraction of focused light at air–sample interface. The difference in refractive indices causes aberration and decreases the depth resolution. The depth of measurement (s´) in the sample is deeper than the focus point in the ideal case (s) and the focus is blurred (Paper I).
3.2.2 Effect of light scattering on depth resolution
Figure 7 demonstrates the depth profiling of a paper coating (sample 4) by traditional dry
Raman microscopy. The signal from the PET substrate is very weak, indicating major
difficulties in the depth profiling of the pigmented coating due to its strong light scattering
ability. Pigmented paper coatings are indeed designed to scatter light strongly and restrict
light penetration. The traditional dry method is surface sensitive therefore. In the immersion
method the sample is wetted and light scattering is greatly decreased (Paper I). Figure 8
presents a depth profile measured with the immersion technique showing that it is possible to
obtain a depth profile of the PET substrate even through the coating layer. The difference
between traditional and immersion depth profiling is dramatic. The traditional dry depth
profiling of a paper coating is surface sensitive and depth profiling is impossible; the
immersion method provides a depth profile of the coating layer as well as a depth profile of
the PET substrate.

25
0
2000
4000
6000
8000
10000
12000
14000
16000
0 2 4 6 8 10 12 14 16 18 20 22
Sample movement in z-direction [µm]
Inte
nsity
CaCO3
SB-latex
PET
0
1000
2000
3000
4000
5000
6000
7000
8000
9000
0 2 4 6 8 10 12 14 16 18 20 22 24 26 28 30
Depth [µm]
Inte
nsity
CaCO3
SB-latex
PET
Figure 7. Depth profile of a paper coating applied on a PET film measured by the traditional dry method. The signal from the PET substrate is very weak. (Paper I)
Figure 8. Depth profile of a coating applied on a PET film measured by the immersion method. The depth profile of the PET substrate can be obtained even through the coating layer. The shoulders in the CaCO3 and SB-latex profiles are due to the overlapping of Raman bands from PET. (Paper I)
The immersion method provides several advantages over the traditional dry method: depth
resolution is enhanced, data analysis is easier (depth of analysis is the same as focusing depth)
and fluorescence is effectively quenched (Paper I). Moreover, in the case of coated paper
products, depth profiling is not possible without the reduction in light scattering provided by
the immersion technique (Paper I).

26
3.2.3 Determination of depth resolution
The most popular definition of spatial resolution for a confocal system is the full width at
half-maximum (FWHM) intensity of the measured instrument point-spread function (PSF)
(Wilson 1990, Tabaksblat et al. 1993). The PSF describes the measurement volume. The
FWHM criterion states that two triangular-shaped lines are resolved if the distance between
the lines is equal to or greater than FWHM (Griffiths and de Haseth 1986). Two layers with
different Raman spectra can nevertheless be detected and resolved below the depth resolution
limit because the Raman signals are detected at different wavenumbers. The depth resolution
does not indicate the thinnest layer that can be identified, which depends on the sensitivity of
the instrument for the specimen in question. In confocal Raman spectroscopy, the final shape
of the depth profile is affected by the sample thickness and concentration profiles. These
variables thus have an effect on the spatial resolution obtained. Shorter excitation wavelength
would improve the depth resolution (see eq. 2), but the probability of light induced
fluorescence increases with the energy of the light and may ensue severe problems. It has also
been suggested (Paper II) that deconvolution enhances the depth resolution of confocal
Raman and that might allow a direct analysis of the concentration profiles.
A convolution integral was applied to model the depth profile formation in confocal Raman
microscopy (Paper II). Figure 9 depicts a PSF (FWHM 4 µm), a theoretical sample function
(boxcar of 20 µm thickness) and the resulting depth profile. When the sample is considerably
thicker than the width of the PSF, the sample surface is located at the half height of the
maximum intensity. This corresponds to a situation where the laser is focused on the surface
and half of the PSF is inside the sample (Figure 9).

27
0 10 20 30 40 50 600
0.5
1
0 10 20 30 40 50 600
0.5
1
0 10 20 30 40 50 600
0.5
1
Depth [µm]
Inte
nsity
Depth [µm]
Depth [µm]
Inte
nsity
Inte
nsity
PSF
Sample function
Depth profile
Figure 9. Signal formation in confocal Raman microscopy. The PSF is convolved over the sample function producing the depth profile of the sample. When the laser is focused on the surface, half of the PSF is inside the sample (thick sample) and the signal is half of the maximum. Hence, the sample surface is located approximately at the half height position of the depth profile.
Usually the PSF has been measured by depth profiling a thin sample to see the effect of
broadening directly. Silicon wafers have been employed in Raman spectroscopy (Hajadoost
and Yarwood 1996). When a silicon wafer was used, broadening of the PSF was observed and
mirroring of the PSF was necessary (Paper I). The determined depth resolution was 5 µm.
Later, in Paper II, it was found that for excitation wavelength 785 nm, as employed in this
work, silicon has a penetration depth (I = I0/e) of approximately 8 µm and silicon wafer does
not, therefore, act as a thin sample (Aspnes and Studna 1983). Knowledge of the PSF is
needed to determine the depth resolution and to model the depth profiling. The PSF is also
necessary if the depth resolution is to be improved by deconvolution (Govil et al. 1993, Paper
II).
28
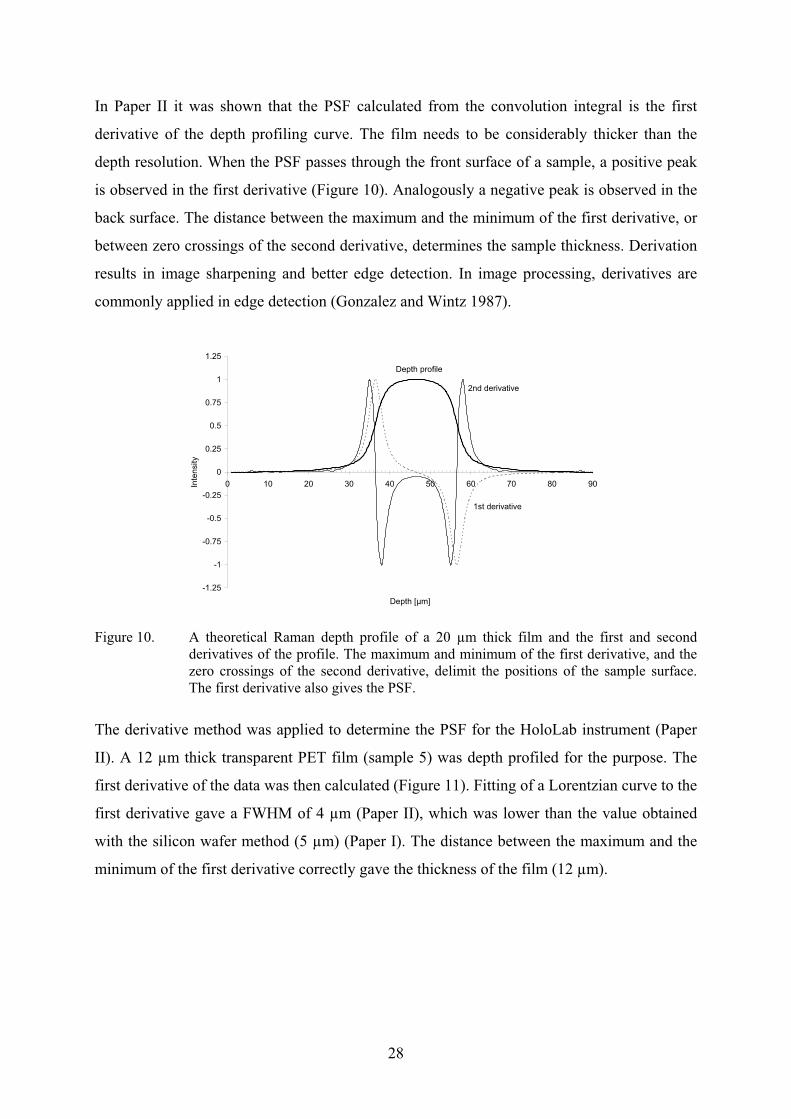
In Paper II it was shown that the PSF calculated from the convolution integral is the first
derivative of the depth profiling curve. The film needs to be considerably thicker than the
depth resolution. When the PSF passes through the front surface of a sample, a positive peak
is observed in the first derivative (Figure 10). Analogously a negative peak is observed in the
back surface. The distance between the maximum and the minimum of the first derivative, or
between zero crossings of the second derivative, determines the sample thickness. Derivation
results in image sharpening and better edge detection. In image processing, derivatives are
commonly applied in edge detection (Gonzalez and Wintz 1987).
-1.25
-1
-0.75
-0.5
-0.25
0
0.25
0.5
0.75
1
1.25
0 10 20 30 40 50 60 70 80 90
Depth [µm]
Inte
nsity
Depth profile
1st derivative
2nd derivative
Figure 10. A theoretical Raman depth profile of a 20 µm thick film and the first and second derivatives of the profile. The maximum and minimum of the first derivative, and the zero crossings of the second derivative, delimit the positions of the sample surface. The first derivative also gives the PSF.
The derivative method was applied to determine the PSF for the HoloLab instrument (Paper
II). A 12 µm thick transparent PET film (sample 5) was depth profiled for the purpose. The
first derivative of the data was then calculated (Figure 11). Fitting of a Lorentzian curve to the
first derivative gave a FWHM of 4 µm (Paper II), which was lower than the value obtained
with the silicon wafer method (5 µm) (Paper I). The distance between the maximum and the
minimum of the first derivative correctly gave the thickness of the film (12 µm).

29
Figure 11. The first derivative of the depth profile of a 12 µm thick PET film gives the PSF of the Raman measurement technique. The derivative is displayed with a fitted Lorentzian curve (FWHM 4 µm). (Paper II)
3.2.4 Layer thickness analysis below the nominal depth resolution
Thin layers were simulated with boxcar functions having thicknesses of 0 µm, 1 µm, 2 µm, 3
µm, 4 µm, 5 µm and 6 µm. A similar convolution with the PSF as above was employed. The
zero micrometre thickness was obtained directly by using only the PSF. These layers were
produced to determine whether a confocal Raman microscope with nominal depth resolution
of 4 µm could be used to determine layer thicknesses less than the nominal depth resolution.
Figure 12 illustrates the first derivatives of the simulated depth profiling curves of samples 0
µm, 1 µm and 2 µm thick. Because of the limited depth resolution, the distances between the
zero crossings in the second derivative (apparent thickness) were larger than the actual
sample thicknesses.
-1
-0.8
-0.6
-0.4
-0.2
0
0.2
0.4
0.6
0.8
1
1.2
0 5 10 15 20 25 30 35 40 45 50 55
4 µm Lorentzian
first derivative of 12 µm PET depth
profile
Depth [µm]
Inte
nsity
-1
-0.8
-0.6
-0.4
-0.2
0
0.2
0.4
0.6
0.8
1
1.2
0 5 10 15 20 25 30 35 40 45 50 55
4 µm Lorentzian
first derivative of 12 µm PET depth
profile
Depth [µm]
Inte
nsity

30
-1.5
-1
-0.5
0
0.5
1
1.5
0 5 10 15 20 25 30
Depth [µm]
Inte
nsity
1 µm sample
2 µm sample
0 µm (PSF)
Figure 12. First derivatives of modelled Raman depth profiles of samples 0 µm, 1 µm and 2 µm thick. The distances between the inflection points were larger than the modelled sample thicknesses because of the PSF (FWHM 4 µm) of the instrument. Apparent thickness values of these thin samples are very close to each other, as can be seen in Figure 13.
Figure 13 shows data extracted from the modelled depth profiling curves. Zero crossings of
the second derivatives were used to obtain apparent thickness values. The curve of actual
thickness values vs. apparent thickness values approaches the curve y = x. The difference
between these two curves indicates the deviation from the actual thickness values. At 4 µm
actual thickness, the difference is small (0.3 µm) and the result from the second derivative
may be used directly. The analysis of layer thicknesses less than 2 µm becomes difficult
owing to the steep slope of the curve below that thickness, and the accuracy of the method
becomes critical.

31
Figure 13. Data calculated from modelled depth profiling data can be used to convert the apparent thickness to actual sample thickness. The distance between the calculated curve and the line that it approaches shows the deviation from the actual thickness.
3.2.5 Depth resolution in binder migration studies
The detection of binder migration was studied through model simulation. The PSF (FWHM 4
µm) was convolved over two separate functions describing the CaCO3 and SB-latex
concentrations as functions of depth. The simulated CaCO3 function showed an even
concentration through the 12 µm thickness (boxcar function). In the SB-latex depth profile,
the binder migration was simulated by specifying a constant concentration for the first two
micrometres and a 20% lower concentration for the rest of the layer (Figure 14). An
increasing gradient towards the top surface is evident in the intensity ratio curve, while the
differences in the depth profiles are more difficult to observe. The intensity ratio varies by
less than 20% because the actual collection volume extends into the physically thicker, lower
concentration region, even when the focus is set in the surface. This model simulation
illustrates how features that are thinner than the depth resolution are seen with confocal
Raman microscopy. In confocal Raman measurements, the sensitivity at the surface is
enhanced because the immersion oil filled space above the sample does not give rise to
blurring. It can be concluded that the use of surface gradient is useful for the characterization
of binder migration, even when the scale of the thickness is less than the nominal depth
resolution.
0
1
2
3
4
5
6
7
0 1 2 3 4 5 6 7
Apparent thickness
Thic
kness [
µm
]
y = x

32
0
0.2
0.4
0.6
0.8
1
1.2
0 4 8 12 16 20 24 28 32
Depth [µm]
Inte
ns
ity
0
0.2
0.4
0.6
0.8
1
1.2
I (S
B)
/ I(
Ca
CO
3)
calcium carbonate
SB-latex
SB-latex / calciumcarbonate (y-axis ->)
CaCO3
10 µm
2 µm
SB
top surface bottom surface
Figure 14. Simulation of detection of binder migration with confocal Raman depth profiling. The CaCO3 concentration was set at constant level, while after the surface layer (2 µm) the SB-latex content was set 20% lower than the content in the surface layer of the coating. The intensity ratio curve indicates how the migration is observed when the depth resolution is 4 µm. (Paper III)
”analysed” concentration profile of SB-latex
expected depth profiles
actual concentration
profiles
33
3.3 Spatial resolution in lateral mapping
The lower limit of the lateral resolution in Raman microscopy can be approximated by
Abbe’s law
NA2
l²Dx , (3)
where l is the laser wavelength and NA is the numerical aperture of the objective (Schrader
1995). Equation 3 explains how the spatial resolution of Raman microscopy can be altered by
selection of the objective. In reality the spatial resolution also depends on the instrument
specifications such as the size of the pinhole and on how well the laser beam fills the
objective.
The spatial resolution is generally less important in lateral mapping of coated papers than in
depth profiling. With the HoloLab Raman microscope the laser spot size with a 10X (NA
0.25) objective was 20 µm and therefore the lateral resolution using the FWHM criterion was
approximately 10 µm, while the theoretical limit is at 1.6 µm (eq. 3).
A set of pigment coatings on PET substrate (sample set 9) was used to investigate the depth of
sampling for a 10X objective in the case of light scattering paper coatings. Figure 15
illustrates how increase in the coating thickness increases the CaCO3 intensity. With change
in the light scattering properties of the coating the intensity responses would be altered. Error
in the coating thicknesses was considerable in the thinnest coatings. Raman intensities
without normalization were also a source of error. However, even though lateral mapping
does not provide quantitative information on coating thickness, variation in the coating
thickness can be qualitatively mapped together with the chemical composition of the paper
coating. Another source of major intensity variation could be the focusing. Our earlier work
demonstrated that with a 10X objective the intensity was relatively constant in z-direction in a
range of approximately 60 µm (Vyörykkä et al. 2002).

34
Figure 15. Raman intensity of CaCO3 and PET as the coating thickness increases. Error bars are given as 95% confidence limits.
In light scattering samples the laser light is diffusely scattered and the diameter is increased,
while in transparent samples the focus is sharper and the sample transmits the laser radiation
(Schrader 1995). In a strongly light scattering paper coating, laser power reaching the PET
substrate is reduced. Moreover, the coating layer restricts backscattered Raman photons from
the PET substrate from reaching the detector. The depth sampled with the 10X objective was
determined by using the data shown in Figure 15 and the intensities of the PET substrate of
the same measurements. Figure 16 presents an exponential decay curve showing a sampling
depth of approximately 6 µm in this case.
0
0.2
0.4
0.6
0.8
1
1.2
0 2 4 6 8 10 12 14 16 18 20
Coating thickness [µm]
I(P
ET
) /
I(P
ET
+ C
aC
O3)
1/ e
Figure 16. Sampling depth determined with use of coatings of different thicknesses was approximately 6 µm. The PET intensities were normalised to obtain intensity 1 for the zero coating thickness.
0
1000
2000
3000
4000
5000
6000
7000
8000
0 5 10 15 20
Coating thickness [µm]
I(C
aC
O 3)

35
For surface sensitive measurements, a metallurgical 100X (NA 0.95) objective with 2.5 µm
lateral resolution was employed in the HoloLab Raman instrument. The depth sampled for
transparent polymer films with the 100X dry objective was 3 µm. The depth sampled is given
as 1/e depth for the PSF half that penetrates into the sample. When the measurement is done
from the sample surface, half of the measurement volume described by the PSF is above the
sample and does not give rise to a signal. This means that at the surface of a transparent
sample the signal is approximately 50% of the maximum. When focusing with the Raman
signal, therefore, the maximum signal is achieved deeper inside the sample (see Figure 9). In
the case of paper coatings, light penetration is reduced due to light scattering, and focusing
with the Raman signal sets the measurement to the surface. The sampling depth using the
100X dry objective is approximated to be 1-2 µm.
36
immersion objective
sample, n2º1.55
cover glass, n3=1.515
immersion oil 2, n5º1.43
immersion oil 1, n4=1.516
glass slide
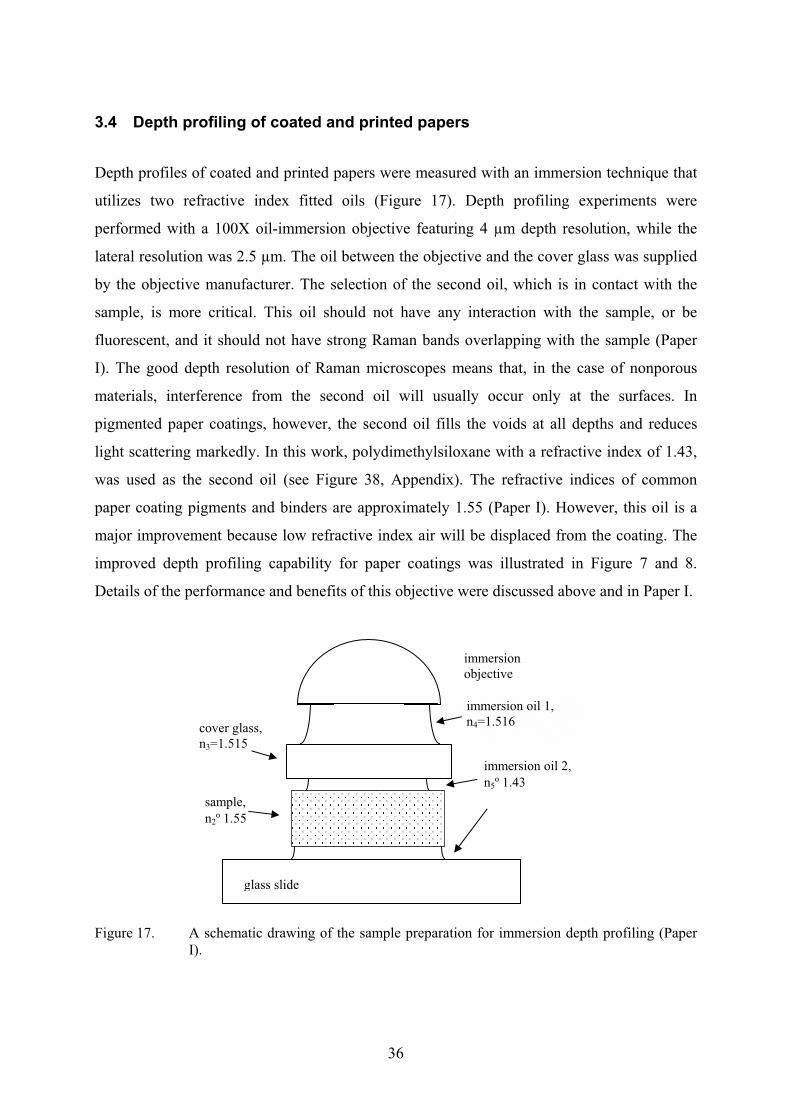
3.4 Depth profiling of coated and printed papers
Depth profiles of coated and printed papers were measured with an immersion technique that
utilizes two refractive index fitted oils (Figure 17). Depth profiling experiments were
performed with a 100X oil-immersion objective featuring 4 µm depth resolution, while the
lateral resolution was 2.5 µm. The oil between the objective and the cover glass was supplied
by the objective manufacturer. The selection of the second oil, which is in contact with the
sample, is more critical. This oil should not have any interaction with the sample, or be
fluorescent, and it should not have strong Raman bands overlapping with the sample (Paper
I). The good depth resolution of Raman microscopes means that, in the case of nonporous
materials, interference from the second oil will usually occur only at the surfaces. In
pigmented paper coatings, however, the second oil fills the voids at all depths and reduces
light scattering markedly. In this work, polydimethylsiloxane with a refractive index of 1.43,
was used as the second oil (see Figure 38, Appendix). The refractive indices of common
paper coating pigments and binders are approximately 1.55 (Paper I). However, this oil is a
major improvement because low refractive index air will be displaced from the coating. The
improved depth profiling capability for paper coatings was illustrated in Figure 7 and 8.
Details of the performance and benefits of this objective were discussed above and in Paper I.
Figure 17. A schematic drawing of the sample preparation for immersion depth profiling (Paper I).

37
3.4.1 Analysis of binder migration
In place of physical cross-sectioning, confocal Raman microscopy provides a possibility for
contact-free scanning of cross-sections with the immersion depth profiling method. The cross-
section is composed of several depth profiles in a straight line. Figure 18 displays a cross-
section map of SB-latex content measured with the immersion depth profiling method
(sample 6). The measurement consisted of a line scan of ten depth profiles at 100 µm intervals
producing a 0.9-mm-long cross-section of the paper coating.
Figure 18. Cross-section image of depth profiled double coated paper giving the SB-latex distribution in the coating cross-section (Paper III).
Table 2 summarizes the findings from the depth profiling data of Figure 18. The average SB-
latex content that was detected was equal to the amount applied. Surface content of the latex
is an average value of the first layer, while the bottom content of the latex is an average value
of the last layer. In this cross-section, the top surface contained less SB-latex than the bottom
layer. However, coated papers are still heterogeneous at this scale and more measurements
would be required to decide whether or not latex migration has occurred towards the base
paper. The uncertainty in the SB-latex content, and thus giving the accuracy of the depth
profiling set-up, was determined by measuring ten depth profiles at the same position and
calculating the standard deviation of the data.

38
Table 2. Results from the cross-section depth profiling experiment displayed in Figure 18 (Paper III).
Analysed value
Average thickness [µm] 9 µm
Average SB-latex content [pph] 12.0 (±0.2)
SB-latex content at the surface [pph] 11.3 (±0.2)
SB-latex content at the bottom [pph] 12.6 (±0.2)
3.4.2 Coating thickness analysis
The thickness profile of double coated samples (sample set 8) having aragonite PCC in the
top coating and calcite PCC in the precoating could be determined from the characteristic
Raman bands of the allomorphs of CaCO3 (calcite 278 cm-1, aragonite 208 cm-1) (see
Appendix, Figure 32). In a similar way, thickness profiles were determined for double coated
samples in which the two layers could be distinguished by the characteristic bands of TiO2
(see Appendix, Figure 34)
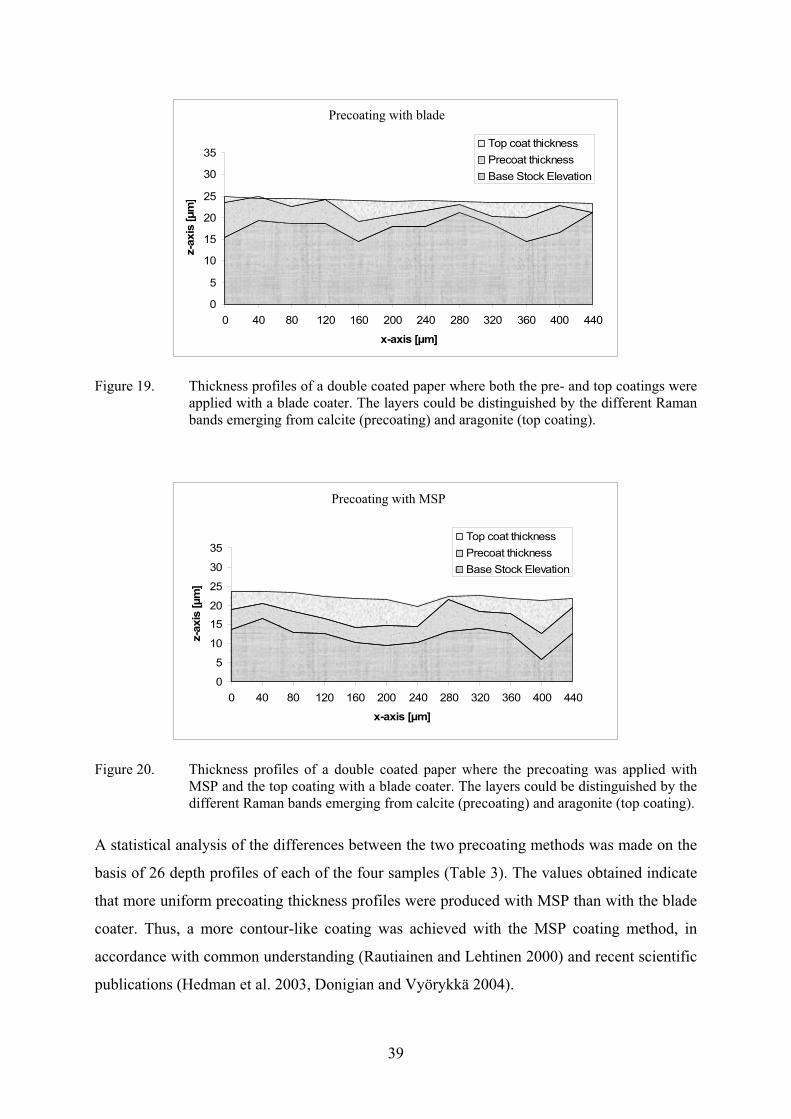
Figure 19 and 20 depict the measured thickness profiles of double coated papers (sample set
8) for which 12 depth profiles were measured at 40 µm distances. The base stock elevation
was determined as the bottom surface of the precoating because of the weakness of the
Raman signal from the base paper. At certain points, coating penetration into the base paper
made it difficult to determine the bottom surface. Independent of the precoating method
(blade or MSP), a clear “valley” filling was observed in the top coat application.
39
precoating by blade
0
5
10
15
20
25
30
35
0 40 80 120 160 200 240 280 320 360 400 440
x-axis [µm]
z-a
xis
[µm
]
Top coat thickness
Precoat thickness
Base Stock Elevation
Figure 19. Thickness profiles of a double coated paper where both the pre- and top coatings were applied with a blade coater. The layers could be distinguished by the different Raman bands emerging from calcite (precoating) and aragonite (top coating).
precoating by MSP
0
5
10
15
20
25
30
35
0 40 80 120 160 200 240 280 320 360 400 440
x-axis [µm]
z-a
xis
[µm
]
Top coat thickness
Precoat thickness
Base Stock Elevation
Figure 20. Thickness profiles of a double coated paper where the precoating was applied with MSP and the top coating with a blade coater. The layers could be distinguished by the different Raman bands emerging from calcite (precoating) and aragonite (top coating).
A statistical analysis of the differences between the two precoating methods was made on the
basis of 26 depth profiles of each of the four samples (Table 3). The values obtained indicate
that more uniform precoating thickness profiles were produced with MSP than with the blade
coater. Thus, a more contour-like coating was achieved with the MSP coating method, in
accordance with common understanding (Rautiainen and Lehtinen 2000) and recent scientific
publications (Hedman et al. 2003, Donigian and Vyörykkä 2004).
Precoating with blade
Precoating with MSP

40
Table 3. Statistical data on thickness values for double coated papers (26 thickness values for each sample). A: calcite in precoating, B: TiO2 and calcite in precoating.
Sample set 8
A / Blade
Sample set 8
B / Blade
Sample set 8
A / MSP
Sample set 8
B / MSP
Precoat thickness [µm] 5.4 4.9 4.8 4.7
Stdev [µm] 4.1 3.1 1.9 2.1
Top coat thickness [µm] 4.5 4.7 5.4 5.3
Stdev [µm] 2.2 2.9 1.4 3.3
3.4.3 Determination of ink layer thickness
Figure 21 demonstrates depth profiles of an offset printed paper (sample 7 B) measured from
a magenta ink test area. It is also possible to collect Raman spectra through yellow inks.
Black and cyan inks, in contrast, are difficult to analyse owing to their strong light absorption
at the laser wavelength (785 nm), fluorescing of the dyes and possible burning of the samples
under the intense laser beam. Depth profiling through a print allows direct analysis of the SB-
latex content under the print and especially under printing defects. Depth profiling through
print also gives information about ink pigment, but the oils, binders and other additives
commonly used in offset inks cannot be detected.
0
500
1000
1500
2000
2500
3000
3500
0 5 10 15 20 25 30 35 40
Depth [µm]
I (m
ag
en
ta)
0
1000
2000
3000
4000
5000
6000
I (C
aC
O3)
Magenta (1363)
CaCO3 (1084)
Figure 21. Depth profiles of magenta dye and the CaCO3 pigment of coated and printed paper (Paper III).

41
The apparent surface positions of the ink layer and the top of the coating were determined as
the zero crossings of the second derivatives of the depth profiles (Figure 22). The second
derivative of the coating depth profile had a lot of noise in the back side due to coating
penetration into the base paper, which blurred the position of the back surface. Because of the
noise in the second derivative the surface positions were confirmed with use of the first
derivative, which contained less noise.
-1000
-800
-600
-400
-200
0
200
400
600
10 11 12 13 14 15 16 17 18 19 20 21 22 23 24 25
Depth [µm]
2n
d d
eri
vati
ve o
f in
ten
sit
y
2. deriv. of magenta (1363)
2. deriv of CaCO3 (1084)
coating surface
apparent ink surfaces
Figure 22. Second derivative of the Raman depth profiles illustrated in Figure 21. The second derivative of the coating back side is noisier due to coating penetration. The x-axis is shifted 1 micrometre towards larger values when compared to the x-axis of the depth profile (Figure 21). (Paper III)
In this single depth profile, the apparent thickness of the ink layer was 2.9 µm corresponding
to an actual thickness of 2.0 µm (see Figure 13). The actual thickness value is higher than the
typical thickness of offset printed wet ink films (1 µm) given by Lepoutre (1989), perhaps
because the depth resolution is not sufficient to allow accurate analysis at thicknesses less
than 2 µm (see Figure 13). The use of the second derivative allowed analysis of the ink
pigment penetration into the coating layer. The definition of ink pigment penetration is
technically relatively easy due to the well-defined ink layer and coating surface. Definition of
the coating back surface is sometimes more difficult due to coating penetration into the base
paper. The penetration of the ink can be calculated through an analysis of the positions of the
surfaces of the ink and the coating. It can be assumed that the confocal Raman method
broadens the data of these thin layers symmetrically. Thus when the total broadening was
reduced by 0.9 µm (difference between apparent thickness and actual thickness), the top
surface of the ink was located at 13.8 µm, while the bottom surface was at 15.7 µm (in the
depth profile figure the positions are 1 micrometre towards lower values). Since the top

42
surface of the coating was located at position 15.3 µm, the ink penetration into the coating
layer was 0.4 µm.
Uncertainty in the surface position values was reduced by averaging data from several
measurements. The uncertainty of an average is inversely proportional to the square root of
the number of averaged points. Twenty depth profiles each were measured from samples A
and B of sample set 7 and the data were analysed for ink layer thicknesses, ink penetration
and SB-latex migration. The analysis of SB-latex migration was based on the gradient (see
Figure 14 and related text) to determine if mottling was due to surface content of the SB-
latex.
The analysed data are collected in Table 4. Sample A exhibited a larger negative SB-latex
gradient signifying greater binder migration towards the coating surface; however, the large
error limits indicate very high variation in the gradient for both samples. Moreover, the
surface SB-latex values were fairly similar and it may be concluded that there was no
consistent difference in the SB-latex migration of the samples. Significant differences were
observed in the ink layer values: sample B had a thicker ink layer than sample A. The ink
layer thicknesses were also greater than expected. In offset printing the transferred ink layer
thickness is typically 1 µm (Lepoutre 1989, Kishida et al. 2001). Sample B also exhibited
greater ink penetration into the coating than sample A. In the case of highly porous coatings,
the ink can be expected to penetrate totally into the coating (Kishida et al. 2001), but common
understanding is that in the standard coated paper grades used in offset printing larger ink
pigments and binders remain mostly on the paper surface, while ink oils partially separate and
penetrate into the coating structure (Wallström 1991, Ström et al. 2001, Rousu 2002).
In confocal Raman results, insufficient depth resolution limits the conversion from the
apparent ink layer thickness to the actual ink layer thickness when thicknesses are less than 2
µm. However, the thicker ink layer of sample B should not yet be below this resolution limit.
The conversion affects both top and bottom ink layer surface positions but, owing to the
thickness of the coating layer, not the position of the coating surface. A difference in the
converted ink layer thickness would also change the ink penetration value. Comparison of the
ink layer thicknesses of the samples was nevertheless possible.

43
Table 4. Results for samples A and B (sample set 7).
Sample set 7 A B
Apparent ink layer thickness 2.8 (±0.2) 3.5 (±0.3)
Ink layer thickness [µm] 1.8 (±0.3) 2.8 (±0.4)
Ink penetration [µm] 0.9 (±0.2) 1.4 (±0.3)
SB-latex content at the surface [pph]1 15.9 (±0.7) 15.6 (±1.2)
SB-latex gradient [pph/µm] -0.003 (± 0.006) -0.001 (± 0.004)
1 calibration coefficient 94.3 from paper I was employed. It may not be correct in this case owing
to the different coating recipe.
SEM method has usually been applied in coating and ink thickness analysis (Allem 1998,
Kishida et al. 2001, Chinga 2002). The SEM method can provide resolution as high as 0.02
µm/pixel, but prior cross-section preparation and staining are essential for SB-latex analysis
in depth direction (Chinga 2002). In high resolution imaging, SEM method is better than
confocal Raman depth profiling, but quantification is more reliable with Raman method.
The ink thickness data of confocal Raman data is provided simultaneously with the depth
profiling curves of paper coating, which means that SB-latex data and coating thickness data
can be correlated with ink film thickness. The analysis of thin layers with confocal Raman
depth profiling method may find even better applications in other fields.
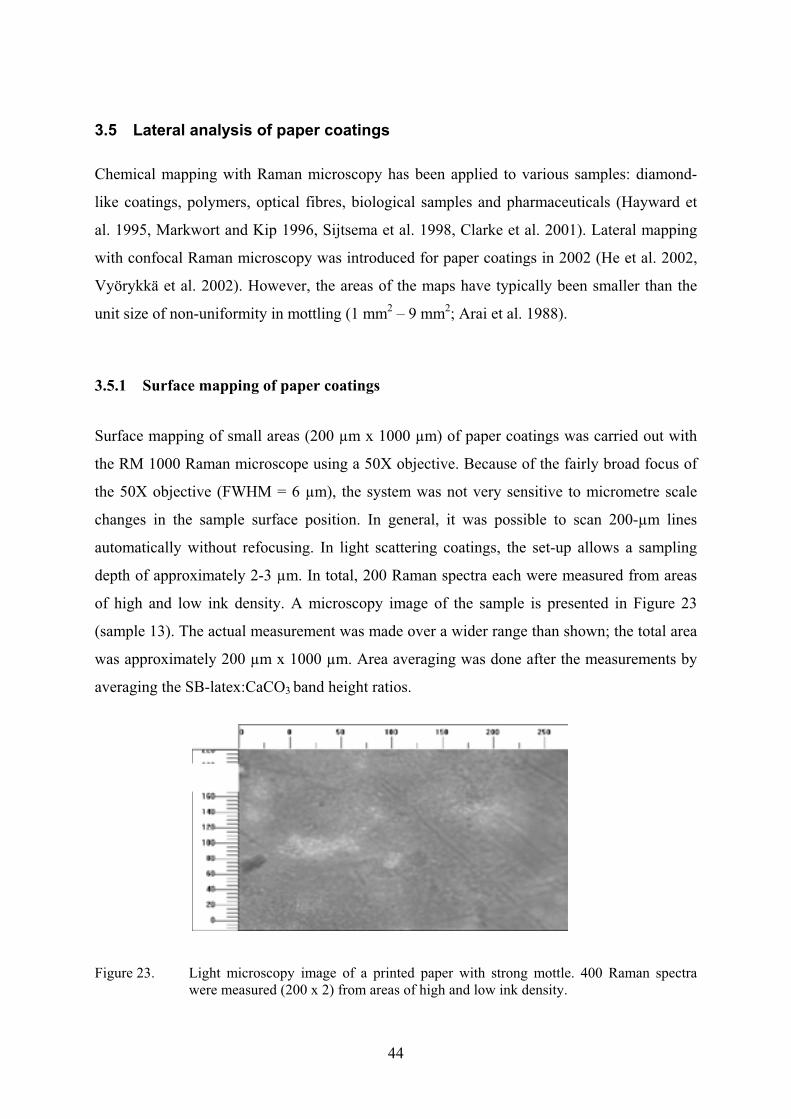
44
3.5 Lateral analysis of paper coatings
Chemical mapping with Raman microscopy has been applied to various samples: diamond-
like coatings, polymers, optical fibres, biological samples and pharmaceuticals (Hayward et
al. 1995, Markwort and Kip 1996, Sijtsema et al. 1998, Clarke et al. 2001). Lateral mapping
with confocal Raman microscopy was introduced for paper coatings in 2002 (He et al. 2002,
Vyörykkä et al. 2002). However, the areas of the maps have typically been smaller than the
unit size of non-uniformity in mottling (1 mm2 – 9 mm2; Arai et al. 1988).
3.5.1 Surface mapping of paper coatings
Surface mapping of small areas (200 µm x 1000 µm) of paper coatings was carried out with
the RM 1000 Raman microscope using a 50X objective. Because of the fairly broad focus of
the 50X objective (FWHM = 6 µm), the system was not very sensitive to micrometre scale
changes in the sample surface position. In general, it was possible to scan 200-µm lines
automatically without refocusing. In light scattering coatings, the set-up allows a sampling
depth of approximately 2-3 µm. In total, 200 Raman spectra each were measured from areas
of high and low ink density. A microscopy image of the sample is presented in Figure 23
(sample 13). The actual measurement was made over a wider range than shown; the total area
was approximately 200 µm x 1000 µm. Area averaging was done after the measurements by
averaging the SB-latex:CaCO3 band height ratios.
Figure 23. Light microscopy image of a printed paper with strong mottle. 400 Raman spectra were measured (200 x 2) from areas of high and low ink density.
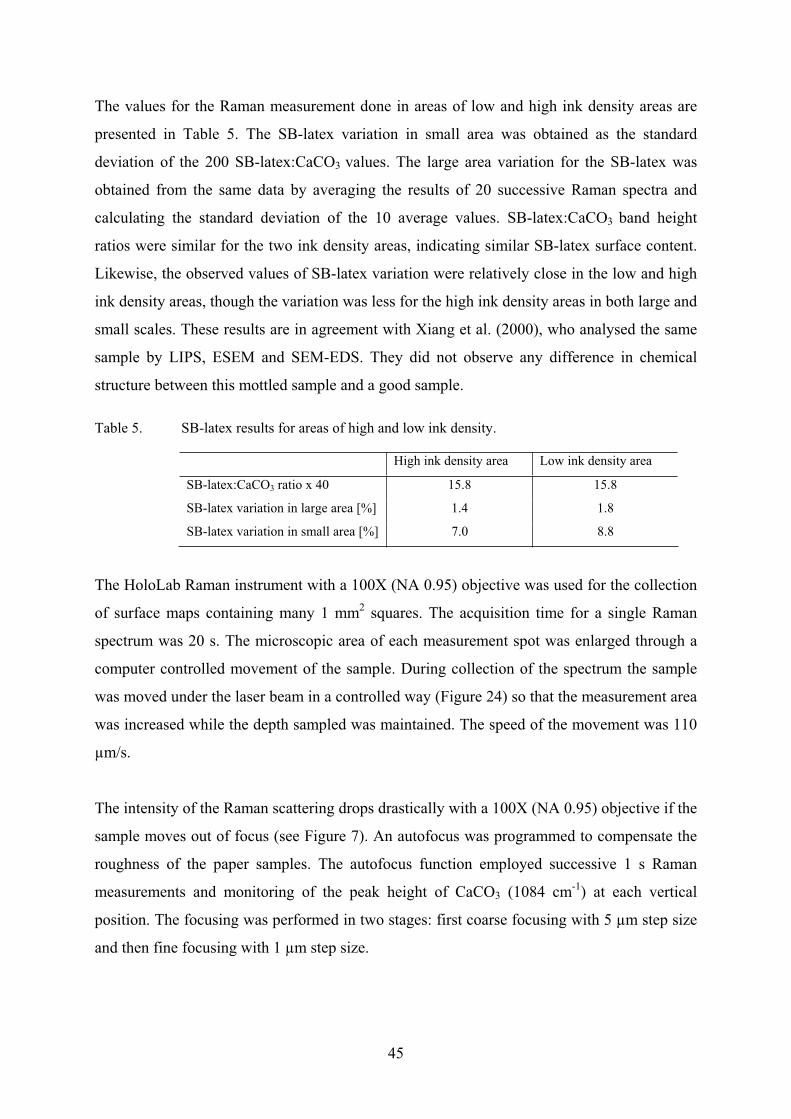
45
The values for the Raman measurement done in areas of low and high ink density areas are
presented in Table 5. The SB-latex variation in small area was obtained as the standard
deviation of the 200 SB-latex:CaCO3 values. The large area variation for the SB-latex was
obtained from the same data by averaging the results of 20 successive Raman spectra and
calculating the standard deviation of the 10 average values. SB-latex:CaCO3 band height
ratios were similar for the two ink density areas, indicating similar SB-latex surface content.
Likewise, the observed values of SB-latex variation were relatively close in the low and high
ink density areas, though the variation was less for the high ink density areas in both large and
small scales. These results are in agreement with Xiang et al. (2000), who analysed the same
sample by LIPS, ESEM and SEM-EDS. They did not observe any difference in chemical
structure between this mottled sample and a good sample.
Table 5. SB-latex results for areas of high and low ink density.
High ink density area Low ink density area
SB-latex:CaCO3 ratio x 40 15.8 15.8
SB-latex variation in large area [%] 1.4 1.8
SB-latex variation in small area [%] 7.0 8.8
The HoloLab Raman instrument with a 100X (NA 0.95) objective was used for the collection
of surface maps containing many 1 mm2 squares. The acquisition time for a single Raman
spectrum was 20 s. The microscopic area of each measurement spot was enlarged through a
computer controlled movement of the sample. During collection of the spectrum the sample
was moved under the laser beam in a controlled way (Figure 24) so that the measurement area
was increased while the depth sampled was maintained. The speed of the movement was 110
µm/s.
The intensity of the Raman scattering drops drastically with a 100X (NA 0.95) objective if the
sample moves out of focus (see Figure 7). An autofocus was programmed to compensate the
roughness of the paper samples. The autofocus function employed successive 1 s Raman
measurements and monitoring of the peak height of CaCO3 (1084 cm-1) at each vertical
position. The focusing was performed in two stages: first coarse focusing with 5 µm step size
and then fine focusing with 1 µm step size.
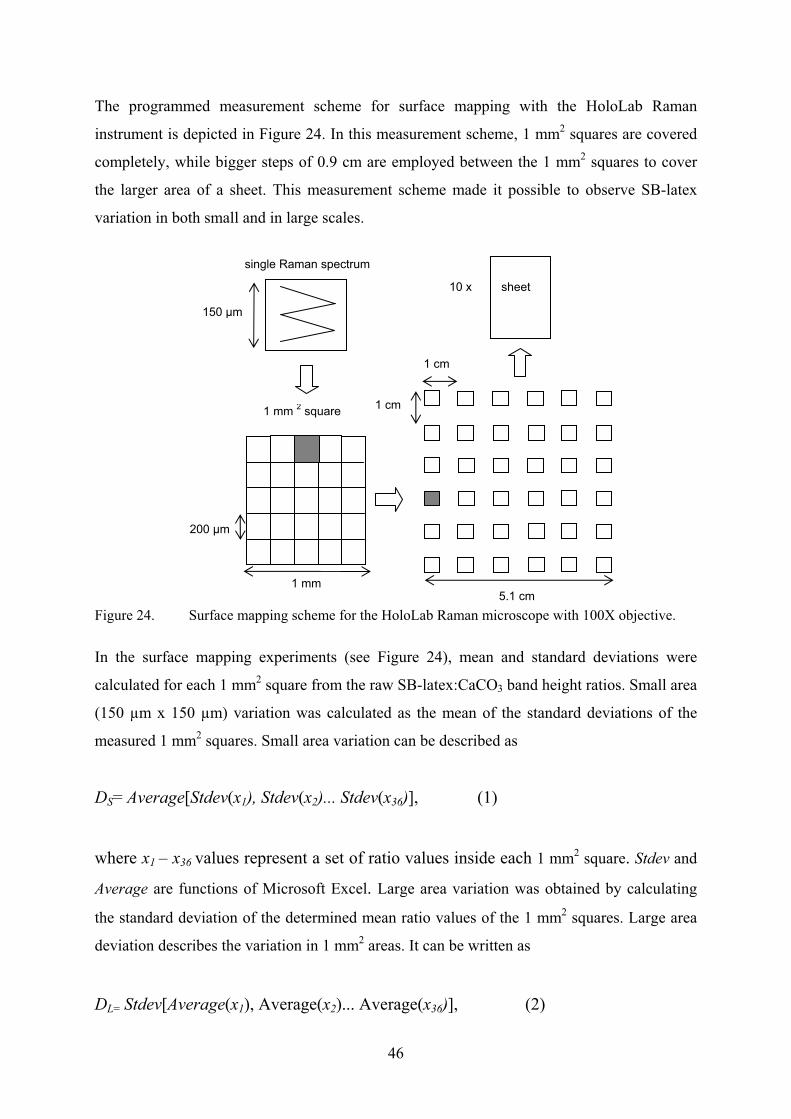
46
5.1 cm
1 cm
1 cm
10 x sheet
single Raman spectrum
1 mm 2 square
200 µm
1 mm
150 µm
The programmed measurement scheme for surface mapping with the HoloLab Raman
instrument is depicted in Figure 24. In this measurement scheme, 1 mm2 squares are covered
completely, while bigger steps of 0.9 cm are employed between the 1 mm2 squares to cover
the larger area of a sheet. This measurement scheme made it possible to observe SB-latex
variation in both small and in large scales.
Figure 24. Surface mapping scheme for the HoloLab Raman microscope with 100X objective.
In the surface mapping experiments (see Figure 24), mean and standard deviations were
calculated for each 1 mm2 square from the raw SB-latex:CaCO3 band height ratios. Small area
(150 µm x 150 µm) variation was calculated as the mean of the standard deviations of the
measured 1 mm2 squares. Small area variation can be described as
DS= Average[Stdev(x1), Stdev(x2)... Stdev(x36)], (1)
where x1 – x36 values represent a set of ratio values inside each 1 mm2 square. Stdev and
Average are functions of Microsoft Excel. Large area variation was obtained by calculating
the standard deviation of the determined mean ratio values of the 1 mm2 squares. Large area
deviation describes the variation in 1 mm2 areas. It can be written as
DL= Stdev[Average(x1), Average(x2)... Average(x36)], (2)
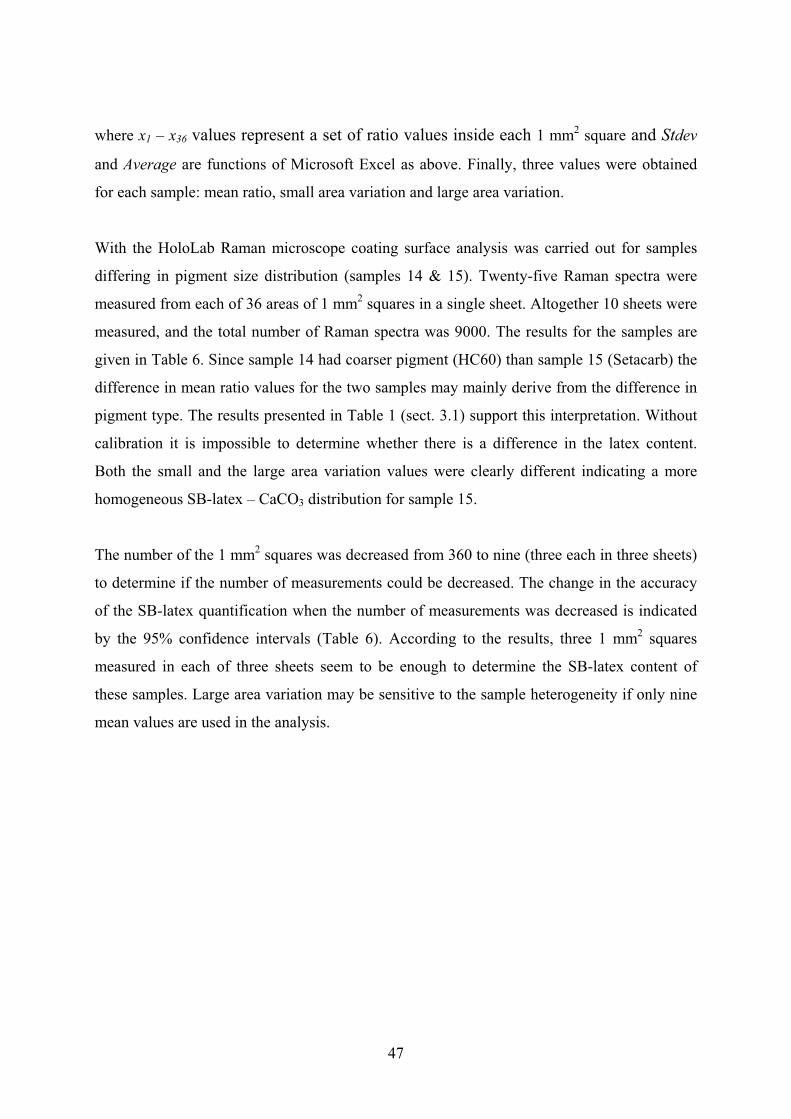
47
where x1 – x36 values represent a set of ratio values inside each 1 mm2 square and Stdev
and Average are functions of Microsoft Excel as above. Finally, three values were obtained
for each sample: mean ratio, small area variation and large area variation.
With the HoloLab Raman microscope coating surface analysis was carried out for samples
differing in pigment size distribution (samples 14 & 15). Twenty-five Raman spectra were
measured from each of 36 areas of 1 mm2 squares in a single sheet. Altogether 10 sheets were
measured, and the total number of Raman spectra was 9000. The results for the samples are
given in Table 6. Since sample 14 had coarser pigment (HC60) than sample 15 (Setacarb) the
difference in mean ratio values for the two samples may mainly derive from the difference in
pigment type. The results presented in Table 1 (sect. 3.1) support this interpretation. Without
calibration it is impossible to determine whether there is a difference in the latex content.
Both the small and the large area variation values were clearly different indicating a more
homogeneous SB-latex – CaCO3 distribution for sample 15.
The number of the 1 mm2 squares was decreased from 360 to nine (three each in three sheets)
to determine if the number of measurements could be decreased. The change in the accuracy
of the SB-latex quantification when the number of measurements was decreased is indicated
by the 95% confidence intervals (Table 6). According to the results, three 1 mm2 squares
measured in each of three sheets seem to be enough to determine the SB-latex content of
these samples. Large area variation may be sensitive to the sample heterogeneity if only nine
mean values are used in the analysis.

48
Table 6. Surface mapping results for samples 14 and 15 differing in pigment size (Paper IV).
36 squares of 1mm2
10 sheets
3 squares of 1 mm2
3 sheets
Mean of SB-latex:CaCO3 ratio x 100
Sample 14 / 15 9.5 / 13.0 9.6 / 13.2
95% confidence interval for mean
Sample 14 / 15 0.02 / 0.02 0.13 / 0.12
SB-latex variation in 150 µm x 150 µm area [%]
Sample 14 / 15 9.8 / 6.5 10.2 / 6.9
SB-latex variation in 1 mm2 [%]
Sample 14 / 15 5.1 / 1.9 4.5 / 1.6
3.5.2 Imaging of light scattering and reflection
Normally white light consists of waves that vibrate equally in all directions perpendicular to
its direction of propagation. Light passing through a polarizer is modified so that the vibration
is parallel to the direction of the polarising material. If a polarizer and an analyser are aligned
90º (i.e. crossed polars) to each other, no light will be detected under normal conditions. In
optical microscopy, polarizers and analysers are traditionally applied for the analysis of strain
and birefringence, while Raman spectroscopy combined with these techniques makes it
possible to identify the chemical composition and crystallinity of different areas (Louden
1989). Crossed polars reveal birefringence in colours or extinction varying with the
orientation. Distorted strain patterns and birefringence could be invisible under normal
conditions. A polarizing microscope was applied in the troubleshooting of coated papers by
Quackenbush (1988). In that work, optical and chemical staining were required to identify
pigments, binders and foreign materials present in coatings and print. A combination of
polarizers or other microscopic techniques with Raman microscopy allows determination of
the chemical or structural differences in areas that would otherwise be invisible.
In multiple light scattering, linearly polarized light becomes depolarized. Completely random
polarization is observed in samples exhibiting strong multiple light scattering (Stepanek
1993). Thus, the polarization plane of the light is rotated in light scattering. A schematic view
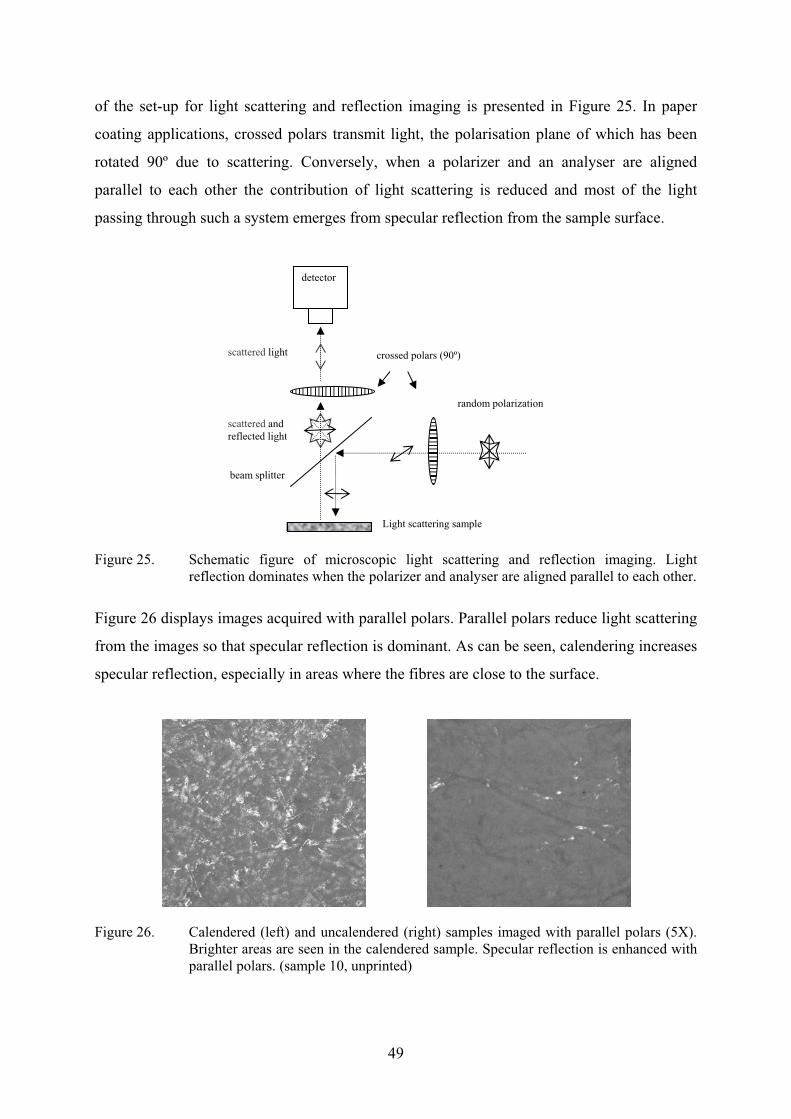
49
beam splitter
scattered and reflected light
scattered light crossed polars (90º)
random polarization
detector
Light scattering sample
of the set-up for light scattering and reflection imaging is presented in Figure 25. In paper
coating applications, crossed polars transmit light, the polarisation plane of which has been
rotated 90º due to scattering. Conversely, when a polarizer and an analyser are aligned
parallel to each other the contribution of light scattering is reduced and most of the light
passing through such a system emerges from specular reflection from the sample surface.
Figure 25. Schematic figure of microscopic light scattering and reflection imaging. Light reflection dominates when the polarizer and analyser are aligned parallel to each other.
Figure 26 displays images acquired with parallel polars. Parallel polars reduce light scattering
from the images so that specular reflection is dominant. As can be seen, calendering increases
specular reflection, especially in areas where the fibres are close to the surface.
Figure 26. Calendered (left) and uncalendered (right) samples imaged with parallel polars (5X). Brighter areas are seen in the calendered sample. Specular reflection is enhanced with parallel polars. (sample 10, unprinted)

50
When polars are aligned at 90º to each other, specular reflection is not seen in the image and
light scattering is dominant. Crossed polars usually show thinner parts of a paper coating in
darker shade (Figure 27). In the case of the printed samples, halftone screening and printed
surface interfered in the analysis of the coating and light scattering measurements were
performed only for non-printed samples.
Figure 27. Parallel polar (left) and crossed polar (right) images acquired from the same spot (5X). The fibre network is better seen in the crossed polar image. (sample 10, unprinted)
3.5.3 Bulk mapping of paper coatings
Bulk mapping of paper coating was performed with the Hololab Raman instrument using a
dry 10X objective. Figure 28 presents Raman maps and a standard light microscopy image of
sample 10. The area of the mapping measurement was 390 µm x 390 µm and the step size
between the successive measurement points was 10 µm. The total number of Raman
measurements was 1521. The sample was printed in a sheet-fed offset press with 40% ink
coverage. Simultaneous mapping and imaging provides a way to determine the chemical
composition and check the results visually. Several cellulose fibres are evident in the
microscope image (Figure 28 a), and are better observed in the Raman intensity map of
cellulose (Figure 28 e). Wide variation in intensity is seen in the Raman intensity maps of
CaCO3 and SB-latex (Figure 28 c & d). Some weak shadowing due to ink can be seen in both
maps. However, as the shadowing is the same for latex and CaCO3, it does not have any effect
on the SB-latex:CaCO3 ratio, which was of primary interest in this mapping experiment.
Cellulose fibres are more visible in the areas of low intensity of coating components. Hence,
these variations together indicate variation in coating thickness. Since calendering reduces
porosity and opacity (Suontausta 2002), the coating component intensities may have been
somewhat lowered by the reduced light scattering. Ink densities (Figure 28 b) are lower in

51
areas where cellulose fibres are closer to the surface and the coat weight is lower. The
measurement scale was too small to detect visible print mottle. The SB-latex distribution
displayed in Figure 28 f indicates lower SB-latex content in the low coat weight areas. The
base paper may have filtered out the bigger CaCO3 pigment particles while allowing part of
the smaller latex particles to permeate into the base paper.
Figure 28. A standard light microscopy image (a) and Raman maps (b-f) from the same area of a printed sample. The area of mapping was 390 µm x 390 µm. (Paper IV)
Larger areas can be measured within the same analysis time by increasing the step size
between the Raman measurements. Increased step size leads to decrease in the spatial
resolution. A larger area map was measured for sample A of sample set 7 by increasing the
step size to 50 µm. The total analysed area was 1.75 mm x 2.25 mm. As is evident from
Ram
an inte
nsity
500
1000
1500
2000
10 20 30
5
10
15
20
25
30
35
Ram
an inte
nsity
500
1000
1500
2000
10 20 30
5
10
15
20
25
30
35
Ram
an inte
nsity
500
1000
1500
2000
10 20 30
5
10
15
20
25
30
35
0
0.05
0.1
0.15
0.2
0.25
10 20 30
5
10
15
20
25
30
35
SB
-late
x:C
aC
O3
inte
nsity r
atio
0
0.05
0.1
0.15
0.2
0.25
10 20 30
5
10
15
20
25
30
35
SB
-late
x:C
aC
O3
inte
nsity r
atio
1000
1500
2000
2500
3000
3500
10 20 30
5
10
15
20
25
30
35
Ram
an inte
nsity
1000
1500
2000
2500
3000
3500
10 20 30
5
10
15
20
25
30
35
Ram
an inte
nsity
1000
1500
2000
2500
3000
3500
10 20 30
5
10
15
20
25
30
35
Ram
an inte
nsity
100
200
300
400
500
600
700
10 20 30
5
10
15
20
25
30
35
Ram
an inte
nsity
100
200
300
400
500
600
700
10 20 30
5
10
15
20
25
30
35
Ram
an inte
nsity
0
100
200
300
400
500
600
10 20 30
5
10
15
20
25
30
35
Ram
an inte
nsity
0
100
200
300
400
500
600
10 20 30
5
10
15
20
25
30
35
Ram
an inte
nsity
0
100
200
300
400
500
600
10 20 30
5
10
15
20
25
30
35
Ram
an inte
nsity
100 µm
a) light microscopy image b) magenta pigment
c) SB-latex d) CaCO3
e) cellulose f) SB-latex:CaCO3 ratio
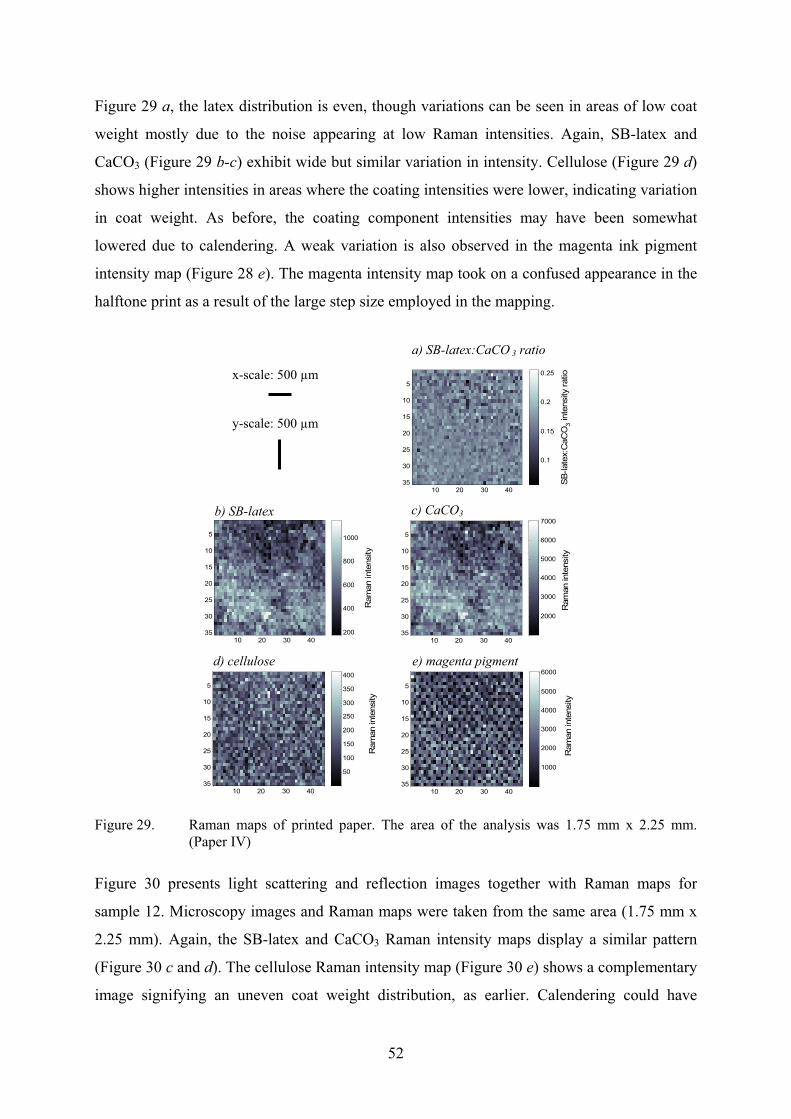
52
Figure 29 a, the latex distribution is even, though variations can be seen in areas of low coat
weight mostly due to the noise appearing at low Raman intensities. Again, SB-latex and
CaCO3 (Figure 29 b-c) exhibit wide but similar variation in intensity. Cellulose (Figure 29 d)
shows higher intensities in areas where the coating intensities were lower, indicating variation
in coat weight. As before, the coating component intensities may have been somewhat
lowered due to calendering. A weak variation is also observed in the magenta ink pigment
intensity map (Figure 28 e). The magenta intensity map took on a confused appearance in the
halftone print as a result of the large step size employed in the mapping.
Figure 29. Raman maps of printed paper. The area of the analysis was 1.75 mm x 2.25 mm. (Paper IV)
Figure 30 presents light scattering and reflection images together with Raman maps for
sample 12. Microscopy images and Raman maps were taken from the same area (1.75 mm x
2.25 mm). Again, the SB-latex and CaCO3 Raman intensity maps display a similar pattern
(Figure 30 c and d). The cellulose Raman intensity map (Figure 30 e) shows a complementary
image signifying an uneven coat weight distribution, as earlier. Calendering could have
10 20 30 40
5
10
15
20
25
30
35 200
400
600
800
1000
Ram
an inte
nsity
10 20 30 40
5
10
15
20
25
30
35 200
400
600
800
1000
Ram
an inte
nsity
10 20 30 40
5
10
15
20
25
30
35
2000
3000
4000
5000
6000
7000
Ram
an inte
nsity
10 20 30 40
5
10
15
20
25
30
35
2000
3000
4000
5000
6000
7000
Ram
an inte
nsity
10 20 30 40
5
10
15
20
25
30
35
50
100
150
200
250
300
350
400
Ram
an inte
nsity
10 20 30 40
5
10
15
20
25
30
35
50
100
150
200
250
300
350
400
Ram
an inte
nsity
10 20 30 40
5
10
15
20
25
30
35
0.1
0.15
0.2
0.25
SB
-late
x:C
aC
O3
inte
nsity r
atio
10 20 30 40
5
10
15
20
25
30
35
0.1
0.15
0.2
0.25
SB
-late
x:C
aC
O3
inte
nsity r
atio
10 20 30 40
5
10
15
20
25
30
35
1000
2000
3000
4000
5000
6000
Ram
an inte
nsity
10 20 30 40
5
10
15
20
25
30
35
1000
2000
3000
4000
5000
6000
Ram
an inte
nsity
a) SB-latex:CaCO 3 ratio
b) SB-latex c) CaCO3
d) cellulose e) magenta pigment
x-scale: 500 µm
y-scale: 500 µm
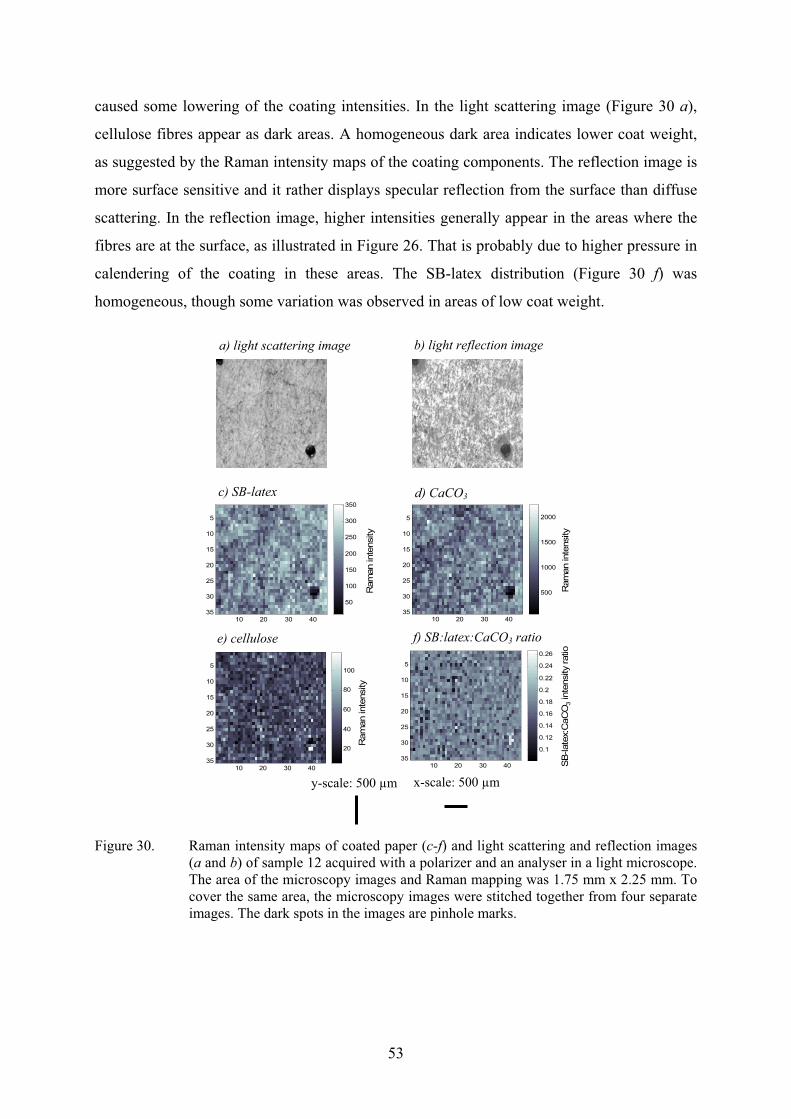
53
caused some lowering of the coating intensities. In the light scattering image (Figure 30 a),
cellulose fibres appear as dark areas. A homogeneous dark area indicates lower coat weight,
as suggested by the Raman intensity maps of the coating components. The reflection image is
more surface sensitive and it rather displays specular reflection from the surface than diffuse
scattering. In the reflection image, higher intensities generally appear in the areas where the
fibres are at the surface, as illustrated in Figure 26. That is probably due to higher pressure in
calendering of the coating in these areas. The SB-latex distribution (Figure 30 f) was
homogeneous, though some variation was observed in areas of low coat weight.
Figure 30. Raman intensity maps of coated paper (c-f) and light scattering and reflection images (a and b) of sample 12 acquired with a polarizer and an analyser in a light microscope. The area of the microscopy images and Raman mapping was 1.75 mm x 2.25 mm. To cover the same area, the microscopy images were stitched together from four separate images. The dark spots in the images are pinhole marks.
10 20 30 40
5
10
15
20
25
30
35
500
1000
1500
2000
Ram
an inte
nsity
10 20 30 40
5
10
15
20
25
30
35
500
1000
1500
2000
Ram
an inte
nsity
10 20 30 40
5
10
15
20
25
30
35
50
100
150
200
250
300
350
Ram
an inte
nsity
10 20 30 40
5
10
15
20
25
30
35
50
100
150
200
250
300
350
Ram
an inte
nsity
10 20 30 40
5
10
15
20
25
30
35
20
40
60
80
100
Ram
an inte
nsity
10 20 30 40
5
10
15
20
25
30
35
20
40
60
80
100
Ram
an inte
nsity
10 20 30 40
5
10
15
20
25
30
35
0.1
0.12
0.14
0.16
0.18
0.2
0.22
0.24
0.26
SB
-late
x:C
aC
O3
inte
nsity ratio
10 20 30 40
5
10
15
20
25
30
35
0.1
0.12
0.14
0.16
0.18
0.2
0.22
0.24
0.26
SB
-late
x:C
aC
O3
inte
nsity ratio
x-scale: 500 µm y-scale: 500 µm
a) light scattering image b) light reflection image
d) CaCO3c) SB-latex
e) cellulose f) SB:latex:CaCO3 ratio

54
3.6 Limitations of Raman microscopy in paper coating analysis
One of the greatest limitations of Raman spectroscopy is that molecules with only weakly
polarizable bonds produce an inherently weak Raman spectrum. Thus, coating components
such as polyvinyl acetate (PVAc) latices and starches are difficult to detect in paper coatings
in their normal concentrations. PVAc could not be detected when the content was 12 pph,
even when the acquisition time was increased to several minutes. Typical coatings of light
weight coated (LWC) paper contain only 4-8 pph of starch (Bruun 2000) and starch may be
even more difficult to detect. This work focused on SB-latex, which is easily detected in
paper coatings. In some cases, particularly with certain kaolin grades and inks, fluorescence
may limit the detection of signals or prevent Raman analysis. In immersion depth profiling,
polydimethylsiloxane oil quenched the fluorescence and it was a less of a problem in
immersion measurements than in dry measurements. Typically, coatings containing 80 pph
kaolin and even coatings with 100 pph of kaolin were measured with dry optics.
Limited depth resolution may reduce the accuracy of the analysis, especially in the analysis of
an ink layer or the analysis of the first micrometre. Microtome cross-sectioning with lateral
scanning over the cross-section provides better depth resolution. Use of lateral resolution,
which is roughly half of the depth resolution, improves the accuracy. However, the
preparation of cross-sections is time consuming. The small size of the measurement area is a
limiting factor in the analysis of heterogeneous paper coatings. The small spot size means that
quantitative analysis by depth profiling method is time consuming, which is one reason why
more attention was paid later to the lateral mapping of coatings.

55
4 Conclusions
Confocal Raman microscopy has been shown to be a beneficial tool in paper coating analysis.
Sample preparation is minimal and the data analysis was established during the work. Raman
measurements were performed in two modes: depth profiling and lateral mapping.
Raman detects the following chemicals typically applied in paper coating: CaCO3 (aragonite /
calcite), kaolin (fluorescence may interfere), TiO2 (anastase / rutile), gypsum, talc and SB-
latex or other styrene-based lattices (see Raman spectra in the Appendix). In addition,
magenta, yellow and cyan offset printing inks can usually be measured. In depth profiling,
cyan printed areas absorb the laser light (785 nm) and limit the depth sampled.
Calibration was observed to depend on the pigment type as well as on the pigment mixture
applied in the coating. Moreover, the SB-latex:CaCO3 band height ratio changed with the Tg
value of the SB-latex, as expected. It is always better, to produce a set of calibration samples
containing the same chemicals as in the coating. If the coating recipes are similar a semi-
quantitative comparison of SB-latex contents is possible without calibration. As an example,
if the applied SB-latex content was 10 pph, 10% change in the SB-latex:CaCO3 band height
ratio would correspond to a change of 0.1 pph. This kind of internal comparison may be
beneficial in quality control or in monitoring the effect of changed process conditions when
the coating recipe is kept similar.
One of the major achievements in this work was the development of an immersion technique
for confocal Raman depth profiling and its application to coated papers. At the time of
development, the immersion technique was not applied in the field of confocal Raman
microscopy. Moreover, depth profiling is more challenging for strongly light scattering paper
coatings than the transparent polymer films more usually investigated by Raman microscopy.
The benefits of the immersion technique for depth profiling are considerable. The immersion
technique provides better depth resolution, and focusing depth is the same as the
measurement depth. Moreover, owing to light scattering, depth profiling of paper coatings
would be impossible without wetting the sample.

56
Depth profiling can be applied to investigations of SB-latex migration. Measurement can be
done under printing defects and the results can be correlated with coat weight variation, since
thickness information is always present in depth profiling data. Thicknesses seem to be
somewhat overestimated in the ink layer analysis, but relative differences can be assigned and
compared. The differences observed in calcite and aragonite Raman spectra allowed separate
thickness profile analysis of the precoating and top coating.
No sample preparation is needed in lateral mapping. Lateral mapping provides access to
various probe depths, giving information about the coating surface or the bulk coating.
Lateral mapping enables measurements of larger areas in a shorter time than depth profiling.
Surface mapping of SB-latex and SB-latex variation in different scales is useful for coating
surface analysis, since ink–coating interaction takes place at the surface. In the surface
analysis, measurement of relatively large areas was achieved and a method for latex content
and its variation in different scales was developed. In principle, bulk and surface mapping can
be performed from the same area successively and the information from different depths can
be compared.
Lateral mapping of the bulk coating gives information on the SB-latex content, and the
information can be combined with coat weight and print density variation. Through lateral
mapping, therefore, it is possible to correlate printing defects with the distribution of coating
chemicals and the coat weight distribution. Moreover, with Raman microscopy all the light
microscopy accessories can be employed and the information obtained can be combined
without taking the sample out of the sample stage.
Results presented in this doctoral thesis provide evidence that confocal Raman microscopy is
a powerful tool for characterization of the chemical and physical composition of printed and
coated papers. The technique provides quantitative information on SB-latex in the x-y-z
direction and it can usefully be applied in SB-latex migration analysis, as was the aim of this
method development.

57
5 Literature
Agarwal, U.P. and Atalla, R.H., Raman spectroscopy, in T.E. Conners and S. Banerjee, ed.,
Surface analysis of paper, CRC, 1995, p. 152
Allem, R., Characterization of paper coatings by scanning electron microscopy and image
analysis, Journal of Pulp and Paper Science, 24(10), 1998, p. 329
Arai, T., Yamasaki, T., Suzuki, K., Ogura, T. and Sakai, Y., The relationship between print
mottle and coating structure, Tappi Journal, 71(5), 1988, p. 47
Aspnes, D.E. and Studna, A.A., Dielectric functions and optical parameters so Si, Ge, GaP,
GaAs, GaSb, InP, InAs from 1.5 to 6.0 eV, Physical Review B, 27(2), 1983, p. 985
Baia, L., Gigant, K., Posset, U., Petry, R., Schottner, G., Kiefer, W. and Popp, J., Confocal
Raman investigations on hybrid polymer coatings, Vibrational Spectroscopy, 29(1-2), 2002,
p. 245
Baldwin, K.J. and Batchelder, D.N., Confocal Raman microspectroscopy through a planar
interface, Applied Spectroscopy, 55(5), 2001, p. 517
Bauer, C., Amram, B., Agnely, M., Charmot, D., Sawatzki, J., Dupuy, N. and Huvenne, J-P.,
On-line monitoring of a latex emulsion polymerization by fiber-optic FT-Raman
Spectroscopy. Part I: Calibration, Applied Spectroscopy, 54(4), 2000, p. 528
Belaroui, F., Grohens, Y., Boyer, H. and Holl, Y., Depth profiling of small molecules in dry
latex films by confocal Raman spectroscopy, Polymer, 41(21), 2000, p. 7641
Bitla, S., Tripp, C. and Bousfield, D.W., A Raman spectroscopic study of migration in paper
coatings, Journal of Pulp and Paper Science, 29(11), 2003 p. 382
Bougeard, D., Crystals, in B. Schrader, ed., Infrared and Raman spectroscopy, VCH, 1995, p.
314
58
Bruun, S-E., Starch, in E. Lehtinen, ed., Fapet, 2000, p. 241
Chinga, G., Structural studies on LWC paper coating layers using SEM and image analysis
techniques, Academic Dissertation for the Degree of Doctor of Science in Technology,
Norwegian University of Science and Technology, Norway, 2002, 108 p.
Clarke, F.C., Jamieson, M.J., Clark, D.A., Hammond, S.V., Jee, R.D. and Moffat, A.C.,
Chemical image fusion. The synergy of FT-NIR and Raman mapping microscopy to enable a
more complete visualization of pharmaceutical formulations, Analytical Chemistry, 73(10),
2001, p. 2213
Donigian, D.W. and Vyörykkä, J., Maximizing the ratio of brightness gain to contrast mottle
– Part 1, Theory and general recommendations, TAPPI Coating Conference and Trade Fair,
Baltimore, MD, United States, May 17-18 2004, in press
Engström, G. and Lafaye, J.F., Precalendering and its effect on paper coating interaction,
Tappi Journal, 75(8), 1992, p. 117
Engström, G. and Rigdahl, M., Effect of printability and print quality, in M.J. Whalen-Shaw,
ed., Binder migration in paper and paperboard coatings, Tappi Press, Atlanta, GA, USA,
1993, p. 61
Engström, G., Formation and consolidation of coating layer and the effect on offset-print
mottle, Tappi Journal, 77(4), 1994, p. 160
Everall, N., Modeling and measuring the effect of refraction on the depth resolution of
confocal Raman microscopy, Applied Spectroscopy, 54(6), 2000, p. 773
Everall, N., Confocal Raman microscopy: Why the depth resolution and spatial accuracy can
be much worse than you think, Applied Spectroscopy, 54(10), 2000, p. 1515

59
Forsström, U., Interactions between base paper and coating color in metered size press
coating, Academic Dissertation for the Degree of Doctor of Science in Technology, Helsinki
University of Technology, Finland, 2003, 99 p.
Fujiwara, H. and Kline, J.E., Ultraviolet absorption of styrene-butadiene latex on pigment
coated paper, Tappi Journal, 70(12), 1987, p. 97
Gagnon, R.E., Parish, T.D. and Bousfield, D.W., A mechanism to explain particle size
segregation and binder depletion during coating, Tappi Journal, 84(5), 2001, p. 66
Gane, P.A.C, Mottle and the influence of coating and binder migration, Paper technology,
30(4), 1989, p. 34
Gonzalez, R.C. and Wintz, P., Digital Image Processing, 2nd edition, Addison-Wesley
Publishing Company, 1987, 503 p.
Govil, A., Pallister, D.M. and Morris, M.D., Three-dimensional digital confocal Raman
microscopy, Applied Spectroscopy, 47(1), 1993, p. 75
Griffiths, P.R. and de Haseth, J.A., Fourier transform spectrometry, John Wiley & Sons,
1986, p. 14
Groves, R., Matthews, G.P., Heap, J., McInnes, M.D., Penson, J.E. and Ridgway, C.J., Binder
migration in paper coatings – a new perspective, 12th Fundamental Research Symposium,
proceedings, Oxford, 2003, p. 1149
Guyot, C., Amram, B. and Ubrich, J.M., Raman-microscopic study of mottling of coated
paper, Wochenblatt fuer Papierfabrikation, 123 (14/15), 1995, p. 646
Hajadoost, S. and Yarwood, J., Depth profiling of poly(methyl methacrylate), poly(vinyl
alcohol) laminates by confocal Raman microspectroscopy, Applied Spectroscopy, 50(5),
1996, p. 558

60
Hajadoost, S., Olsthoorn, M. and Yarwood, J., Depth profiling study of effect of annealing
temperature on polymer/polymer interfaces in laminates using confocal Raman
microspectroscopy, Applied Spectroscopy, 51(12), 1997, p. 1784
Halttunen, M., Vyörykkä, J., Hortling, B., Tamminen, T., Batchelder, D., Zimmermann, A.
and Vuorinen, T., Study of residual lignin in pulp by UV resonance Raman spectroscopy,
Holzforschung, 55(6), 2001, p. 631
Halttunen, M., Löija M., Vuorinen, T., Stenius, P., Tenhunen, J. and Kenttä, E.,
Determination of SB-latex distribution at paper coating surfaces with FTIR/ATR
spectroscopy, TAPPI Coating Conference and Trade Fair, San Diego, CA, United States, May
6-9 2001, p. 174
Hayward, I.P., Baldwin, K.J., Hunter, D.M., Batchelder, D.N. and Pitt, G., Direct imaging and
confocal mapping of diamond films using luminescence and Raman scattering, Diamond and
Related Materials, 4(5-6), 1995, p. 617
He, P., Bitla, S., Bousfield, D. and Tripp, C., Raman spectroscopic analysis of paper coatings,
Applied Spectroscopy, 56(9), 2002, p. 1115
Hedman, A., Grön, J. and Rigdahl, M., Coating layer uniformity as affected by base paper
characteristics and coating method, Nordic Pulp and Paper Research Journal, 18(3), 2003, p.
333
Hendra, P.J., Fourier Transform Raman Spectroscopy, in J.J. Laserna, ed., Modern techniques
in Raman spectroscopy, John Wiley & Sons, 1996, p 73.
Hird, K.F., Offset lithographic technology, the Goodheart-Willcox Company, 1995, 720 p.
Häkkänen, H.J., Development of a method based on laser-induced plasma spectrometry for
rapid spatial analysis of material distribution in paper coatings, Academic Dissertation for the
Degree of Doctor of Philosophy, University of Jyväskylä, 1998, 60 p.
61
Häkkänen, H.J. and Korppi-Tommola, J.E.I., Analysis of coating structure by laser-induced
plasma spectrometry. TAPPI Advanced Coating Fundamentals Symposium, Proceedings,
Toronto, Apr. 29-May 1, 1999, p. 191
Kent, H.J., Climpson, N.A., Coggon, L., Hooper, J.J. and Gane, P.A.C., Novel techniques for
quantitative characterization of coating structure, Tappi Journal, 69(5), 1986, p. 78
Kenttä, E., Juvonen, K., Halttunen, M. and Vyörykkä, J., Spectroscopic methods for
determination of latex content of coating layers, Nordic Pulp and Paper Research Journal,
15(5), 2000, p. 579
Kim, L.H., Pollock., M.J., Wittbrodt, E.L., Roper III, J.E., Smith, D.A., Stolarz, J.W., Rolf,
M.J., Green, T.J. and Langolf, B.J., Reduction of back-trap mottle through optimization of the
drying process for paper coatings, part I, Tappi Journal, 81(8), 1998, p. 153
Kishida, T., Kouichirou, A., Fukui, T. and Kanou, S., Influence of coating pore structure and
ink set property on ink dryback in sheet-fed offset printing, TAPPI Coating Conference and
Trade Fair, San Diego, CA, United States, May 6-9 2001, p. 183
Kugge, C., Consolidation and structure of paper coating and fibre systems, Academic
Dissertation for the Degree of Doctor of Philosophy, KTH, Stockholm, 2003, 74 p.
Lee, D.I. and Whalen-Shaw, M.J., Fundamentals and strategies, in M.J. Whalen-Shaw, ed.,
Binder migration in paper and paperboard coatings, Tappi Press, Atlanta, GA, USA, 1993, p.
19
Lee, D.I., Latex, in E. Lehtinen, ed., Fapet, 2000, p. 197
Lehtinen, E., Introduction to pigment coating of paper, in E. Lehtinen, ed., Fapet, 2000, p. 14
Lepoutre, P., The structure of paper coatings: An update, Tappi press, Atlanta, 1989, 56 p.

62
Lin-Vien, D., Colthup, N.B., Fateley, W.G. and Grasselli, J.G., The handbook of Infrared and
Raman characteristic frequencies of organic molecules, Academic press, 1991, 503 p.
Louden, J.D., Raman microscopy, in D.J. Gardiner and P.R. Graves, ed., Practical Raman
spectroscopy, Springer-Verlag, 1989, p. 119-151
Markwort, L. and Kip, B., Micro-Raman imaging of heterogeneous polymer systems: General
applications and limitations, Journal of Applied Polymer Science, 61, 1996, p. 231
Niemelä, P., Hietala, E., Ollanketo, J., Tornberg, J., Pirttinen, E. and Stenius, P., FT-Raman
spectroscopy as a tool for analyzing the composition of recycled paper pulp, Progress in Paper
Recycling, 8(4), 1999, p. 15
Oittinen, P. and Saarelma H., Printing, Fapet, 1998, p. 133
Pelletier, M.J., Quantitative analysis using Raman spectrometry, Applied Spectroscopy,
57(1), 2003, p. 20A
Quackenbush, D., Case studies on the use of the optical microscope in the analysis of coated
papers, Tappi Journal, 71(5), 1988, p. 70
Rautiainen, P. and Lehtinen, E., Multiple coating of paper, in E. Lehtinen, ed., Fapet, 2000, p.
567
Ranger, A.E., Binder migration during drying of pigment coatings, Paper Technology, 35(10),
1994, p. 40
Reinecke, H., Spells, S., Sacristan, J., Yarwood, J. and Mijangos, C., Confocal Raman depth
profiling of surface-modified polymer films: Effects of sample refractive index, Applied
Spectroscopy, 55(12), 2001, p. 1660
63
Rousu, S., Differential absorption of offset ink constituents on coated paper, Academic
Dissertation for the Degree of Doctor of Science in Technology, Åbo Akademi University,
Finland, 2002, 102 p.
Sacristan, J., Mijangos, C., Reinecke, H., Spells, S. and Yarwood, J., Depth profiling of
modified PVS surfaces using confocal Raman microspectroscopy, Macromolecular Rapid
Communications. 21, 2000, p. 894
Schrader, B., General survey of vibrational spectroscopy, in B. Schrader, ed., Infrared and
Raman spectroscopy, VCH, 1995, p. 7
Schrader, B., Tools for infrared and Raman spectroscopy, in B. Schrader, ed., Infrared and
Raman spectroscopy, VCH, 1995, p. 63
Schrof, W. and Häußling, L., Depth resolution of drying processes in UV-curable coatings,
Farbe & Lack, 103(7), 1997, p. 22
Sijtsema, N.M., Wouters, S.D., De Grauw, C.J, Otto, C. and Greve, J., Confocal direct
imaging Raman microscope: Design and applications in biology, Applied Spectroscopy,
52(3), 1998, p. 348
Spiekermann, M., Quantitative analysis, automatic quality control, in B. Schrader ed.,
Infrared and Raman spectroscopy, VCH, 1995, p. 411
Stepanek, P., Static and dynamic properties of multiple light scattering, Journal of Chemical
Physics, 99(9), 1993, p. 6384
Ström, G., Gustafsson, J. and Sjölin, K., Printing papers separation of ink constituents during
ink setting on coated surfaces, TAPPI Coating Conference and Trade Fair, San Diego, CA,
United States, May 4-5, 2001, p. 269

64
Sundqvist, H., Structure and CSWO printing press runnability of a matt LWC paper grade –
Raman spectroscopic approach, M.Sc. Thesis, Helsinki University of Technology, Finland,
2003, 110 p.
Suontausta, O., Coating and calendering – means of improving surface of coated paper for
printing, Academic Dissertation for the Degree of Doctor of Science in Technology, Helsinki
University of Technology, Finland, 2002, 177 p.
Tabaksblat, R., Meier, R.J. and Kip, B.J., Confocal Raman microspetroscopy: Theory and
application to thin polymer samples, Applied Spectroscopy, 46(1), 1992, p. 60
Turrell, G. and Dhamelincourt, P., Micro-Raman spectroscopy, in J.J. Laserna ed., Modern
techniques in Raman spectroscopy, John Wiley & Sons, 1996, p. 109
Van Gilder, R.L., An investigation of latex particle clustering in the wet coating color, Tappi
Journal, 3(1), 2004, p. 7
Vikman, K. and Sipi, K., Applicability of FTIR and Raman spectroscopic methods to the
study of paper-ink interactions in digital prints. Journal of Imaging Science Technology,
47(2), 2003, p. 13
Vyörykkä, J., Halttunen, M., Tenhunen, J. and Iitti, H., Analysing a sample in Raman
spectroscopy, FI patent application 19992439, Nov. 12, 1999
Vyörykkä J., Confocal Raman depth profiling in the depth profiling of paper coating colours,
M.Sc. Thesis, University of Oulu, Finland, 1999, 69 p.
Vyörykkä, J., Iitti, H., Vuorinen, T. and Stenius, P., Raman microspectroscopy in the lateral
mapping of paper coating composition, TAPPI Coating and Graphic Arts conference and
Trade Fair, Orlando, USA, 2002, p. 265
Wallström, E., Analytical measurement of the penetration of ink in to paper, SFL
konferenssen, 13-15 May, 1991, p. 8:1

65
Williams, K.P.J., Pitt, G.D., Batchelder, D.N. and Kip, B.J, Confocal Raman
microspectroscopy using a stigmatic spectrograph and CCD detector, Applied Spectroscopy,
48(3), 1994, p. 232
Wilson, T., Optical aspects of Confocal Microscopy, in T. Wilson, ed., Confocal microscopy,
Academic press, p. 93
Wilson, T., Confocal Microscopy, in T. Wilson, ed., Confocal microscopy, Academic press,
p. 1
Xiang, Y., Bousfield, D.W., Hassler, J., Coleman, P. and Osgood A., Measurement of local
variation of ink tack dynamics, Journal of Pulp and Paper Science, 25(9), 1999, p. 326
Xiang, Y., Bousfield, D.W., Coleman, P. and Osgood, A., The cause of backtrap mottle:
Chemical or physical? TAPPI Coating Conference and Trade Fair, Washington, DC, United
States, May 1-4, 2000, p. 45
Xiang, Y. and Bousfield, D.W., Effect of coat weight and drying condition on coating
structure and ink setting, Tappi Advanced Coating Fundamentals Symposium, San Diego,
CA, United States, May 4-5, 2001, p. 35
Yamazaki, K., Nishioka, T., Hattori, Y. and Fujita, K., Print mottle effect of binder migration
and latex film formation during coating consolidation, Tappi Journal, 76(5), 1993, p.79
Zang, Y.-H. and Aspler, J.S., The effect of surface binder content on print density and ink
receptivity of coated paper, Journal of Pulp and Paper Science, 24(5), 1998, p. 141
Zimmerman, P.A., Hercules, D.M., Rulle, H., Zehnpfenning, J. and Benninghoven, A., Direct
analysis of coated and contaminated paper using time-of-flight secondary ion mass
spectrometry, Tappi Journal, 78(2), 1995, p. 180

66
6 Appendix
This appendix contains the Raman spectra of several common coating chemicals and
polydimethylsiloxane. The detection capability for different chemicals depends on the
concentration and the overall coating composition. In general, molecules having weakly
polarizable bonds (e.g. starch) are difficult or even impossible to detect in coatings where
other compounds give much stronger signals.
2234
1664 1601
1580
1443 1
193
1029
997.9
618.9
0
2000
4000
6000
8000
3000 2500 2000 1500 1000 500 0
Arbitrary / Raman Shift (cm-1)
Figure 31. Raman spectrum of SB-latex (Dow, DLL 966). The peak height of the strongest band at 998 cm-1 emerging from the styrene unit was employed in the data analysis. The band at 1664 cm-1can be assigned to butadiene units.

67
1084
998.6
710
618.7
1082
998.9
704
700
619
204
-5000
0
5000
10000
15000
20000
3000 2500 2000 1500 1000 500 0 Arbitrary / Raman Shift (cm-1)
Figure 32. Raman spectrum of typical CaCO3 coatings. The lower spectrum is for calcite-type GCC (279 cm-1) and the upper spectrum for aragonite-type PCC (204 cm-1). Both Raman spectra show SB-latex bands (998 cm-1).
472.5
461.7
426.7
361
335.1
268.9
0
500
1000
1500
3000 2500 2000 1500 1000 500 0
Arbitrary / Raman Shift (cm-1)
Figure 33. Raman spectrum of kaolin (Imerys, Supramatt).
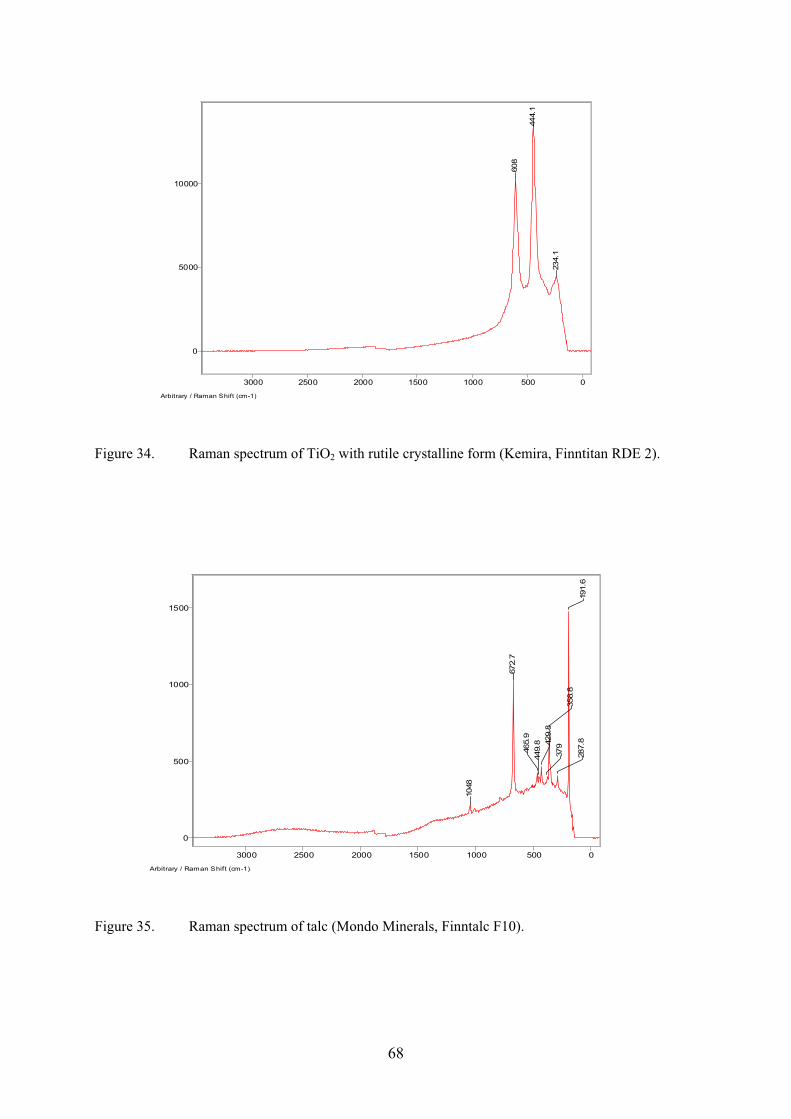
68
608
444.1
234.1
0
5000
10000
3000 2500 2000 1500 1000 500 0
Arbitrary / Raman Shift (cm-1)
Figure 34. Raman spectrum of TiO2 with rutile crystalline form (Kemira, Finntitan RDE 2). 1048
672.7
465.9
449.8 4
29.8
379
358.8
287.8
191.6
0
500
1000
1500
3000 2500 2000 1500 1000 500 0
Arbitrary / Raman Shift (cm-1)
Figure 35. Raman spectrum of talc (Mondo Minerals, Finntalc F10).

69
1457
1334
1260
1123 1080 9
38.1
862
575.6
475.1
438
405.9 357.6
0
1000
2000
3000
3000 2500 2000 1500 1000 500 0
Arbitrary / Raman Shift (cm-1)
Figure 36. Raman spectrum of starch (Merck, analysis grade).
1600
1489
1478
1390
1326
1258
1231
1191
1146
1125
1069
1021
973.6
854.5
818.7
719.6
609.2
562.6
476.8 448.5
354.6
312.9
229
0
10000
20000
30000
40000
50000
60000
70000
3000 2500 2000 1500 1000 500 0
Arbitrary / Raman Shift (cm-1)
Figure 37. Raman spectrum of optical brightener (Bayer, Blankophor PM).

70
29
63
29
04
14
08
12
61
85
7.8
78
5.4
70
6.5
68
5 61
3.2
48
6.6
19
1.5
15
9.4
0
2000
4000
6000
8000
10000
3000 2500 2000 1500 1000 500 0
Arbitrary / Raman Shift (cm-1)
Figure 38. Raman spectrum of polydimethylsiloxane.

HELSINKI UNIVERSITY OF TECHNOLOGY LABORATORY OF FOREST PRODUCTS CHEMISTRY
REPORTS, SERIES A
1. Laine, J.,
Surface properties of unbleached kraft pulp fibres, determined by different methods. 142 p. 1994.
2. Merta, J.,
Interactions between Cationic Starch and Anionic Surfactants. 148 p. 1995.
3. Heimonen, J.,
The effect of coating components and fillers in the flotation deinking of paper. 148 p. 1995.
4. Mitikka-Eklund, M.,
Sorption of xylans on cellulose fibres. 84 p. 1996.
5. Laurila, M.,
The adsorption of nonionic surfactants and polyacrylate on talc. 104 p. 1996.
6. Kekkonen, J.,
Adhesional properties of polyamide 6 fibers used in press felts. 167 p. 1996.
7. Laine, J.,
The effect of cooking and bleaching on the surface chemistry and charge properties of kraft pulp fibres. 199 p. 1996.
8. Vikkula, A.,
Hemicelluloses in kraft cooking liquor. 81 p. 1999.
9. Pirttinen, E., The effect of deinking chemicals in flotation deinking of paper. 50 p. 1999.
10. Vyörykkä, J.,
Konfokaali-raman-spektrometrin käyttö paperin päällysteen syvyyssuuntaiseen analysointiin. 83 p. 1999.
11. Saarinen, T.,
The surface properties of gels formed by cationic starch and surfactants. 109 p. 2000.
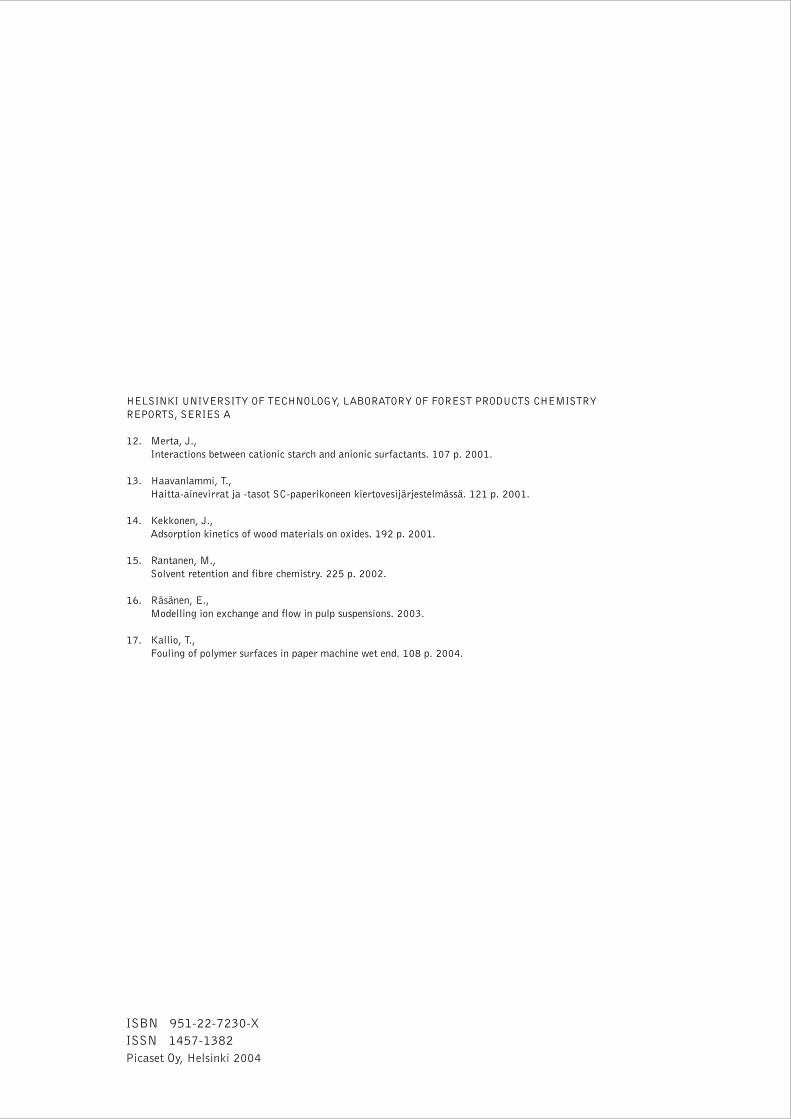
ISBN 951-22-7230-X
ISSN 1457-1382
Picaset Oy, Helsinki 2004
HELSINKI UNIVERSITY OF TECHNOLOGY, LABORATORY OF FOREST PRODUCTS CHEMISTRY
REPORTS, SERIES A
12. Merta, J.,
Interactions between cationic starch and anionic surfactants. 107 p. 2001.
13. Haavanlammi, T.,
Haitta-ainevirrat ja -tasot SC-paperikoneen kiertovesijärjestelmässä. 121 p. 2001.
14. Kekkonen, J.,
Adsorption kinetics of wood materials on oxides. 192 p. 2001.
15. Rantanen, M.,
Solvent retention and fibre chemistry. 225 p. 2002.
16. Räsänen, E.,
Modelling ion exchange and flow in pulp suspensions. 2003.
17. Kallio, T.,
Fouling of polymer surfaces in paper machine wet end. 108 p. 2004.
Top Related