


Languages
Pages
Legal


This document describes the necessary steps to have NetVoyant polling a BlueCoat ProxySG, collecting data
and provide reporting. The Goal is to get Memory Utilization into NetQoS NetVoyant. I did use SGOS
5.5.3.1, NetQoS NetVoyant 7.1.21 & NetQoS Performance Center 6.1.158
Configure BlueCoat Proxy to enable SNMP Access
Under MAINTENANCE -> SNMP you can enable different or all Versions and redefine Communities.
There is one disabled SNMP listener defined by default on the BlueCoat ProxySG, which you can delete or
enable, as needed. You can even secure, what IP Addresses are allowed to contact the device
You can also add additional SNMP services and listeners. Although you can configure traps and informs to go
out if all the SNMP listeners are deleted or disabled, configuring SNMP listeners sets up the UDP ports the
ProxySG uses to listen for SNMP commands. The service ports set up for listening to SNMP requests are independent of the trap or inform addresses and ports specified for sending traps.
You need to enable SNMP under SERVICES -> MANGEMENT SERVICES. After enabling SNMP, NetVoyant is
able to contact this BlueCoat Proxy via SNMP
BlueCoat ProxySG CPU Utilization into NetQoS NetVoyant
created by: Rainer Bemsel – Version 1.0 – Dated: Jan/02/2011

BlueCoat ProxySG CPU Utilization into NetQoS NetVoyant page 2 of 13
For NetVoyant to poll and transform data from a MIB that is currently not configured, three main steps
must be performed:
• The MIB must be compiled – this gives NetVoyant the definition of the MIB, where to find particular
pieces of data, what data-type the data uses, and so on.
• At least on Dataset must be created – the Datasets actually tell NetVoyant what to poll, how to
mathematically or logically transform the data, and also contains other configuration information
about the polling of the MIB
• At least one View must be created – The Views are the graphs and tables that display the data in the
web GUI. Without the Views, NetVoyant will collect the data but have no way of displaying it.
Compiling the MIB
I have downloaded the complete set of MIBs for the current version; I’m running on my private ProxySG.
Private MIBs can usually be obtained from the manufacturer, in this case directly from BlueCoat.
I do have a couple of private MIBs and I need to figure out what MIB to be used and where dependencies
are related

BlueCoat ProxySG CPU Utilization into NetQoS NetVoyant page 3 of 13
In order to know if the MIB contains the objects desired, it must be inspected. The BLUECOAT-SG-PROXY-
MIB has the object needed for the CPU utilization.
sgProxyCpuBusyPerCent OBJECT-TYPE
SYNTAX Gauge32
UNITS "Percentage"
MAX-ACCESS read-only
STATUS current
DESCRIPTION "The busy CPU time as a percentage, averaged over
one minute."
::= { sgProxyCpu 7 }
Also, not to forget the check IMPORTS as well, to satisfy dependencies.
BLUECOAT-SG-PROXY-MIB DEFINITIONS ::= BEGIN
IMPORTS
MODULE-IDENTITY, OBJECT-TYPE, Counter64, Gauge32
FROM SNMPv2-SMI
DisplayString
FROM SNMPv2-TC
blueCoatMgmt
FROM BLUECOAT-MIB;
From the IMPORTS, I see that BLUECOAT-MIB needs to be compiled as well. Compile the MIB by clicking
FILE -> NEW -> MIB in the NetVoyant console. Add the MIB and any dependencies. SNMPv2-SMI and
SNMPv3-TC is already loaded (to be verified at the MIB view). Only BLUECOAT-MIB as a dependency will
need to be added.
Next, click on OK and have the compiler doing it’s job. You should see the new MIBs added at the end of the
tree. If you get this error, than you added MIBs in the wrong order. First always add the dependencies!

BlueCoat ProxySG CPU Utilization into NetQoS NetVoyant page 4 of 13
When done, you could do a RAW Poll using the integrated MIB Browser. The return is 4 % - Remember the
Object-Type?
sgProxyCpuBusyPerCent OBJECT-TYPE
SYNTAX Gauge32
UNITS "Percentage"
MAX-ACCESS read-only
STATUS current
DESCRIPTION "The busy CPU time as a percentage, averaged over
one minute."
::= { sgProxyCpu 7 }

BlueCoat ProxySG CPU Utilization into NetQoS NetVoyant page 5 of 13
Creating a Dataset
To create a Dataset, NetVoyant has a Wizard to help you. Click on FILE -> NEW -> DATASET and the
Wizard starts.
Choose the desired MIB Table. This will be needed to create the dataset. In this case, I have used
BLUECOAT_SG_PROXY_MIB
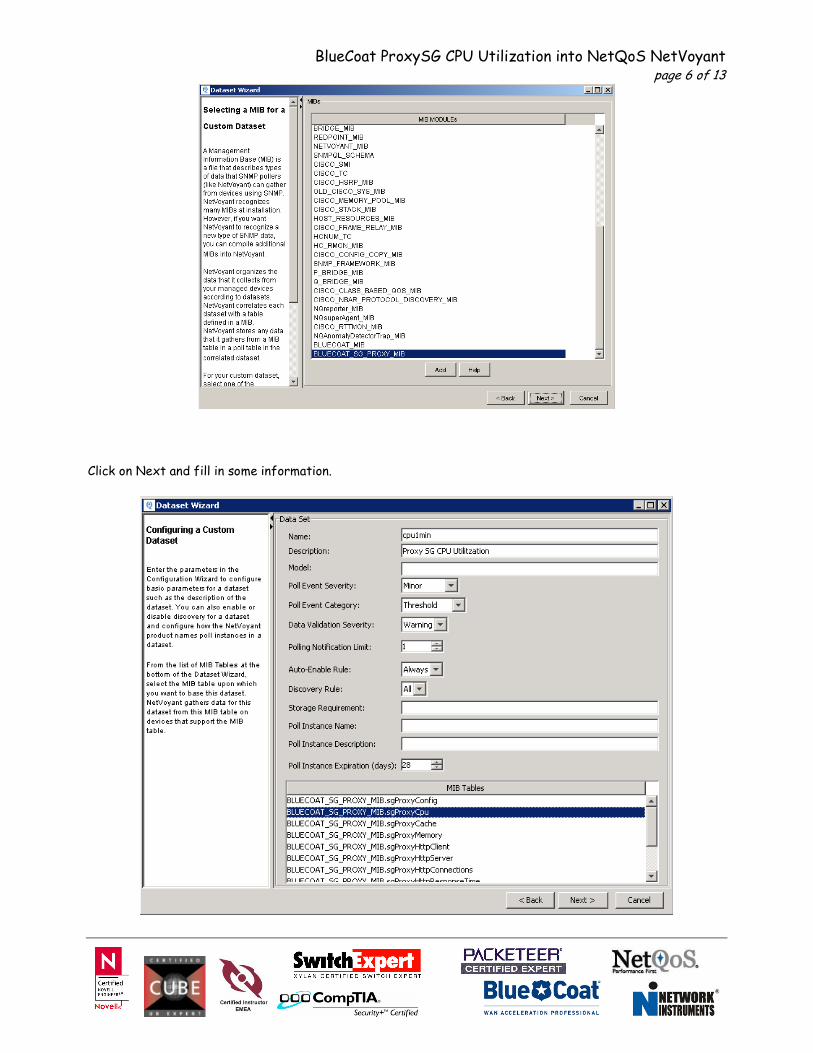
BlueCoat ProxySG CPU Utilization into NetQoS NetVoyant page 6 of 13
Click on Next and fill in some information.

BlueCoat ProxySG CPU Utilization into NetQoS NetVoyant page 7 of 13
Click on NEXT and then on ADD Highlight the OID (sgProxyCpuBusyPerCent) and double click
Click on the Advanced button
This will finish the Expression to the dataset.
Next, we need to define the frequency for that polling. Click on Next and Add

BlueCoat ProxySG CPU Utilization into NetQoS NetVoyant page 8 of 13
You can accept the default values or change on your specific requirements.
That’s it for the dataset creation. You will be asked at the end, if you want to enable polling for this dataset.
Click on YES
Now you will want to test discovery and support of your new dataset. To do this, you will need to go back to
the Group tab, select a target device, right click on the device and select Rediscover.
Before new dataset After new dataset

BlueCoat ProxySG CPU Utilization into NetQoS NetVoyant page 9 of 13
Creating a View
NetVoyant’s Custom View Editor allows you to create new views and to edit existing views. While most
NetVoyant views are editable with the Custom View Editor, there are some, such as the gauge style views,
that are not editable. Under the Reports tab, double click on the default report context displayed
This will open the new Report Template of ProxySG CPU Utilitzation.
If you click on the orange arrow on the right corner,
you will get the option to create a new view

BlueCoat ProxySG CPU Utilization into NetQoS NetVoyant page 10 of 13
This will start the Custom View Wizard
Type a View Name, choose a View Type, choose a Category or leave default and click on Next At Step 2, you define the Style and the Options

BlueCoat ProxySG CPU Utilization into NetQoS NetVoyant page 11 of 13
You could add a title for the X-Axis and Y-Axis. I only added CPU Util (%) for the Y-Axis and Percent for the Auto-Scale. I also added a Footer called “Resolution:” and chosen Resolution from the Pull-Down Menue
Click on Next and select the previously created dataset ProxySG CPU Utilitzation (cpu1min)
Click on Next
In Step 4, Data Expressions and Settings are required. Click on Add

BlueCoat ProxySG CPU Utilization into NetQoS NetVoyant page 12 of 13
cpu1min should be the choice in this example. You leave the display name or change it with a different name
Finally you the option to review. Click on Save and you are done
BlueCoat ProxySG CPU Utilization into NetQoS NetVoyant page 13 of 13
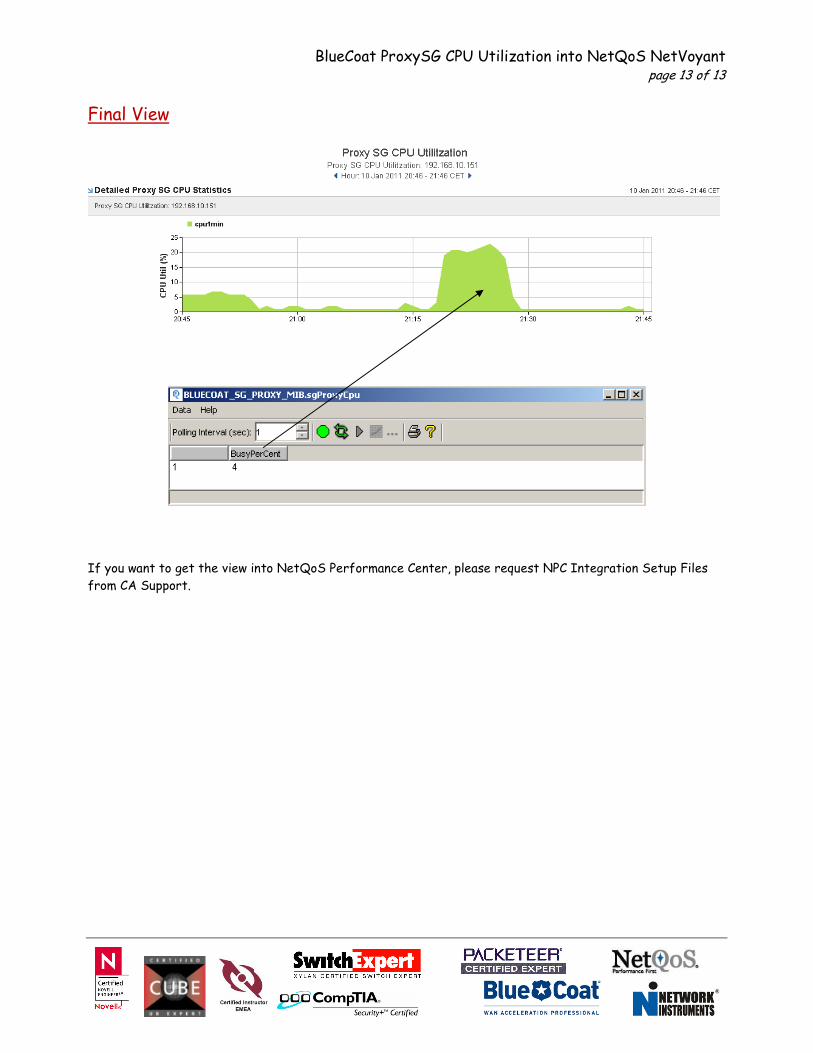
Final View
If you want to get the view into NetQoS Performance Center, please request NPC Integration Setup Files
from CA Support.
Top Related