


Languages
Pages
Legal

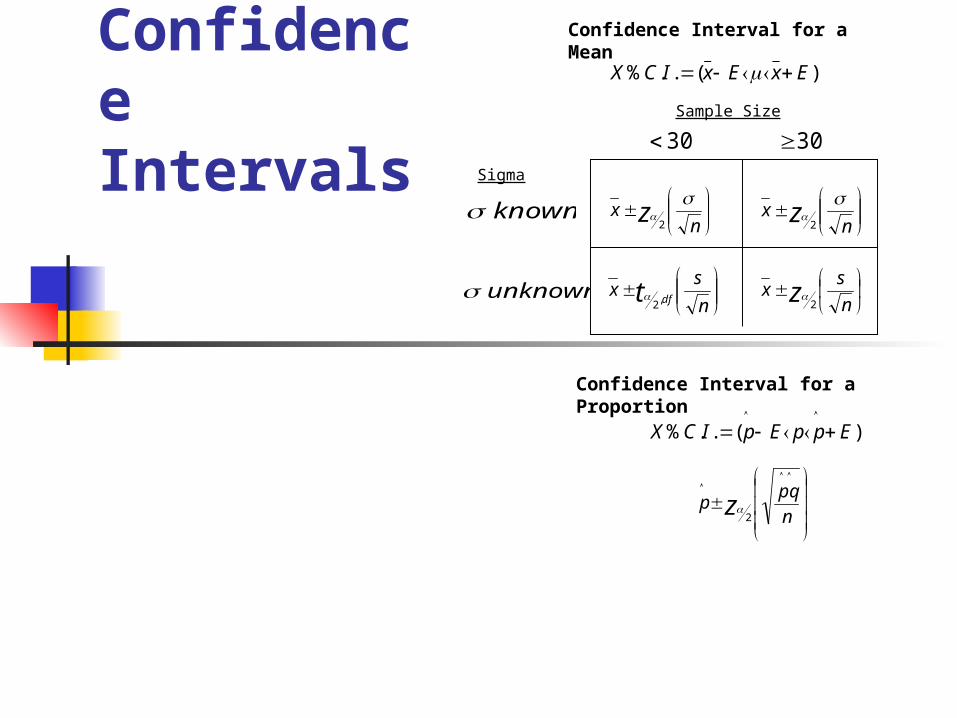
Confidence Intervals
30
nx z
2
nx z
2
)(..% EppEpICX
n
sx t df,2
n
sx z
2
n
pqp z
2
)(..%__
ExExICX
Confidence Interval for a Mean
30
unknown
known
Confidence Interval for a Proportion
Sigma
Sample Size
Inferential Statistics:
INFERENTIAL STATISTICS: Uses sample data to make estimates, decisions, predictions, or other generalizations about the population.
The aim of inferential statistics is to make an inference about a population, based on a sample (as opposed to a census), AND to provide a measure of precision for the method used to make the inference.
An inferential statement uses data from a sample and applies it to a population.
Some Terminology Estimation – is the process of
estimating the value of a parameter from information obtained from a sample.
Estimators – sample measures (statistics) that are used to estimate population measures (parameters).
Terminology (cont’d.)
Point Estimate – is a specific numerical value estimate of a parameter.
Interval Estimate – of a parameter is an interval or range of values used to estimate the parameter. It may or may not contain the actual value of the parameter being estimated.
Terminology (cont’d.) Confidence Level – of an interval
estimate of a parameter is the probability that the interval will contain the parameter.
Confidence Interval – is a specific interval estimate of a parameter determined by using data obtained from a sample and by using a specific confidence level.
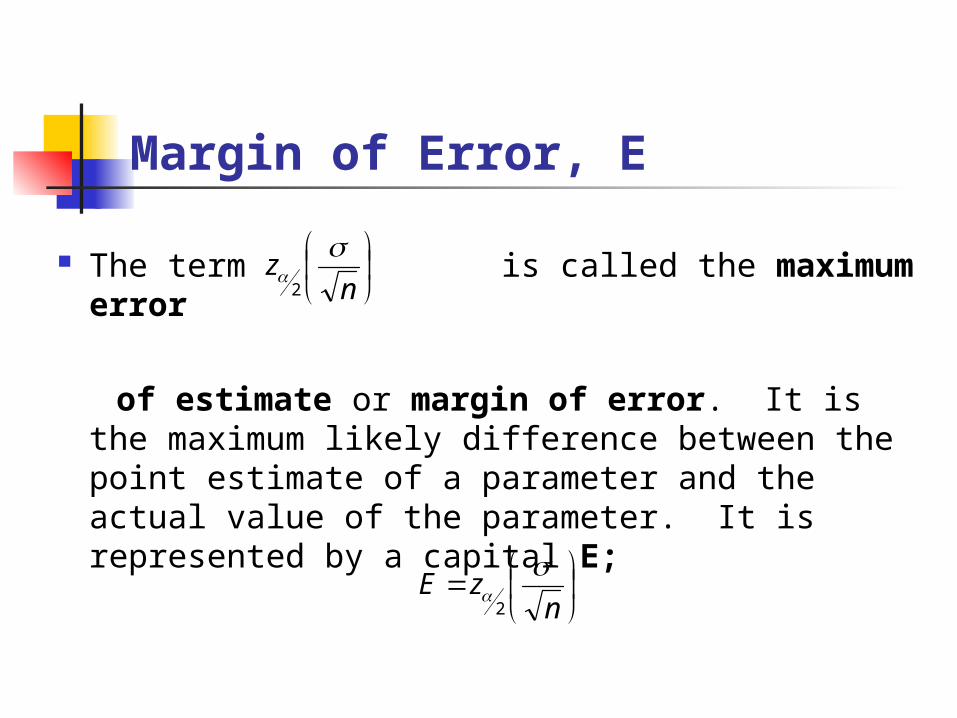
Margin of Error, E
The term is called the maximum error
of estimate or margin of error. It is the maximum likely difference between the point estimate of a parameter and the actual value of the parameter. It is represented by a capital E;
n
z
2
n
zE
2
95%.025 .025
n
z2
n
z2
05.025.2
95.1
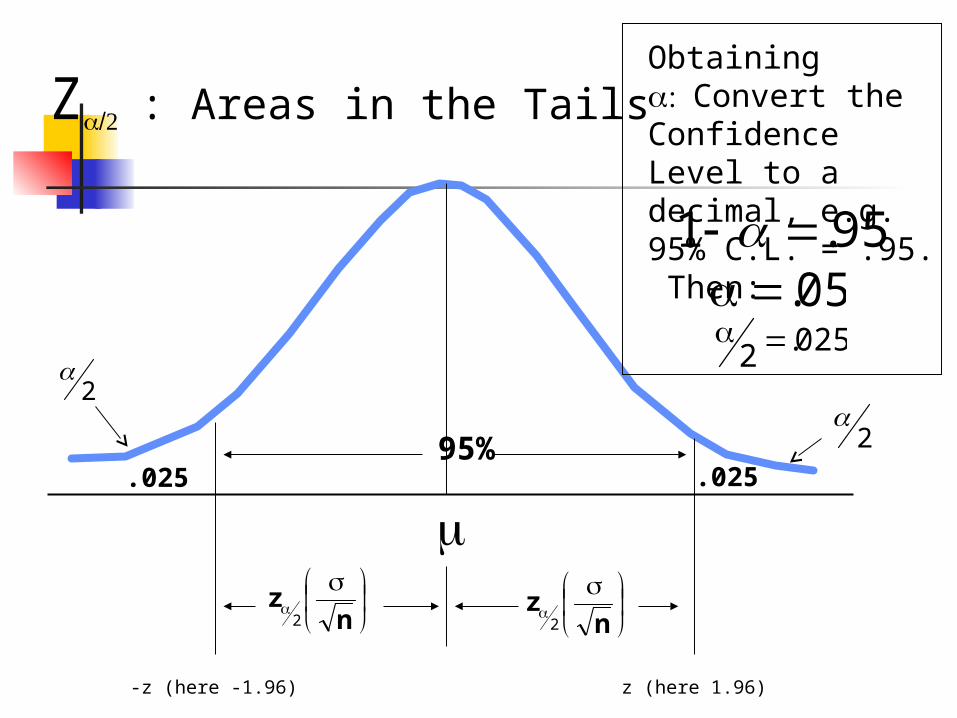
Z: Areas in the TailsObtaining Convert the Confidence Level to a decimal, e.g. 95% C.L. = .95. Then:
-z (here -1.96) z (here 1.96)
2
2
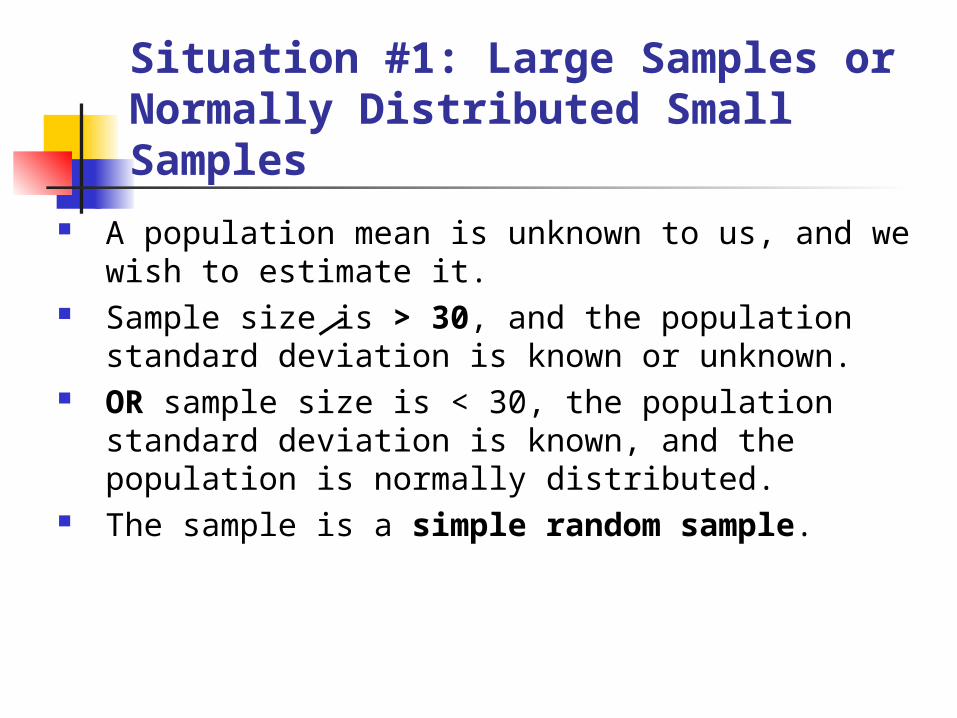
Situation #1: Large Samples or Normally Distributed Small Samples
A population mean is unknown to us, and we wish to estimate it.
Sample size is > 30, and the population standard deviation is known or unknown.
OR sample size is < 30, the population standard deviation is known, and the population is normally distributed.
The sample is a simple random sample.
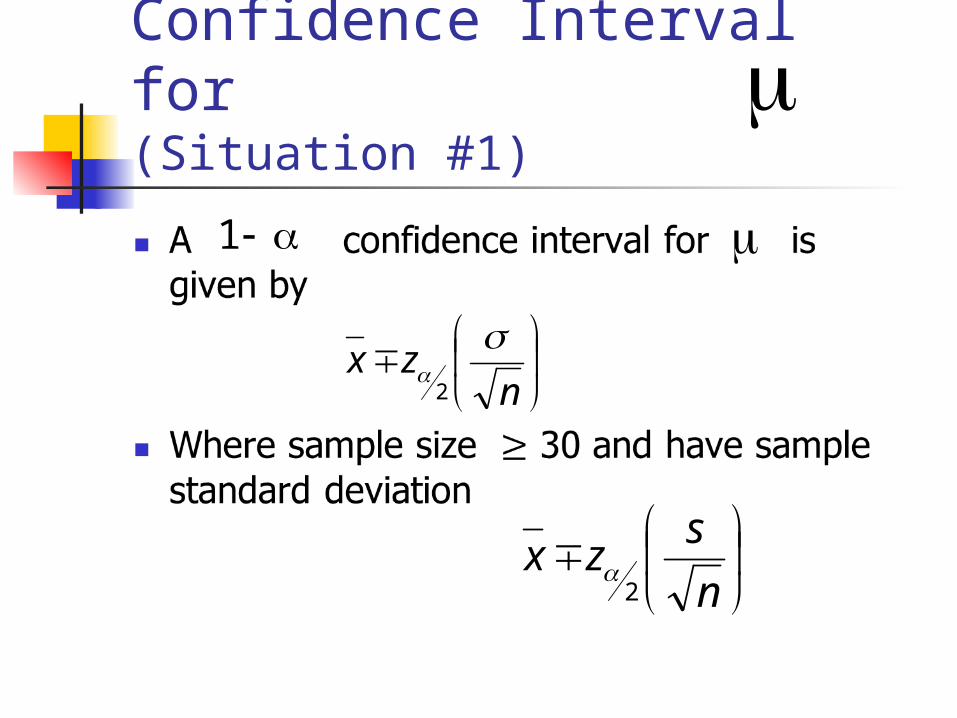
Confidence Interval for (Situation #1)
1
n
szx
2
n
zx
2
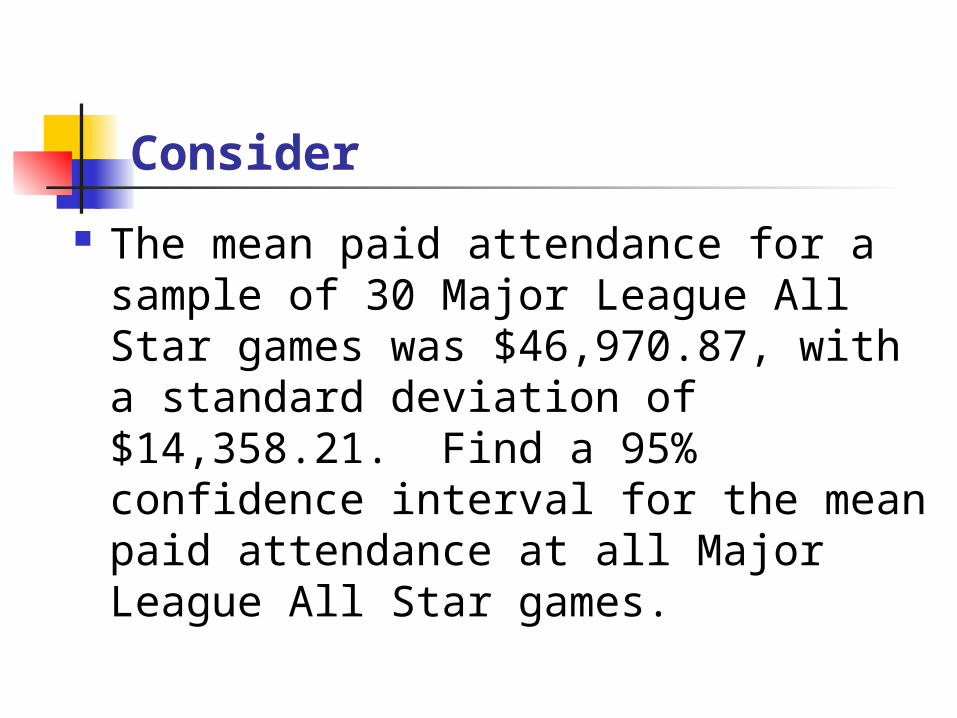
Consider
The mean paid attendance for a sample of 30 Major League All Star games was $46,970.87, with a standard deviation of $14,358.21. Find a 95% confidence interval for the mean paid attendance at all Major League All Star games.
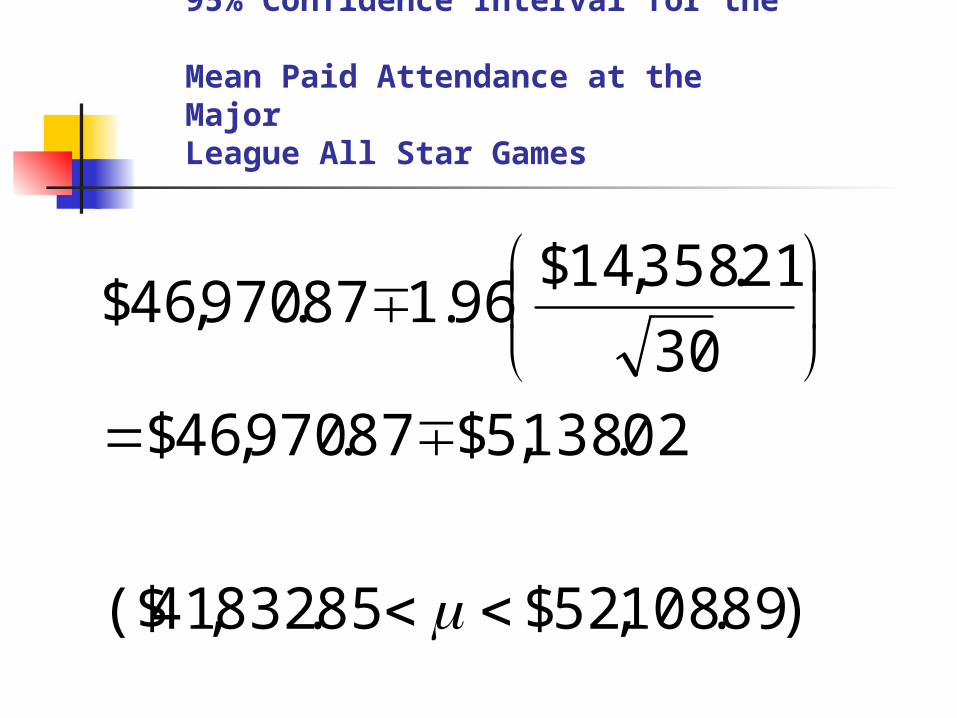
95% Confidence Interval for the Mean Paid Attendance at the Major League All Star Games
)89.108,52$85.832,41($
02.138,5$87.970,46$
30
21.358,14$96.187.970,46$
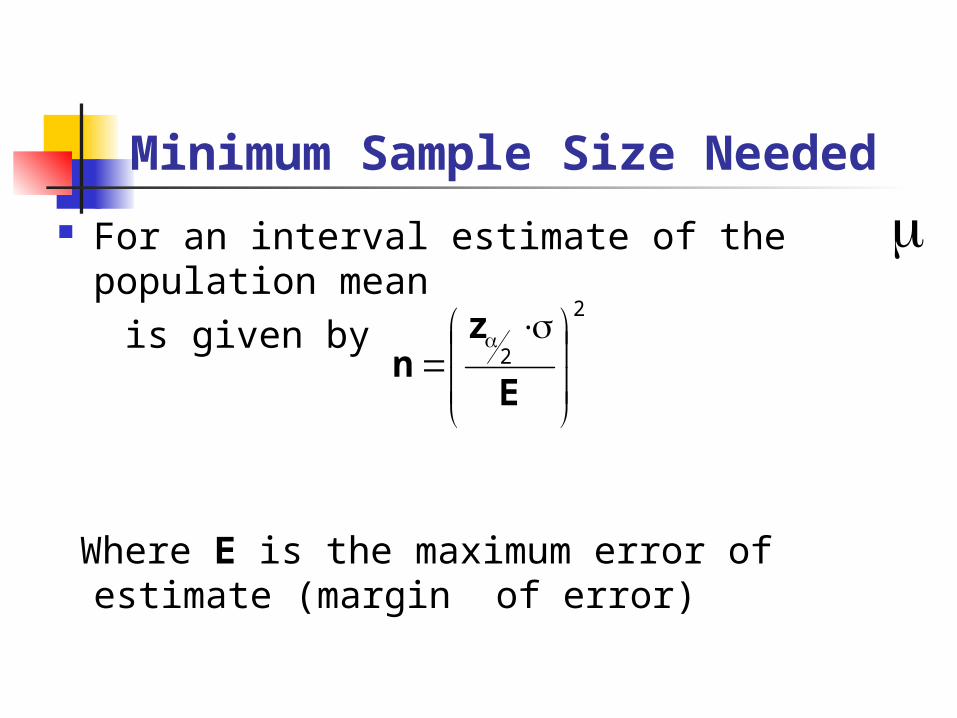
Minimum Sample Size Needed
For an interval estimate of the population mean
is given by
Where E is the maximum error of estimate (margin of error)
2
2
E
zn
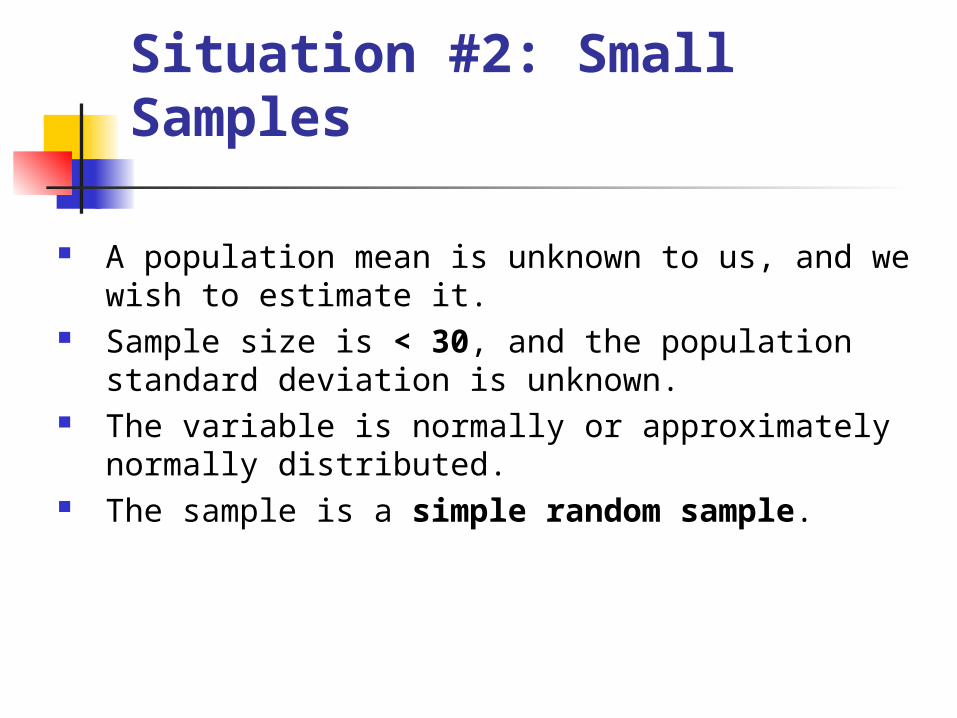
Situation #2: Small Samples
A population mean is unknown to us, and we wish to estimate it.
Sample size is < 30, and the population standard deviation is unknown.
The variable is normally or approximately normally distributed.
The sample is a simple random sample.
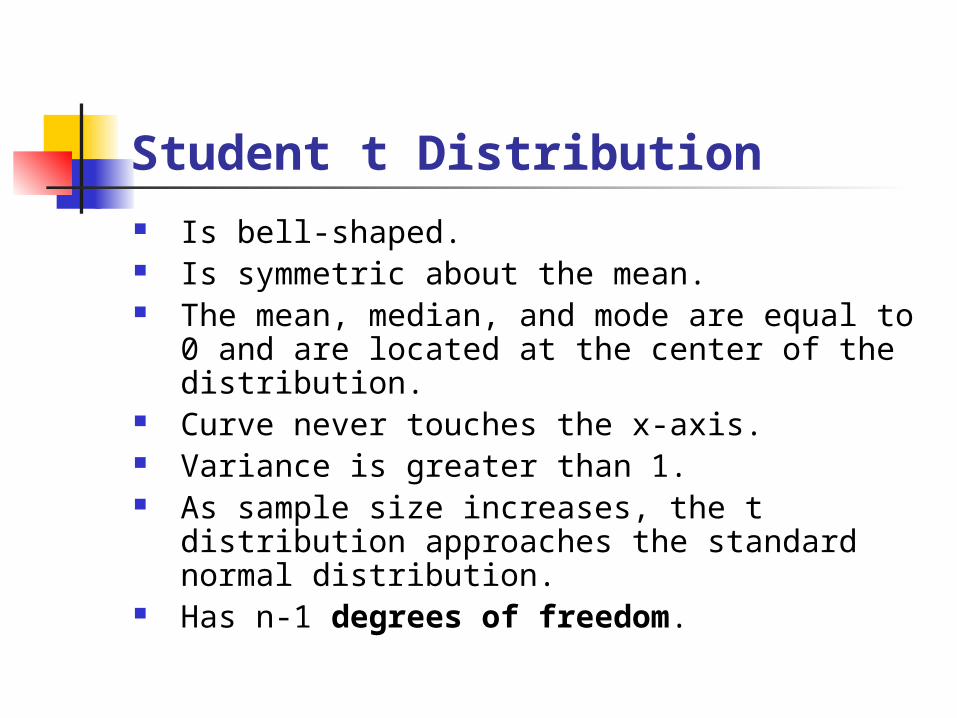
Student t Distribution Is bell-shaped. Is symmetric about the mean. The mean, median, and mode are equal to 0
and are located at the center of the distribution.
Curve never touches the x-axis. Variance is greater than 1. As sample size increases, the t distribution
approaches the standard normal distribution. Has n-1 degrees of freedom.
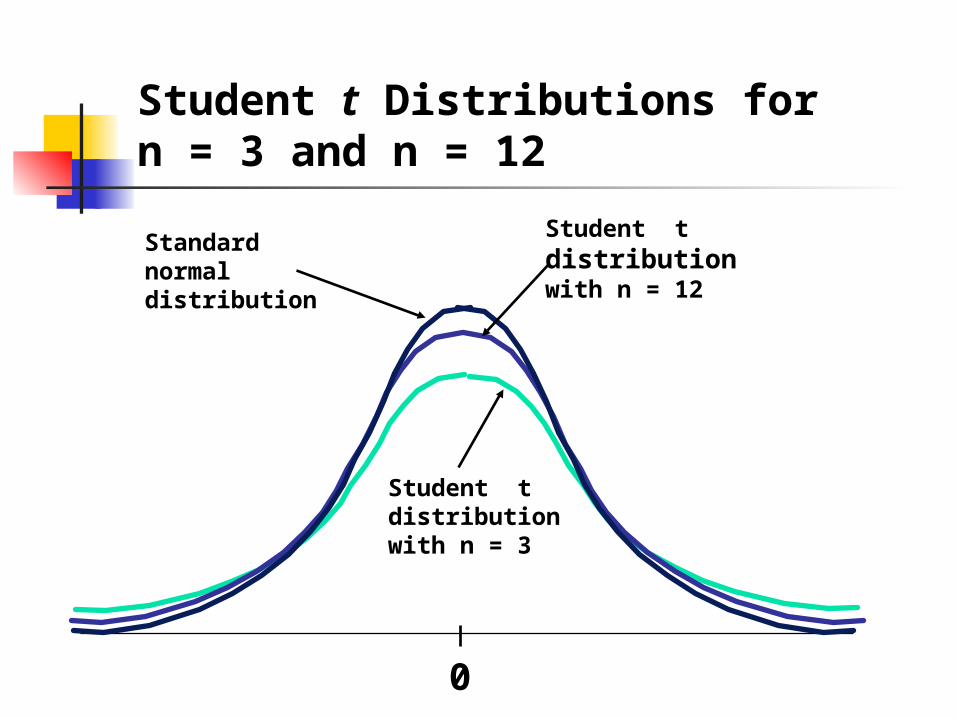
Student t Distributions for n = 3 and n = 12
Student tdistributionwith n = 3
0
Student tdistributionwith n = 12
Standardnormaldistribution
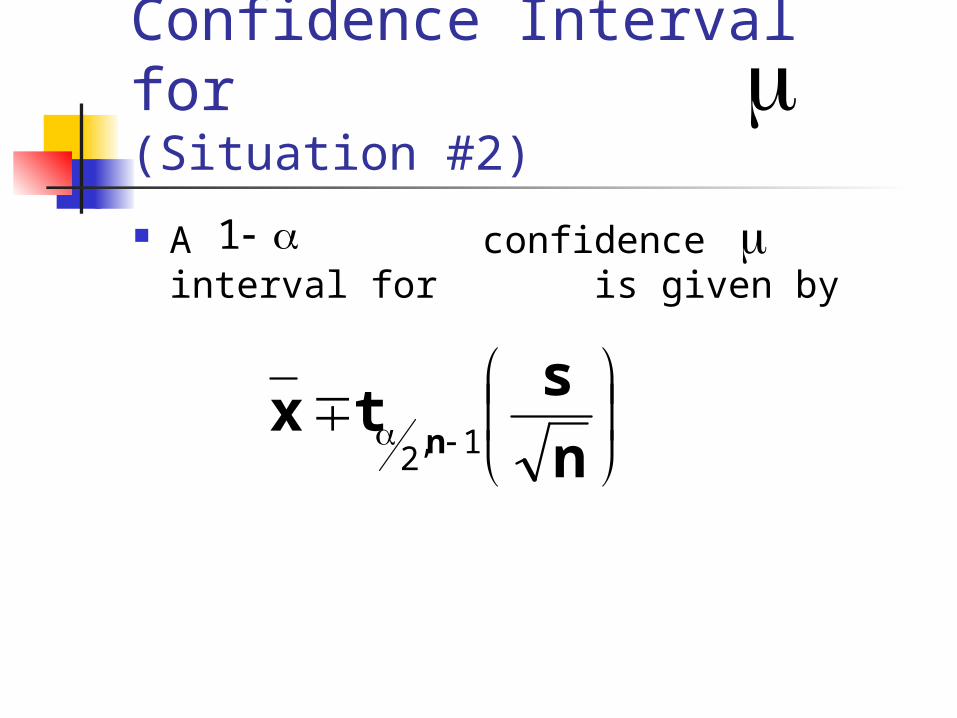
Confidence Interval for (Situation #2)
A confidence interval for is given by
1
n
stx
n 1,2
Consider
The mean salary of a sample of n=12 commercial airline pilots is $97,334, with a standard deviation of $17,747. Find a 90% confidence interval for the mean salary of all commercial airline pilots.
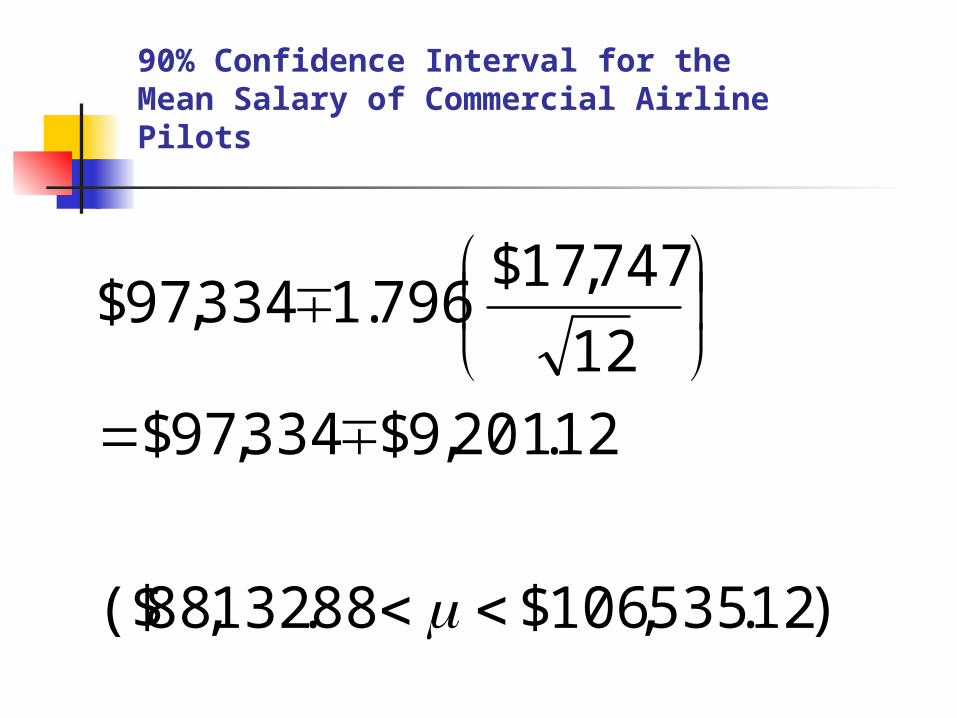
90% Confidence Interval for the Mean Salary of Commercial Airline Pilots
)12.535,106$88.132,88($
12.201,9$334,97$
12
747,17$796.1334,97$
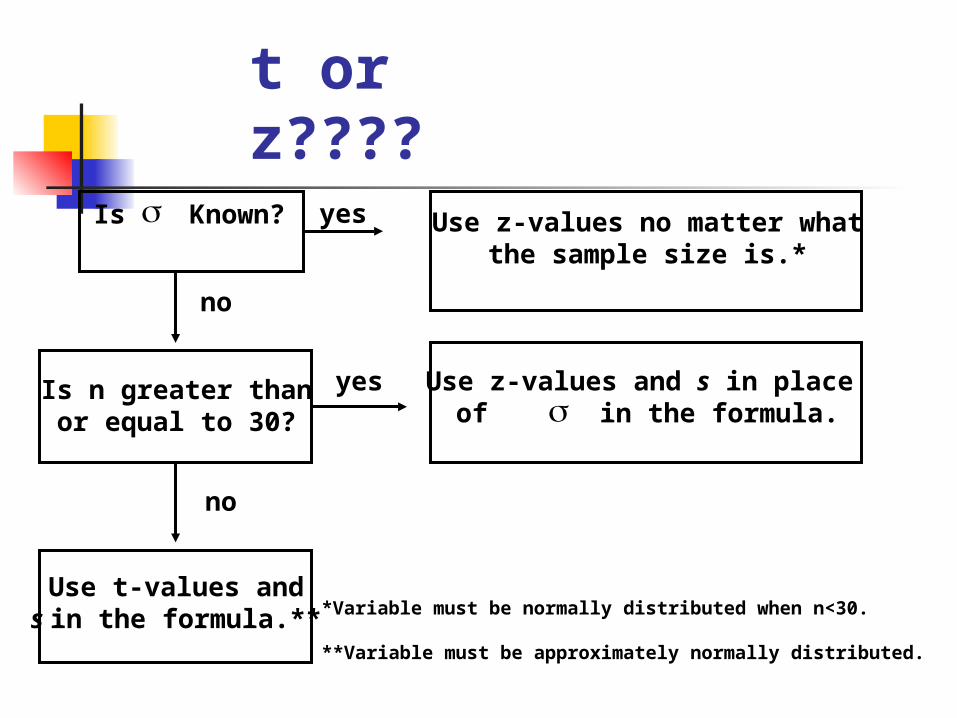
t or z????Is Known? yes
no
Use z-values no matter whatthe sample size is.*
Is n greater thanor equal to 30?
Use z-values and s in place of in the formula.
yes
no
Use t-values ands in the formula.** *Variable must be normally distributed when n<30.
**Variable must be approximately normally distributed.
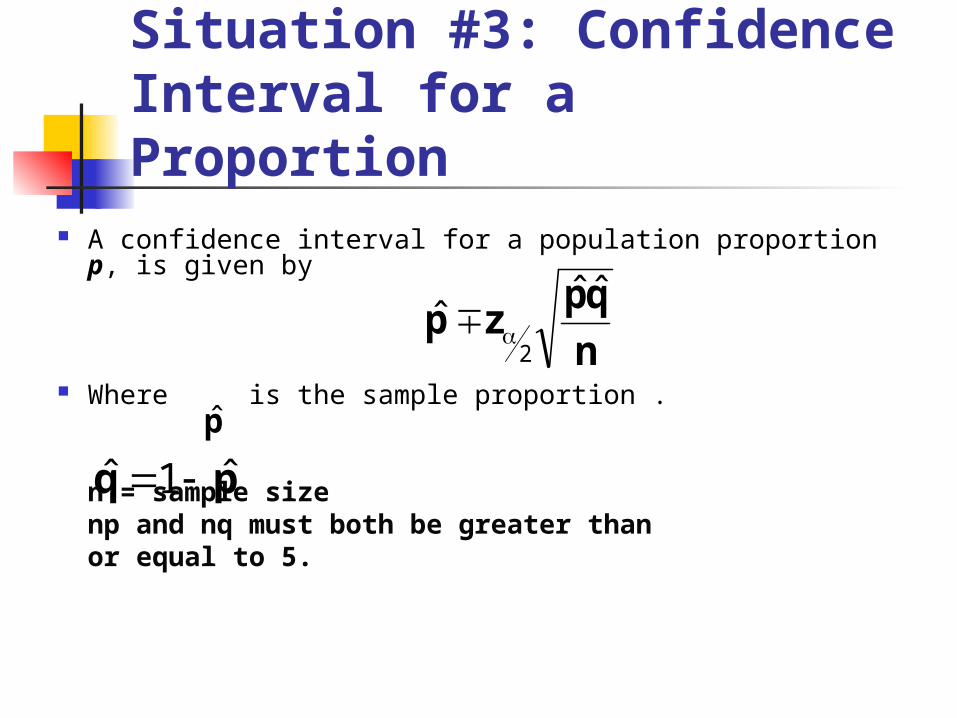
A confidence interval for a population proportion p, is given by
Where is the sample proportion .
n = sample sizenp and nq must both be greater thanor equal to 5.
n
qpzp
ˆˆˆ
2
p̂
pq ˆ1ˆ
Situation #3: Confidence Interval for a Proportion
Consider
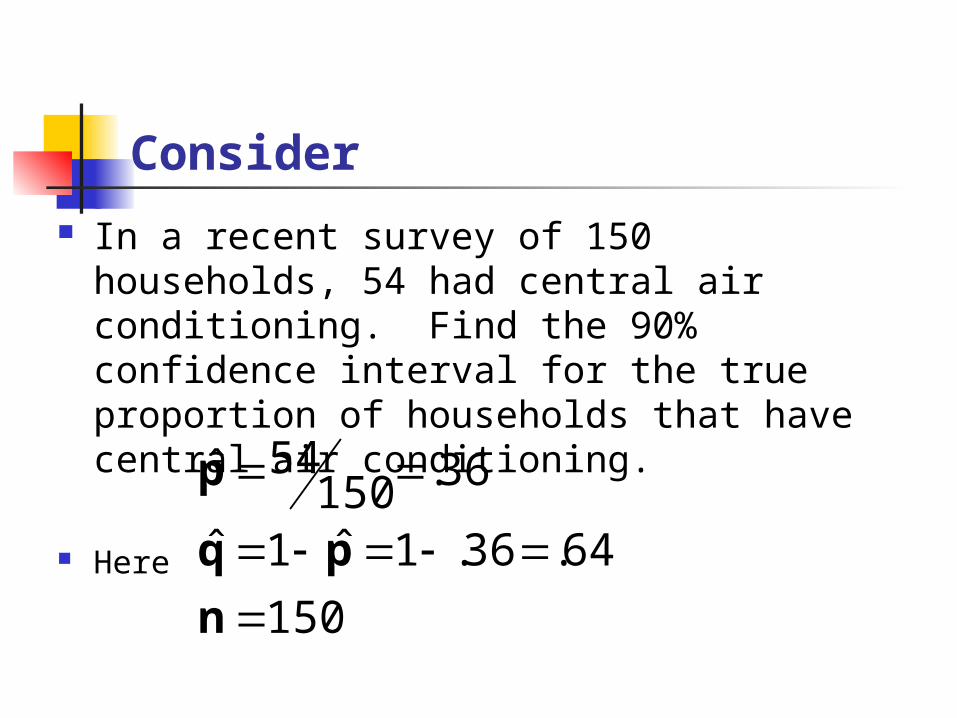
In a recent survey of 150 households, 54 had central air conditioning. Find the 90% confidence interval for the true proportion of households that have central air conditioning.
Here
150
64.36.1ˆ1ˆ
36.15054ˆ
n
pq
p
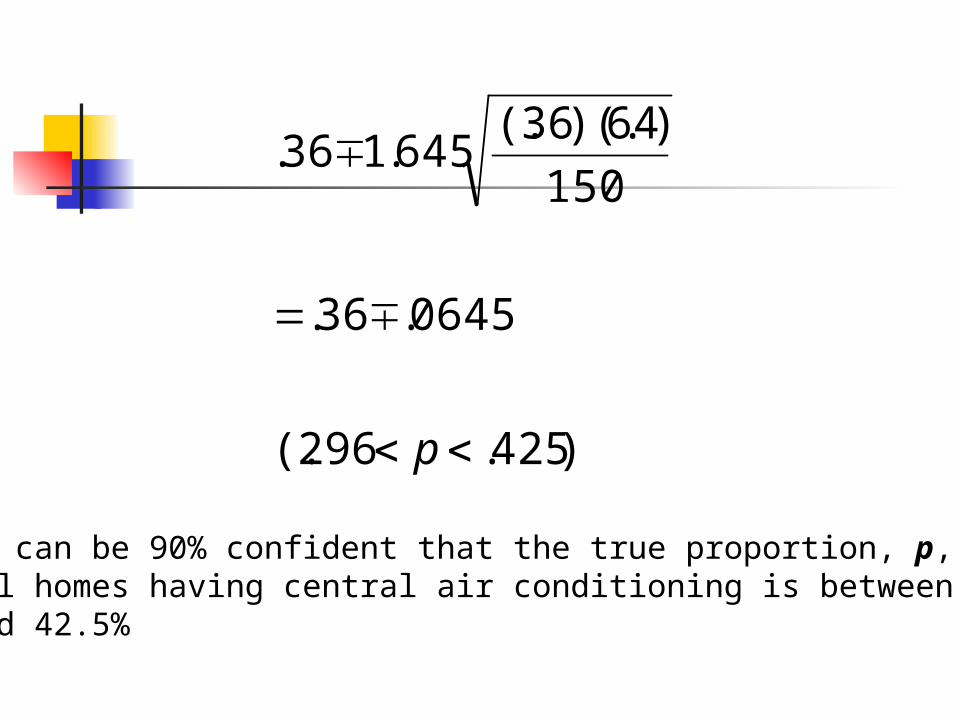
)425.296(.
0645.36.
150
)64)(.36(.645.136.
p
We can be 90% confident that the true proportion, p, ofall homes having central air conditioning is between 29.6%and 42.5%
Minimum Sample Size Needed
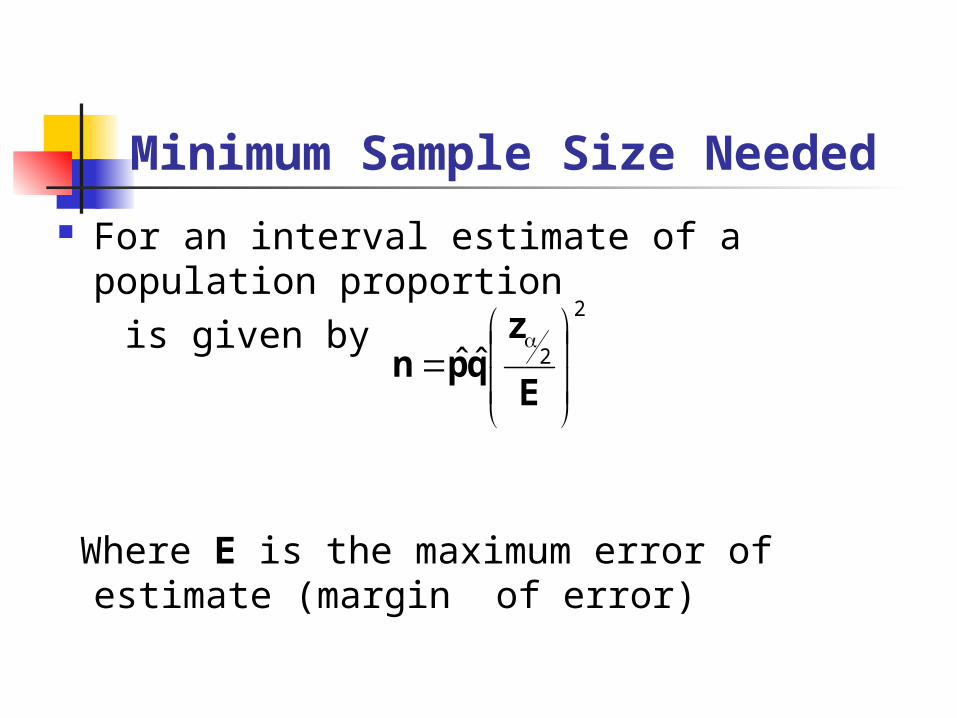
For an interval estimate of a population proportion
is given by
Where E is the maximum error of estimate (margin of error)
2
2ˆˆ
E
zqpn

End of slides
Top Related