


Languages
Pages
Legal


COMPREHENSIVE ANNUAL
FINANCIAL REPORT
OF
TOWNSHIP OF LAWRENCE
BOARD OF EDUCATION
CEDARVILLE, NEW JERSEY
FOR THE FISCAL YEAR ENDED JUNE 30, 2018
Prepared by
Township of Lawrence Board of Education
Finance Department

LAWRENCE TOWNSHIP SCHOOL DISTRICT
OUTLINE OF CAFR
INTRODUCTORY SECTION
Page
Letter of Transmittal
Organizational Chart
Roster of Officials
Consultants and Advisors
FINANCIAL SECTION
Independent Auditor’s Report 1-3
Required Supplementary Information - Part 1
Management’s Discussion and Analysis
Basic Financial Statements
A. District/Charter School-Wide Financial Statements:
A-1 Statement of Net Position 4
A-2 Statement of Activities 5
B. Fund Financial Statements:
Governmental Funds:
B-1 Balance Sheet 6
B-2 Statement of Revenues, Expenditures and Changes in Fund Balances 7
B-3 Reconciliation of the Statement of Revenues, Expenditures and Changes
In Fund Balances of Governmental Funds to the Statement of Activities 8
Proprietary Funds:
B-4 Statement of Net Position 9
B-5 Statement of Revenues, Expenses and Changes in Fund Net Position 10
B-6 Statement of Cash Flows 11
Fiduciary Funds:
B-7 Statement of Fiduciary Net Position 12
B-8 Statement of Changes in Fiduciary Net Position 13
Notes to Financial Statements 14-40
Required Supplementary Information – Part II
C. Budgetary Comparison Schedules:
C-1 Budgetary Comparison Schedule – General Fund 41-48
C-1a Combining Schedule of Revenues, Expenditures, and Changes in Fund
Balance – Budget and Actual N/A
C-1b Education Jobs Fund Program – Budget and Actual N/A
C-2 Budgetary Comparison Schedule – Special Revenue Fund 49
Notes to the Required Supplementary Information
C-3 Budget-to-GAAP Reconciliations 50

LAWRENCE TOWNSHIP SCHOOL DISTRICT
OUTLINE OF CAFR
(Continued)
Page
Required Supplementary Information – Part III
L. Schedule Related to Accounting and Reporting for Pensions (GASB 68)
L-1 Schedule of the District’s Proportionate Share of the Net Pension
Liability – PERS 51
L-2 Schedule of District Contributions – PERS and TPAF 52
L-3 Schedule of the District’s Proportionate Share of the Net Pension
Liability – TPAF 53
Notes to the Required Supplementary Information – Part III
L-4 Notes to Pension Schedules 54
Required Supplementary Information – Part IV
M. Schedule Related to Accounting and Reporting for OPEB (GASB 75)
M-1 Schedule of the District’s Proportionate Share of the Net OPEB
Liability 55
M-2 Schedule of District’s Contribution 56
Notes to the Required Supplementary Information – Part IV
L-4 Notes to OPEB Schedules 57
Other Supplementary Information
D. School Based Budget Schedules:
D-1 Combining Balance Sheet N/A
D-2 Blended Resource Fund – Schedule of Expenditures Allocated
By Resource Type – Actual N/A
D-3 Blended Resource Fund – Schedule of Blended Expenditures –
Budget and Actual N/A
E. Special Revenue Fund:
E-1 Combining Schedule of Program Revenues and Expenditures Special
Revenue Fund – Budgetary Basis 58
E-2 Schedule of Pre-School Education Aid – Budgetary Basis 59
F. Capital Projects Fund:
F-1 Summary Schedule of Project Expenditures 60
F-2 Summary Schedule of Revenues, Expenditures, and Changes in Fund Balance –
Budgetary Basis 61
F-2(a) Schedule(s) of Project Revenues, Expenditures and Project Balance –
Myron L Powell School Improvements – 2010 62
F-2(b) Schedule(s) of Project Revenues, Expenditures and Project Balance –
Partial Roof Replacement 63
G. Proprietary Funds:
Enterprise Fund:
G-1 Combining Schedule of Net Position 64
G-2 Combining Schedule of Revenues, Expenses and Changes in Fund Net Position 65
G-3 Combining Schedule of Cash Flows 66

LAWRENCE TOWNSHIP SCHOOL DISTRICT
OUTLINE OF CAFR
(Continued)
Page
Internal Service Fund:
G-4 Combining Schedule of Net Position 67
G-5 Combining Schedule of Revenues, Expenses and Changes in Fund Net Position 68
G-6 Combining Schedule of Cash Flows 69
H. Fiduciary Fund:
H-1 Combining Statement of Fiduciary Net Position 70
H-2 Combining Statement of Changes in Fiduciary Net Position 71
H-3 Student Activity Agency Fund Schedule of Receipts and Disbursements 72
H-4 Payroll Agency Fund Schedule of Receipts and Disbursements 73
I. Long-Term Debt:
I-1 Schedule of Serial Bonds 74
I-2 Schedule of Obligations Under Capital Leases N/A
I-3 Debt Service Fund Budgetary Comparison Schedule 75
Statistical Section
Financial Trends
J-1 Net Position by Component 76
J-2 Changes in Net Position 77-78
J-3 Fund Balances – Governmental Funds 79
J-4 Changes in Fund Balances – Governmental Funds 80-81
J-5 General Fund Other Local Revenue by Source 82
Revenue Capacity
J-6 Assessed Value and Estimated Actual Value of Taxable Property 83
J-7 Direct and Overlapping Property Tax Rates 84
J-8 Principal Property Taxpayers* 85
J-9 Property Tax Levies and Collections 86
Debt Capacity
J-10 Ratios of Outstanding Debt by Type 87
J-11 Ratios of Net General Bonded Debt Outstanding 88
J-12 Direct and Overlapping Governmental Activities Debt 89
J-13 Legal Debt Margin Information 90
Demographic and Economic Information
J-14 Demographic and Economic Statistics 91
J-15 Principal Employers 92
Operating Information
J-16 Full-Time Equivalent District/Charter School Employees by
Function/Program 93
J-17 Operating Statistics 94
J-18 School Building Information 95
J-19 Schedule of Required Maintenance Expenditures by School Facility 96
J-20 Insurance Schedule 97
LAWRENCE TOWNSHIP SCHOOL DISTRICT
OUTLINE OF CAFR
(Continued)
Page
SINGLE AUDIT SECTION
K-1 Report on Internal Control over Financial Reporting and on Compliance
And Other Matters Based on an Audit of Financial Statements
Performed in Accordance with Government Auditing Standards 98-99
K-2 Report on Compliance For Each Major Program; Report on Internal Control
Over Compliance 100-101
K-3 Schedule of Expenditures of Federal Awards, Schedule A 102-103
K-4 Schedule of Expenditures of State Financial Assistance, Schedule B 104-105
K-5 Notes to the Schedules of Awards and Financial Assistance 106-107
K-6 Schedule of Findings and Questioned Costs 108-109
K-7 Summary Schedule of Prior Audit Findings 110

INTRODUCTORY SECTION


Lawrence Township Board of Education
Organizational Chart
2017-2018
Board of Education
Chief School Administrator
Supervisor of Assessment, Curriculum & Student Services
Instructional Staff Office &
Support StaffDirector of Special
Education
Child Study Team Personnel
Board Secretary/Business Administrator
Buildings and GroundsChief of Maintenance
Maintenance/Custodial Staff
Office Staff

LAWRENCE TOWNSHIP BOARD OF EDUCATION
ROSTER OF OFFICIALS
JUNE 30, 2018
Members of the Board of Education Term Expires
William Reyes, President 2018
Edward J. Cox Jr., Vice President 2020
Cheryl Saunders Rodman 2018
Linda Miletta 2019
Misty Sheppard 2020
Other Officials
Dr. Shelleymarie Magan – Chief School Administrator
Lisa M. DiNovi - Board Secretary/Business Administrator

LAWRENCE TOWNSHIP BOARD OF EDUCATION
CONSULTANTS AND ADVISORS
June 30, 2018
AUDIT FIRM
Triantos and Delp, CPA’s, LLC
645 South Main Road
Vineland, New Jersey 08360
ATTORNEY
Lipman, Antonelli, Batt, Gilson, Rothman & Capasso
110 N. Sixth Street
PO Box 729
Vineland, NJ 08362
Barbour & Associates.
PO Box 345
Maple Shade, NJ 08052
OFFICIAL DEPOSITORY
Ocean First Bank
SCHOOL PHYSICIAN
Christopher T. Ballas M.D.
Bridgeton, NJ 08302
INSURANCE AGENT
Conner Strong & Buckelew

FINANCIAL SECTION

INDEPENDENT AUDITOR’S REPORT
The Honorable President and
Members of the Board of Education
Lawrence Township School District
County of Cumberland, New Jersey
Report on Financial Statements
We have audited the accompanying financial statements of the governmental activities, the business-type
activities, each major fund and the aggregate remaining fund information of the Board of Education of
the Lawrence Township School District in the County of Cumberland, in the State of New Jersey, as of
and for the fiscal year ended June 30, 2018, and the related notes to the financial statements, which
collectively comprise the Board of Education’s basic financial statements as listed in the table of
contents.
Management’s Responsibility for the Financial Statements
Management is responsible for the preparation and fair presentation of these financial statements in
accordance with accounting principles generally accepted in the United States of America; this includes
the design, implementation, and maintenance of internal control relevant to the preparation and fair
presentation of financial statements that are free from material misstatement, whether due to fraud or
error.
Auditor’s Responsibility
Our responsibility is to express opinions on these financial statements based on our audit. We conducted
our audit in accordance with auditing standards generally accepted in the United States of America and
the standards applicable to financial audits contained in Government Auditing Standards, issued by the
Comptroller General of the United States; and audit requirements as prescribed by the Office of School
Finance, Department of Education, State of New Jersey. Those standards require that we plan and
perform the audit to obtain reasonable assurance about whether the financial statements are free from
material misstatement.
An audit involves performing procedures to obtain audit evidence about the amounts and disclosures in
the financial statements. The procedures selected depend on the auditor’s judgment, including the
assessment of the risks of material misstatement of the financial statements, whether due to fraud or
error. In making those risk assessments, the auditor considers internal control relevant to the entity’s
preparation and fair presentation of the financial statements in order to design audit procedures that are
appropriate in the circumstances, but not for the purpose of expressing an opinion on the effectiveness of
the entity’s internal control. Accordingly, we express no such opinion. An audit also includes evaluating
the appropriateness of accounting policies used and the reasonableness of significant accounting
estimates made by management, as well as evaluating the overall presentation of the financial statements.
We believe that the audit evidence we have obtained is sufficient and appropriate to provide a basis for
our audit opinions.
1

INDEPENDENT AUDITOR’S REPORT
(Continued)
Opinions
In our opinion, the financial statements referred to above present fairly, in all material respects, the
respective financial position of the governmental activities, the business-type activities, each major fund
and the aggregate remaining fund information of the Lawrence Township Board of Education in the
County of Cumberland, State of New Jersey, as of June 30, 2018, and the respective changes in financial
position and, where applicable, cash flows thereof for the year then ended in accordance with accounting
principles generally accepted in the United States of America.
Change in Accounting Principle
As discussed in Note 1 to the financial statements, in 2018 the District adopted new accounting guidance,
GASB Statement No. 75, Accounting and Financial Reporting for Postemployment Benefits Other Than
Pensions. Our opinion is not modified with respect to this matter.
Other Matters
Required Supplementary Information
Accounting principles generally accepted in the United States of America require that the Management’s
Discussion and Analysis, Budgetary Comparison Information, Schedules Related to Accounting and
Reporting for Pension, Schedule Relating to Accounting and Reporting for Other Post Employment
Benefits, and Notes to the Required Supplemental Information as identified in the table of contents be
presented to supplement the basic financial statements. Such information, although not part of the basic
financial statements, is required by the Governmental Accounting Standards Board who considers it to be
an essential part of financial reporting for placing the basic financial statements in an appropriate
operational, economic, or historical context. We have applied certain limited procedures to the required
supplementary information in accordance with auditing standards generally accepted in the United States
of America, which consisted of inquiries of management about the methods of preparing the information
and comparing the information for consistency with management’s response to our inquiries, the basic
financial statements, and other knowledge we obtained during our audit of the basic financial statements.
We do not express an opinion or provide any assurance on the information because the limited
procedures do not provide us with sufficient evidence to express an opinion or provide any assurance.
Other Information
Our audit was conducted for the purpose of forming opinions on the financial statements that collectively
comprise the Lawrence Township Board of Education’s basic financial statements. The accompanying
schedule of expenditures of federal awards as required by Title 2 U.S Code of Federal Regulations Part
200, Uniform Administrative Requirements, Cost Principles, and Audit Requirements for Federal
Awards, (Uniform Guidance), and schedule of expenditures of state awards as required by New Jersey
OMB’s Circular 15-08, Single Audit Policy for Recipients of Federal Grants, State Grants, and State Aid
are presented for purposes of additional analysis and are not a required part of the basic financial
statements. The accompanying introductory information, statistical sections, combining and individual
non-major fund financial statements are also presented for purposes of additional analysis and are not a
required part of the basic financial statements.
2

INDEPENDENT AUDITOR’S REPORT
(Continued)
The accompanying combining and individual non-major fund financial statements, schedule of
expenditures of federal awards, and schedule of expenditure of state awards are the responsibility of
management and were derived from and relate directly to the underlying accounting and other records
used to prepare the basic financial statements. Such information has been subjected to the auditing
procedures applied in the audit of the basic financial statements and certain additional procedures,
including comparing and reconciling such information directly to the underlying accounting and other
records used to prepare the basic financial statements or to the basic financial statements themselves, and
other additional procedures in accordance with auditing standards generally accepted in the United States
of America. In our opinion, the accompanying combining and individual non-major fund financial
statements, schedule of expenditures of federal awards, and schedule expenditures of state awards are
fairly stated, in all material respects, in relation to the basic financial statements as a whole.
The introductory and statistical section have not been subjected to the auditing procedures applied in the
audit of the basic financial statements, and accordingly, we do not express an opinion or provide any
assurance on them.
Other Reporting Required by Government Auditing Standards
In accordance with Government Auditing Standards, we have also issued our report dated February 14,
2019 on our consideration of the Lawrence Township Board of Education’s internal control over
financial reporting and on our tests of its compliance with certain provisions of laws, regulations,
contracts, and grant agreements and other matters. The purpose of that report is to describe the scope of
our testing of internal control over financial reporting and compliance and the results of that testing, and
not to provide an opinion on internal control over financial reporting or on compliance. That report is an
integral part of an audit performed in accordance with Government Auditing Standards in considering
Lawrence Township Board of Education’s internal control over financial reporting and compliance.
Respectfully submitted,
Samuel A. Delp, Jr.
Public School Accountant, #745
Triantos & Delp
Certified Public Accountants, LLC
February 14, 2019
3

REQUIRED SUPPLEMENTARY INFORMATION–PART I

MANAGEMENT’S DECISION AND ANALYSIS
LAWRENCE TOWNSHIP BOARD OF EDUCATION 225 Main Street
Cedarville, NJ 08311
Phone (856) 447-4409 Fax (856) 447-0521
Dr. Shelleymarie Magan x5000 Lisa M. DiNovi x5690
Chief School Administrator Business Administrator / Board Secretary
MANAGEMENT'S DISCUSSION AND ANALYSIS
This section of Lawrence Township Board of Education's annual financial report presents our discussion and
analysis of the District's financial performance during the fiscal year that ended on June 30, 2018. Please
read it in conjunction with the transmittal letter at the front of this report and the District's financial
statements, which immediately follow this section.
OVERVIEW OF THE FINANCIAL STATEMENTS
This annual report consists of three parts - management's discussion and analysis (this section), the basic
financial statements, and required supplementary information. The basic financial statements include two
kinds of statements that present different views of the district.
- The first two statements are district-wide financial statements that provide both short-term and
long-term information about the District's overall financial status.
- The remaining statements are fund financial statements that focus on individual parts of the
District, reporting the District's operations in more detail than the district-wide statements.
- The governmental funds statements tell how basic services like regular and special education
were financed in the short term as well as what remains for future spending.
- Proprietary funds statements offer short and long-term financial information about the
activities that the district operates like businesses.
- Fiduciary funds statements provide information about the financial relationships in which the
District acts solely as a trustee or agent for the benefit of others.
The financial statements also include notes that explain some of the information in the statements and
provide more detailed data. The statements are followed by a section of required supplementary information
that further explains and supports the financial statements with a comparison of the District's budget for the
year.

Figure A-1
Major Features of District-Wide and Fund Financial Statements
__________________________Fund Financial Statements__________________________ District-Wide
Statements Governmental Funds Proprietary Funds Fiduciary Funds
Entire district The activities of the district Activities the district Instances in which the Scope (except fiduciary that are not proprietary or operates similar to private district administers
funds) fiduciary, such as special businesses: food services resources on behalf of
education and building and adult education someone else, such as maintenance scholarship programs and
student activities monies
Required -Statement of -Balance sheet -Statement of net assets -Statement of fiduciary
financial net assets -Statement of revenues -Statement of revenues, net assets
statements -Statement of expenditures, and expenses, and changes -Statement of changes activities changes in fund balances in fund net assets in fiduciary net assets
-Statement of cash flows
Accounting Accrual Modified Accrual Accrual accounting and Accrual accounting and
basis and accounting and accounting and current economic resources focus economic resources focus
measurement economic financial resources focus focus resources focus
Type of All assets and Generally assets expected All assets and liabilities All assets and liabilities asset/ liabilities both to be used up and liabilities both financial and capital both short-term and
liability financial and that come due during the and short-term and long-term; the District's funds do Information capital, short- year or soon thereafter; no long-term not currently contain capital
term and long capital assets or long-term assets, although they can
term liabilities included
Type of All revenues Revenues for which cash is All revenues and expenses All additions and deductions
inflow/ and expenses received during or soon after during the year, regardless during the year, regardless outflow during the year, the end of the year of when cash is received or of when cash is received or
information regardless of expenditures when goods or paid paid
when cash is services have been received received or paid and the related liability is
due and payable
Figure A-1 summarizes the major features of the District's financial statements, including the portion of the
District's activities they cover and the type of information they contain. The remainder of this overview
section of management's discussion and analysis highlights the structure and contents of each of the
statements.
District-wide Statements
The district-wide statements report information about the District as a whole using accounting methods
similar to those used by private-sector companies. The statement of net assets includes all of the District's
assets and liabilities. All of the current year's revenues and expenses are accounted for in the statement of
activities regardless of when cash is received or paid.
The two district-wide statements report the District's net position and how they have changed. Net position -
the difference between the District's assets and deferred outflows and liabilities and deferred inflows - are
one way to measure the District's financial health or position.
- Over time, increases or decreases in the District's net position are an indicator of whether its
financial position is improving or deteriorating, respectively.
- To assess the overall health of the District, you need to consider additional non-financial
factors such as changes in the District's property tax base and the condition of school
building and other facilities.
In the district-wide financial statements, the District's activities are divided into two categories:
- Governmental activities - Most of the District's basic services are included here, such as regular and
special education, transportation, and administration. Property taxes and state formula aid finance
most of these activities.
- Business-type activities - The District charges fees to help it cover the cost for certain services it
provides. The District's food services program is included here.
Fund Financial Statements The fund financial statements provide more detailed information about the District's funds, focusing on its
most significant or "major" funds - not the District as a whole. Funds are accounting devices the District uses
to keep track of specific sources of funding and spending on particular programs:
- Some funds are required by State Law and by bond covenants.
- The District establishes other funds to control and manage money for particular purposes (like
completing approved capital projects) or to show that it is properly using certain revenues (like federal
grants).
The District has four kinds of funds:
- Governmental Fund - Most of the District's basic services are included in governmental funds,
which generally focus on (1) how cash and other financial assets that can readily be converted to cash
flow in and out and (2) the balances left at year-end that are available for spending. Consequently,
the governmental funds statements provide a detailed short-term view that helps you determine
whether there are more or fewer financial resources that can be spent in the near future to finance the
District's programs. Because this information does not encompass the additional long-term focus of
the district-wide statements, we provide additional information with the governmental funds
statements that explain the relationship (or differences between them).
- Proprietary funds - Services for which the District charges a fee are generally reported in
proprietary funds. Proprietary funds are reported in the same way as the district-wide statements.
- In fact, the District's enterprise funds (one type of proprietary fund) are the same as its
business-type activities, but provide more detail and additional information, such as cash flow.
- Internal service funds (the other kind of proprietary fund) are utilized to report activities that
provide supplies and services for the District's other programs and activities and for other Districts
(student transportation). LTBOE currently has an internal service fund for shared Business services.
- Fiduciary funds - The District is the trustee, or fiduciary, for assets that belong to others, such as
the scholarship fund and the student activities funds. The District is responsible for ensuring that the
assets reported in these funds are used only for their intended purposes and by those to whom the
assets belong. We exclude these activities from the district-wide financial statements because the
District cannot use these assets to finance its operations.
FINANCIAL ANALYSIS OF THE DISTRICT AS A WHOLE (in thousands)
Net position. The District's combined net position is $6,434 on June 30, 2018 (see Table A-1). The majority
of the total net position is attributed to governmental activities (99%).

Total
Percentage
Change
2017 2018 2017 2018 2017 2018 2017-2018
Current and Other Assets 2,578.$ 2,290.$ 228.$ 212.$ 2,806.$ 2,502.$ -10.8%
Capital Assets 7,539. 7,941. 27. 14. 7,566. 7,955. 5.1%
Total Assets 10,117.$ 10,231.$ 255.$ 226.$ 10,372.$ 10,457.$ 0.8%
Deferred Outflows of Resources 1,004.$ 749.$ 31.$ 23.$ 0.$ 772.$ 0.0%
Current Liabilities 281.$ 210.$ 132.$ 90.$ 413.$ 300.$ -27.4%
Noncurrent Liabilities 4,894. 3,970. 77. 58. 4,971. 4,028. -19.0%
Total Liabilities 5,175.$ 4,180.$ 209.$ 148.$ 5,384.$ 4,328.$ -19.6%
Deferred Inflows of Resources 4.$ 453.$ 0.$ 14.$ 0.$ 467.$ 0.0%
Net Position
Invested in Capital Assets
Net of Related Debt 5,263.$ 5,980.$ 27.$ 14.$ 5,290.$ 5,994.$ 13.3%
Restricted 2,253. 1,988. 0. 0. 2,253. 1,988. -11.8%
Unrestricted (1,574.) (1,621.) 50. 73. (1,524.) (1,548.) 1.6%
Total Net Position 5,942.$ 6,347.$ 77.$ 87.$ 6,019.$ 6,434.$ 6.9%
Total
School District
Table A-1
Lawrence Township Board of Education's Net Position
(in thousands of dollars)
Governmental
Activities
Business-type
Activities
Changes in net position. The District's total revenues are $13,018 for the fiscal period ending June 30, 2018
(see Table A-2). Property taxes and state formula aid accounted for 73% of the District's revenue. 18% is
derived from state and federal aid for specific programs, and the remainder, 3% from fees charged for
services and miscellaneous resources.
The District's expenses are predominantly related to educating and caring for students 45%. The purely
administrative activities of the District accounted for 5% of total costs.
Governmental Activities
Revenues for the District's governmental activities amounted to $12,664. Total expenses amounted to
$12,259. The increase in net position in governmental activities was $405 for 2018.
Business-type Activities
Revenues of the District's business-type activities amounted to $354, and expenses were $343. Factors
contributing to these results included:
• Food Services: Contracted Service
• Child Care services had $14 in revenue in excess of expenses

Total
Percentage
Change
2017 2018 2017 2018 2017 2018 2017-2018
Revenues
Program Revenues
Charges for Sevices 181.$ 184.$ 162.$ 178.$ 343.$ 362.$ 5.5%
Federal & State Categorical Grants 2,278. 2,907. 197. 186. 2,475. 3,093. 25.0%
General Revenues
Property Taxes 2,346. 2,381. 0. 0. 2,346. 2,381. 1.5%
State Formula Aid 7,006. 7,170. 0. 0. 7,006. 7,170. 2.3%
Other 3. 22. 18. (10.) 21. 12. -42.9%
Total Revenues 11,814.$ 12,664.$ 377.$ 354.$ 12,191.$ 13,018.$ 6.8%
Expenses
Instruction - Related 3,376.$ 3,478.$ 0.$ 0.$ 3,376.$ 3,478.$ 3.0%
Student Support Services 2,926. 1,614. 373. 343. 3,299. 1,957. -40.7%
Maintenance & Operations 492. 485. 0. 0. 492. 485. -1.4%
Transportation 647. 723. 0. 0. 647. 723. 11.7%
Administration 611. 571. 0. 0. 611. 571. -6.5%
Other 3,843. 5,388. 0. 0. 3,843. 5,388. 40.2%
Total Expenses 11,895.$ 12,259.$ 373.$ 343.$ 12,268.$ 12,602.$ 2.7%
Increase/ (decrease) in Net Position (81.)$ 405.$ 4.$ 11.$ (77.)$ 416.$ 4.1%
Table A-2
Total
School District
Changes in Net Position
Lawrence Township Board of Education's
(in thousands of dollars)
Governmental
Activities
Business-type
Activities
FINANCIAL ANALYSIS OF THE DISTRICT'S FUNDS (in thousands)
The strong financial performance of the District as a whole is primarily reflected in its governmental funds.
As the district completed the year, its governmental funds reported combined balances of $1,660 including $0
in the Capital Projects Fund. The District controlled expenditures.
General Fund Budgetary Highlights
Over the course of the year, the District revised the annual operating budget several times. These budget
amendments were for the following purpose:
• Transfers between budgetary line accounts to prevent overruns
The District's final budget anticipated utilizing $879 in fund balance and $1 of prior year encumbrances to
fund the appropriation plan for this fiscal period. Actual operations resulted in a decrease in the General
Fund balance of $164.
Actual expenditures for capital outlay amounted to $15 in the Operating Fund, $0 in the Special Revenue
Fund and $623 in the Capital Projects Fund.
CAPITAL ASSET AND DEBT ADMINISTRATION (in thousands)
Capital Assets
By the end of 2018, the District had invested $11,875 in a broad range of capital assets, including school
buildings, athletic facilities, computer and audiovisual equipment, and administrative offices. (see Table A-3)
(more detailed information about capital assets can be found in Note 7 to the financial statements.) Total
depreciation expense for the year was $232 while building improvements and additions to equipment and
furniture amounted to $637.

Total
Percentage
Change
2017 2018 2017 2018 2017 2018 2017-2018
Land 25.$ 25.$ 0.$ 0.$ 25.$ 25.$ 0.0%
Construction in Progress 0. 4. 0. 0. 0. 4. 0.0%
Site Improvements 23. 29. 0. 0. 23. 29. 26.1%
Buildings & Improvements 7,402. 7,814. 0. 0. 7,402. 7,814. 5.6%
Machinery & Equipment 85. 66. 31. 17. 116. 83. -28.4%
Total 7,535.$ 7,938.$ 31.$ 17.$ 7,566.$ 7,955.$ 5.1%
Table A-3
Total
School District
Lawrence Township Board of Education's Capital Assets
(in thousands of dollars)
Governmental
Activities
Business-type
Activities
(Net of Depreciation)
Long-term Debt
At year end, the District had outstanding bonds in the amount of $1,961 and capital leases payable of $0.
(More detailed information about long term debt can be found in Note 9 to the financial statements.)
The state limits the amount of general obligation debt the District can issue to 3% of the equalized valuation
of all taxable property within the District. The current limit is $6,556 of which $4,595 is available for the
issuance of the debt.
FACTORS BEARING ON THE DISTRICT’S FUTURE
Becoming a choice district has helped the district maintain current programs, however, the restriction on the
amount the school may raise in taxes is always a concern for future budgets and any unforeseen expenditures.
CONTACTING THE DISTRICT’S FINANCIAL MANAGEMENT
This financial report is designed to provide our citizens, taxpayers, customers, investors and creditors with a
general overview of the District’s finances and to demonstrate the District’s accountability for the money it
receives. If you have questions about this report or need additional financial information, contact Lisa M.
DiNovi, School Business Administrator, Lawrence Township Board of Education, 225 Main Street,
Cedarville, NJ 08311.
BASIC FINANCIAL STATEMENTS
DISTRICT-WIDE FINANCIAL STATEMENTS

EXHIBIT A-1
Governmental
Activities
Business-Type
Activities Total
ASSETS:
Cash and Cash Equivalents 2,139,033.$ 70,390.$ 2,209,423.$
Receivables, Net 151,139. 135,728. 286,867.
Inventory 0. 4,762. 4,762.
Capital Assets, Net 7,941,113. 13,924. 7,955,037.
Total Assets Total Assets 10,231,285. 224,804. 10,456,089.
DEFERRED OUTFLOWS OF RESOURCES: 748,878. 23,249. 772,127.
LIABILITIES:
Accounts Payable 69,592. 64,900. 134,492.
Interfund Payable (1,782.) 1,782. 0.
Pension Account Payable 96,820. 3,030. 99,850.
Unearned Revenue 21,338. 20,377. 41,715.
Accrued Interest 23,835. 0. 23,835.
Noncurrent Liabilities
Due within One Year 320,000. 0. 320,000.
Due in More than One Year 1,813,090. 0. 1,813,090.
Net Pension Liability 1,837,487. 57,515. 1,895,002.
Total Liabilities 4,180,380. 147,604. 4,327,984.
DEFERRED INFLOWS OF RESOURCES: 452,577. 14,042. 466,619.
NET POSITION:
Invested in Capital Assets, Net of Related Debt 5,980,113. 13,924. 5,994,037.
Restricted for:
Capital Projects 544,632. 0. 544,632.
Other Purposes. 1,443,577. 0. 1,443,577.
Unrestricted (1,621,116.) 72,483. (1,548,633.)
Total Net Position 6,347,206$ 86,407$ 6,433,613$
See Accompanying Notes to the Basic Financial Statements
LAWRENCE TOWNSHIP SCHOOL DISTRICT
STATEMENT OF NET POSITION
JUNE 30, 2018
4

EX
HIB
IT A
-2
Pro
gra
m R
evenues
Charg
es for
Opera
ting G
rants
C
apital G
rants
G
overn
menta
lB
usin
ess-t
ype
Functions/P
rogra
ms
Expenses
Serv
ices
and C
ontr
ibutions
and C
ontr
ibutions
Activitie
sA
ctivitie
sT
ota
l
G
overn
menta
l activitie
s:
In
str
uction:
R
egula
r2,4
87,0
54.
$
0.
$
0.
$
0.
$
(2,4
87,0
54.)
$
0.
$
(2,4
87,0
54.)
$
S
pecia
l education
907,8
19.
0.
0.
0.
(907,8
19.)
0.
(907,8
19.)
O
ther
specia
l in
str
uction
40,5
60.
0.
0.
0.
(40,5
60.)
0.
(40,5
60.)
O
ther
instr
uction
42,0
64.
0.
0.
0.
(42,0
64.)
0.
(42,0
64.)
S
upport
serv
ices:
T
uitio
n1,6
13,7
47.
0.
0.
0.
(1,6
13,7
47.)
0.
(1,6
13,7
47.)
S
tudent &
instr
uction r
ela
ted s
erv
ices
847,4
59.
0.
0.
0.
(847,4
59.)
0.
(847,4
59.)
S
chool adm
inis
trative s
erv
ices
184,1
13.
0.
0.
0.
(184,1
13.)
0.
(184,1
13.)
G
enera
l and b
usin
ess a
dm
inis
trative s
erv
ices
206,6
93.
0.
0.
0.
(206,6
93.)
0.
(206,6
93.)
C
entr
al serv
ices
154,3
23.
0.
0.
0.
(154,3
23.)
0.
(154,3
23.)
A
dm
in info
tech
25,7
14.
0.
0.
0.
(25,7
14.)
0.
(25,7
14.)
P
lant opera
tions a
nd m
ain
tenance
484,9
59.
0.
0.
0.
(484,9
59.)
0.
(484,9
59.)
P
upil
transport
ation
723,3
59.
0.
0.
0.
(723,3
59.)
0.
(723,3
59.)
E
mplo
yee b
enefits
4,2
50,2
15.
0.
2,9
07,4
24.
0.
(1,3
42,7
91.)
0.
(1,3
42,7
91.)
T
ransfe
r to
chart
er
school
50,5
69.
0.
0.
0.
(50,5
69.)
0.
(50,5
69.)
In
tere
st on long-t
erm
debt
77,3
20.
0.
0.
0.
(77,3
20.)
0.
(77,3
20.)
N
J d
ebt serv
ice a
ssessm
ent
40,0
20.
0.
0.
0.
(40,0
20.)
0.
(40,0
20.)
In
tern
al serv
ice fund
123,9
52.
184,0
00.
0.
0.
60,0
48.
0.
60,0
48.
T
ota
l govern
menta
l activitie
s12,2
59,9
40.
184,0
00.
2,9
07,4
24.
0.
(9,1
68,5
16.)
0.
(9,1
68,5
16.)
B
usin
ess-t
ype a
ctivitie
s:
F
ood S
erv
ice
310,2
65.
131,3
74.
185,8
70.
0.
0.
6,9
79.
6,9
79.
C
hild
Care
32,5
06.
46,2
83.
0.
0.
0.
13,7
77.
13,7
77.
T
ota
l busin
ess-t
ype a
ctivitie
s342,7
71.
177,6
57.
185,8
70.
0.
0.
20,7
56.
20,7
56.
Tota
l prim
ary
govern
ment
12,6
02,7
11.
$
361,6
57.
$
3,0
93,2
94.
$
0.
$
(9,1
68,5
16.)
$
20,7
56.
$
(9,1
47,7
60.)
$
Genera
l re
venues:
Taxes:
P
ropert
y ta
xes, le
vie
d for
genera
l purp
oses,n
et
2,2
48,4
72.
$
0.
$
2,2
48,4
72.
$
T
axes levie
d for
debt serv
ice
132,5
82.
0.
132,5
82.
Federa
l and S
tate
aid
not re
str
icte
d
6,2
44,3
14.
0.
6,2
44,3
14.
Federa
l and S
tate
aid
restr
icte
d
925,9
21.
0.
925,9
21.
Investm
ent E
arn
ings
5,8
71.
209.
6,0
80.
Mis
cella
neous Incom
e19,7
28.
0.
19,7
28.
Prior
year
adju
stm
ent-
equip
ment
(3,7
91.)
(10,2
86.)
(14,0
77.)
Tota
l genera
l re
venues, specia
l item
s, extr
aord
inary
ite
ms a
nd tra
nsfe
rs9,5
73,0
97.
(10,0
77.)
9,5
63,0
20.
C
hange in N
et P
ositio
n404,5
81.
10,6
79.
415,2
60.
Net P
ositio
n—
begin
nin
g5,9
42,6
26.
75,7
28.
6,0
18,3
54.
Net P
ositio
n—
endin
g6,3
47,2
07.
$
86,4
07.
$
6,4
33,6
14.
$
LA
WR
EN
CE
TO
WN
SH
IP S
CH
OO
L D
IST
RIC
T
ST
AT
EM
EN
T O
F A
CT
IVIT
IES
FO
R T
HE
YE
AR
EN
DE
D J
UN
E 3
0, 2018
Net (E
xpense)
Revenue a
nd C
hanges in N
et A
ssets
See A
ccom
panyi
ng N
ote
s to the B
asic
Fin
ancia
l S
tate
ments
5

FUND FINANCIAL STATEMENTS

GOVERNMENTAL FUNDS

EXHIBIT B-1
Special Capital Debt Total
General Revenue Projects Service Permanent Governmental
Fund Fund Fund Fund Fund Funds
Assets:
Cash and cash equivalents 1,547,875.$ 49,843.$ 0.$ 777.$ 0.$ 1,598,495.$
Tax levy receivable 187,372. 0. 0. 11,048. 0. 198,420.
Due from other funds 11,824. 0. 0. 0. 0. 11,824.
Receivables from other governments 58,879. 400. 0. 0. 0. 59,279.
Total assets 1,805,950.$ 50,243.$ 0.$ 11,825.$ 0.$ 1,868,018.$
Liabilities and Fund Balances:
Liabilities:
Accounts payable 12,618.$ 56,974.$ 0.$ 0.$ 0.$ 69,592.$
Interfund payable 104,778. 0. 0. 11,824. 0. 116,602.
Unearned revenue 0. 21,338. 0. 0. 0. 21,338.
Total liabilities 117,396. 78,312. 0. 11,824. 0. 207,532.
Fund Balances:
Restricted for:
Excess surplus - current year 235,324. 0. 0. 0. 0. 235,324.
Excess surplus - designated for
subsequent year's expenditures 218,891. 0. 0. 0. 0. 218,891.
Maintenance reserve 338,000. 0. 0. 0. 0. 338,000.
Emergency reserve 250,000. 0. 0. 0. 0. 250,000.
Capital reserve 544,632. 0. 0. 0. 0. 544,632.
Tuition reserve 298,900. 0. 0. 0. 0. 298,900.
Committed to:
Other purposes 83,279. 0. 0. 0. 0. 83,279.
Assigned to:
Debt service 0. 0. 0. 1. 0. 1.
Designated by BOE for subsequent
year's expenditures 19,182. 0. 0. 0. 0. 19,182.
Unassigned:
General fund (299,654.) 0. 0. 0. 0. (299,654.)
Special revenue fund 0. (28,069.) 0. 0. 0. (28,069.)
Total fund balances 1,688,554. (28,069.) 0. 1. 0. 1,660,486.
Total liabilities and fund balances 1,805,950.$ 50,243.$ 0.$ 11,825.$ 0.$
Amounts reported for governmental activities in the statement of
net assets (A-1) are different because:
Capital assets used in governmental activities are not financial resources
and therefore are not reported in the funds. The cost of the assets is
$11,875,168. and the accumulated depreciation is $3,936,930. (See Note 7) 7,938,238.$
Long-term liabilities, including bonds payable, are not due and payable
in the current period and therefore are not reported as liabilties in the funds.
(See Note 9) (2,156,925.)
Internal service fund net position 424,897.
Pension related items:
Deferred outflow of resources 694,795.$
Deferred inflow of resources (419,897.)
Pension account payable (89,817.)
Net pension liability (1,704,571.)
Total pension related items (1,519,490.)
Net assets of governmental activities 6,347,206.$
LAWRENCE TOWNSHIP SCHOOL DISTRICT
BALANCE SHEET
GOVERNMENTAL FUNDS
JUNE 30, 2018
See Accompanying Notes to the Basic Financial Statements
6

EXHIBIT B-2
Special Capital Debt Total
General Revenue Projects Service Permanent Governmental
Fund Fund Fund Fund Fund Funds
REVENUES:
Local sources:
Local tax levy 3,456,963.$ 0.$ 0.$ 198,842.$ 0.$ 3,655,805.$
Tuition charges 58,630. 58,630.
Interest Earned 2,990. 2,990.
Miscellaneous 88,430. 1,778. 90,208.
Total - local sources 3,607,013. 1,778. 0. 198,842. 0. 3,807,633.
State sources 4,546,481. 112,310. 4,658,791.
Federal sources 20,464. 325,155. 345,619.
Total revenues 8,173,958. 326,933. 0. 311,152. 0. 8,812,043.
EXPENDITURES:
Current:
Regular instruction 2,494,417. 2,494,417.
Special education instruction 632,348. 284,128. 916,476.
Other special instruction 26,325. 26,325.
Other instruction 92,701. 92,701.
Support services:
Tuition 55,085. 55,085.
Student & instruction related services 774,359. 20,242. 794,601.
Other administrative services 158,730. 158,730.
School administrative services 103,271. 103,271.
Central services 196,643. 196,643.
Admin info tech 19,282. 19,282.
Plant operations and maintenance 764,091. 764,091.
Pupil transportation 538,917. 538,917.
Employee benefits 2,175,466. 22,563. 2,198,029.
Debt service:
Principal 235,000. 235,000.
Interest and other charges 75,055. 75,055.
Capital outlay 97,112. 177,416. 274,528.
Transfer to charter schools 887. 887.
Total expenditures 8,129,634. 326,933. 177,416. 310,055. 0. 8,944,038.
Excess (deficiency) of revenues over exp. 44,324. 0. (177,416.) 1,097. 0. (131,995.)
OTHER FINANCING SOURCES (USES):
Transfers in 42,559. 825,983. 868,542.
Transfers out (825,983.) (42,559.) (868,542.)
Total other financing sources and (uses) (783,424.) 0. 783,424. 0. 0. 0.
Net change in fund balance (739,100.) 0. 606,008. 1,097. 0. (131,995.)
Fund balance—July 1 2,340,904. 0. 212,841. (1,097.) 0. 2,552,648.
Fund balance—June 30 1,601,804.$ 0.$ 818,849.$ 0.$ 0.$ 2,420,653.$
HOPEWELL TOWNSHIP BOARD OF EDUCATION
STATEMENT OF REVENUES, EXPENDITURES, AND CHANGES IN FUND BALANCES
GOVERNMENTAL FUNDS
FOR THE YEAR ENDED JUNE 30, 2018
See Accompanying Notes to the Basic Financial Statements
7

EXHIBIT B-3
HOPEWELL TOWNSHIP SCHOOL DISTRICT
RECONCILATION OF THE STATEMENT OF REVENUES, EXPENDITURES,
AND CHANGES IN FUND BALANCES OF GOVERNMENTAL FUNDS
TO THE STATEMENT OF ACTIVITIES
FOR THE YEAR ENDED JUNE 30, 2018
Total net changes in fund balances - governmental funds (from B-2) (131,995.)$
Amounts reported for governmental activities in the statement of activities (A-2)
are different because:
Capital outlays are reported in governmental funds as expenditures. However, in the statement of
activities, the cost of those assets is allocated over their estimated useful lives as depreciation
expense.
This is the amount by which capital outlays exceeded depreciation in the period.
Depreciation expense (292,748.)
Capital outlays 257,346. (35,402.)
Adjustment to fixed assets
Repayment of bond principal is an expenditure in the governmental funds, but the repayment reduces
long-term liabilities in the statement of net assets and is not reported in the statement of activities.
Principal paid on bonds 235,000.
Principal paid on lease purchase 0. 235,000.
Decrease in accrued interest 2,998.
Proceeds from debt issues are a financing source in the governmental funds. They are not revenue
in the statement of activities; issuing debt increases long-term liabilities in the statement of net assets.
Proceeds of long-term debt 0.
Capital lease proceeds 0. 0.
In the statement of activities, certain operating expenses, e.g., compensated absences (vacations) are
measured by the amounts earned during the year. In the governmental funds, however, expenditures
for these items are reported in the amount of financial resources used (paid). When the earned amount
exceeds the paid amount, the difference is reduction in the reconciliation (-); when the paid amount
exceeds the earned amount the difference is an addition to the reconciliation (+). (8,194.)
Increase in pension expense (1,116,924.)
Increase in on-behalf pension payments 1,100,928.
Increase in internal service fund 0.
Change in net position of governmental activities 46,411.$
See Accompanying Notes to the Financial Statements
8

PROPRIETARY FUNDS
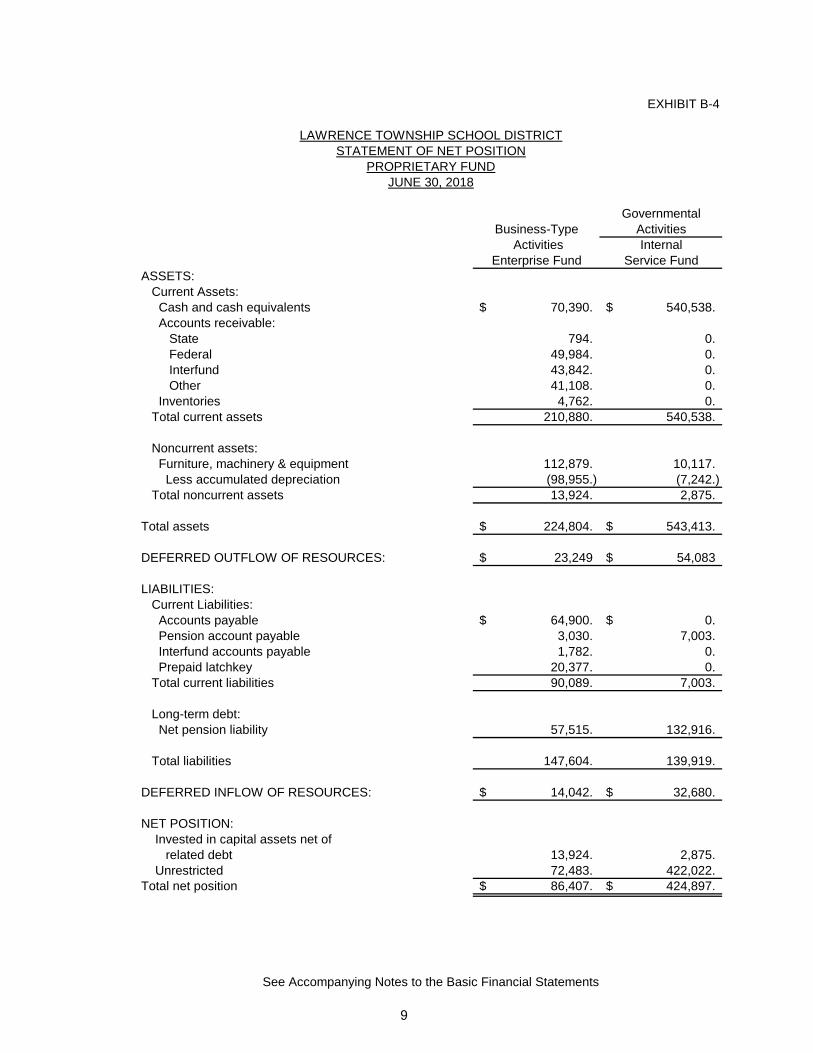
EXHIBIT B-4
Governmental
Business-Type Activities
Activities Internal
Enterprise Fund Service Fund
ASSETS:
Current Assets:
Cash and cash equivalents 70,390.$ 540,538.$
Accounts receivable:
State 794. 0.
Federal 49,984. 0.
Interfund 43,842. 0.
Other 41,108. 0.
Inventories 4,762. 0.
Total current assets 210,880. 540,538.
Noncurrent assets:
Furniture, machinery & equipment 112,879. 10,117.
Less accumulated depreciation (98,955.) (7,242.)
Total noncurrent assets 13,924. 2,875.
Total assets 224,804.$ 543,413.$
DEFERRED OUTFLOW OF RESOURCES: 23,249$ 54,083$
LIABILITIES:
Current Liabilities:
Accounts payable 64,900.$ 0.$
Pension account payable 3,030. 7,003.
Interfund accounts payable 1,782. 0.
Prepaid latchkey 20,377. 0.
Total current liabilities 90,089. 7,003.
Long-term debt:
Net pension liability 57,515. 132,916.
Total liabilities 147,604. 139,919.
DEFERRED INFLOW OF RESOURCES: 14,042.$ 32,680.$
NET POSITION:
Invested in capital assets net of
related debt 13,924. 2,875.
Unrestricted 72,483. 422,022.
Total net position 86,407.$ 424,897.$
See Accompanying Notes to the Basic Financial Statements
LAWRENCE TOWNSHIP SCHOOL DISTRICT
STATEMENT OF NET POSITION
PROPRIETARY FUND
JUNE 30, 2018
9

EXHIBIT B-5
Governmental
Business-Type Activities -
Activities Internal
Enterprise Fund Service Fund
Operating revenues:
Changes for services:
Daily sales-reimbursable programs 37,238.$ 0.$
Daily sales-nonreimbursable pgms 94,136. 0.
Charges for services 46,283. 184,000.
Total operating revenues 177,657. 184,000.
Operating expenses
Cost of sales - reimbursable 84,401. 0.
Cost of sales - nonreimbursable 30,432. 0.
Salaries and fringe benefits 152,061. 115,189.
Pension expense 2,832. 6,607.
Purchased services 933. 0.
Miscellaneous 8,701. 682.
General Supplies 25,241. 324.
Repairs and Maintenance 651. 0.
Management fees 35,000. 0.
Depreciation 2,519. 1,150.
Total operating expenses 342,771. 123,952.
Operating income/(loss) before transfer (165,114.) 60,048.
Operating transfer in/out:
Operating transfer in/(out) 0. 0.
Operating income/(loss) (165,114.) 60,048.
Nonoperating revenues (expenses):
State sources:
State school lunch program 2,676. 0.
Federal sources:
National school breakfast program 37,300. 0.
National school lunch program 120,059. 0.
National afterschool snack 8,927. 0.
Food distribution program 16,908. 0.
Interest 209. 0.
Total nonoperation revenues (expenses) 186,079. 0.
Change in net position 20,965. 60,048.
Total net position- beginning 75,728. 364,849.
Prior year adjustment-equipment (10,286.) 0.
Total net position - ending 86,407.$ 424,897.$
See Accompanying Notes to the Basic Financial Statements
LAWRENCE TOWNSHIP SCHOOL DISTRICT
STATEMENT OF REVENUES, EXPENSES, AND CHANGES IN FUND NET POSITION
PROPRIETARY FUND
JUNE 30, 2018
10

EXHIBIT B-6
Governmental
Business-Type Activities -
Activities Internal
Enterprise Funds Service Fund
CASH FLOWS FROM OPERATING ACTIVITES:
Receipts from customers/grantors 110,831.$ 184,000.$
Payments to suppliers (304,571.) (1,006.)
Payments to employees 45,244. (115,189.)
Other receipts/(payments) (61,672.) 0.
Net cash provided by (used for) operating account (210,168.) 67,805.
CASH FLOWS FROM NONCAPITAL FINANCING ACTIVITIES:
State Sources 2,068. 0.
Federal Sources 127,460. 0.
Net cash provided by (used for) non-capital financing activities 129,528. 0.
CASH FLOWS FROM INVESTING ACTIVITIES:
Interest on investments 209. 0.
Net cash provided by investing activities 209. 0.
Net increase (decrease) in cash and cash equivalents (80,431.) 67,805.
Balances - beginning of year 150,821. 472,733.
Balances - end of year 70,390.$ 540,538.$
Reconciliation of operating income (loss)
to net cash provided (used) by operating activities:
Operating income (loss) (165,114.)$ 60,048.$
Adjust to reconcile operating income (loss) to net
cash provided by (used for) operating activities:
Depreciation and net amortization 2,519. 1,150.
Federal commodities 16,908. 0.
(Increase)/decrease in accts rec., net (27,444.) 0.
(Increase)/decrease in inventories 656. 0.
(Increase)/decrease in intergovernmental receivable 2,746. 0.
(Increase)/decrease in outflow of resources 7,890. 18,410.
Increase/(decrease) in accounts payable (50,518.) 0.
Increase/(decrease) in interfund accounts payable 582. 0.
Increase/(decrease) in pension accounts payable 701. 1,635.
Increase/(decrease) in prepaid latchkey 6,665. 0.
Increase/(decrease) in deferred inflow of resources 13,877. 32,379.
Increase/(decrease) in net pension liability (19,636.) (45,817.)
Total adjustments (45,054.) 7,757.
Net cash provided by (used for) operating activities (210,168.)$ 67,805.$
See Accompanying Notes to the Basic Financial Statements
LAWRENCE TOWNSHIP SCHOOL DISTRICT
STATEMENT OF CASH FLOWS
PROPRIETARY FUND
FOR YEAR ENDED JUNE 30, 2018
11

FIDUCIARY FUNDS

EX
HIB
IT B
-7
Un
em
plo
ym
en
t P
riva
te P
urp
ose
Pa
yro
ll/
Co
mp
en
sa
tio
nF
lex-S
avin
gs
Sch
ola
rsh
ipA
ge
ncy
Stu
de
nt
Tru
st
Acco
un
tF
un
dF
un
dA
ctivity
AS
SE
TS
:
Ca
sh
an
d C
ash
Eq
uiv
ale
nts
8
5,8
53
.$
68
4.
$
9,7
75
.$
9,2
42
.$
17
,60
8.
$
Du
e f
rom
Ag
en
cy
9,9
27
.
0.
0.
0.
0.
Inte
rfu
nd
Re
ce
iva
ble
6
0,0
00
.
0.
0.
2,7
18
.
0.
To
tal A
sse
ts
15
5,7
80
.$
68
4.
$
9,7
75
.$
11
,96
0.
$
17
,60
8.
$
DE
FE
RR
ED
OU
TF
LO
W O
F R
ES
OU
RC
ES
:0
.$
0.
$
0.
$
0.
$
0.
$
LIA
BIL
ITIE
S:
Du
e to
Stu
de
nt G
rou
ps
0.
$
0.
$
0.
$
0.
$
17
,60
8.
$
Du
e to
Pa
yro
ll W
ith
ho
ldin
gs
0.
0.
0.
2,0
33
.
0.
Du
e to
Un
em
plo
ym
en
t 0
.
0.
0.
9,9
27
.
0.
To
tal L
iab
ilitie
s
0.
0.
0.
11
,96
0.
17
,60
8.
DE
FE
RR
ED
IN
FL
OW
OF
RE
SO
UR
CE
S:
0.
0.
0.
0.
$
0.
$
NE
T P
OS
ITIO
N:
He
ld in
Tru
st fo
r U
ne
mp
loym
en
t C
laim
s
15
5,7
80
.$
Re
se
rve
d M
ed
ica
l R
eim
bu
rse
me
nts
68
4.
$
Re
se
rve
d f
or
Sch
ola
rsh
ips
9,7
75
.$
AS
OF
JU
NE
30
, 2
01
8
FID
UC
IAR
Y F
UN
DS
ST
AT
EM
EN
T O
F F
IDU
CIA
RY
NE
T P
OS
ITIO
N
LA
WR
EN
CE
TO
WN
SH
IP S
CH
OO
L D
IST
RIC
T
Se
e A
cco
mp
an
yin
g N
ote
s to
th
e B
asic
Fin
an
cia
l S
tate
me
nts
12

EXHIBIT B-8
Unemployment Private Purpose
Compensation Flex-Savings Scholarship
Trust Account Fund
ADDITIONS:
Contributions:
Plan Member 7,494.$ 6,280.$ 0.$
Other 0. 351. 2,698.
Board Contribution 30,000. 0. 0.
Total Contributions 37,494. 6,631. 2,698.
Investment Earnings:
Interest 174. 3. 20.
Net Investment Earnings 174. 3. 20.
DEDUCTIONS:
Scholarships Awarded 0. 0. 3,000.
Medical Reimbursement 0. 5,947. 0.
Unemployment Claims 4,679. 0. 428.
Other 174. 3. 0.
Total Deductions 4,853. 5,950. 3,428.
Change in Net Position 32,815. 684. (710.)
NET POSITION, JULY 1 122,965. 0. 10,485.
NET POSITION, JUNE 30 155,780.$ 684.$ 9,775.$
See Accompanying Notes to the Basic Financial Statements
FOR FISCAL YEAR ENDED JUNE 30, 2018
FIDUCIARY FUND
COMBINING STATEMENT OF CHANGES IN FIDUCIARY NET POSITION
LAWRENCE TOWNSHIP SCHOOL DISTRICT
13

NOTES TO FINANCIAL STATEMENTS

LAWRENCE TOWNSHIP SCHOOL DISTRICT
NOTES TO BASIC FINANCIAL STATEMENTS
FOR FISCAL YEAR ENDED JUNE 30, 2018
NOTE 1 – SUMMARY OF SIGNIFICANT ACCOUNTING POLICIES
The Lawrence Township School District is an instrumentality of the State of New Jersey, established to function as an
educational institution. The Board consists of elected officials and is responsible for the fiscal control of the District. A
chief school administrator is appointed by the Board and is responsible for the administrative control of the District.
The financial statements of the Board of Education (Board) of the Lawrence Township School District (District) have
been prepared in conformity with generally accepted accounting principles (GAAP) as applied to governmental units.
The Governmental Accounting Standards Board (GASB) is the accepted standard-setting body for establishing
governmental accounting and financial reporting principles. In its accounting and financial reporting, the District follows
the pronouncements of the Governmental Accounting Standards Board (GASB). The more significant accounting
policies established in GAAP and used by the District are discussed below.
A. Reporting Entity
The Lawrence Township School District is a Type II district located in the County of Cumberland, State of New Jersey.
As a Type II District, the School District functions independently through a Board of Education. The board is comprised
of five (5) members elected to three (3) year terms. The purpose of the district is to educate students in grades K-8. The
Lawrence Township School District had an enrollment at June 30, 2018 of 465 students.
The primary criterion for including activities within the District’s reporting entity, as set forth in Section 2100 of the
GASB Codification of Governmental Accounting and Financial Reporting Standards, is whether:
• the organization is legally separate (can sue or be sued in their own name)
• the District holds the corporate powers of the organization
• the District appoints a voting majority of the organization’s board
• the District is able to impose its will on the organization
• the organization has the potential to impose a financial benefit/burden on the District
• there is a fiscal dependency by the organization on the District
Based on the aforementioned criteria, the District had no component units.
B. Basic Financial Statements – Governmental Wide Financial Statements
The District’s basic financial statements include both government-wide (reporting the District as a whole) and fund
financial statements (reporting the District’s major funds). Both the government-wide and fund financial statements
categorize primary activities as either governmental or business type. The District’s general and special revenue
activities are classified as governmental activities. The District’s food service program is classified as business-type
activities.
In the governmental-wide Statement of Net Position, both the governmental and business-type activities column (a) are
presented on a consolidated basis by column, (b) and are reported on a full accrual, economic resource basis, which
recognizes all long-term assets and receivables as well as long-term debt and obligations. The District’s net position are
reported in three parts-invested in capital assets, net of related debt; restricted net position; and unrestricted net position.
The District first utilizes restricted resources to finance qualifying activities.
The government-wide Statement of Activities reports both the gross and net cost of each of the District’s functions and
business-type activities. The functions are also supported by general government revenues (property taxes, tuition,
certain intergovernmental revenues, etc.). The Statement of Activities reduces gross expenses (including depreciation)
by related program revenues, operating and capital grants. Program revenues must be directly associated with the
function (regular instruction, vocational programs, student & instruction related services, etc.) or a business-type activity.
Operating grants include operating-specific and discretionary (either operating or capital) grants while the capital grants
column reflects capital-specific grants. Program revenue include charges paid by the recipient of the goods or services
offered by the program, and grants and contributions that are restricted to meeting the operational or capital requirements
of a particular program. Revenues that are not classified as program revenue, are presented as general revenues of the
school district.
The net costs (by function or business-type activity) are normally covered by general revenue (property taxes, federal
and state aid, interest income, etc.).
����14

LAWRENCE TOWNSHIP SCHOOL DISTRICT
NOTES TO BASIC FINANCIAL STATEMENTS
FOR FISCAL YEAR ENDED JUNE 30, 2018
NOTE 1 – SUMMARY OF SIGNIFICANT ACCOUNTING POLICIES – (Continued)
B. Basic Financial Statements – Governmental Wide Financial Statements – (Continued)
The government-wide focus is more on the sustainability of the District as an entity and the change in the District’s net
position resulting from the current year’s activities. Fiduciary funds are not included in the government-wide statements.
C. Basic Financial Statements – Fund Financial Statements
The financial transactions of the District are reported in individual funds in the fund financial statements. Each fund is
accounted for by providing a separate set of self-balancing accounts that comprise its assets, liabilities, reserves, fund
equity, revenues and expenditures/expenses. The various funds are reported by generic classification within the financial
statements.
The emphasis in fund financial statements is on the major funds in either the governmental or business-type activities
categories. Nonmajor funds by a category are summarized into a single column. GASBS No. 34 sets forth minimum
criteria (percentage of the assets, liabilities, revenues or expenditures/expenses of either fund category of the
governmental and enterprise combined) for the determination of major funds. The nonmajor funds are combined in a
column in the fund financial statements. The State of New Jersey Department of Education has mandated that all New
Jersey School Districts must report all governmental funds as major, regardless of the fund meeting the GASB definition
of a major fund.
The following fund types are used by the District:
1. Governmental Funds:
The focus of the governmental funds’ measurement (in the fund statements) is upon determination of financial position
and changes in financial position (sources, uses, and balances of financial resources) rather than upon net income. The
following is a description of the governmental funds of the District:
a. General Fund: The general fund is the general operating fund of the District. It is used to account for all
financial resources except those required to be accounted for in another fund. Included are certain expenditures
for vehicles and movable instructional or non-instructional equipment which are classified in the Capital Outlay
sub-fund.
As required by the New Jersey State Department of Education, the District includes budgeted Capital Outlay in
this fund. Generally accepted accounting principles as they pertain to governmental entities state that General
Fund resources may be used to directly finance capital outlays for long-lived improvements as long as the
resources in such cases are derived exclusively from unrestricted revenues.
Resources for budgeted capital outlay purposes are normally derived from State of New Jersey Aid, district
taxes and appropriated fund balance. Expenditures are those that result in the acquisition of or additions to
capital assets for land, existing buildings, improvements of grounds, construction of buildings, additions to or
remodeling of buildings and the purchase of built-in equipment. These resources can be transferred from and
to Current Expense by board resolution.
b. Special Revenue Fund: The Special Revenue Fund is used to account for the proceeds of specific revenue from
State and Federal Government, (other than major capital projects, Debt Service or the Enterprise Funds) and
local appropriations that are legally restricted to expenditures for specified purposes.
c. Capital Projects Fund: The capital projects fund is used to account for all financial resources to be used for the
acquisition or construction of major capital facilities (other than those financed by proprietary funds). The
financial resources are derived from temporary notes or serial bonds that are specifically authorized by the
voters as a separate question on the ballot either during the annual election or at a special election.
d. Debt Service Fund: The debt service fund is used to account for the accumulation of resources for, and the
payment of, principal and interest on bonds issued to finance major property acquisition, construction, and
improvement programs.
���� 15

LAWRENCE TOWNSHIP SCHOOL DISTRICT
NOTES TO BASIC FINANCIAL STATEMENTS
FOR FISCAL YEAR ENDED JUNE 30, 2018
NOTE 1 – SUMMARY OF SIGNIFICANT ACCOUNTING POLICIES – (Continued)
C. Basic Financial Statements – Fund Financial Statements – (Continued)
Fund Balances – Governmental Funds
In the fund financial statements, governmental funds report the following classifications of fund balance:
Nonspendable – includes amounts that cannot be spent because they are either not spendable in form or
are legally or contractually required to be maintained intact.
Restricted – includes amounts restricted by external sources (creditors, laws of other governments, etc.)
or by constitutional provision or enabling legislation.
Committed – includes amounts that can only be used for specific purposes. Committed fund balance is
reported pursuant to resolutions passed be the Board of Education, the District’s highest level of decision
making authority. Commitments may be modified or rescinded only through resolutions approved by
the Board of Education.
Assigned – includes amounts that the District intends to use for a specific purpose, but do not meet the
definition of restricted or committed fund balance. Under the District’s policy, amounts may be
assigned by the Business Administrator.
Unassigned – includes amounts that have not been assigned to other funds or restricted, committed or
assigned to a specific purpose within the General Fund. The District reports all amounts that meet the
unrestricted General Fund Balance Policy described below as unassigned:
The details of the fund balances are included in the Governmental Funds Balance Sheet. When an expenditure is incurred
for purposes for which both restricted or unrestricted fund balance is available, the District considers restricted funds to
been spent first. When an expenditure is incurred for which committed, assigned or unassigned fund balance are
available, the District considers amounts to have been spent first out of committed, then assigned funds and finally
unassigned funds as needed.
2. Proprietary Funds:
The focus of proprietary fund measurement is upon determination of operating income, changes in net position, financial
position, and cash flows. The generally accepted accounting principles applicable are those similar to businesses in the
private sector. The following is a description of the proprietary funds of the District:
a. Enterprise Funds are required to be used to account for operations for which a fee is charged to external users
of goods or services and the activity (a) is financed with debt that is solely secured by a pledge of the net
revenues, (b) has third party requirements that the cost of providing services, including capital costs, be
recovered with fees and charges or (c) establishes fees and charges based on a pricing policy designated to
recover similar costs. The District operates a food service fund to provide a child nutrition program for the
students of the district and a latchkey program to provide afterschool child care to the students of the district.
b. Internal Service Fund are used to charge costs for certain activities to individual funds or other governmental
entities. The District’s internal service fund is comprised of shared business service with other LEA’s.
3. Fiduciary Funds:
Fiduciary Funds are used to report assets held in a trustee or agency capacity for others and therefore are not available to
support District programs. The reporting focus is on net position and changes in net position, and is reported using
accounting principles similar to proprietary funds.
The District’s fiduciary funds are presented in the fiduciary fund financial statements by type (pension, private purpose
and agency). Since by definition these assets are being held for the benefit of a third party (other local governments,
private parties, pension participants, etc.), and cannot be used to address activities or obligations of the government, these
funds are not incorporated into the entity-wide statements.
����16
LAWRENCE TOWNSHIP SCHOOL DISTRICT
NOTES TO BASIC FINANCIAL STATEMENTS
FOR FISCAL YEAR ENDED JUNE 30, 2018
NOTE 1 – SUMMARY OF SIGNIFICANT ACCOUNTING POLICIES – (Continued)
C. Basic Financial Statements – Fund Financial Statements – (Continued)
All fund internal activity is eliminated when carried to the Government-wide statements.
D. Basis of Accounting
Basis of accounting refers to the point at which revenues or expenditures/expenses are recognized in the accounts and
reported in the financial statements. It relates to the timing of the measurements made regardless of the measurement
focus applied.
1. Accrual:
Both governmental and business-type activities in the government-wide financial statements and the proprietary and
fiduciary fund financial statements are presented on the accrual basis of accounting. Revenues are recognized when
earned and expenses are recognized when incurred.
2. Modified Accrual:
The governmental fund financial statements are presented on the modified accrual basis of accounting. Under the
modified accrual basis of accounting, revenues are recorded when susceptible to accrual; i.e., both measurable and
available. “Available” means collectible within the current period or within 60 days after year end. Expenditures are
generally recognized under the modified accrual basis of accounting when the related liability is incurred. The exception
to this general rule is that principal and interest on general obligation long-term debt, if any, is recognized when due.
E. Financial Statement Amounts
1. Cash and Cash Equivalents:
Cash and cash equivalents include petty cash, change funds, cash in banks and all highly liquid investments with a
maturity of three months or less at the time of purchase and are stated at cost plus accrued interest. U.S. Treasury and
agency obligations and certificates of deposit with maturities of one year or less when purchased are stated at cost. All
other investments are stated at fair value.
New Jersey school districts are limited as to the types of investments and types of financial institutions they may invest
in. New Jersey statute 18A:20-37 provides a list of permissible investments that may be purchased by New Jersey school
districts.
Additionally, the District has adopted a cash management plan that requires it to deposit public funds in public funds in
public depositories protected from loss under the provisions of the Government Unit Deposit Protection Act (“GUDPA”).
GUDPA was enacted in 1970 to protect Governmental Units from a loss of funds on deposit with a failed banking
institution in New Jersey.
NJSA 17:9-41 et. seq. establishes the requirements for the security of deposits of governmental units. The statute requires
that no governmental unit shall deposit public funds in a public depository unless such funds are secured in accordance
with the Act. Public depositories include Savings and Loan institutions, banks (both state and national banks) and savings
banks the deposits of which are federally insured. All public depositories must pledge collateral, having a market value
at least equal to five percent of the average daily balance of collected public funds, to secure the deposits of Governmental
Units. If a pubic depository fails, the collateral it has pledged, plus the collateral of all other public depositories, is
available to pay the full amount of their deposits to the Governmental units.
2. Investments:
Investments, including deferred compensation and pension funds, are stated at fair value, (quoted market price or the
best available estimate). Interest earned on investments in the Capital Projects Fund is transferred to the general or debt
service fund.
����17

LAWRENCE TOWNSHIP SCHOOL DISTRICT
NOTES TO BASIC FINANCIAL STATEMENTS
FOR FISCAL YEAR ENDED JUNE 30, 2018
NOTE 1 – SUMMARY OF SIGNIFICANT ACCOUNTING POLICIES – (Continued)
E. Financial Statement Amounts – (Continued)
3. Inventories:
Inventories and prepaid expenses, which benefit future periods, other than those recorded in the enterprise fund are
recorded as an expenditure during the year of purchase.
On district-wide financial statements and in the enterprise fund inventories are valued at cost, which approximates
market, using the first-in-first-out (FIFO) method. Prepaid expenses in the Enterprise Fund represent payments made to
vendors for services that will benefit periods beyond June 30, 2018.
4. Capital Assets:
Capital assets purchased or acquired with an original cost of $2,000 or more are reported at historical cost or estimated
historical cost. Contributed assets are reported at fair market value as of the date received. Additions, improvements
and other capital outlays that significantly extended the useful life of an asset are capitalized. Other costs incurred for
repairs and maintenance are expensed as incurred. Depreciation on all assets is provided on the straight-line basis over
the following estimated useful lives:
Buildings 20-50 years
Machinery and equipment 5-10 years
Improvements 10-20 years
Infrastructure Assets 50-65 years
Infrastructure assets include roads, parking lots, underground pipe, etc. The District includes all infrastructure assets as
depreciable assets in the financial statements.
5. Revenues:
Substantially all governmental fund revenues are accrued. Property taxes are susceptible to accrual and under New
Jersey State Statutes a municipality is required to remit to its school district the entire balance of taxes in the amount
certified, prior to the end of the school year. The District records the entire approved tax levy as revenue (accrued) at
the start of the fiscal year, since the revenue is both measurable and available. Subsidies and grants to proprietary funds,
which finance either capital or current operations are reported as non operating revenue. In respect to grant revenues,
the provider recognizes liabilities and expenses and the recipient recognizes receivables and revenue when the applicable
eligibility requirements, including time requirements are met. Resources transmitted before the eligibility requirements
are met are reported as advances by the provider and unearned revenue by the recipient. Program revenues are reported
as reductions to expenses in the statement of activities.
6. Expenditures:
Expenses are recognized when the related fund liability is incurred. Inventory costs other than those reported in the
enterprise fund are reported in the period when inventory items are purchased, rather than in the period used.
7. Compensated Absences:
Compensated absences are those absences for which employees will be paid, such as vacation, sick leave, and sabbatical
leave. A liability for compensated absences that are attributable to services already rendered, and that are not contingent
on a specific event that is outside the control of the District and its employees, is accrued as the employees earn the rights
to the benefits. Compensated absences that relate to future services, or that are contingent on a specific event that is
outside the control of the District and its employees, are accounted for in the period in which such services are rendered
or in which such events take place.
In governmental and similar trust funds, compensated absences that are expected to be liquidated with expendable
available financial resources are reported as both an expenditure and a fund liability in the fund that will pay for the
compensated absences. The remainder of the compensated absences liability is reported in the District-wide Financial
Statements as a Governmental Activity.
���18

LAWRENCE TOWNSHIP SCHOOL DISTRICT
NOTES TO BASIC FINANCIAL STATEMENTS
FOR FISCAL YEAR ENDED JUNE 30, 2018
NOTE 1 – SUMMARY OF SIGNIFICANT ACCOUNTING POLICIES – (Continued)
E. Financial Statement Amounts – (Continued)
7. Compensated Absences: (Continued)
In proprietary and similar trust funds, compensated absences are recorded as an expense and liability of the fund that will
pay for them.
8. Interfund Activity:
Interfund activity is reported as loans, services provided, reimbursements or transfers. Loans are reported as interfund
receivables and payables as appropriate and are subject to elimination upon consolidation. Services provided, deemed
to be at market or near market rates, are treated as revenues and expenditures/expenses. Reimbursements are when one
fund incurs a cost, charges the appropriate benefitting fund and reduces its related costs as reimbursement. All other
interfund transactions are treated as transfers. Transfers between governmental or proprietary funds are netted as part of
the reconciliation to the government-wide financial statements.
9. Budgets/Budgetary Control:
Annual appropriation budgets are prepared in the spring of each year for the general, special revenue, and debt service
funds. The budgets are submitted to the county office for approval and, as long as the District budget is within State
mandated CAPs, there is no public vote on the budget. If the budget exceeds State mandated CAPs, the voters have an
opportunity to approve or reject the budget at the regular election held in November. Budgets are prepared using the
modified accrual basis of accounting, except for the special revenue fund as described later. The legal level of budgetary
control is established at line item accounts within each fund. Line item accounts are defined as the lowest (most specific)
level of detail as established pursuant to the minimum chart of accounts referenced in N.J.A.C. 6:23-2(g). Transfers of
appropriations may be made by School Board resolution at any time during the fiscal year and are subject to two-thirds
majority vote by the School Board and under certain circumstances require approval by the County Superintendent of
Schools.
Formal budgetary integration into the accounting system is employed as a management control device during the year.
For governmental funds there are no substantial differences between the budgetary basis of accounting and generally
accepted accounting principles with the exception of the legally mandated revenue recognition of the last state aid
payment for budgetary purposes only and the special revenue fund as noted below. Encumbrance accounting is also
employed as an extension of formal budgetary integration in the governmental fund types. Unencumbered appropriations
lapse at fiscal year end.
The accounting records of the special revenue fund are maintained on the grant accounting budgetary basis. The grant
accounting budgetary basis differs from GAAP in that the grant accounting budgetary basis recognizes encumbrances as
expenditures and also recognizes the related revenues, whereas the GAAP basis does not. Sufficient supplemental
records are maintained to allow for the presentation of GAAP basis financial reports.
10. Tuition Receivables:
Tuition charges were established by the Boards of Education based on estimated costs. These rates are subject to change
when the actual cost have been determined.
11. Tuition Payable:
Tuition charges for the fiscal years 2017/18 were based on rates established by the receiving district. These rates are
subjected to change when the actual costs have been determined.
12. Use of Estimates:
The preparation of financial statements in conformity with generally accepted accounting principles requires
management to make estimates and assumptions that affect certain reported amounts and disclosures. Accordingly,
actual results could differ from those results.
���
19
LAWRENCE TOWNSHIP SCHOOL DISTRICT
NOTES TO BASIC FINANCIAL STATEMENTS
FOR FISCAL YEAR ENDED JUNE 30, 2018
NOTE 1 – SUMMARY OF SIGNIFICANT ACCOUNTING POLICIES – (Continued)
E. Financial Statement Amounts – (Continued)
13. Allocation of Costs:
In the government-wide statement of activities, the District has not allocated unallocated benefits to various programs.
14. Pensions
For purposes of measuring the net pension liability, deferred outflows of resources and deferred inflows of resources
related to pensions, and pension expense, information about the fiduciary net position of the Teachers’ Pension and
Annuity Fund (TPAF) and Public Employee Retirement System (PERS) and additions to/deductions from the fiduciary
net position have been determined on the same basis as they are reported by the TPAF and PERS. For this purpose,
benefits payments (including refunds of employee contributions) are recognized when due and payable in accordance
with the benefits terms. Investments are reported at fair value.
F. New Accounting Standards
The district adopted the following GASB statements:
➢ GASB No. 75 – Accounting and Financial Reporting for Postemployment Benefits Other Than Pensions: The
primary objective of this Statement is to improve accounting and financial reporting by state and local governments
for postemployment benefits other than pensions (other postemployment benefits or OPEB). It also improves
information provided by state and local governmental employers about financial support for OPEB that is provided
by other entities. This Statement results from a comprehensive review of the effectiveness of existing standards of
accounting and financial reporting for all postemployment benefits (pensions and OPEB) with regard to providing
decision-useful information, supporting assessments of accountability and interperiod equity, and creating
additional transparency. The requirements of this Statement are effective for reporting periods beginning after June
15, 2017. The adoption of GASB 75, will impact the financial statements of the School District.
➢ GASB No. 85 – Omnibus 2017: The objective of the Statement is to address practice issues that have been identified
during implementation and application of certain GASB Statements. This Statement addresses a variety of topics
including issues related to blending component units, goodwill, fair value measurement and application, and
postemployment benefits (pension and other postemployment benefits [OPEB]). The requirements of Statement
will be effective for reporting periods beginning after June 15, 2017. The adoption of GASB 85, will impact the
financial statements of the School District.
➢ GASB No. 86 – Certain Debt Extinguishment Issues: The primary objective of this Statement is to improve
consistency in accounting and financial reporting for in-substance defeasance of debt by providing guidance for
transactions in which cash and other monetary assets acquired with only existing resources—resources other than
the proceeds of refunding debt—are placed in an irrevocable trust for the sole purpose of extinguishing debt. This
Statement also improves accounting and financial reporting for prepaid insurance on debt that is extinguished and
notes to financial statements for debt that is defeased in substance. The requirements of Statement will be effective
for reporting periods beginning after June 15, 2017. The adoption of GASB 86, did not impact the financial
statements of the School District.
Other accounting standards that the District is currently reviewing for applicability and potential impact on the financial
statements include:
➢ GASB No. 83 – Certain Asset Retirement Obligations: This Statement addresses accounting and financial reporting
for certain asset retirement obligations (AROs). An ARO is a legally enforceable liability associated with the
retirement of a tangible capital asset. A government that has legal obligations to perform future asset retirement
activities related to its tangible capital assets should recognize a liability based on the guidance in this Statement.
The requirements of Statement will effective for reporting periods beginning after June 15, 2018. Management is
evaluating the potential impact of the adoption of GASB 83 on the School District’s financial statements.
����20

LAWRENCE TOWNSHIP SCHOOL DISTRICT
NOTES TO BASIC FINANCIAL STATEMENTS
FOR FISCAL YEAR ENDED JUNE 30, 2018
NOTE 1 – SUMMARY OF SIGNIFICANT ACCOUNTING POLICIES – (Continued)
F. New Accounting Standards – (Continued)
➢ GASB No. 84 – Fiduciary Activities: The objective of the Statement is to improve guidance regarding the
identification of fiduciary activities for accounting and financial reporting purposes and how those activities should
be reported. This Statement establishes criteria for identifying fiduciary activities of all state and local governments.
The focus of the criteria generally is on (1) whether a government is controlling the assets of the fiduciary activity
and (2) the beneficiaries with whom a fiduciary relationship exists. Separate criteria are included to identify
fiduciary component units and postemployment benefits arrangements that are fiduciary activities. The
requirements of Statement will be effective for reporting periods beginning after December 15, 2018. Management
is evaluating the potential impact of the adoption of GASB 84 on the School District’s financial statements.
➢ GASB No. 87 – Leases: The objective of this Statement is to better meet the information needs of financial
statement users by improving accounting and financial reporting for leases by governments. This Statement
increases the usefulness of governments’ financial statements by requiring recognition of certain lease assets and
liabilities for leases that previously were classified as operating leases and recognized as inflows of resources or
outflows of resources based on the payment provisions of the connect. It establishes a single model for lease
accounting based on the foundational principle that leases are financings of the right to use an underlying asset.
Under this Statement, a lessee is required to recognize a lease liability and an intangible right-to-use lease asset,
and a lessor is required to recognize a lease receivable and a deferred inflow of resources, thereby enhancing the
relevance and consistency of information about government’s leasing activities. The requirements of Statement
will be effective for reporting periods beginning after periods beginnings after December 15, 2019. Management
is evaluating the potential impact of the adoption of GASB 87 on the School District’s financial statements.
NOTE 2 - CASH AND CASH EQUIVALENTS AND INVESTMENTS
Cash and cash equivalents includes petty cash, change funds, cash in banks and highly liquid investments with a maturity
of three months or less at the time of purchase and are stated at cost plus accrued interest.
Investments are stated at cost, or amortized cost, which approximates market. The Board classifies U.S. Treasury with
Agency obligations and certificates of deposit, which have original maturity dates of more than three months but less
than twelve months from the date of purchase, as investments stated at cost. All other investments are stated at fair value.
New Jersey school districts are limited as to the types of investments and types of financial institutions in which they
may invest. N.J.S.A. 18A:20-37 provides a list of permissible investments that may be purchased by New Jersey school
districts as follows:
a.) Bonds or other obligations of the United States or obligations guaranteed by the United States.
b.) Bonds or any Federal Intermediate Credit Bank, Federal Home Loan Bank, Federal National Mortgage
Agency or of any United States Bank for Cooperatives which have a maturity date not greater than twelve
months from the date of purchase.
c.) Bonds or other obligations of the school district.
School districts are also permitted to deposit public funds in the State of New Jersey Cash Management Fund. As of
June 30, 2017, the District had no funds on deposit with the New Jersey Cash Management.
Deposits:
N.J.S.A. 17:9-41, et seq, establish requirements for the security of deposits of governmental units. The statutes require
that school districts deposit public funds in public depositories secured in accordance with the Governmental Unit
Deposit Protection Act, which is a multiple financial institution collateral pool enacted in 1970 to protect governmental
units from a loss of funds on deposit with a failed banking institution located in New Jersey, which are insured by the
Federal Deposit Insurance Corporation, the Federal Savings and Loan Insurance Corporation, or by any other agency of
the United States that insures deposits made in public depositories.
Public depositories include State or federally chartered banks, savings banks or associations located in or having a branch
office in the State of New Jersey, the deposits of which are federally insured.
����21

LAWRENCE TOWNSHIP SCHOOL DISTRICT
NOTES TO BASIC FINANCIAL STATEMENTS
FOR FISCAL YEAR ENDED JUNE 30, 2018
NOTE 2 - CASH AND CASH EQUIVALENTS AND INVESTMENTS - (Continued)
Deposits: (Continued)
All public depositories must pledge collateral, having a market value at least equal to 5% of the average daily balance of
collected public funds on deposit, to secure the deposits of Governmental Units. If a public depository fails, the collateral
it has pledged, plus the collateral of all other public depositories, is available to pay the full amount of their deposits to
Governmental Units.
All collateral must be deposited with the Federal Reserve Bank of New York, the Federal Reserve Bank of Philadelphia,
the Federal Home Loan Bank of New Jersey, or a banking institution that is a member of the Federal Reserve System
and has capital funds of not less than $25,000,000.
The school district has adopted a cash management plan that requires it to deposit public funds in public depositories
protected from loss under the Governmental Unit Deposit Protection Act and approves a list of authorized depository
institutions based on an evaluation of solicited responses and presentation of GUDPA certifications provided by the
financial institutions.
As of June 30, 2018, cash and cash equivalents in the fund financial statements of the District consisted of the following:
Cash and Cash
Equivalents
Checking account $ 2,332,590.
TOTAL $ 2,332,590.
Custodial Credit Risk:
Custodial credit presents a risk that in the event of a bank failure, the School District’s deposits may not be returned to
it. The School District’s formal policy regarding custodial credit risk is in compliance with N.J.S.A. 17:9-41 et seq. that
the School District deposit all public funds in public depositories protected from loss under the provisions of GUDPA
Act as previously described.
The District does not place a limit on the amount that may be invested in any one issuer. As of June 30, 2018, the
District’s bank balance $2,950,674 and was insured or collateralized as follows:
Insured by Depository Insurance $ 250,000.
Collateralized under GUDPA 2,700,674.
TOTAL $ 2,950,674.
Interest Rate Risk
Interest rate risk is the risk that changes in interest rates will adversely affect the fair value of an investment.
Credit Risk
Credit risk is the risk that an issuer of an investment will not fulfill its obligations. The District does not have a policy
that restricts investment choices beyond Title 18A:20-37.
NOTE 3 - CAPITAL RESERVE ACCOUNT
A capital reserve account was established by New Jersey school districts for the accumulation of funds for capital outlay
expenditures in subsequent fiscal years. The Capital Reserve Account is maintained in the General Fund and its activity
is included in the General Fund annual budget. Funds placed in the capital reserve account are restricted to capital
projects in the district’s approved Long Range Facilities Plan (LRFP). Upon submission of the LRFP to the department,
a district may deposit funds into the capital reserve at any time upon board resolution through the transfer of
undesignated, unreserved general fund balance that is anticipated in the budget certified for taxes. Post-April, 2005
transfers must be in compliance with P.L.2005, C73 (S1701). Pursuant to N.J.A.C. 6A:23A-14.1(g) the balance in the
account cannot at any time exceed the local support cost of uncompleted capital projects of $688,000 as shown in the
approved LRFP.
����
22

LAWRENCE TOWNSHIP SCHOOL DISTRICT
NOTES TO BASIC FINANCIAL STATEMENTS
FOR FISCAL YEAR ENDED JUNE 30, 2018
NOTE 3 - CAPITAL RESERVE ACCOUNT - (Continued)
The activity of the capital reserve for the July 1, 2017 to June 30, 2018 fiscal year is as follows:
Beginning Balance, July 1, 2017 $ 683,574.
Interest earnings 1,367.
Deposits
Approved in 2017/2018 Budget 0.
Board Resolution 375,000.
Withdrawals
Approved 2017/2018 Budget (400,000.)
Board Resolution (115,309.)
Ending balance, June 30, 2018 $ 544,632.
NOTE 4 - MAINTENANCE RESERVE
The Maintenance reserve account is used to accumulate funds for the required maintenance of a facility in accordance
with the EFCFA (N.J.S.A. 18A:7G-9) as amended by P.L. 2004, c. 73 (S1701). Districts may increase the balance in the
maintenance reserve account by appropriating funds in the annual general fund budget certified for taxes (N.J.A.C.
6A:23-2.14) or by transfer by board resolution at year end of any anticipated revenue or unexpended line item
appropriations, or both.
The activity of the maintenance reserve for the July 1, 2017 to June 30, 2018 year is as follows:
Beginning Balance July 1, 2017 $ 338,000.
Deposits – Board Resolution 0.
Withdrawals – Board Resolution 0.
Ending Balance June 30, 2018 $ 338,000.
The June 30, 2018 maximum maintenance reserve amount is $338,322.
NOTE 5 - EMERGENCY RESERVE
The emergency reserve is used to accumulate funds in accordance with N.J.S.A. 18A:7F-41c (1) to finance unanticipated
general fund expenditures required for a thorough and efficient education. Unanticipated means reasonably
unforeseeable and shall not include additional costs caused by poor planning. The maximum balance permitted at any
time in this reserve is the greater of $250,000 or 1% of the general fund budget not to exceed one million dollars. Deposits
may be made to the emergency reserve account by board resolution at year end of any unanticipated revenue or
unexpended line item appropriation or both. The department has defined year end for the purpose of depositing surplus
into reserve accounts as an amount approved by the district board of education between June 1st and June 30th.
Withdrawals from the reserve require the approval of the commissioner unless the withdrawal is necessary to meet an
increase in total health care costs in excess of four percent.
The activity of the emergency reserve for the July 1, 2017 to June 30, 2018 year is as follows:
Beginning Balance, July 1, 2017 $ 250,000.
Deposits:
Approved in 2017/2018 Budget 0.
Withdrawals 0.
Ending balance, June 30, 2018 $ 250,000.
NOTE 6 - TUITION RESERVE ACCOUNTS
If at the end of the contract year a district board of education anticipates that a large tuition adjustment will be required
in the second year following the contract year, the district board of education may restrict fund balance up to 10 percent
of the estimated tuition cost in the contract year, in a reserve for tuition adjustments. The tuition reserve is available only
for districts that have a sending/receiving relationship. Full appropriation shall be made in the third year and any
remaining balance shall be reserved and designated in the subsequent year’s budget. (N.J.A.C. 6A:23-3.1(f)(8).
����23

LAWRENCE TOWNSHIP SCHOOL DISTRICT
NOTES TO BASIC FINANCIAL STATEMENTS
FOR FISCAL YEAR ENDED JUNE 30, 2018
NOTE 6 - TUITION RESERVE ACCOUNTS – (Continued)
As of June 30, 2018, the district has reserved the following amounts in the tuition reserve accounts:
NOTE 7 - FIXED ASSETS
Capital asset activity for the year ended June 30, 2018 was as follows:
Beginning
Balance
Additions
Retirements
Adjustments
Ending Balance
Governmental Activities:
Capital Assets that are not Being
Depreciated:
Land $ 25,071. $ 0. $ 0. $ 0. $ 25,071.
Deposit 0. 4,336. 0. 0. 4,336.
Total Capital Assets not being
Depreciated
25,071.
4,336.
0.
0.
29,407.
Bldg. & Bldg. Improvements 10,538,341. 623,010. 0. 0. 11,161,351.
Site Improvements 148,357. 0. 0. 10,822. 159,179.
Machinery & Equipment 544,168. 10,932. 0. (29,869.) 525,231.
Totals at Historical Cost 11,230,866. 633,942. 0. (19,047.) 11,845,761.
Less: Accum. Deprec. for:
Bldg. & Bldg. Improvements (3,136,954.) (210,662.) 0. 0. (3,347,616.)
Site Improvements (124,743.) (4,521.) 0. (1,077.) (130,341.)
Machinery & Equipment (458.896.) (16,410.) 0. 16,333. (458.973.)
Total Accum. Depreciation (3,720,593.) (231,593.) 0. 15,256. (3,936,930.)
Total Capital Assets being
depreciated net of Accum.
Depreciation
7,510,273.
402,349.
0.
(3,791).
7,908,831.
Government Activities
Capital Assets, net
$ 7,535,344.
$ 406,685.
$ 0.
$ (3,791.)
$ 7,938,238.
Business-type Activities:
Equipment – Enterprise Fund $ 127,109. $ 0. $ 0. $ (14,230.) $ 112,879.
Equipment – Internal Service
Fund 10,117. 0. 0. 0. 10,117.
Less Accum. Dep for:
Equipment – Enterprise Fund (100,380.) (2,519.) 0. 3,944. (98,955.)
Equipment – Internal Service
Fund (6,092.) (1,150.) 0. 0. (7,242.)
Business-type Activities Capital
Assets, net
$ 30,754.
$ (3,669.)
$ 0.
$ (10,286.)
$ 16,799.
*Depreciation Expense was Charged to Governmental Functions as Follows:
Instruction:
Regular $(127,377.)
Special Education (23,159.)
Support Services:
School Administration (30,107.)
General and Business Administrative Services (30,107.)
Plant Operations and Maintenance (20,843.)
Total Depreciation Expense $(231,593.)
2018-2019 $ 180,000.
2019-2020 118,900.
TOTAL $ 298,900.
����24

LAWRENCE TOWNSHIP SCHOOL DISTRICT
NOTES TO BASIC FINANCIAL STATEMENTS
FOR FISCAL YEAR ENDED JUNE 30, 2018
NOTE 8 - OPERATING LEASES
The District has a commitment for copiers under an operating lease. The lease is for a term of 60 months. Total operating
lease payments made during the year ended June 30, 2018 were $18,108. Future minimum lease payments are as follows:
Year Amount
June 30, 2019 23,772.
June 30, 2020 16,464.
June 30, 2021 8,232.
TOTAL $ 48,468.
NOTE 9 - GENERAL LONG-TERM DEBT
Type of Debt
Balance at
6/30/17
Issued
Retired
Balance at
6/30/17
Amounts
Due
Within 1
Year
Compensated absences payable $ 145,167. $ 26,923. $ 0. $ 172,090. $ 0.
Bonds payable 2,276,000. 0. (315,000.) 1,961,000. 320,000.
Accrued interest on bonds 27,809. 0. (3,974.) 23,835. 23,835.
Total $ 2,448,976. $ 26,923. $ (318,974.) $ 2,156,925. $ 343,835.
A. Bonds Payable:
Bonds are authorized in accordance with State laws by the voters of the municipality through referendums. All bonds
are retired in serial installments within the statutory period of usefulness. Bonds issued by the Board are general
obligation bonds.
On December 27, 2007, the District issued School Refunding Bonds in the amount of $2,345,000 in order to refund all
or a portion of the outstanding callable school bonds of the Board of Education originally issued in the principal amount
of $3,137,000 and dated March 1, 1998. The 1998 bonds are redeemable at the option of the Board of Education in
whole or in part with a 30 day notice of redemption at a price of 100% of the principal amount thereof.
The $2,345,000 Refunding Bonds, included issuance costs of $29,454. $2,296,225 was used to retire bonds from the
1998 issue and $19,321 was returned to the District. The gross debt service savings to the District is $95,645 and the
economic benefit to the District is estimated to be $77,042.
On January 7, 2010, the District issued School Bonds in the amount of $2,216,000 in order to partially finance the
construction of an addition as well as undertake various improvements and renovations to the Myron L. Powell
Elementary School. The total cost of the project is $6,549,146. The project is being permanently funded through the
aforementioned Bonds in the amount of $2,216,000., a grant from the State of New Jersey in the amount of $4,032,260,
the transfer of $300,000 from the Capital Reserve Account and $786 of other available Board funds.
The following is a schedule of the future bond principal and interest payments due as of June 30, 2018.
Year Ending
June 30,
Principal
Interest
Total
2019 $ 320,000. $ 70,363. $ 390,363.
2020 325,000. 58,778. 383,778.
2021 335,000. 46,531. 381.531.
2022 335,000. 33,719. 368,719.
2023 240,000. 20,731. 260,731.
2024-2025 406,000. 15,338. 421,338.
TOTAL $ 1,961,000. $ 245,460. $ 2,206,460.
A. Bond Authorized But Not Issued:
As of June 30, 2018, the Board had no authorized but not issued bonds.
B. Capital Leases Payable:
The district has no capital leases.
����25

LAWRENCE TOWNSHIP SCHOOL DISTRICT
NOTES TO BASIC FINANCIAL STATEMENTS
FOR FISCAL YEAR ENDED JUNE 30, 2018
NOTE 10 – PENSION PLANS
A. Public Employees’ Retirement System (PERS)
Plan Description – The State of New Jersey, Public Employees’ Retirement System (PERS) is a cost-sharing multiple-
employer defined benefit pension plan administered by the State of New Jersey, Division of Pensions and Benefits (the
Division). For additional information about PERS, please refer to Division’s Comprehensive Annual Financial Report
(CAFR) which can be found at www.state.nj.us/treasury/pensions/annrprts.shtml.
The vesting and benefits provisions are set by N.J.S.A. 43:15A. PERS provides retirement, death and disability benefits.
All benefits vest after ten years of service, except for medical benefits, which vest after 25 years of service or under the
disability provisions of PERS.
The following represents the membership tiers for PERS:
Tier Definition
1 Members who were enrolled prior to July 1, 2007
2 Members who were eligible to enroll on or after July 1, 2007 and prior to November 2, 2008
3 Members who were eligible to enroll on or after November 2, 2008 and prior to May 22, 2010
4 Members who were eligible to enroll on or ager May 22, 2010 and prior to June 28, 2011
5 Members who were eligible to enroll on or after June 28, 2011
Service retirement benefits of 1/55th of final average salary for each year of service credit is available to tiers 1 and 2
members upon reaching age 60 and to tier 3 members upon reaching age 62. Service retirement benefits of 1/60th of
final average salary for each year of service credit is available to tier 4 members upon reaching age 62 and tier 5 members
upon reaching age 65. Early retirement benefits are available to tiers 1 and 2 members before reaching age 60, tiers 3
and 4 before age 62 with 25 or more years of service credit and tier 5 with 30 or more years of service credit before age
65. Benefits are reduced by a fraction of a percent for each month that a member retires prior to the age at which a
member can receive full early retirement benefits in accordance with their respective tier. Tier 1 members can receive an
unreduced benefit from age 55 to age 60 if they have at least 25 years of service. Deferred retirement is available to
members who have at least 10 years of service credit and have not reached the service retirement age for the respective
tier.
Contributions - The contribution policy for PERS is set by N.J.S.A. 15A and requires contributions by active members
and contributing employers. State legislation has modified the amount that is contributed by the State. The State's pension
contribution is based on an actuarially determined amount which includes the employer portion of the normal cost and
an amortization of the unfunded accrued liability. Funding for noncontributory group insurance benefits is based on
actual claims paid. For fiscal year 2017, the State's pension contribution was less than the actuarial determined amount.
The local employers' contribution amounts are based on an actuarially determined rate which includes the normal cost
and unfunded accrued liability. Chapter 19, P.L. 2009 provided an option for local employers of PERS to contribute 50%
of the normal and accrued liability contribution amounts certified for payments due in State fiscal year 2009. Such
employers will be credited with the full payment and any such amounts will not be included in their unfunded liability.
The actuaries will determine the unfunded liability of those retirement systems, by employer, for the reduced normal and
accrued liability contributions provided under this law. This unfunded liability will be paid by the employer in level
annual payments over a period of 15 years beginning with the payments due in the fiscal year ended June 30, 2012 and
will be adjusted by the rate of return on the actuarial value of assets.
Pension Liability, Pension Expense and Deferred Outflows/Inflows of Resources - At June 30, 2018, the School District
reported a liability of $1,895,002 for its proportionate share of the PERS net pension liability. The net pension liability
was measured as of June 30, 2017. The total pension liability used to calculate the net pension liability was determined
using update procedures to roll forward the total pension liability from an actuarial valuation as of July 1, 2016, to the
measurement date of June 30, 2017. The School District’s proportion of the net pension liability was based on the School
District’s actual contributions to the plan relative to the total of all participating employers’ contributions for the year
ended June 30, 2017. The School District’s proportion measured as of June 30, 2017, was .0081406038%, which was a
decrease of .054332032% from its proportion measured as of June 30, 2016.
����26

LAWRENCE TOWNSHIP SCHOOL DISTRICT
NOTES TO BASIC FINANCIAL STATEMENTS
FOR FISCAL YEAR ENDED JUNE 30, 2018
NOTE 10 – PENSION PLANS – (Continued)
A. Public Employees’ Retirement System (PERS) – (Continued)
For the year ended June 30, 2018, the School District recognized full accrual pension expense of $160,361 in the
government-wide financial statements. This pension expense was based on the pension plans June 30, 2017 measurement
date. At June 30, 2018 the School District reported deferred outflows of resources and deferred inflows of resources
related to PERS from the following sources:
Deferred Outflows
of Resources
Deferred Inflows
of Resources
Differences between expended and actual experience $ 44,621. $ 0.
Changes of assumptions 381,778. 380,378.
Net difference between projected and actual earnings
on pension plan investments 12,904.
0.
Changes in proportion and difference between School District
contributions and proportionate share of contributions 157,560.
86,241.
School District contributions subsequent to the measurement date 175,264. 0.
Total $ 772,127.
$ 466,619.
$175,264 was reported as deferred outflows of resources related to pensions resulting from school district contributions
subsequent to the measurement date (i.e. for the school year ending June 30, 2018, the plan measurement date is June
30, 2017) will be recognized as a reduction of the net pension liability in the year ended June 30, 2018. Other amounts
reported as deferred outflows of resources and deferred inflows of resources related to pensions will be recognized in
pension expense as follows:
Year ended
June 30,
2019 98,604.
2020 148,797.
2021 90,164.
2022 (119,917.)
2023 (87,404.)
Total $ 130,244.
Actuarial Assumptions
The collective total pension liability for the June 30, 2017 measurement date was determined by an actuarial valuation
as of July 1, 2016, which was rolled forward to June 30, 2017. This actuarial valuation used the following actuarial
assumptions:
Inflation rate
2.25 %
Salary increases:
Through 2026
1.65 – 4.15% based on age
Thereafter 2.65 – 5.15% based on age
Investment rate of return 7.00%
���� 27

LAWRENCE TOWNSHIP SCHOOL DISTRICT
NOTES TO BASIC FINANCIAL STATEMENTS
FOR FISCAL YEAR ENDED JUNE 30, 2018
NOTE 10 – PENSION PLANS – (Continued)
A. Public Employees’ Retirement System (PERS) – (Continued)
Pre-retirement mortality rates were based on the RP-2000 Employee Preretirement Mortality Table for male and female
active participants. For State employees, mortality tables are set back 4 years for males and females. For local employees,
mortality tables are set back 2 years for males and 7 years for females. In addition, the tables provide for future
improvements in mortality from the base year of 2013 using a generational approach based on the plan actuary’s modified
MP-2014 projection scale. Post-retirement mortality rate were based on the RP-2000 Combined Healthy Male and
Female Mortality Tables (setback 1 year for males and females) for service retirements and beneficiaries of former
members and a one-year static projection based on the mortality improvement Scale AA. In addition, the tables for
service retirements and beneficiaries of former members provide for future improvements in mortality from the base year
of 2013 using a generational approach based on the plan actuary’s modified MP-2014 projection scale. Disability
retirement rates used to value disabled retirees were based on the RP-2000 Disabled Mortality Table (set back 3 years
for males and set forward 1 year for females).
The actuarial assumptions used in the July 1, 2016 valuation were based on the results of an actuarial experience study
for the period July 1, 2011 to June 30, 2014. It is likely that future experience will not exactly conform to these
assumptions. To the extent that actual experience deviates from these assumptions, the emerging liabilities may be higher
or lower than anticipated. The more the experience deviates, the larger the impact on future financial statements.
In accordance with State statute, the long-term expected rate of return on plan investments (7.00% at June 30, 2017) is
determined by the State Treasurer, after consultation with the Directors of the Division of Investments and Division of
Pensions and Benefits, the board of trustees and the actuaries. The long-term expected rate of return was determined
using a building block method in which best-estimate ranges of expected future real rates of return (expected returns, net
of pension plan investment expense and inflation) are developed for each major asset class. These ranges are combined
to produce the long-term expected rate of return by weighting the expected future real rates of return by the target asset
allocation percentage and by adding expected inflation. Best estimates of arithmetic rates of return for each major asset
class included in PERS’s target asset allocation as of June 30, 2017 are summarized in the following table:
Asset Class
Target
Allocation
Long-Term
Expected Real
Rate of Return
Absolute Return/Risk Mitigation 5.00% 5.51%
Cash Equivalents 5.50% 1.00%
U.S. Treasuries 3.00% 1.87%
Investment Grade Credit 10.00% 3.78%
Public High Yield 2.50% 6.82%
Global Diversified Credit 5.00% 7.10%
Credit Oriented Hedge Funds 1.00% 6.60%
Debt Related Private Equity 2.00% 10.63%
Debt Related Real Estate 1.00% 6.61%
Private Real Estate 2.50% 11.83%
Equity Related Real Estate 6.25% 9.23%
U.S. Equity 30.00% 8.19%
Non-U.S. Developed Markets Equity 11.50% 9.00%
Emerging Markets Equity 6.50% 11.64%
Buyouts/Venture Capital 8.25% 13.08%
���28
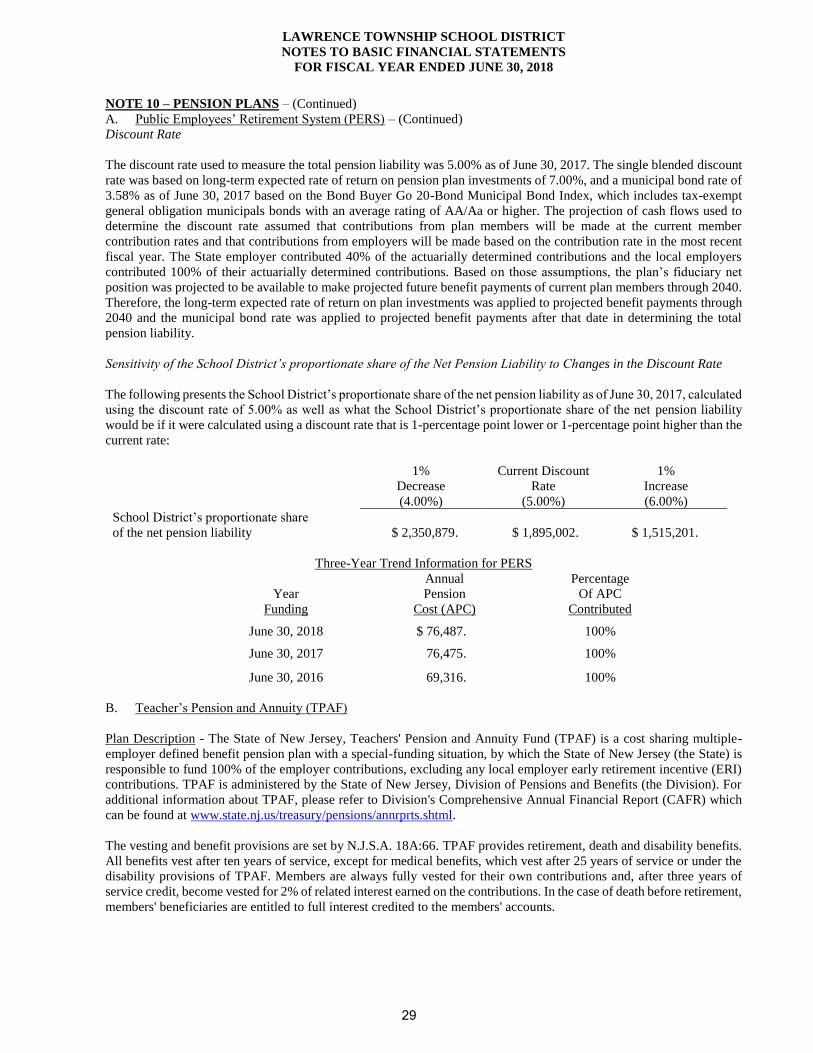
LAWRENCE TOWNSHIP SCHOOL DISTRICT
NOTES TO BASIC FINANCIAL STATEMENTS
FOR FISCAL YEAR ENDED JUNE 30, 2018
NOTE 10 – PENSION PLANS – (Continued)
A. Public Employees’ Retirement System (PERS) – (Continued)
Discount Rate
The discount rate used to measure the total pension liability was 5.00% as of June 30, 2017. The single blended discount
rate was based on long-term expected rate of return on pension plan investments of 7.00%, and a municipal bond rate of
3.58% as of June 30, 2017 based on the Bond Buyer Go 20-Bond Municipal Bond Index, which includes tax-exempt
general obligation municipals bonds with an average rating of AA/Aa or higher. The projection of cash flows used to
determine the discount rate assumed that contributions from plan members will be made at the current member
contribution rates and that contributions from employers will be made based on the contribution rate in the most recent
fiscal year. The State employer contributed 40% of the actuarially determined contributions and the local employers
contributed 100% of their actuarially determined contributions. Based on those assumptions, the plan’s fiduciary net
position was projected to be available to make projected future benefit payments of current plan members through 2040.
Therefore, the long-term expected rate of return on plan investments was applied to projected benefit payments through
2040 and the municipal bond rate was applied to projected benefit payments after that date in determining the total
pension liability.
Sensitivity of the School District’s proportionate share of the Net Pension Liability to Changes in the Discount Rate
The following presents the School District’s proportionate share of the net pension liability as of June 30, 2017, calculated
using the discount rate of 5.00% as well as what the School District’s proportionate share of the net pension liability
would be if it were calculated using a discount rate that is 1-percentage point lower or 1-percentage point higher than the
current rate:
1%
Decrease
(4.00%)
Current Discount
Rate
(5.00%)
1%
Increase
(6.00%)
School District’s proportionate share
of the net pension liability
$ 2,350,879. $ 1,895,002. $ 1,515,201.
Three-Year Trend Information for PERS
Year
Funding
Annual
Pension
Cost (APC)
Percentage
Of APC
Contributed
June 30, 2018 $ 76,487. 100%
June 30, 2017 76,475. 100%
June 30, 2016 69,316. 100%
B. Teacher’s Pension and Annuity (TPAF)
Plan Description - The State of New Jersey, Teachers' Pension and Annuity Fund (TPAF) is a cost sharing multiple-
employer defined benefit pension plan with a special-funding situation, by which the State of New Jersey (the State) is
responsible to fund 100% of the employer contributions, excluding any local employer early retirement incentive (ERI)
contributions. TPAF is administered by the State of New Jersey, Division of Pensions and Benefits (the Division). For
additional information about TPAF, please refer to Division's Comprehensive Annual Financial Report (CAFR) which
can be found at www.state.nj.us/treasury/pensions/annrprts.shtml.
The vesting and benefit provisions are set by N.J.S.A. 18A:66. TPAF provides retirement, death and disability benefits.
All benefits vest after ten years of service, except for medical benefits, which vest after 25 years of service or under the
disability provisions of TPAF. Members are always fully vested for their own contributions and, after three years of
service credit, become vested for 2% of related interest earned on the contributions. In the case of death before retirement,
members' beneficiaries are entitled to full interest credited to the members' accounts.
���29

LAWRENCE TOWNSHIP SCHOOL DISTRICT
NOTES TO BASIC FINANCIAL STATEMENTS
FOR FISCAL YEAR ENDED JUNE 30, 2018
NOTE 10 – PENSION PLANS – (Continued)
B. Teacher’s Pension and Annuity (TPAF) – (Continued)
The following represents the membership tiers for TPAF:
Tier Definition
1 Members who were enrolled prior to July 1, 2007
2 Members who were eligible to enroll on or after July 1, 2007 and prior to November 2, 2008
3 Members who were eligible to enroll on or after November 2, 2008 and prior to May 22, 2010
4 Members who were eligible to enroll on or ager May 22, 2010 and prior to June 28, 2011
5 Members who were eligible to enroll on or after June 28, 2011
Service retirement benefits of 1/55th of final average salary for each year of service credit is available to tiers 1 and 2
members upon reaching age 60 and to tier 3 members upon reaching age 62. Service retirement benefits of 1/60th of
final average salary for each year of service credit is available to tier 4 members upon reaching age 62 and tier 5 members
upon reaching age 65. Early retirement benefits are available to tiers 1 and 2 members before reaching age 60, tiers 3
and 4 before age 62 with 25 or more years of service credit, and tier 5 before age 65 with 30 or more years of service
credit. Benefits are reduced by a fraction of a percent for each month that a member retires prior to the retirement age
for his/her respective tier. Deferred retirement is available to members who have at least 10 years of service credit and
have not reached the service retirement age for the respective tier.
Contributions - The contribution policy for TPAF is set by N.J.S.A 18A:66 and requires contributions by active members
and contributing employers. State legislation has modified the amount that is contributed by the State. The State’s pension
contribution is based on an actuarially determined amount, which includes the employer portion of the normal cost and
an amortization of the unfunded accrued liability. Funding for noncontributory group insurance benefits is based on
actual claims paid. For fiscal year 2017, the State’s pension contribution was less than the actuarial determined amount.
As mentioned previously, the employer contributions for local participating employers are legally required to be funded
by the State in accordance with N.J.S.A 18:66-33. Therefore, the School District is considered to be in a special funding
situation as defined by GASB Statement No. 68 and the State is treated as a nonemployer contributing entity. Since the
School District does not contribute directly to the plan (except for employer specific financed amounts), there is no net
pension liability or deferred outflows or inflows to report in the financial statements of the local participating employers.
Pension Liability and Pension Expense - The State’s proportionate share of the TPAF net pension liability, attributable
to the School District as of June 30, 2017 was $20,209,134. The School District’s proportionate share was $0.
The net pension liability was measured as of June 30, 2017, and the total pension liability used to calculate the net pension
liability was determined by an actuarial valuation as of July 1, 2016, which was rolled forward to June 30, 2017. The
State’s proportionate share of the net pension liability associated with the District was based on projection of the State’s
long-term contributions to the pension plan associated with the District relative to the projected contributions by the State
associated with all participating school districts, actuarially determined. At June 30, 2017, the State proportionate share
of the TPAF net pension liability attributable to the School District was .0299733802%, which an increase of
.008570639% from its proportion measured as of June 30, 2016.
For the fiscal year ended June 30, 2018, the School District recognized $1,399,986 in on-behalf pension expense and
revenue in the government-wide financial statements, for the State of New Jersey on-behalf TPAF pension contributions.
This pension expense and revenue was based on the pension plans June 30, 2017 measurement date.
Actuarial Assumptions – The total pension liability for the June 30, 2017 measurement date was determined by an
actuarial valuation as of July 1, 2016, which was rolled forward to June 30, 2017. This actuarial valuation used the
following actuarial assumptions, applied to all periods in the measurement:
����30

LAWRENCE TOWNSHIP SCHOOL DISTRICT
NOTES TO BASIC FINANCIAL STATEMENTS
FOR FISCAL YEAR ENDED JUNE 30, 2018
NOTE 10 – PENSION PLANS – (Continued)
B. Teacher’s Pension and Annuity (TPAF) – (Continued)
Inflation rate
2.25%
Salary increases:
2012-2021
Varied based
on experience
Thereafter Varied based
on experience
Investment rate of return 7.00%
Pre-retirement, post-retirement and disabled mortality rates were based on the experience of TPAF members reflecting
mortality improvement on generational basis based on a 60-year average of Social Security data from 1953 to 2013.
The actuarial assumptions used in the July 1, 2016 valuation were based on the results of an actuarial experience study
for the period July 1, 2012 to June 30, 2015.
Long-Term Expected Rate of Return - In accordance with State statute, the long-term expected rate of return on plan
investments (7.00% at June 30, 2017) is determined by the State Treasurer, after consultation with the Directors of the
Division of Investments and Division of Pensions and Benefits, the board of trustees and the actuaries. The long-term
expected rate of return was determined using a building block method in which best-estimate ranges of expected future
real rates of return (expected returns, net of pension plan investment expense and inflation) are developed for each major
asset class. These ranges are combined to produce the long-term expected rate of return by weighting the expected future
real rates of return by the target asset allocation percentage and by adding expected inflation. Best estimates of arithmetic
real rates of return for each major asset class included in TPAF's target asset allocation as of June 30, 2017 are
summarized in the following table:
Asset Class
Target
Allocation
Long-Term
Expected Real
Rate of
Return
Absolute Return/Risk Mitigation 5.00% 5.51%
Cash Equivalents 5.50% 1.00%
U.S. Treasuries 3.00% 1.87%
Investment Grade Credit 10.00% 3.78%
Public High Yield 2.50% 6.82%
Global Diversified Credit 5.00% 7.10%
Credit Oriented Hedge Funds 1.00% 6.60%
Debt Related Private Equity 2.00% 10.63%
Debt Related Real Estate 1.00% 6.61%
Private Real Asset 2.50% 11.83%
Equity Related Real Estate 6.25% 9.23%
U.S. Equity 30.00% 8.19%
Non-U.S. Developed Markets Equity 11.50% 9.00%
Emerging Markets Equity 6.50% 11.64%
Buyouts/Venture Capital 8.25% 13.08%
����31

LAWRENCE TOWNSHIP SCHOOL DISTRICT
NOTES TO BASIC FINANCIAL STATEMENTS
FOR FISCAL YEAR ENDED JUNE 30, 2018
NOTE 10 – PENSION PLANS – (Continued)
B. Teacher’s Pension and Annuity (TPAF) – (Continued)
Discount Rate - The discount rate used to measure the total pension liability was 4.25% as of June 30, 2017. The single
blended discount rate was based on long-term expected rate of return on pension plan investments of 7.00%, and a
municipal bond rate of 3.58% as of June 30, 2017, based on the Bond Buyer Go 20-Bond Municipal Bond Index which
includes tax-exempt general obligation municipals bonds with an average rating of AA/Aa or higher. The projection of
cash flows used to determine the discount rate assumed that contributions from plan members will be made at the current
member contribution rates and that contributions from employers will be made based on the contribution rate in the most
recent fiscal year. The State contributed 40% of the actuarially determined contributions. Based on those assumptions,
the plan’s fiduciary net position was projected to be available to make projected future benefit payments of current plan
members through 2036. Therefore, the long-term expected rate of return on plan investments was applied to projected
benefit payments through 2036, and the municipal bond rate was applied to projected benefit payments after that date in
determining the total pension liability.
Sensitivity of the School District’s proportionate share of the Net Pension Liability to Changes in the Discount Rate –
As previously mentioned, TPAF has a special funding situation where the State pays 100% of the School District’s
annual required contribution. The following represents the State’s proportionate share of the net pension liability,
attributable to the School District calculated using the discount rate of 4.25% as well as what the State’s proportionate
share of the net pension liability, attributable to the School District’s would be if it were calculated using a discount rate
that is 1- percentage point lower or 1-percentage point higher than the current rate:
At 1%
Decrease (3.25%)
At current
discount
rate (4.25%)
At 1%
Increase (5.25%)
State of New Jersey’s Proportionate
Share of Net Pension Liability
associated with School District $ 24,096,898. $ 20,209,134. $ 17,141,183.
Pension Plan Fiduciary Net Position - For purposes of measuring the net pension liability, deferred outflows of resources
and deferred inflows of resources related to pensions, and pension expense, information about the fiduciary net position
of the Teachers’ Pension and Annuity Fund (TPAF) and additions to/deductions from the TPAF’s fiduciary net position
have been determined on the same basis as they are reported by the TPAF. For this purpose, benefit payments (including
refunds of employee contributions) are recognized when due and payable in accordance with the benefit terms.
Investments are reported at fair value.
Three-Year Trend Information for TPAF
(Paid on Behalf of the District)
Year
Funding
Pension
Contribution
Post-Retirement
Medical (PRM)
Contribution
Long-Term
Disability
Insurance
Total
Contribution
June 30, 2018 $ 446,528. $ 288,403. $ 625. $ 735,556.
June 30, 2017 337,141. 280,915. 1,056. 619,112.
June 30, 2016 237,939. 283,320. 0. 521,529.
During the fiscal years ended June 30, 2018, 2017 and 2016, in accordance with NJSA 18A:66-66 the State of New
Jersey reimbursed the Board $243,964; $239,716; and $224,025; during the same fiscal years for the employer’s share
of social security contributions for TPAF members as calculated on their base salaries. These amounts, which are not
required to be budgeted, have been included in the financial statements, and the combining and individual fund and
account group statements and schedules as revenues and expenditures in accordance in GASB 27.
C. Defined Contribution Plan (DCRP)
Plan Description - The Defined Contribution Retirement Program (DCRP) was established July 1, 2007, under the
provisions of N.J.S.A. 43:15C-1 et seq. The DCRP provides eligible members with a taxsheltered, defined contribution
retirement benefit, along with life insurance and disability coverage.
����32
LAWRENCE TOWNSHIP SCHOOL DISTRICT
NOTES TO BASIC FINANCIAL STATEMENTS
FOR FISCAL YEAR ENDED JUNE 30, 2018
NOTE 10 – PENSION PLANS – (Continued)
C. Defined Contribution Plan (DCRP) - (Continued)
Individuals eligible for membership in the DCRP include:
• State or local officials who are elected or appointed on or after July 1, 2007;
• Employees enrolled in the Public Employees’ Retirement System (PERS) or Teachers’ Pension and Annuity Fund
(TPAF) on or after July 1, 2007, who earn salary in excess of established “maximum compensation” limits;
• Employees enrolled in the Police and Firemen’s Retirement System (PFRS) or State Police Retirement System
(SPRS) after May 21, 2010, who earn salary in excess of established “maximum compensation” limits;
• Employees otherwise eligible to enroll in the PERS or TPAF on or after November 2, 2008, who do not earn the
minimum annual salary for PERS or TPAF Tier 3 enrollment but who earn salary of at least $5,000 annually. The
minimum salary in 2017 is $8,300 and is subject to adjustment in future years.
• Employees otherwise eligible to enroll in the PERS or TPAF after May 21, 2010, who do not work the minimum
number of hours per week required for PERS or TPAF Tier 4 or Tier 5 enrollment but who earn salary of at least
$5,000 annually. The minimum number is 35 hours per week for State employees, or 32 hours per week for local
government or local educations employees.
Contributions - The contribution policy is set by N.J.S.A. 43:15C-3 and requires active members and contribution
employers. When enrolled in the DCRP, members are required to contribute 5.5% of their base salary to a tax-deferred
investment account established with Prudential Financial, which jointly administers the DCRP investments with the
Division of Pension and Benefits. Member contributions are matched by a 3% contribution from the School District.
For the year ended June 30, 2018, employee contributions totaled $2,185, and the School District recognized an expense
for payments made to the Defined Contribution Retirement program in the amount of $1,192.
NOTE 11 - POST RETIREMENT BENEFITS
General Information about the OPEB Plan
Plan description and benefits provided
P.L. 1987, c. 384 and P.L. 1990, c.6 required Teachers’ Pensions and Annuity Fund (TPAF) and the Public Employees’
Retirement System (PERS), respectively, to fund post-retirement medical benefits for those State employees who retire
after accumulating 25 years of credited service or on a disability retirement. P.L. 2007, c.103 amended the law to
eliminate the funding of post-retirement medical benefits through the TPAF and PERS. It created separate funds outside
of the pension plans for the funding and payment of post-retirement medical benefits for retired state employees and
retired educational employees. The cost of these benefits is funded through contributions by the State in accordance with
P.L. 1994, c.62. Funding of post-retirement medical benefits changed from a pre-funding basis to a pay-as-you-go basis
beginning in Fiscal Year 1994.
The State is also responsible for the cost attributable to P.L. 1992, c.126, which provides employer paid health benefits
to members of PERS, and the Alternate Benefit Program who retired from a board of education or county college with
25 years of service.
The School Employees Health Benefits Program (SEHBP) Act is found in New Jersey Statues Annotated, Title 52,
Article 17.25 st. seq. Rules governing the operation and administration of program are found in Title 17, Chapter 9 of
the New Jersey Administrative Code.
No assets are accumulated in a trust that meets the criteria in paragraph 4 of GASBS No. 75.
Employees covered by benefit terms:
At June 30, 2017, the following employees were covered by the benefits terms:
����33

LAWRENCE TOWNSHIP SCHOOL DISTRICT
NOTES TO BASIC FINANCIAL STATEMENTS
FOR FISCAL YEAR ENDED JUNE 30, 2018
NOTE 11 - POST RETIREMENT BENEFITS - (Continued)
TPAF participant retirees:
As of June 30, 2017, there were 112,966 retirees receiving post-retirement medical benefits, and the State
contributed $1.39 billion on their behalf.
PERS participant retirees:
The State paid $238.9 million toward Chapter 126 benefits for 209,913 eligible retired members in Fiscal
Year 2017.
Total OPEB Liability
The State, a nonemployer contributing entity, is the only entity that has a legal obligation to make employer contribution
to OPEB for qualified retired PERS and TPAF participants. The LEA’s proportionate share percentage determined under
paragraph 193 and 203 and 205 of GASB No. 75 is zero percent. Accordingly, the LEA did not recognize any portion of
the collective net OPEB liability on the Statement of Net Position. Accordingly, the following OPEB liability note
information is reported at the State’s level and is not specific to the board of education.
Actuarial assumptions and other imputes:
The total OPEB liability in the June 30, 2017 actuarial valuation reported by the State in the State’s most recently issued
CAFR was determined using the following actuarial assumptions and other inputs, applied to all periods included in the
measurement, unless otherwise specified:
Inflation Rate: 2.50%
Discount Rate: The Bond Buyer General Obligation 20-Bond Municipal Bond Index is used for the determination
of the discount rate. The discount rate used for the fiscal year ending June 30, 2017 is 3.58%.
Health Care Trend: For pre-Medicare PPO medical benefits, the initial amount is 5.9% and decreases to 5.0%
long term trend rate after 9 years. For self-insured post-65 PPO medical benefits, the trend rate is 4.5%. For HMO
medical benefits, the trend rate is initially 5.9% and decreases to a 5.0% long-term trend rate after 9 years. For
prescription drug benefits, the initial trend rate is 10.5% decreasing to a 5.0% long-term trend rate after 8 years.
For Medicare Part-B reimbursement, the trend rate is 5.0%.
Salary Scale: The salary scale assumptions will be consistent with the salary scale assumptions used in the
pension plans and the calculation of the retiree health contributions for current and future retirees who are subject
to Chapter 78. The PERS and TPAF pension actuarial reports are used for the fiscal year ending June 30, 2018.
The discount rate was based on the Bond Buyer General Obligation 20-Bond Municipal Bond Index.
Mortality rates were based on the following:
Pre-retirement Healthy Mortality: RP-2014 headcount-weighted healthy employee male/female mortality table with
fully generational mortality improvement projections from the central year using scale MP-2017.
Post-retirement Healthy Mortality: RP-2014 headcount-weighted healthy annuitant male/female mortality table with
fully generational improvement projections from the central year using scale MP-2017.
Disabled Mortality: RP-2014 headcount-weighted disabled male/female mortality table with fully generational
improvement projections from the central year using scale MP-2017
����34

LAWRENCE TOWNSHIP SCHOOL DISTRICT
NOTES TO BASIC FINANCIAL STATEMENTS
FOR FISCAL YEAR ENDED JUNE 30, 2018
NOTE 11 - POST RETIREMENT BENEFITS - (Continued)
Changes in the Total OPEB Liability reported by the State of New Jersey:
Balance at 6/30/16 $ 57,831,784,184.
Changes for the year:
Service Cost 2,391,878,884.
Interest 1,699,441,736.
Changes in assumptions or other inputs (7,086,599,129.)
Contributions: Member 45,748,749.
Benefits payment (1,242,412,566.)
Net Changes (4,191,942,326.)
Balance at 6/30/17 $ 53,639,841,858.
Changes of assumptions and other inputs reflect a change in the discount rate from 2.85% in 2016 to 3.58% in 2017.
Sensitivity of the total OPEB liability to changes in the discount rate:
The following presents the total OPEB liability of the State for school board retirees, as well as what the State’s total
OPEB liability for school boards would be if it were calculated using a discount rate that is 1 percentage point lower or
1 percentage point higher than the current discount rate:
1% Decrease
(2.58%)
Discount Rate
(3.58%)
1% Increase
(4.58%)
Total OPEB Liability (School Retirees)
$ 63,674,362,200.
$ 53,639,841,858.
$ 45,680,364,953.
Sensitivity of the total OPEB liability to changes in the healthcare cost trend rates.
The following presents the total OPEB liability of the State, as well as what the State’s total OPEB liability would be if
it were calculated using healthcare cost trend rates that are 1 percentage point lower or 1 percentage point higher than
the current healthcare cost trend rates:
1% Decrease
Healthcare Cost
Trend Rates 1% Increase
Total OPEB Liability (School Retirees)
$ 44,113,584,560.
$ 53,639,841,858.
$ 66,290,599,457.
OPEB Expense and Deferred Outflows of Resources and Deferred Inflows of Resources Related to OPEB
For the year ended June 30, 2018, the board of education recognized on-behalf OPEB expense and revenue of $974,446
determined by the State as the total OPEB liability for benefits provided through a defined OPEB plan that is not
administered through a trust that meets the criteria in paragraph 4 of GASB No. 75 and in which there is a special funding
situation.
In accordance with GASB No. 75, the Lawrence Township Board of Education proportionate share of school retirees
OPEB is zero, there is no recognition of the allocation of proportionate share of deferred outflows of resources and
deferred inflows of resources. At June 30, 2017, the State reported deferred outflows of resources and deferred inflows
of resources related to retired school employee’s OPEB from the following sources:
���� 35

LAWRENCE TOWNSHIP SCHOOL DISTRICT
NOTES TO BASIC FINANCIAL STATEMENTS
FOR FISCAL YEAR ENDED JUNE 30, 2018
NOTE 11 - POST RETIREMENT BENEFITS - (Continued)
Deferred Outflows of
Resources
Deferred Inflows of
Resources
Difference between expected and actual experience $ 0. $ 0.
Changes of assumptions 0. 6,343,769,032.
Net difference between projected and actual earnings
on pension plan investments
0.
0.
Changes in proportion and difference between District
contributions and proportionate share of contributions
0.
0.
Contributions subsequent to the measurement date 1,190,373,242. 0.
Total
$ 1,190,373,242.
$ 6,343,769,032.
Amounts reported as deferred outflows of resources and deferred inflows of resources related to retired school
employee’s OPEB will be recognized in OPEB expenses as follows:
Year ended
June 30:
2019 $ (742,830,097.)
2020 (742,830,097.)
2021 (742,830,097.)
2022 (742,830,097.)
2023 (742,830,097.)
Thereafter (2,629,618,547.)
Total $ (6,343,769,032.)
(Contributions made after June 30, 2017 are reported as deferred outflow of resources but are not amortized in the
expense.)
Detailed information about the plan’s fiduciary net position is available in the separately issued OPEB financial report.
NOTE 12 - COMPENSATED ABSENCES
The District accounts for compensated absences (e.g., unused vacation, sick leave) as directed by Government
Accounting Standards Board Statement No. 16 (GASB 16), “Accounting for Compensated Absences”. A liability for
compensated absences attributable to services already rendered and not contingent on a specific event that is outside the
control of the employer and employee is accrued as employees earn the rights to the benefits.
District employees are granted varying amounts of vacation and sick leave in accordance with the District’s personnel
policy. Upon termination, employees are paid for accrued vacation. The District’s policy permits employees to
accumulate unused sick leave and carry forward the full amount to subsequent years. Upon retirement employees shall
be paid by the District for the unused sick leave in accordance with the District’s agreements with the various employee
unions.
The liability for vested compensated absences of the governmental activities is recorded as long-term debt in the district-
wide statements. The current portion of the compensated absences balance is not considered material to the applicable
funds total liabilities, and therefore, is not shown separately from the long-term liability balance of compensated
absences.
The liability for vested compensated absences of the proprietary fund types is recorded within those funds as the benefits
accrue to employees. As of June 30, 2018, a liability existed for compensated absences in the Food Service Fund in the
amount of $0.
NOTE 13 - DEFERRED COMPENSATION
The Board offers its employees a choice of the following deferred compensation plans created in accordance with Internal
Revenue Code Section 403(b). The plans, which are administered by the entities listed below, permits participants to
defer a portion of their salary until future years. Amounts deferred under the plans are not available to employees until
termination, retirement, death or unforeseeable emergency. The plan administrators are as follows:
����36

LAWRENCE TOWNSHIP SCHOOL DISTRICT
NOTES TO BASIC FINANCIAL STATEMENTS
FOR FISCAL YEAR ENDED JUNE 30, 2018
NOTE 13 - DEFERRED COMPENSATION – (Continued)
Lincoln Investments
Metropolitan
NOTE 14 - RISK MANAGEMENT
The District is exposed to various types of loss related to torts; theft of, damage to, and destruction of assets; errors and
omissions; injuries to employees; and natural disasters.
Property and Liability Insurance – The District maintains commercial insurance coverage for property, liability,
student accident, and surety bonds. A complete schedule of insurance coverage can be found in the Statistical Section
of this Comprehensive Annual Financial Report.
New Jersey Unemployment Compensation Insurance – The District has elected to fund its New Jersey Unemployment
Compensation Insurance under the “Benefit Reimbursement Method”. Under this plan, the District is required to
reimburse the New Jersey Unemployment Trust Fund for benefits paid to its former employees and charged to its account
with the State. The District is billed quarterly for amounts due to the State. The following is a summary of District
contributions, employee contributions, reimbursements to the State for benefits paid and the ending balance of the
District’s expendable trust fund for the current and previous two years:
District Employee Interest Amount Ending
Fiscal Year Contributions Contributions Income Reimbursed Balance
2017-2018 $ 30,000. $ 7,494. $ 174. $ 4,853. $ 155,780.
2016-2017 30,000. 7,317. 173. 7,170. 122,965.
2015-2016 50,000. 6,445. 120. 22,549. 92,645.
NOTE 15 - INTERFUND RECEIVABLES AND PAYABLES AND TRANSFERS
The following interfund balances remained on the balance sheet at June 30, 2018.
Interfund Interfund
Fund Receivable Payable
General Fund $ 11,824. $ 104,778.
Debt Service Fund 0. 11,824.
Enterprise Fund 43,842. 1,782.
Agency Fund 62,718. 0.
$ 118,384. $ 118,384.
The amounts due from the Debt Service Fund to the General Fund represents the cash deficit in the Debt Service Fund
due to delays in receiving tax levy.
The remaining balances resulted from the time lag between the dates that:
1. The interfund transactions occur;
2. Transactions are recorded in the accounting system; and
3. Payments between funds are made.
Transfer To Transfer From
General Fund $ 0. $ 675,326.
Capital Projects Fund 623,010. 102,684.
Debt Service Fund 155,000. 0.
Total $ 778,010. $ 778,010.
The transfer of $623,010 from General Fund to the Capital Projects Fund is withdrawals from the Capital Reserve to
fund Capital Projects.
The transfer of $52,316 is to correct an error in budgeting. The budgeted transfer from the Capital Projects Fund to the
Debt Service Fund exceeded the amount available in the Capital Projects Fund.
����37

LAWRENCE TOWNSHIP SCHOOL DISTRICT
NOTES TO BASIC FINANCIAL STATEMENTS
FOR FISCAL YEAR ENDED JUNE 30, 2018
NOTE 15 - INTERFUND RECEIVABLES AND PAYABLES AND TRANSFERS – (Continued)
The transfer of $102,684 from the Capital Projects Fund to the Debt Service Fund is the budgeted transfer of unused
bond proceeds to be used for Debt Service payments.
NOTE 16 - CONTINGENT LIABILITIES
GRANT PROGRAM
The Board participates in state and federally assisted grant programs. These programs are subject to program compliance
audits by the grantors or their representatives. The Board is potentially liable for any expenditures which may be
disallowed pursuant to the terms of these grant programs. Management is not aware of any material items of
noncompliance which would result in the disallowance of program expenditures.
LITIGATION
The Board is involved in several claims and lawsuits incidental to its operation. In the opinion of the administration and
legal counsel, the ultimate resolution of these matters will not have a material adverse effect on the financial position of
the District.
NOTE 17 - TAX ABATEMENTS
As defined by the Governmental Accounting Standards Board (GASB), a tax abatement is an agreement between a
government and an individual or entity in which the government promises to forgo tax revenues and the individual or
entity promises to subsequently take a specific action that contributes to economic development or otherwise benefits
the government or its citizens. School districts are not authorized by New Jersey statute to enter into tax abatement
agreements. However, the county or municipality in which the school district is situated may have entered into tax
abatement agreements, and that potential must be disclosed in these financial statements. If the county or municipality
entered into tax abatement agreements, those agreements will not directly affect the school district’s local tax revenue
because N.J.S.A. 54:4-75 and N.J.S.A. 54:4-76 require that amounts so forgiven must effectively be recouped from other
taxpayers and remitted to the school district.
For a local school district board of education or board of school estimate that has elected to raise their minimum tax levy
using the required local share provisions at N.J.S.A. 18A:7F-5(b), the loss of revenue resulting from the municipality or
county having entered into a tax abatement agreement is indeterminate due to the complex nature of the calculation of
required local share performed by the New Jersey Department of Education based upon district property value and
wealth.
NOTE 18 - CALCULATION OF EXCESS SURPLUS
In accordance with N.J.S.A. 18A:7F-7, as amended by P.L. 2004, c.73 (S1701), the designation for Reserved Fund
Balance – Excess Surplus is a required calculation pursuant to the New Jersey Comprehensive Educational Improvement
and Financing Act of 1996 (CEIFA). New Jersey school districts are required to reserve General Fund fund balance at
the fiscal year end of June 30, if they did not appropriate a required minimum amount as budgeted fund balance in their
subsequent years’ budget. The excess fund balance at June 30, 2018 is $454,215.
NOTE 19 - DEFICIT FUND BALANCES
The District has a deficit fund balances of $0 in the General Fund and $(28,069) in the Special Revenue Fund as of June
30, 2018 as reported in the fund statements (modified accrual basis). N.J.S.A. 18A:22-44.2 provides that in the event a
state school aid payment is not made until the following school budget year, districts must record the delayed one or
more June state aid payment as revenue, for budget purposes only, in the current school budget year. The bill provides
legal authority for school districts to recognize this revenue in the current budget year. For intergovernmental
transactions, GASB Statement No. 33 requires that recognition (revenue, expenditure, asset, liability) should be in
symmetry, i.e., if one government recognizes an asset, the other government recognizes a liability. Since the State is
recording the June state aid payment(s) in the subsequent fiscal year, the school district cannot recognize the June state
aid payment(s) on the GAAP financial statements until the year the State records the payable. Due to the timing
difference of recording the June state aid payment(s), the General and Special Revenue Fund balance deficit does not
alone indicate the district is facing financial difficulties.
���38

LAWRENCE TOWNSHIP SCHOOL DISTRICT
NOTES TO BASIC FINANCIAL STATEMENTS
FOR FISCAL YEAR ENDED JUNE 30, 2018
NOTE 19 - DEFICIT FUND BALANCES – (Continued)
Pursuant to N.J.S.A. 18A:22-44.2 any negative unreserved, undesignated general fund balance that is reported as a direct
result from a delay in the June payment(s) of state aid until the following fiscal year, is not considered in violation of
New Jersey statute and regulation nor in need of corrective action. The District deficit in the GAAP funds statements of
$(28,069) is equal to (or) is less than the last state aid payments.
NOTE 20 - FUND BALANCE
NONSPENDABLE
As stated in Note 1, the nonspendable fund balance classification includes amounts that cannot be spent because they are
either not in spendable form or are legally or contractually required to be maintained intact. There are no nonspendable
fund balances of the School district as of June 30, 2018.
RESTRICTED
As stated in Note 1, the restricted fund balance classification includes amounts that are restricted to specific purposes.
Such restrictions, or constraints, are placed on the use of resources by either of the following: (1) externally imposed by
creditors, grantors, contributors, or laws or regulations of other governments; or (2) imposed by law through
constitutional provisions or enabling legislation. Specific restrictions of the School District’s fund balance are
summarized as follows:
General Fund:
Excess Surplus: In accordance with N.J.S.A. 18A:7F-7, as amended, the designation of restricted fund balance
– excess surplus is the result of a required calculation pursuant to the New Jersey Comprehensive Educational
Improvement and Financing Act of 1996 (CEIFA). New Jersey school districts are required to reserve general
fund balance at the fiscal year end of June 30 if they did not appropriate a required minimum amount as budgeted
fund balance in their subsequent years’ budget. The excess fund balance at June 30, 2018 is $454,215; $218,891
has been restricted and designated for utilization in the 2018-2019 budget.
Capital Reserve Account: As of June 30, 2018, the balance in the capital reserve account is $544,632. These
funds are restricted for the future approved capital projects of school facilities.
For Maintenance Reserve Account: As of June 30, 2018, the balance in the maintenance reserve account is
$338,000. These funds are restricted for the required maintenance of school facilities in accordance with
Educational Facilities Construction and Financing Act (EFCFA) (N.J.S.A. 18A:7G-9) as amended by P.L. 2004,
c.73 (S1701).
Emergency Reserve Account: As of June 30, 2018, the balance in the emergency reserve was $250,000. These
funds are restricted for the purpose of financing unanticipated general fund expenditures required for a thorough
and efficient education in accordance with N.J.S.A. 18A:7F-41c(1).
Tuition Reserve Account – In accordance with N.J.A.C. 6A:23-3.1(f)(8), the District has a restricted fund
balance in the amount of $298,900 in a legal reserve for tuition adjustments. This reserve represents foreseeable
future tuition adjustments up to a maximum of 10% of the estimated tuition cost of the respective year. $180,000
of the balance has been appropriated in the June 30, 2019 budget.
COMMITTED
As stated in Note 1, the committed fund balance classification includes amounts that can only be used for specific
purposes pursuant to constraints imposed by formal action of the School District’s highest level of decision making
authority, which, for the School District, is the Board of Education. Such formal action consists of an affirmative vote
by the Board of Education, memorialized by the adoption of a resolution. Once committed, amounts cannot be used for
any other purpose unless the Board of Education removes, or changes, the specified use by taking the same type of action
(resolution) it employed to previously commit those amounts.
Other Purposes: As of June 30, 2018, the School District had $83,279 of encumbrances outstanding for purchase
orders and contracts signed by the School District but not completed as of the close of the fiscal year.
���39
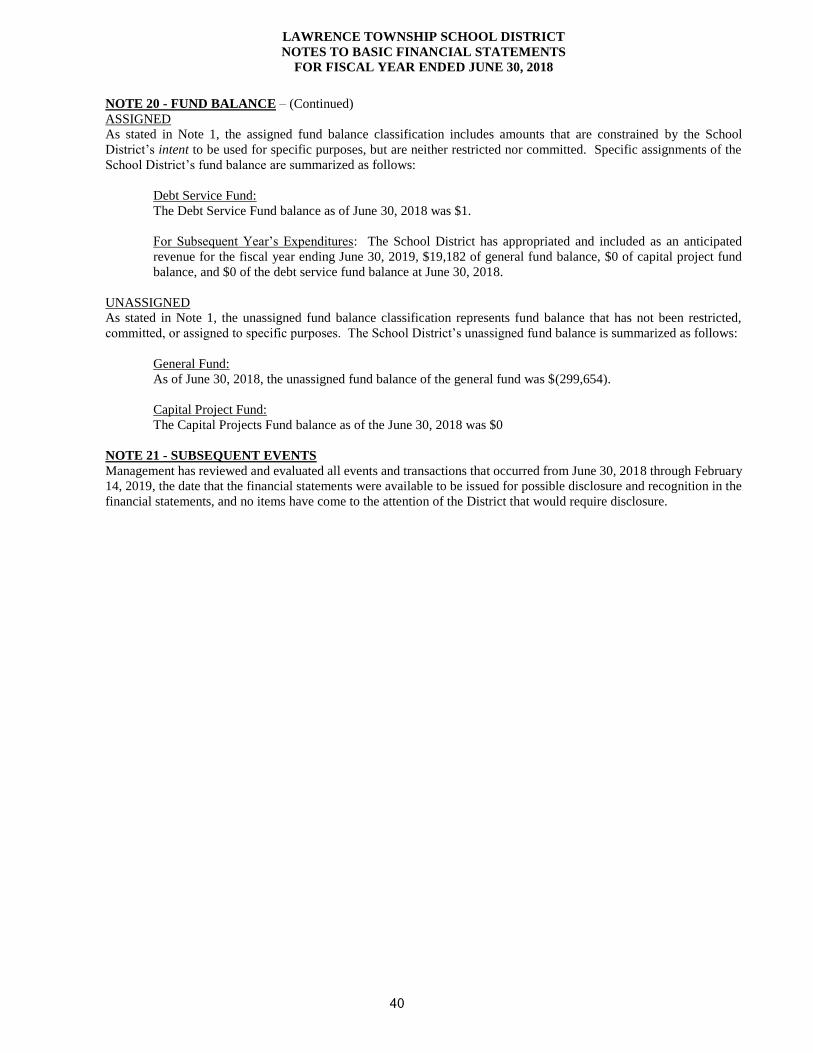
LAWRENCE TOWNSHIP SCHOOL DISTRICT
NOTES TO BASIC FINANCIAL STATEMENTS
FOR FISCAL YEAR ENDED JUNE 30, 2018
NOTE 20 - FUND BALANCE – (Continued)
ASSIGNED
As stated in Note 1, the assigned fund balance classification includes amounts that are constrained by the School
District’s intent to be used for specific purposes, but are neither restricted nor committed. Specific assignments of the
School District’s fund balance are summarized as follows:
Debt Service Fund:
The Debt Service Fund balance as of June 30, 2018 was $1.
For Subsequent Year’s Expenditures: The School District has appropriated and included as an anticipated
revenue for the fiscal year ending June 30, 2019, $19,182 of general fund balance, $0 of capital project fund
balance, and $0 of the debt service fund balance at June 30, 2018.
UNASSIGNED
As stated in Note 1, the unassigned fund balance classification represents fund balance that has not been restricted,
committed, or assigned to specific purposes. The School District’s unassigned fund balance is summarized as follows:
General Fund:
As of June 30, 2018, the unassigned fund balance of the general fund was $(299,654).
Capital Project Fund:
The Capital Projects Fund balance as of the June 30, 2018 was $0
NOTE 21 - SUBSEQUENT EVENTS
Management has reviewed and evaluated all events and transactions that occurred from June 30, 2018 through February
14, 2019, the date that the financial statements were available to be issued for possible disclosure and recognition in the
financial statements, and no items have come to the attention of the District that would require disclosure.
����40
REQUIRED SUPPLEMENTARY INFORMATION–PART II

BUDGETARY COMPARISON SCHEDULES

EX
HIB
IT C
-1 1
Varia
nce
Origin
al
Budge
tF
inal
Favora
ble
Budge
tT
ransfe
rsB
udge
tA
ctu
al
(U
nfa
vora
ble
)
Revenue
s:
Local S
ourc
es:
Local T
ax L
evy
2,2
48
,47
2.
$
0
.$
2,2
48
,47
2.
$
2
,24
8,4
72
.$
0
.$
Inte
rest E
arn
ed
32
5.
0.
3
25
.
5
,87
1.
5
,54
6.
Mis
cella
neo
us
20
,00
0.
0.
2
0,0
00
.
1
7,2
18
.
(2
,78
2.)
Tota
l Local S
ourc
es
2,2
68
,79
7.
0
.
2,2
68
,79
7.
2
,27
1,5
61
.
2
,76
4.
Sta
te S
ourc
es:
Equaliz
ation A
id5
,09
1,2
23
.
11
5,3
09
.
5
,20
6,5
32
.
5,2
06
,53
2.
0.
School C
hoic
e A
id4
28
,96
0.
0
.
42
8,9
60
.
42
8,9
60
.
0.
Cate
go
rical T
ransport
ation A
id6
4,7
40
.
0
.
64
,74
0.
64
,74
0.
0.
Specia
l E
ducation A
id3
35
,98
5.
0
.
33
5,9
85
.
33
5,9
85
.
0.
Security
Aid
16
0,3
44
.
0.
1
60
,34
4.
1
60
,34
4.
0
.
Under
Ad
equa
cy A
id3
,74
6.
0
.
3,7
46
.
3,7
46
.
0.
PA
RC
C R
eadin
ess A
id5
,78
0.
0
.
5,7
80
.
5,7
80
.
0.
Per
Pup
il G
row
th A
id5
,78
0.
0
.
5,7
80
.
5,7
80
.
0.
Pro
fessio
nal Lea
rnin
g C
om
munity A
id6
,01
0.
0
.
6,0
10
.
6,0
10
.
0.
Host D
istr
ict S
uppo
rt A
id3
,51
1.
0
.
3,5
11
.
3,5
11
.
0.
On-B
eha
lf T
PA
F P
ensio
n C
on
trib
ution (
Non-B
udge
ted)
0.
0.
7
35
,55
6.
7
35
,55
6.
Reim
burs
ed T
PA
F S
oc. S
ec. C
ontr
ibution (
Non-B
udge
ted)
0.
0.
2
43
,96
4.
2
43
,96
4.
Extr
aord
inary
Aid
0.
0.
1
3,3
17
.
1
3,3
17
.
Additio
nal N
on-P
ub
lic T
ransport
ation A
id0
.
0
.
3,7
70
.
3,7
70
.
Tota
l S
tate
Sourc
es
6,1
06
,07
9.
1
15
,30
9.
6,2
21
,38
8.
7
,21
7,9
95
.
9
96
,60
7.
Tota
l R
evenue
s8
,37
4,8
76
.
11
5,3
09
.
8
,49
0,1
85
.
9,4
89
,55
6.
99
9,3
71
.
LA
WR
EN
CE
TO
WN
SH
IP S
CH
OO
L D
IST
RIC
T
BU
DG
ET
AR
Y C
OM
PA
RIS
ON
SC
HE
DU
LE
GE
NE
RA
L F
UN
D
FIS
CA
L Y
EA
R E
ND
ED
JU
NE
30, 2
018
41

EX
HIB
IT C
-1
Vari
ance
Ori
gin
al
Budget
Fin
al
Favora
ble
Budget
Tra
nsfe
rsB
udget
Actu
al
(U
nfa
vora
ble
)
Expenditure
:
Curr
ent
Expense:
Regula
r P
rogra
ms -
Instr
uction:
Pre
school -
Sala
ries o
f T
eachers
0.
$
0.
$
0.
$
0.
$
0.
$
Kin
derg
art
en -
Sala
ries o
f T
eachers
266,1
90.
(8
25.)
265,3
65.
264,4
79.
886.
Gra
des 1
- 5
- S
ala
ries o
f T
eachers
1,2
00,6
93.
4,3
85.
1,2
05,0
78.
1,1
80,7
91.
24,2
87.
Gra
des 6
- 8
- S
ala
ries o
f T
eachers
763,4
21.
(4
9,2
00.)
714,2
21.
688,9
55.
25,2
66.
Hom
e I
nstr
uction:
Sala
ries o
f T
eachers
2,5
00.
(2
,000.)
500.
0.
500.
Purc
hased P
rofe
ssio
nal/E
ducational S
erv
ices
10,0
00.
(3,4
35.)
6,5
65.
4,6
98.
1,8
67.
Regula
r pro
gra
ms -
Undis
trib
ute
d I
nstr
uction:
Oth
er
Sala
ries f
or
Instr
uction
58,0
84.
(26,3
75.)
31,7
09.
31,6
93.
16.
Purc
hased P
rofe
ssio
nal/E
ducational S
erv
ices
1,0
00.
(6
10.)
390.
0.
390.
Oth
er
Purc
hased S
erv
ices
61,3
00.
2,6
65.
63,9
65.
63,8
90.
75.
Genera
l S
upplie
s108,1
10.
35,4
55.
143,5
65.
122,9
09.
20,6
56.
Textb
ooks
50,0
00.
(11,9
58.)
38,0
42.
0.
38,0
42.
Oth
er
Obje
cts
1,5
00.
1,9
65.
3,4
65.
2,2
63.
1,2
02.
Tota
l R
egula
r P
rogra
ms -
Instr
uction
2,5
22,7
98.
(49,9
33.)
2,4
72,8
65.
2,3
59,6
78.
113,1
87.
Resourc
e R
oom
/Resourc
e C
ente
r:
Sala
ries o
f T
eachers
202,4
35.
60,8
52.
263,2
87.
250,2
40.
13,0
47.
Oth
er
Sala
ries f
or
Instr
uction
0.
2,3
57.
2,3
57.
2,3
57.
0.
Tota
l R
esourc
e R
oom
/Resourc
e C
ente
r202,4
35.
63,2
09.
265,6
44.
252,5
97.
13,0
47.
Tota
l S
pecia
l E
ducation -
Instr
uction
202,4
35.
63,2
09.
265,6
44.
252,5
97.
13,0
47.
Basic
Skill
s/R
em
edia
l -
Instr
uction:
Sala
ries o
f T
eachers
59,9
95.
$
(30,0
01.)
$
29,9
94.
$
21,8
99.
$
8,0
95.
$
Tota
l B
asic
Skill
s/R
em
edia
l -
Instr
uction
59,9
95.
(30,0
01.)
29,9
94.
21,8
99.
8,0
95.
Bili
ngual E
ducation -
Instr
uction:
Sala
ries o
f T
eachers
18,6
61.
1.
18,6
62.
18,6
61.
1.
Tota
l B
ilingual E
ducation -
Instr
uction
18,6
61.
1.
18,6
62.
18,6
61.
1.
LA
WR
EN
CE
TO
WN
SH
IP S
CH
OO
L D
IST
RIC
T
BU
DG
ET
AR
Y C
OM
PA
RIS
ON
SC
HE
DU
LE
GE
NE
RA
L F
UN
D
FIS
CA
L Y
EA
R E
ND
ED
JU
NE
30,
2018
2
42

EX
HIB
IT C
-1
Vari
ance
Ori
gin
al
Budget
Fin
al
Favora
ble
Budget
Tra
nsfe
rsB
udget
Actu
al
(U
nfa
vora
ble
)
LA
WR
EN
CE
TO
WN
SH
IP S
CH
OO
L D
IST
RIC
T
BU
DG
ET
AR
Y C
OM
PA
RIS
ON
SC
HE
DU
LE
GE
NE
RA
L F
UN
D
FIS
CA
L Y
EA
R E
ND
ED
JU
NE
30,
2018
School S
ponsore
d C
o-C
urr
icula
r A
ctivitie
s -
Instr
uction:
Sala
ries
18,0
00.
$
0.
$
18,0
00.
$
14,3
24.
$
3,6
76.
$
Purc
hased S
erv
ices
2,5
00.
(2
25.)
2,2
75.
0.
2,2
75.
Supplie
s a
nd M
ate
rials
1,5
00.
225.
1,7
25.
1,7
19.
6.
Tota
l S
chool S
ponsore
d C
o-C
urr
icula
r A
ctivitie
s -
Instr
uction
22,0
00.
0.
22,0
00.
16,0
43.
5,9
57.
School S
ponsore
d A
thle
tics -
Instr
uction:
Sala
ries
22,6
00.
0.
22,6
00.
20,8
43.
1,7
57.
Purc
hased S
erv
ices
2,5
00.
(7
15.)
1,7
85.
1,4
67.
318.
Supplie
s a
nd M
ate
rials
3,0
00.
715.
3,7
15.
3,7
11.
4.
Tota
l S
chool S
ponsore
d A
thle
tics -
Instr
uction
28,1
00.
0.
28,1
00.
26,0
21.
2,0
79.
Tota
l In
str
uction
2,8
53,9
89.
(16,7
24.)
2,8
37,2
65.
2,6
94,8
99.
142,3
66.
Undis
trib
ute
d E
xpenditure
s:
Instr
uction:
Tuitio
n -
Oth
er
LE
A's
Within
the S
tate
- R
egula
r824,3
18.
13,5
15.
837,8
33.
837,5
52.
281.
Tuitio
n -
Oth
er
LE
A's
Within
the S
tate
- S
pecia
l197,1
65.
(5
,850.)
191,3
15.
187,9
64.
3,3
51.
Tuitio
n -
County
Voc.
School D
istr
icts
- R
egula
r150,0
54.
(3
1,4
70.)
118,5
84.
118,5
82.
2.
Tuitio
n -
County
Voc.
School D
istr
icts
- S
pecia
l2,0
00.
19,1
20.
21,1
20.
21,1
16.
4.
Tuitio
n -
Co.
Spec.
Serv
ices a
nd R
egio
nal D
ay S
chls
382,2
09.
(3
,223.)
378,9
86.
257,0
38.
121,9
48.
Tuitio
n -
Pri
vate
Schls
/Handic
apped w
ithin
Sta
te231,2
27.
(3
,550.)
227,6
77.
158,5
43.
69,1
34.
Tuitio
n -
Sta
te F
acili
ties
32,9
52.
0.
32,9
52.
32,9
52.
0.
Tuitio
n -
Oth
er
28,8
35.
(2,0
00.)
26,8
35.
0.
26,8
35.
Tota
l In
str
uction
1,8
48,7
60.
(13,4
58.)
1,8
35,3
02.
1,6
13,7
47.
221,5
55.
Att
endance a
nd S
ocia
l W
ork
Serv
ices:
Sala
ries
32,8
83.
417.
33,3
00.
33,2
95.
5.
Tota
l A
ttendance a
nd S
ocia
l W
ork
Serv
ices
32,8
83.
417.
33,3
00.
33,2
95.
5.
Health S
erv
ices:
Sala
ries
60,4
95.
1,0
47.
61,5
42.
61,5
42.
0.
Purc
hased P
rofe
ssio
nal and T
echnic
al S
erv
ices
3,7
00.
1,1
17.
4,8
17.
4,8
17.
0.
Supplie
s a
nd M
ate
rials
2,5
00.
(2
80.)
2,2
20.
2,2
20.
0.
Tota
l H
ealth S
erv
ices
66,6
95.
1,8
84.
68,5
79.
68,5
79.
0.
3
43

EX
HIB
IT C
-1
Vari
ance
Ori
gin
al
Budget
Fin
al
Favora
ble
Budget
Tra
nsfe
rsB
udget
Actu
al
(U
nfa
vora
ble
)
LA
WR
EN
CE
TO
WN
SH
IP S
CH
OO
L D
IST
RIC
T
BU
DG
ET
AR
Y C
OM
PA
RIS
ON
SC
HE
DU
LE
GE
NE
RA
L F
UN
D
FIS
CA
L Y
EA
R E
ND
ED
JU
NE
30,
2018
Speech,
OT
, P
T a
nd R
ela
ted S
erv
ices:
Sala
ries
65,3
95.
$
(1,1
55.)
$
64,2
40.
$
63,1
51.
$
1,0
89.
$
Purc
hased P
rofe
ssio
nal -
Educational S
erv
ices
45,4
00.
(3,3
45.)
42,0
55.
36,2
91.
5,7
64.
Supplie
s a
nd M
ate
rials
250.
879.
1,1
29.
942.
187.
Tota
l S
peech,
OT
, P
T a
nd R
ela
ted S
erv
ices
111,0
45.
(3
,621.)
107,4
24.
100,3
84.
7,0
40.
Specia
l E
ducation -
Extr
aord
inary
Serv
ices:
Sala
ries
208,9
67.
24,0
00.
232,9
67.
232,9
28.
39.
Purc
hased P
rofe
ssio
nal -
Educational S
erv
ices
59,0
38.
(4,6
11.)
54,4
27.
53,2
87.
1,1
40.
Tota
l S
pecia
l E
ducation -
Extr
aord
inary
Serv
ices
268,0
05.
19,3
89.
287,3
94.
286,2
15.
1,1
79.
Guid
ance:
Sala
ries o
f O
ther
Pro
fessio
nal S
taff
62,8
95.
(23,7
95.)
39,1
00.
39,0
97.
3.
Tota
l G
uid
ance
62,8
95.
(23,7
95.)
39,1
00.
39,0
97.
3.
Child
Stu
dy T
eam
s:
Sala
ries o
f O
ther
Pro
fessio
nal S
taff
131,7
55
28,5
94.
160,3
49
160,3
46
3.
Sala
ries o
f S
ecre
tari
al &
Cle
rical A
ssis
tants
29,7
20
1.
29,7
21
29,7
20
1.
Oth
er
Purc
hased P
rofe
ssio
nal and T
echnic
al S
erv
ice
1,5
00.
12,6
70.
14,1
70.
14,1
69.
1.
Mis
cella
neous P
urc
hased S
erv
ices
9,0
00.
(4
,230.)
4,7
70.
4,7
66.
4.
Supplie
s a
nd M
ate
rials
2,5
00.
596.
3,0
96.
3,0
96.
0.
Oth
er
Obje
cts
250.
330.
580.
578.
2.
Tota
l C
hild
Stu
dy T
eam
s174,7
25.
37,9
61.
212,6
86.
212,6
75.
11.
Impro
ve o
f In
str
uct
Serv
/Oth
er
Support
Serv
- I
nstr
uct
Sta
ff:
Sala
ries o
f O
ther
Pro
fessio
nal S
taff
10,0
00.
(4,5
00.)
5,5
00.
982.
4,5
18.
Tota
l Im
pro
vem
ent
of
Instr
uctional S
erv
ices
10,0
00.
(4,5
00.)
5,5
00.
982.
4,5
18.
Instr
uctional S
taff
Tra
inin
g S
erv
ices:
Sala
ries o
f O
ther
Pro
fessio
nal S
taff
29,3
01.
(3,5
39.)
25,7
62.
25,3
01.
461.
Oth
er
Sala
ries
25,3
01.
1,1
39.
26,4
40.
25,3
81.
1,0
59.
Purc
hased P
rofe
ssio
nal E
ducational S
erv
ices
2,0
00.
(1
00.)
1,9
00.
378.
1,5
22.
Oth
er
Purc
hased S
erv
ices
4,0
00.
0.
4,0
00.
2,0
89.
1,9
11.
Oth
er
Obje
cts
1,8
00.
0.
1,8
00.
1,6
33.
167.
Tota
l In
str
uctional S
taff
Tra
inin
g S
erv
ices
62,4
02.
(2,5
00.)
59,9
02.
54,7
82.
5,1
20.
4
44

EX
HIB
IT C
-1
Vari
ance
Ori
gin
al
Budget
Fin
al
Favora
ble
Budget
Tra
nsfe
rsB
udget
Actu
al
(U
nfa
vora
ble
)
LA
WR
EN
CE
TO
WN
SH
IP S
CH
OO
L D
IST
RIC
T
BU
DG
ET
AR
Y C
OM
PA
RIS
ON
SC
HE
DU
LE
GE
NE
RA
L F
UN
D
FIS
CA
L Y
EA
R E
ND
ED
JU
NE
30,
2018
Support
Serv
ices -
Genera
l A
dm
inis
tration:
Sala
ries
73,1
08.
$
1,0
00.
$
74,1
08.
$
73,8
28.
$
280.
$
Legal S
erv
ices
20,0
00.
(11,2
95.)
8,7
05.
8,6
71.
34.
Audit F
ees
22,0
00.
(2,3
00.)
19,7
00.
19,7
00.
0.
Oth
er
Purc
hased P
rofe
ssio
nal S
erv
ices
18,5
00.
(10,6
00.)
7,9
00.
7,4
63.
437.
Purc
hased T
echnic
al S
erv
ice
2,0
00.
(1
54.)
1,8
46.
1,8
06.
40.
Com
munic
ations/T
ele
phone
22,5
00.
15,2
15.
37,7
15.
37,7
14.
1.
Oth
er
Purc
hased S
erv
ices
14,6
59.
(2,3
05.)
12,3
54.
12,2
69.
85.
Genera
l S
upplie
s2,0
00.
7,8
35.
9,8
35.
9,7
94.
41.
Mis
cella
neous E
xpenditure
s
1,5
00.
(1
00.)
1,4
00.
1,2
92.
108.
BO
E M
em
bers
hip
Dues a
nd F
ees
4,5
00.
(4
50.)
4,0
50.
4,0
49.
1.
Tota
l S
upport
Serv
ices -
Genera
l A
dm
inis
tration
180,7
67.
(3
,154.)
177,6
13.
176,5
86.
1,0
27.
Support
Serv
ices -
School A
dm
inis
tration:
Sala
ries o
f P
rincip
als
/Assis
tant
Pri
ncip
als
70,1
96.
1.
70,1
97.
70,1
96.
1.
Sala
ries o
f O
ther
Pro
fessio
nals
Sta
ff12,2
40.
0.
12,2
40.
12,2
40.
0.
Sala
ries o
f S
ecre
tari
al &
Cle
rical A
ssis
tants
22,1
22.
800.
22,9
22.
22,8
76.
46.
Oth
er
Sala
ries
13,1
57.
7,4
73.
20,6
30.
20,6
12.
18.
Purc
hased P
rofe
ssio
nal and T
echnic
al S
erv
ices
10,2
00.
180.
10,3
80.
10,3
73.
7.
Oth
er
Purc
hased S
erv
ices
8,5
00.
(1
,700.)
6,8
00.
6,8
00.
0.
Supplie
s a
nd M
ate
rials
10,0
00.
(2,0
99.)
7,9
01.
7,9
01.
0.
Oth
er
Obje
cts
4,0
00.
(9
81.)
3,0
19.
3,0
08.
11.
Tota
l S
upport
Serv
ices -
School A
dm
inis
tration
150,4
15.
3,6
74.
154,0
89.
154,0
06.
83.
Centr
al S
erv
ices:
Sala
ries
142,1
36.
0.
142,1
36.
142,1
36.
0.
Purc
hased P
rofe
ssio
nal S
erv
ices
500.
(5
00.)
0.
0.
0.
Purc
hased T
echnic
al S
erv
ices
10,0
00.
(1,0
00.)
9,0
00.
7,5
00.
1,5
00.
Mis
cella
neous P
urc
hased S
erv
ices
4,8
00.
(1
,400.)
3,4
00.
2,4
14.
986.
Supplie
s a
nd M
ate
rials
1,5
00.
0.
1,5
00.
1,1
53.
347.
Mis
cella
neous E
xpenditure
s1,2
00.
0.
1,2
00.
1,1
20.
80.
Tota
l C
entr
al S
erv
ices
160,1
36.
(2
,900.)
157,2
36.
154,3
23.
2,9
13.
Adm
in.
Info
. T
echnolo
gy:
Purc
hased T
echnic
al S
erv
ices
30,0
00.
0.
30,0
00.
25,7
14.
4,2
86.
Tota
l A
dm
in.
Info
. T
echnolo
gy
30,0
00.
0.
30,0
00.
25,7
14.
4,2
86.
5
45

EX
HIB
IT C
-1
Vari
ance
Ori
gin
al
Budget
Fin
al
Favora
ble
Budget
Tra
nsfe
rsB
udget
Actu
al
(U
nfa
vora
ble
)
LA
WR
EN
CE
TO
WN
SH
IP S
CH
OO
L D
IST
RIC
T
BU
DG
ET
AR
Y C
OM
PA
RIS
ON
SC
HE
DU
LE
GE
NE
RA
L F
UN
D
FIS
CA
L Y
EA
R E
ND
ED
JU
NE
30,
2018
Allo
wable
Main
tenance f
or
School F
acili
ties:
Cle
anin
g,
Repair
and M
ain
tenance S
erv
ices
112,8
00.
$
0.
$
112,8
00.
$
70,4
21.
$
42,3
79.
$
Genera
l S
upplie
s2,5
00.
0.
2,5
00.
751.
1,7
49.
Tota
l A
llow
able
Main
tenance f
or
School F
acili
ties
115,3
00.
0.
115,3
00.
71,1
72.
44,1
28.
Oth
er
Opera
tion a
nd M
ain
tenance o
f P
lant
Serv
ices:
Sala
ries
163,4
43.
(4
00.)
163,0
43.
160,1
82.
2,8
61.
Purc
hased P
rofe
ssio
nal and T
echnic
al S
erv
ices
30,0
00.
0.
30,0
00.
26,7
66.
3,2
34.
Cle
anin
g,
Repair
and M
ain
tenance S
erv
ices
25,5
00.
(340.)
25,1
60.
14,8
79.
10,2
81.
Insura
nce
36,8
72.
(704.)
36,1
68.
36,1
54.
14.
Mis
cella
neous P
urc
hased S
erv
ices
2,0
00.
4,9
53.
6,9
53.
6,9
41.
12.
Genera
l S
upplie
s30,0
00.
(1,8
01.)
28,1
99.
24,8
94.
3,3
05.
Energ
y (
Natu
ral G
as)
34,8
00.
0.
34,8
00.
26,5
63.
8,2
37.
Energ
y (
Ele
ctr
icity)
120,0
00.
(2
0.)
119,9
80.
94,6
63.
25,3
17.
Oth
er
Obje
cts
585.
1,3
71.
1,9
56.
1,9
01.
55.
Tota
l O
ther
Opera
tion a
nd M
ain
tenance o
f P
lant
Serv
ices
443,2
00.
3,0
59.
446,2
59.
392,9
43.
53,3
16.
Tota
l O
pera
tion a
nd M
ain
tenance o
f P
lant
Serv
ices
558,5
00.
3,0
59.
561,5
59.
464,1
15.
97,4
44.
Stu
dents
Tra
nsport
ation S
erv
ices:
Sala
ries -
Betw
een H
om
e &
School
11,9
79.
0.
11,9
79.
10,8
62.
1,1
17.
Managem
ent
Fee-E
SC
Tra
nsport
ation P
rogra
ms
10,0
00.
(1,2
00.)
8,8
00.
0.
8,8
00.
Oth
er
Purc
hased P
rofe
ssio
nal and T
echnic
al S
erv
ice
3,2
00.
0.
3,2
00.
3,0
90.
110.
Contr
acte
d S
erv
- A
id in L
ieu o
f P
aym
ents
- N
onpublic
13,2
60.
740.
14,0
00.
14,0
00.
0.
Contr
acte
d S
erv
- A
id in L
ieu o
f P
aym
ents
- C
hart
er
3,5
36.
464.
4,0
00.
4,0
00.
0.
Contr
acte
d S
erv
- A
id in L
ieu o
f P
aym
ents
- C
hoic
e
6,1
88.
6.
6,1
94.
6,1
94.
0.
Contr
acte
d S
erv
ices (
Hom
e/S
chool)
- V
endors
476,3
88.
(3
9,1
36.)
437,2
52.
425,8
00.
11,4
52.
Contr
acte
d S
erv
ices (
Not
Hom
e/S
chool)
- V
endors
24,5
80.
28,4
75.
53,0
55.
46,9
41.
6,1
14.
Contr
acte
d S
erv
ices (
Specia
l E
d)
- E
SC
s210,0
00.
2,4
75.
212,4
75.
212,4
72.
3.
Tota
l S
tudent
Tra
nsport
ation S
erv
ices
759,1
31.
(8
,176.)
750,9
55.
723,3
59.
27,5
96.
6
46

EX
HIB
IT C
-1
Vari
ance
Ori
gin
al
Budget
Fin
al
Favora
ble
Budget
Tra
nsfe
rsB
udget
Actu
al
(U
nfa
vora
ble
)
LA
WR
EN
CE
TO
WN
SH
IP S
CH
OO
L D
IST
RIC
T
BU
DG
ET
AR
Y C
OM
PA
RIS
ON
SC
HE
DU
LE
GE
NE
RA
L F
UN
D
FIS
CA
L Y
EA
R E
ND
ED
JU
NE
30,
2018
Unallo
cate
d B
enefits
:
Socia
l S
ecuri
ty C
ontr
ibutions
73,0
00.
$
11,8
00.
$
84,8
00.
$
81,6
68.
$
3,1
32.
$
Oth
er
Retire
ment
Contr
ibutions -
Regula
r115,0
93.
(1
,500.)
113,5
93.
76,4
87.
37,1
06.
Unem
plo
ym
ent
Com
pensation
30,0
00.
0.
30,0
00.
30,0
00.
0.
Work
men's
Com
pensation
54,2
05.
0.
54,2
05.
44,2
45.
9,9
60.
Health B
enefits
987,5
58.
(1
0,3
00.)
977,2
58.
836,4
48.
140,8
10.
Tuitio
n R
eim
burs
em
ent
10,0
00.
0.
10,0
00.
0.
10,0
00.
Oth
er
Em
plo
yee B
enefits
36,6
00.
0.
36,6
00.
21,9
97.
14,6
03.
Tota
l U
nallo
cate
d B
enefits
1,3
06,4
56.
0.
1,3
06,4
56.
1,0
90,8
45.
215,6
11.
On B
ehalf T
PA
F P
ensio
n C
ontr
ibution (
Non-B
udgete
d)
0.
0.
0.
735,5
56.
(735,5
56.)
Reim
burs
ed T
PA
F S
oc.
Sec.
Contr
ibution (
Non-B
udgete
d)
0.
0.
0.
243,9
64.
(243,9
64.)
Tota
l U
ndis
trib
ute
d E
xpenditure
s5,7
82,8
15.
4,2
80.
5,7
87,0
95.
6,1
78,2
24.
(391,1
29.)
Tota
l C
urr
ent
Expenditure
s8,6
36,8
04.
(12,4
44.)
8,6
24,3
60.
8,8
73,1
23.
(248,7
63.)
CA
PIT
AL O
UT
LA
Y:
Undis
trib
ute
d:
Equip
ment
0.
24,0
70.
24,0
70.
15,2
68.
8,8
02.
Tota
l U
ndis
trib
ute
d0.
24,0
70.
24,0
70.
15,2
68.
8,8
02.
Facili
ties A
cquis
itio
n a
nd C
onstr
uction S
erv
ices:
Arc
hitectu
ral/E
ngin
eeri
ng S
erv
ices
90,0
00
(33,3
00)
56,7
00
056,7
00
Constr
uction S
erv
ices
50,0
00.
(47,3
61.)
2,6
39.
0.
2,6
39.
Supplie
s a
nd M
ate
rials
0.
3,3
00.
3,3
00.
0.
3,3
00.
Assessm
ent
for
Debt
Serv
ice o
n S
DA
Fundin
g
40,0
20.
0.
40,0
20.
40,0
20.
0.
Tota
l F
acili
ties A
cquis
itio
n a
nd C
onstr
uction S
erv
ices
180,0
20.
(7
7,3
61.)
102,6
59.
40,0
20.
62,6
39.
Tota
l C
apital O
utlay E
xpenditure
s180,0
20.
(5
3,2
91.)
126,7
29.
55,2
88.
71,4
41.
Tra
nsfe
r to
Chart
er
School
37,1
11.
13,4
58.
50,5
69.
50,5
69.
0.
Tota
l G
enera
l F
und
8,8
53,9
35.
(52,2
77.)
8,8
01,6
58.
8,9
78,9
80.
(177,3
22.)
Excess (
Deficie
ncy)
of
Revenues O
ver/
(Under)
Expenditure
s(4
79,0
59.)
167,5
86.
(311,4
73.)
510,5
76.
822,0
49.
7
47

EX
HIB
IT C
-1
Vari
ance
Ori
gin
al
Budget
Fin
al
Favora
ble
Budget
Tra
nsfe
rsB
udget
Actu
al
(U
nfa
vora
ble
)
LA
WR
EN
CE
TO
WN
SH
IP S
CH
OO
L D
IST
RIC
T
BU
DG
ET
AR
Y C
OM
PA
RIS
ON
SC
HE
DU
LE
GE
NE
RA
L F
UN
D
FIS
CA
L Y
EA
R E
ND
ED
JU
NE
30,
2018
Oth
er
Fin
ancin
g S
ourc
es:
Opera
ting T
ransfe
r O
ut:
Tra
nsfe
r to
Debt
Serv
ice F
d0.
$
0.
$
0.
$
(52,3
16.)
$
(52,3
16.)
$
Capital R
eserv
e -
Tra
nsfe
r to
Capital P
roje
cts
Fd
(400,0
00.)
(1
68,6
00.)
(568,6
00.)
(623,0
10.)
(5
4,4
10.)
Tota
l O
ther
Fin
ancin
g S
ourc
es:
(400,0
00.)
(1
68,6
00.)
(568,6
00.)
(675,3
26.)
(1
06,7
26.)
Excess (
Deficie
ncy)
of
Revenues a
nd O
ther
Fin
ancin
g S
ourc
es
Over
(Under)
Expenditure
s a
nd O
ther
Fin
ancin
g S
ourc
es (
Uses)
(879,0
59.)
(1
,014.)
(8
80,0
73.)
(164,7
50.)
715,3
23.
Fund B
ala
nce,
July
12,4
20,0
45.
0.
2,4
20,0
45.
2,4
20,0
45.
0.
Fund B
ala
nce,
June 3
01,5
40,9
86.
$
(1,0
14.)
$
1,5
39,9
72.
$
2,2
55,2
95.
$
715,3
23.
$
Recapitula
tion:
Restr
icte
d F
und B
ala
nce:
Capital R
eserv
e544,6
32.
$
Main
tenance R
eserv
e338,0
00.
Em
erg
ency R
eserv
e250,0
00.
Tuitio
n R
eserv
e298,9
00.
Excess S
urp
lus D
esig
nate
d f
or
Subsequent
Year's E
xpenditure
s218,8
91.
Excess S
urp
lus -
Curr
ent
Year
235,3
24.
Assig
ned F
und B
ala
nce:
Year-
End E
ncum
bra
nces
83,2
79.
Desig
nate
d f
or
Subsequent
Year's E
xpenditure
s19,1
82.
Unassig
ned F
und B
ala
nce
267,0
87.
Tota
l2,2
55,2
95.
Reconcili
ation t
o G
overn
menta
l F
unds S
tate
ments
(G
AA
P):
Less:
Sta
te A
id P
aym
ents
Not
Recogniz
ed o
n G
AA
P B
asis
(566,7
41.)
Fund B
ala
nce P
er
Govern
menta
l F
unds (
GA
AP
)1,6
88,5
54.
$
8
48

EX
HIB
IT C
-2
Varia
nce
Orig
inal
Budget
Fin
al
Fin
al to
Budget
Tra
nsfe
rsB
udget
Actu
al
Actu
al
RE
VE
NU
ES
:
Local S
ourc
es
2,5
10.
$
0.
$
2,5
10.
$
2,5
10.
$
0.
$
Sta
te S
ourc
es
376,5
09.
0.
376,5
09.
369,6
80.
(6,8
29.)
Fe
dera
l S
ourc
es
452,3
01.
0.
452,3
01.
446,5
75.
(5,7
26.)
To
tal R
evenues
831,3
20.
0.
831,3
20.
818,7
65.
(12,5
55.)
EX
PE
ND
ITU
RE
S:
Instr
uctio
n:
Sala
rie
s o
f T
eachers
338,9
64.
1,5
45.
340,5
09.
339,2
26.
1,2
83.
Oth
er
Sala
rie
s f
or
Instr
uctio
n92,1
02.
1,5
05.
93,6
07.
93,6
07.
0.
Oth
er
Purc
hased S
erv
ices
174,7
36.
0.
174,7
36.
174,7
36.
0.
Genera
l S
upplie
s25,0
25.
1,4
05.
26,4
30.
19,6
70.
6,7
60.
To
tal In
str
uctio
n630,8
27.
4,4
55.
635,2
82.
627,2
39.
8,0
43.
Support
Serv
ices:
Sala
rie
s o
f O
ther
Pro
fessio
nal S
taff
49,4
17.
1.
49,4
18.
49,4
17.
1.
Pers
onal S
erv
ices -
Em
plo
yee B
enefits
140,0
76.
0.
140,0
76.
140,0
76.
0.
Contr
acte
d S
erv
ices
3,0
00.
0.
3,0
00.
1,1
60.
1,8
40.
Tra
vel
3,0
00.
(330.)
2,6
70.
0.
2,6
70.
Supplie
s &
Mate
ria
ls5,0
00.
(4,1
26.)
874.
873.
1.
To
tal S
upport
Serv
ices
200,4
93.
(4,4
55.)
196,0
38.
191,5
26.
4,5
12.
To
tal E
xpenditure
s831,3
20.
0.
831,3
20.
818,7
65.
12,5
55.
To
tal O
utf
low
s831,3
20.
0.
831,3
20.
818,7
65.
12,5
55.
Excess (
Deficie
ncy)
of
Revenues O
ver
(Under)
Expenditure
s a
nd O
ther
Fin
ancin
g S
ourc
es (
Uses)
0.
$
0.
$
0.
$
0.
$
0.
$
LA
WR
EN
CE
TO
WN
SH
IP S
CH
OO
L D
IST
RIC
T
BU
DG
ET
AR
Y C
OM
PA
RIS
ON
SC
HE
DU
LE
SP
EC
IAL R
EV
EN
UE
FU
ND
FO
R T
HE
FIS
CA
L Y
EA
R E
ND
ED
JU
NE
30,
2018
49

NOTES TO REQUIRED SUPPLEMENTARY
INFORMATION – Part II

EXHIBIT C-3
Explanation of Differences between Budgetary Inflows and Outflows and GAAP Revenues and Expenditures.
General Fund
Special
Revenue Fund
Capital Projects
Fund
Sources/inflows of resources:
Actual amounts (budgetary) "revenues" from the budgetary
comparison schedules 9,489,556.$ 818,765.$ 0.$
Differences - Budget to GAAP:
Prior Year Encumbrance Paid 0. 4,824. 0.
Current Year Encumbrance 0. 0. 0.
572,580. 24,198. 0.
(566,741.) (28,069.) 0.
9,495,395.$ 819,718.$ 0.$
Uses/Outflow of resources:
9,654,306.$ 818,765.$ 0.$
Differences - Budget to GAAP:
Prior Year Encumbrance Paid 0. 4,824. 0.
Current Year Encumbrance 0. 0. 0.
9,654,306.$ 823,589.$ 0.$
LAWRENCE TOWNSHIP SCHOOL DISTRICT
Grant accounting budgetary basis differs from
expenditures, and the related revenue is recognized.
Total Expenditures as reported on the statement of revenues, expenditures,
and changes in fund balances - governmental funds.
FOR THE FISCAL YEAR ENDED JUNE 30, 2018
BUDGETARY COMPARISON SCHEDULE
NOTES TO REQUIRED SUPPLEMENTARY INFORMATION
State aid payment recognized for GAAP statement in the current year,
previously recognized for budgetary purposes.
State aid payment recognized for budgetary purposes not recognized for
GAAP statements until the subsequent year.
Total revenues as reported in the statement of revenues, expenditures and
changes in fund balances - governmental funds.
Actual amounts (budgetary basis) "total outflows" from the budgetary
comparison schedule.
Encumbrances for supplies and equipment ordered but not received are
reported in the year the order is placed for budgetary purposes, but in the
year the supplies are received for financial reporting purposes.
GAAP in that encumbrances are recognized as
50

REQUIRED SUPPLEMENTARY
INFORMATION–PART III

SCHEDULES RELATED TO ACCOUNTING AND
REPORTING FOR PENSIONS (GASB 68)

EX
HIB
IT L
-1
2017
2016
2015
2014
2013
Dis
tric
t's p
roport
ion o
f th
e n
et pensio
n
liabili
ty (
asset)
0.0
0814060%
0.0
0860831%
0.0
0806251%
0.0
0710032%
0.0
0714000%
Dis
tric
t's p
roport
ionate
share
of
the n
et
pensio
n lia
bilt
iy (
asset)
1,8
95,0
02.
$
2,5
49,5
35.
$
1,8
09,8
73.
$
1,3
29,3
74.
$
1,3
64,6
10.
$
Dis
tric
t's c
overe
d-e
mplo
yee p
ayro
ll671,7
10.
$
649,0
03.
$
535,6
49.
$
565,5
67.
$
N/A
Dis
tric
t 's
pro
port
ionate
share
of
the n
et
pensio
n lia
bili
ty (
asset)
as a
perc
enta
ge
of
its c
overe
d-e
mplo
yee p
ayro
ll282.1
2%
392.8
4%
337.8
8%
235.0
5%
N/A
Pla
n f
iducia
ry n
et positio
n a
s a
perc
enta
ge o
f th
e tota
l pensio
n lia
bili
ty48.1
0%
40.1
4%
47.9
3%
52.0
8%
48.7
2%
SO
UR
CE
: G
AS
B 6
8 r
eport
on P
ublic
Em
plo
yee's
Retire
ment S
yste
m; D
istr
ict R
ecord
s
NO
TE
: T
his
schedule
is r
equired b
y G
AS
B 6
8 to b
e s
how
info
rmation f
or
a 1
0 y
ear
period.
A
dditio
nal years
will
be p
resente
d a
s they
becom
e a
vaila
ble
.
LA
WR
EN
CE
TO
WN
SH
IP S
CH
OO
L D
IST
RIC
T
SC
HE
DU
LE
S O
F D
IST
RIC
T'S
PR
OP
OR
TIO
NA
TE
SH
AR
E O
F T
HE
NE
T P
EN
SIO
N L
IAB
ILIT
Y
PE
RS
Last F
ive F
iscal Y
ears
Measure
ment D
ate
Endin
g J
une 3
0,
51

EX
HIB
IT L
-2
2018
2017
2016
2015
2014
Contr
actu
ally
required c
ontr
ibutio
n75,4
14.
$
76,4
75.
$
69,3
16.
$
58,5
34.
$
53,7
99.
$
Contr
ibutio
ns in
rela
tio
n t
o t
he
contr
actu
ally
required c
ontr
ibutio
n(7
5,4
14.)
(76,4
75.)
(69,3
16.)
(5
8,5
34.)
(53,7
99.)
Contr
ibutio
n d
eficie
ncy (
excess)
0.
0.
0.
0.
0.
Dis
tric
t's c
overe
d-e
mplo
yee p
ayro
ll671,7
10.
$
649,0
03.
$
535,6
49.
$
565,5
67.
$
N/A
Contr
ibutio
ns a
s a
perc
enta
ge o
f
covere
d-e
mplo
yee p
ayro
ll11.2
3%
11.7
8%
12.9
4%
10.3
5%
N/A
2018
2017
2016
2015
2014
Contr
actu
ally
required c
ontr
ibutio
nN
/AN
/AN
/AN
/AN
/A
Contr
ibutio
ns in
rela
tio
n t
o t
he
contr
actu
ally
required c
ontr
ibutio
nN
/AN
/AN
/AN
/AN
/A
Contr
ibutio
n d
eficie
ncy (
excess)
N/A
N/A
N/A
N/A
N/A
Dis
tric
t's c
overe
d-e
mplo
yee p
ayro
ll3,1
84,2
33.
$
3,1
97,9
92.
$
2,9
97,4
23.
$
3,0
65,2
68.
$
N/A
Contr
ibutio
ns a
s a
perc
enta
ge o
f
covere
d-e
mplo
yee p
ayro
llN
/AN
/AN
/AN
/AN
/A
SO
UR
CE
: G
AS
B 6
8 r
eport
on P
ublic
Em
plo
yee's
Retire
ment
Syste
m/T
eachers
' P
ensio
n a
nd A
nnuity F
und;
Dis
tric
t R
ecord
s
NO
TE
: T
his
schedule
is r
equired b
y G
AS
B 6
8 t
o b
e s
how
in
form
atio
n f
or
a 1
0 y
ear
perio
d.
Additio
nal years
will
be p
resente
d a
s t
hey b
ecom
e a
vaila
ble
.
Fis
cal Y
ear
Endin
g J
une 3
0,
TP
AF
LA
WR
EN
CE
TO
WN
SH
IP S
CH
OO
L D
IST
RIC
T
SC
HE
DU
LE
OF
DIS
TR
ICT
CO
NT
RIB
UT
ION
S
Last
Fiv
e F
iscal Y
ears
PE
RS
Fis
cal Y
ear
Endin
g J
une 3
0,
52

EX
HIB
IT L
-3
2017
2016
2015
2014
2013
Dis
tric
t's p
roport
ion o
f th
e n
et pensio
n lia
bili
ty
(asset)
N/A
N/A
N/A
N/A
N/A
Dis
tric
t's p
roport
ionate
share
of
the n
et
N/A
N/A
N/A
N/A
N/A
pensio
n lia
bilt
iy (
asset)
Sta
te's
pro
port
ionate
share
of
the n
et pensio
n
liabili
ty (
asset)
associa
ted w
ith the D
istr
ict
20,2
09,1
34.
$
23,3
78,6
00.
$
18,2
76,4
41.
$
16,7
71,7
55.
$
16,7
17,7
13.
$
Tota
l20,2
09,1
34.
$
23,3
78,6
00.
$
18,2
76,4
41.
$
16,7
71,7
55.
$
16,7
17,7
13.
$
Dis
tric
t's c
overe
d-e
mplo
yee p
ayro
ll3,1
84,2
33.
$
3,1
97,9
92.
$
2,9
97,4
23.
$
3,0
65,2
68.
$
N
/A
Dis
tric
t 's
pro
port
ionate
share
of
the n
et
pensio
n lia
bili
ty (
asset)
as a
perc
enta
ge
of
its c
overe
d-e
mplo
yee p
ayro
llN
/AN
/AN
/AN
/AN
/A
Pla
n f
iducia
ry n
et positio
n a
s a
perc
enta
ge o
f th
e tota
l pensio
n lia
bili
ty25.4
1%
28.7
1%
28.7
1%
33.6
4%
33.7
6%
SO
UR
CE
: G
AS
B 6
8 r
eport
on T
eachers
' P
ensio
n a
nd A
nnuity F
und; D
istr
ict R
ecord
s
NO
TE
: T
his
schedule
is r
equired b
y G
AS
B 6
8 to b
e s
how
info
rmation f
or
a 1
0 y
ear
period.
A
dditio
nal years
will
be p
resente
d a
s they
becom
e a
vaila
ble
.
LA
WR
EN
CE
TO
WN
SH
IP S
CH
OO
L D
IST
RIC
T
SC
HE
DU
LE
S O
F T
HE
DIS
TR
ICT
'S P
RO
PO
RT
ION
AT
E S
HA
RE
OF
TH
E N
ET
PE
NS
ION
LIA
BIL
ITY
TP
AF
Last F
ive F
iscal Y
ears
Measure
ment D
ate
Endin
g J
une 3
0,
53

NOTES TO REQUIRED SUPPLEMENTARY
INFORMATION – PART III

EXHIBIT L-4
LAWRENCE TOWNSHIP SCHOOL DISTRICT
NOTES TO REQUIRED SUPPLEMENTARY INFORMATION
PENSION SCHEDULES
JUNE 30, 2018
Note 1. Teachers’ Pension and Annuity Fund (TPAF)
Changes of benefits terms. The vesting and benefits provisions are set by N.J.S.A. 18A:66. TPAF provides
retirement, death, and disability benefits. All benefits vest after years of service, except for medical benefits,
which vest after 25 years of service or under the disability provisions of TPAF. Members are always fully
vested for their own contributions and, after three years of service credit, become vented for 2% of related
interest earned on the contributions. In the case of death before retirement, members’ beneficiaries are
entitled to full interest credited to the member’s accounts.
Changes of assumptions. Mortality rates were based on the RP-2000 Health Annuitant Mortality for Males
or Females, as appropriate, with adjustments for mortality improvements based on Scale AA. Pre-retirement
mortality improvements for active member are projected using Scale AA from the base year of 2000 until
the valuation date plus 15 years to account for future mortality improvement. Post-retirement mortality
improvement for non-disabled annuitants are projected using Scale AA from the base year of 2000 for males
and 2003 for females until the valuation date plus 7 years to account for future mortality improvement.
Note 2. Public Employees’ Retirement System (PERS)
Changes of benefits terms. The vesting and benefits provisions are set by N.J.S.A. 43:15A. PERS provides
retirement, death, and disability benefits. All benefits vest after ten years of service, except for medical
benefits, which vest after 25 years of service or under the disability provisions of PERS.
Changes of assumptions. Mortality rates were based on the RP-2000 Combined Healthy Male and Female
Mortality Tables (setback 1 year for females) with adjustments for mortality improvements from the base
year of 2012 Based on Projection Scale AA.
Note 3. Schedule of School District’s Proportionate Share of the Net Pension Liability – PERS/TPAF
and Schedule of Employer’s Contribution for PERS/TPAF
The information presented in these required supplementary schedules was determined as part of the audit of
the State of New Jersey Division of Pension and Benefits. Additional information for the pension schedules
can be found in the notes to the financial statements.
54

REQUIRED SUPPLEMENTARY
INFORMATION–PART IV

SCHEDULES RELATED TO ACCOUNTING AND
REPORTING FOR OPEB (GASB 75)

EXHIBIT M-1
2017 2016
District's proportion of the net OPEB
liability (asset) 0.00% 0.00%
District's proportionate share of the net
OPEB liabiltiy (asset) 0.$ 0.$
State's proportionate share of the net OPEB
liability (asset) associated with the District 15,092,145. 16,254,767.
Total 15,092,145.$ 16,254,767.$
District's covered payroll 3,855,943.$ 3,846,995.$
District's proportionate share of the net OPEB
liability (asset) as a percentage of its
covered-employee payroll 0.00% 0.00%
Plan fiduciary net position as a percentage
of the total OPEB liability 0.00% 0.00%
State's proportionate shater of OPEB
associated with the District:
Service Cost 672,981.$
Interest Cost 478,156.
Changes in Assumptions (1,993,891.)
Member Contributions 12,872.
Benefit Payments (349,566.)
Changes in Total OPEB Liability (1,179,448.)
State's proportionate share of the net OPEB
liability (asset) associated with the District -
Beginning Balance 16,271,593.
Ending Balance 15,092,145.$
State's proportionate share of the net OPEB
liability associated with the District -
as a percentage of its covered-employee payroll 391.40%
SOURCE: GASB 75 report on State of New Jersey Health Benefits Program; District Records
NOTE: This schedule is required by GASB 75 to show information for a 10 year period.
However, information is only currently available for two years.
Measurement Date
Ending June 30,
Additional years will be presented as they become available.
LAWRENCE TOWNSHIP BOARD OF EDUCATION
SCHEDULES OF DISTRICT'S PROPORTIONATE SHARE OF THE NET OPEB LIABILITY
PERS AND TPAF
Last Two Fiscal Years
����55

EXHIBIT M-2
2017 2016
District's proportion of the OPEB Contribution 0.00% 0.00%
District's proportionate of the OPEB Contribution 0.$ 0.$
State's proportionate share of the OPEB
contribution associated with the District 974,446. 1,273,137.
Total 974,446. 1,273,137.
District's covered payroll 3,855,943.$ 3,846,995.$
District's proportionate share of the net OPEB
liability (asset) as a percentage of its
covered-employee payroll 0.00% 0.00%
Plan fiduciary net position as a percentage
of the total OPEB liability 0.00% 0.00%
SOURCE: GASB 75 report on State of New Jersey Health Benefits Program; District records
NOTE: This schedule is required by GASB 75 to show information for a 10 year period.
However, information is only currently available for two years.
Additional years will be presented as they become available.
Fiscal Year Ending June 30,
LAWRENCE TOWNSHIP BOARD OF EDUCATION
SCHEDULE OF THE DISTRICT'S PROPORTIONATE SHARE OPEB CONTRIBUTIONS
PERS AND TPAF
Last Two Fiscal Years
����
56

NOTES TO REQUIRED SUPPLEMENTARY
INFORMATION – PART IV

LAWRENCE TOWNSHIP BOARD OF EDUCATION
NOTES TO REQUIRED SUPPLEMENTARY INFORMATION
OPEB SCHEDULES
JUNE 30, 2018
Note 1. State Health Benefit Local Education Retired Employees OPEB Plan
Benefit Changes
None
Changes of Actuarial Assumptions
The discount rate changed from 2.85% as of June 30, 2016 to 3.58% as of June 30, 2017.
���� 57

OTHER SUPPLEMENTARY INFORMATION

SCHOOL BASED BUDGET SCHEDULES
N/A
SPECIAL REVENUE FUND

I.D
.E.A
. I.D
.E.A
. P
rivate
Pre
-School
Part
BP
art
BR
EA
PF
oundation
Education
Tota
ls
Title
I, P
art
AT
itle
II, P
art
AT
itle
IV
Basic
Pre
-School
Gra
nt
Gra
nts
Aid
2018
Revenues:
Local S
ourc
es
0.
$
0.
$
0.
$
0.
$
0.
$
0.
$
2,5
10.
$
0.
$
2,5
10.
$
Sta
te S
ourc
es
0.
0.
0.
0.
0.
0.
0.
369,6
80.
369,6
80.
Federa
l S
ourc
es
236,2
08.
25,6
31.
10,0
00.
170,2
02.
4,5
34.
0.
0.
0.
446,5
75.
Tota
l R
evenues
236,2
08.
$
25,6
31.
$
10,0
00.
$
170,2
02.
$
4,5
34.
$
0.
$
2,5
10.
$
369,6
80.
$
818,7
65.
$
Expenditure
s:
Instr
uction:
S
ala
ries o
f T
eachers
183,4
74.
$
20,0
00.
$
0.
$
0.
$
0.
$
0.
$
0.
$
135,7
52.
$
339,2
26.
$
O
ther
Sala
ries for
Instr
uction
0.
0.
0.
0.
0.
0.
0.
93,6
07.
93,6
07.
O
ther
Purc
hased S
erv
ices
0.
0.
0.
170,2
02.
4,5
34.
0.
0.
0.
174,7
36.
G
enera
l S
upplie
s1,3
60.
31.
10,0
00.
0.
0.
0.
2,5
10.
5,7
69.
19,6
70.
Tota
l In
str
uction
184,8
34.
20,0
31.
10,0
00.
170,2
02.
4,5
34.
0.
2,5
10.
235,1
28.
627,2
39.
Support
Serv
ices:
S
ala
ries o
f O
ther
Pro
fessio
nal S
taff
0.
0.
0.
0.
0.
0.
0.
49,4
17.
49,4
17.
P
ers
onal S
erv
ices -
Em
plo
yee B
enefits
51,3
74.
5,6
00.
0.
0.
0.
0.
0.
83,1
02.
140,0
76.
Contr
acte
d S
erv
ices
0.
0.
0.
0.
0.
0.
0.
1,1
60.
1,1
60.
S
upplie
s &
Mate
rials
0.
0.
0.
0.
0.
0.
0.
873.
873.
Tota
l S
upport
Serv
ices
51,3
74.
5,6
00.
0.
0.
0.
0.
0.
134,5
52.
191,5
26.
Tota
l E
xpenditure
s236,2
08.
$
25,6
31.
$
10,0
00.
$
170,2
02.
$
4,5
34.
$
0.
$
2,5
10.
$
369,6
80.
$
818,7
65.
$
CO
MB
ININ
G S
CH
ED
ULE
OF
PR
OG
RA
M R
EV
EN
UE
S A
ND
EX
PE
ND
ITU
RE
S
FO
R T
HE
FIS
CA
L Y
EA
R E
ND
ED
JU
NE
30, 2018
BU
DG
ET
AR
Y B
AS
IS
58
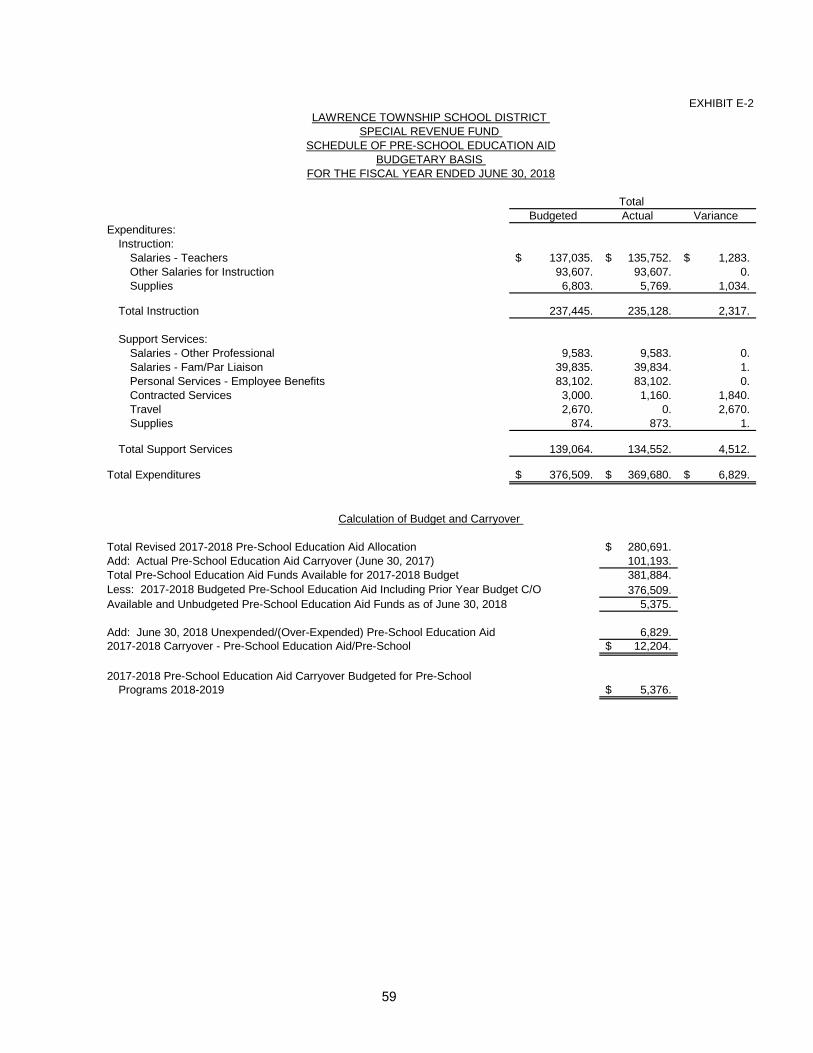
EXHIBIT E-2
Budgeted Actual Variance
Expenditures:
Instruction:
Salaries - Teachers 137,035.$ 135,752.$ 1,283.$
Other Salaries for Instruction 93,607. 93,607. 0.
Supplies 6,803. 5,769. 1,034.
Total Instruction 237,445. 235,128. 2,317.
Support Services:
Salaries - Other Professional 9,583. 9,583. 0.
Salaries - Fam/Par Liaison 39,835. 39,834. 1.
Personal Services - Employee Benefits 83,102. 83,102. 0.
Contracted Services 3,000. 1,160. 1,840.
Travel 2,670. 0. 2,670.
Supplies 874. 873. 1.
Total Support Services 139,064. 134,552. 4,512.
Total Expenditures 376,509.$ 369,680.$ 6,829.$
Total Revised 2017-2018 Pre-School Education Aid Allocation 280,691.$
Add: Actual Pre-School Education Aid Carryover (June 30, 2017) 101,193.
Total Pre-School Education Aid Funds Available for 2017-2018 Budget 381,884.
Less: 2017-2018 Budgeted Pre-School Education Aid Including Prior Year Budget C/O 376,509.
Available and Unbudgeted Pre-School Education Aid Funds as of June 30, 2018 5,375.
Add: June 30, 2018 Unexpended/(Over-Expended) Pre-School Education Aid 6,829.
2017-2018 Carryover - Pre-School Education Aid/Pre-School 12,204.$
2017-2018 Pre-School Education Aid Carryover Budgeted for Pre-School
Programs 2018-2019 5,376.$
LAWRENCE TOWNSHIP SCHOOL DISTRICT
Calculation of Budget and Carryover
Total
FOR THE FISCAL YEAR ENDED JUNE 30, 2018
BUDGETARY BASIS
SCHEDULE OF PRE-SCHOOL EDUCATION AID
SPECIAL REVENUE FUND
59

CAPITAL PROJECTS FUND

EX
HIB
IT F
-1
LA
WR
EN
CE
TO
WN
SH
IP B
OA
RD
OF
ED
UC
AT
ION
CA
PIT
AL P
RO
JE
CT
S F
UN
D
SU
MM
AR
Y S
CH
ED
ULE
OF
PR
OJE
CT
EX
PE
ND
ITU
RE
S
FO
R T
HE
YE
AR
EN
DE
D J
UN
E 3
0, 2018
Prior
Year's
Tota
l A
uth
orized
Expenditure
sC
urr
ent Y
ear
Tra
nsfe
r to
Unexpended
Pro
ject D
escription
Cost
and T
ransfe
rsE
xpenditure
sD
ebt S
erv
ice F
und
Adju
stm
ent
Bala
nce
Myr
on L
. P
ow
ell
Ele
menta
ry:
School Im
pro
vem
ents
2010
6,5
49,1
46.
$
6,4
46,4
62.
$
0.
$
102,6
84.
$
0.
$
0.
$
Myr
on L
. P
ow
ell
Ele
menta
ry:
Part
ial R
oof
Repla
cem
ent
623,0
10.
$
0.
$
623,0
10.
$
0.
$
0.
$
0.
$
Tota
l7,1
72,1
56.
$
6,4
46,4
62.
$
623,0
10.
$
102,6
84.
$
0.
$
0.
$
60

EXHIBIT F-2
LAWRENCE TOWNSHIP BOARD OF EDUCATION
CAPITAL PROJECTS FUND
SUMMARY SCHEDULE OF REVENUES, EXPENDITURES, AND
CHANGES IN FUND BALANCE-BUDGETARY BASIS
FOR THE YEAR ENDED JUNE 30, 2018
Revenues and Other Financing Sources:
State sources - SDA Grant 0.$
Transfer from capital reserve 623,010.
Total revenues and other financing sources 623,010.
Expenditures and Other Financing Uses:
Purchased professional and technical services 55,290.
Construction services 567,720.
Total expenditures and other financing uses 623,010.
Excess (deficiency) of revenues over (under) expenditures 0.
Other Financing Sources (Uses):
Transfer from General Fund Fund 0.
Transfer to Debt Service Fund (102,684.)
Net change in fund balance (102,684.)
Fund balance - beginning 102,684.
Fund balance - ending 0.$
61

EXHIBIT F-2a
LAWRENCE TOWNSHIP BOARD OF EDUCATION
CAPITAL PROJECTS FUND
SCHEDULE OF PROJECT REVENUES, EXPENDITURES, AND PROJECT BALANCE
MYRON L POWELL SCHOOL IMPROVEMENTS-2010
FOR THE YEAR ENDED JUNE 30, 2018
Revised
Authorized
Prior Periods Current Year Totals Cost
Revenues and other financing sources:
State sources - SDA Grant 3,815,222.$ 0.$ 3,815,222.$ 3,815,222.$
Bond proceeds 2,216,000. 0. 2,216,000. 2,216,000.
Bond premium 886. 0. 886. 0.
Interest income 32,000. 0. 32,000. 0.
Transfer from capital reserve 300,000. 0. 300,000. 300,000.
Transfer from general fund 786. 0. 786. 786.
Total revenues and other financing sources 6,364,894. 0. 6,364,894. 6,332,008.
Expenditures and Other Financing Uses:
Purchased professional and technical services 611,400. 0. 611,400. 611,400.
Construction services 5,137,233. 0. 5,137,233. 5,659,917.
Transfer to debt service 452,886. 102,684. 555,570. 0.
Other objects 60,691. 0. 60,691. 60,691.
Total expenditures and other financing uses 6,262,210. 102,684. 6,364,894. 6,332,008.
Excess (deficiency) or revenues over (under)
expenditures 102,684.$ (102,684.)$ 0.$ 0.$
Additional project information:
DOE Project Number 2570-030-09-1001
SDA Project Number 2570-030-09-00BT
Grant Number G5-4048
Grant Date 1/7/2010
Bond Authorization Date 12/10/2009
Bonds Authorized 2,216,000.$
Bonds Issued 2,216,000.$
Original Authorized Cost 6,549,146.$
Additional Authorized Cost (749,822.)$
Revised Authorized Cost 5,799,324.$
Percentage Increase Over Original Authorized Cost 0%
Percentage Completion 100.00%
Original Target Completion Date August, 2011
Revised Target Completion Date August, 2012
62

EXHIBIT F-2b
LAWRENCE TOWNSHIP BOARD OF EDUCATION
CAPITAL PROJECTS FUND
SCHEDULE OF PROJECT REVENUES, EXPENDITURES, AND PROJECT BALANCE
PARTIAL ROOF REPLACEMENT
FOR THE YEAR ENDED JUNE 30, 2018
Revised
Authorized
Prior Periods Current Year Totals Cost
Revenues and other financing sources:
State sources - SDA Grant 0.$ 0.$ 0.$ 0.$
Transfer from capital reserve 0. 623,010. 623,010. 623,010.
Total revenues and other financing sources 0. 623,010. 623,010. 623,010.
Expenditures and Other Financing Uses:
Purchased professional and technical services 0. 55,290. 55,290. 55,290.
Construction services 0. 567,720. 567,720. 567,720.
Total expenditures and other financing uses 0. 623,010. 623,010. 623,010.
Excess (deficiency) or revenues over (under)
expenditures 0.$ 0.$ 0.$ 0.$
Additional project information:
DOE Project Number NA
SDA Project Number NA
Grant Number NA
Grant Date NA
Bond Authorization Date NA
Bonds Authorized 0.$
Bonds Issued 0.$
Original Authorized Cost 400,000.$
Additional Authorized Cost 223,010.$
Revised Authorized Cost 623,010.$
Percentage Increase Over Original Authorized Cost 56%
Percentage Completion 100.00%
Original Target Completion Date June, 2018
Revised Target Completion Date June, 2018
63

PROPRIETARY FUNDS
ENTERPRISE FUND

EXHIBIT G-1
Food
Service Latchkey Total
ASSETS:
Current Assets:
Cash and cash equivalents 18,305.$ 52,085.$ 70,390.$
Accounts receivable:
State 794. 0. 794.
Federal 49,984. 0. 49,984.
Interfund 37,816. 6,026. 43,842.
Other 37,063. 4,045. 41,108.
Inventories 4,762. 0. 4,762.
Total current assets 148,724. 62,156. 210,880.
Fixed assets:
Equipment 112,879. 0. 112,879.
Accumulated depreciation (98,955.) 0. (98,955.)
Total fixed assets 13,924. 0. 13,924.
Total assets 162,648.$ 62,156.$ 224,804.$
DEFERRED OUTFLOW OF RESOURCES: 23,249.$ 0.$ 23,249.$
LIABILITIES:
Current Liabilities:
Accounts payable 64,900.$ 0.$ 64,900.$
Pension account payable 3,030. 0. 3,030.
Interfund accounts payable 0. 1,782. 1,782.
Prepaid latchkey 0. 20,377. 20,377.
Total current liabilities 67,930. 22,159. 90,089.
Long-term debt:
Net pension liability 57,515. 0. 57,515.
Total liabilities 125,445. 22,159. 147,604.
DEFERRED INFLOW OF RESOURCES: 14,042.$ 0.$ 14,042.$
NET POSITION:
Invested in capital assets net of
related debt 13,924. 0. 13,924.
Unrestricted 32,486. 39,997. 72,483.
Total net position 46,410.$ 39,997.$ 86,407.$
LAWRENCE TOWNSHIP SCHOOL DISTRICT
ENTERPRISE FUNDS
COMBINING STATEMENT OF NET POSITION
AS OF JUNE 30, 2018
64

EXHIBIT G-2
Food
Service Latchkey Totals
OPERATING REVENUES:
Local sources:
Daily sales-reimbursable programs:
School lunch and breakfast program 37,238.$ 0.$ 37,238.$
Daily sales non-reimbursable programs:
Adult and other sales 94,136. 0. 94,136.
Service fees 0. 46,283. 46,283.
Total operating revenues 131,374. 46,283. 177,657.
OPERATING EXPENSES:
Cost of sales - reimbursable 84,401. 0. 84,401.
Cost of sales - nonreimbursable 30,432. 0. 30,432.
Salaries and fringe benefits 127,256. 24,805. 152,061.
Pension Expense 2,832. 0. 2,832.
Miscellaneous 8,485. 216. 8,701.
Supplies and materials 17,756. 7,485. 25,241.
Repairs and Maintenance 651. 0. 651.
Management fees 35,000. 0. 35,000.
Depreciation 2,519. 0. 2,519.
Purchased Service 933. 0. 933.
Total operating expenses 310,265. 32,506. 342,771.
Operating income/(loss) before transfer (178,891.) 13,777. (165,114.)
Operating transfer in/out:
Operating transfer in/(out) 0. 0. 0.
Operating income/(loss) (178,891.) 13,777. (165,114.)
Nonoperating revenues (expenses):
State sources:
State school lunch program 2,676. 0. 2,676.
Federal sources:
National school breakfast program 37,300. 0. 37,300.
National school lunch program 120,059. 0. 120,059.
National afterschool snack 8,927. 0. 8,927.
Food distribution program 16,908. 0. 16,908.
Interest 104. 105. 209.
Total nonoperation revenues 185,974. 105. 186,079.
Change in net position 7,083. 13,882. 20,965.
Net position - beginning 49,613. 26,115. 75,728.
Prior year adjustment-equipment (10,286.) 0. (10,286.)
Net position - ending 46,410.$ 39,997.$ 86,407.$
LAWRENCE TOWNSHIP SCHOOL DISTRICT
COMBINING STATEMENT OF REVENUES, EXPENSES,
AND CHANGES IN FUND NET POSITION
FOR THE FISCAL YEAR ENDED JUNE 30, 2018
65

EXHIBIT G-3
Food
Service Latchkey
Fund Fund Totals
CASH FLOWS FROM OPERATING ACTIVITIES
Receipts from customer 59,788.$ 51,043.$ 110,831.$
Cash payments to suppliers (297,714.) (6,857.) (304,571.)
Other receipts (payment) 45,244. 0. 45,244.
Payment to employees (37,180.) (24,492.) (61,672.)
Net cash used by operating activities (229,862.) 19,694. (210,168.)
CASH FLOWS FROM NONCAPITAL FINANCING ACTIVITIES:
State sources 2,068. 0. 2,068.
Federal sources 127,460. 0. 127,460.
Net cash provided by non-capital financing activities 129,528. 0. 129,528.
CASH FLOWS FROM FINANCING ACTIVITIES
Interest on Investment 104. 105. 209.
Net cash provided by financing activities 104. 105. 209.
Net increase/(decrease) in cash and cash equilvalents (100,230.) 19,799. (80,431.)
Cash and cash equivalents - July 1 118,535. 32,286. 150,821.
Cash and cash equivalents - June 30 18,305.$ 52,085.$ 70,390.$
Reconciliation of operating income/(loss) to
net cash provided/(used) by operating activities:
Operating income/(loss) (178,891.)$ 13,777.$ (165,114.)$
Adjustments to reconcile operating loss to cash
provided (used) by operating activities:
Depreciation 2,519. 0. 2,519.
Federal commodities 16,908. 0. 16,908.
Change in assets and liabilities:
(Increase)/decrease in accounts receivable (25,539.) (1,905.) (27,444.)
(Increase)/decrease in inventory 656. 0. 656.
(Increase)/decrease in interfund account receivables 2,171. 575. 2,746.
(Increase)/decrease in outflow of resources 7,890. 0. 7,890.
Increase/(decrease) in accounts payable (50,518.) 0. (50,518.)
Increase/(decrease) in interfund accounts payable 0. 582. 582.
Increase/(decrease) in pension accounts payable 701. 0. 701.
Increase/(decrease) in prepaid latchkey 0. 6,665. 6,665.
Increase/(decrease) in deferred inflow of resources 13,877. 0. 13,877.
Increase/(decrease) in net pension liability (19,636.) 0. (19,636.)
Net cash provided by (used) by operating activities (229,862.)$ 19,694.$ (210,168.)$
LAWRENCE TOWNSHIP SCHOOL DISTRICT
ENTERPRISE FUNDS
COMBINING STATEMENT OF CASH FLOWS
FOR THE FISCAL YEAR ENDED JUNE 30, 2018
66

INTERNAL SERVICE FUND

EXHIBIT G-4
Shared
Business
Service
ASSETS:
Current assets:
Cash and cash equivalents 540,538.$
Total current assets 540,538.
Fixed assets:
Equipment 10,117.
Accumulated depreciation (7,242.)
Total fixed assets 2,875.
Total assets 543,413.$
DEFERRED OUTFLOW OF RESOURCES: 54,083$
LIABILITIES:
Current liabilities:
Pension account payable 7,003.
Total current liabilities 7,003.
Long-term debt:
Net pension liability 132,916.
Total liabilities 139,919.
DEFERRED INFLOW OF RESOURCES 32,680.
NET POSITION:
Invested in capital assets net of
related debt 2,875.
Unrestricted 422,022.
Total net position 424,897.$
AS OF JUNE 30, 2018
LAWRENCE TOWNSHIP SCHOOL DISTRICT
INTERNAL SERVICE FUNDS
COMBINING STATEMENT OF NET POSITION
67
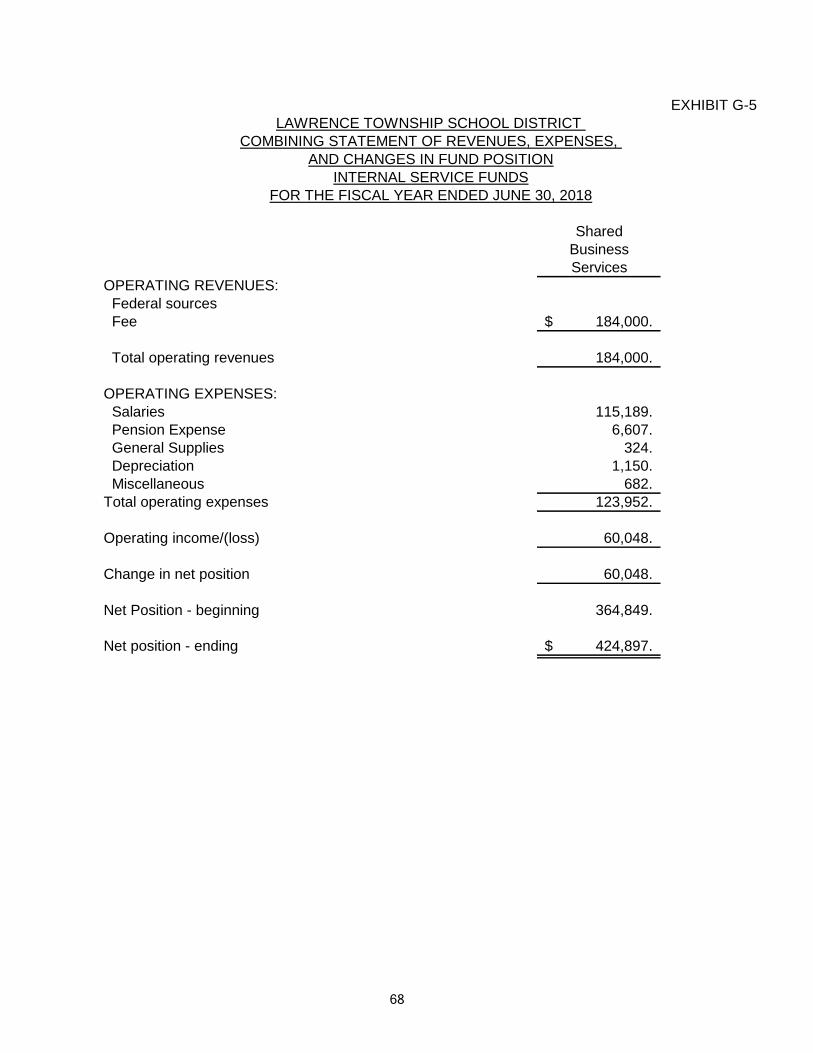
EXHIBIT G-5
Shared
Business
Services
OPERATING REVENUES:
Federal sources
Fee 184,000.$
Total operating revenues 184,000.
OPERATING EXPENSES:
Salaries 115,189.
Pension Expense 6,607.
General Supplies 324.
Depreciation 1,150.
Miscellaneous 682.
Total operating expenses 123,952.
Operating income/(loss) 60,048.
Change in net position 60,048.
Net Position - beginning 364,849.
Net position - ending 424,897.$
LAWRENCE TOWNSHIP SCHOOL DISTRICT
INTERNAL SERVICE FUNDS
COMBINING STATEMENT OF REVENUES, EXPENSES,
FOR THE FISCAL YEAR ENDED JUNE 30, 2018
AND CHANGES IN FUND POSITION
68

EXHIBIT G-6
Shared
Business
Services
CASH FLOW FROM OPERATING ACTIVITIES:
Receipts from customers 184,000.$
Payment to suppliers (1,006.)
Payment to employees (115,189.)
Net cash provided (used) by operating activities 67,805.
CASH FLOWS FOR FINANCING ACTIVITIES:
Purchase of equipment 0.
Net cash provided (used) by financing activities 0.
Net increase/decrease in cash and cash equivalents 67,805.
Cash and cash equivalents - July 1 472,733.
Cash and cash equivalents - June 30 540,538.$
Reconciliation of operating income/(loss) to net cash provided/
(used) by operating activities:
Operating income (loss) 60,048.$
Adjustments to reconcile operating loss to
cash provided (used) by operating activities:
Depreciation 1,150.
Change in assets and liabilities:
(Increase)/decrease in deferred outflow of resources 18,410
Increase/(decrease) in pension account payable 1,635
Increase/(decrease) in deferred inflow of resources 32,379
Increase/(decrease) in net pension liability (45,817)
Net cash provided (used in) operating activities 67,805.$
LAWRENCE TOWNSHIP SCHOOL DISTRICT
COMBINING STATEMENT OF CASH FLOWS
INTERNAL SERVICE FUNDS
FOR THE FISCAL YEAR ENDED JUNE 30, 2018
69

FIDUCIARY FUND

EX
HIB
IT H
-1
Private
Purp
ose
Unem
plo
yment
Stu
dent
Payr
oll/
Fle
x-S
avin
gs
Schola
rship
Com
pensation
Activity
Agency
Account
Fund
Tru
st
Tota
l
AS
SE
TS
:
Cash &
Cash E
quiv
ale
nts
17,6
08.
$
9,2
42.
$
684.
$
9,7
75.
$
85,8
53.
$
123,1
62.
$
Due f
rom
Agency
0.
0.
0.
0.
9,9
27.
9,9
27.
Due f
rom
Genera
l0.
2,7
18.
0.
0.
60,0
00.
62,7
18.
Tota
l A
ssets
17,6
08.
$
11,9
60.
$
684.
$
9,7
75.
$
155,7
80.
$
195,8
07.
$
DE
FE
RR
ED
OU
TF
LO
W O
F R
ES
OU
RC
ES
:0.
$
0.
$
0.
$
0.
$
0.
$
0.
$
LIA
BIL
ITIE
S:
Due to S
tudent G
roups
17,6
08.
$
0.
$
0.
$
0.
$
0.
$
17,6
08.
$
Due to P
ayr
oll
Withhold
ings
0.
2,0
33.
0.
0.
0.
2,0
33.
Due to U
nem
plo
yment
0.
9,9
27.
0.
0.
0.
9,9
27.
Tota
l Lia
bili
ties
17,6
08.
$
11,9
60.
$
0.
$
0.
$
0.
$
29,5
68.
$
DE
FE
RR
ED
IN
FLO
W O
F R
ES
OU
RC
ES
:0.
$
0.
$
0.
$
0.
$
0.
$
0.
$
NE
T P
OS
ITIO
N:
0.
$
0.
$
684.
$
9,7
75.
$
155,7
80.
$
166,2
39.
$
Tota
l N
et P
ositio
n0.
$
0.
$
684.
$
9,7
75.
$
155,7
80.
$
166,2
39.
$
LA
WR
EN
CE
TO
WN
SH
IP S
CH
OO
L D
IST
RIC
T
CO
MB
ININ
G S
TA
TE
ME
NT
OF
FID
UC
IAR
Y N
ET
PO
SIT
ION
AS
OF
JU
NE
30, 2018
70

EXHIBIT H-2
Unemployment Private Purpose
Compensation Flex-Savings Scholarship
Trust Account Fund Total
ADDITIONS:
Contributions:
Plan Member 7,494.$ 6,280.$ 0.$ 13,774.$
Other 0. 351. 2,698. 3,049.
Board Contribution 30,000. 0. 0. 30,000.
Total Contributions 37,494. 6,631. 2,698. 46,823.
Investment Earnings:
Interest 174. 3. 20. 197.
Net Investment Earnings 174. 3. 20. 197.
Total Additions 37,668. 6,634. 2,718. 47,020.
DEDUCTIONS:
Scholarships Awarded 0. 0. 3,000. 3,000.
Medical Reimbursement 0. 5,947. 0. 5,947.
Other 174. 3. 428. 605.
Unemployment Claims 4,679. 0. 0. 4,679.
Total Deductions 4,853. 5,950. 3,428. 14,231.
Change in Net Position 32,815. 684. (710.) 32,789.
NET POSITION, JULY 1 122,965. 0. 10,485. 133,450.
NET POSITION, JUNE 30 155,780.$ 684.$ 9,775.$ 166,239.$
FOR FISCAL YEAR ENDED JUNE 30, 2018
LAWRENCE TOWNSHIP SCHOOL DISTRICT
COMBINING STATEMENT OF CHANGES IN FIDUCIARY NET POSITION
FIDUCIARY FUND
71

EX
HIB
IT H
-3
Cash
Cash
Bala
nce
Cash
Cash
Bala
nce
July
1, 2017
Receip
tsD
isburs
em
ents
June 3
0, 2018
Myr
on L
. P
ow
ell
16,6
42.
$
22,1
31.
$
21,1
65.
$
17,6
08.
$
Tota
l 16,6
42.
$
22,1
31.
$
21,1
65.
$
17,6
08.
$
FID
UC
AIR
Y F
UN
D
FO
R T
HE
FIS
CA
L Y
EA
R E
ND
ED
JU
NE
30, 2018
OF
RE
CE
IPT
S A
ND
DIS
BU
RS
EM
EN
TS
ST
UD
EN
T A
CT
IVIT
Y A
GE
NC
Y F
UN
D S
CH
ED
ULE
LA
WR
EN
CE
TO
WN
SH
IP S
CH
OO
L D
IST
RIC
T
72

EXHIBIT H-4
Balance Balance
July 1, 2017 Additions Deletions June 30, 2018
ASSETS:
Cash and Cash Equivalents 5,367.$ 5,006,384.$ 5,002,509.$ 9,242.$
Due from General 3,353. 0. 635. 2,718.
Total Assets 8,720.$ 5,006,384.$ 5,003,144.$ 11,960.$
LIABILITIES:
Net Payroll 0.$ 2,763,686.$ 2,763,686.$ 0.$
Payroll Deductions and Withholdings 2,491. 2,239,000. 2,239,458. 2,033.
Due to Unemployment 6,229. 3,698. 0. 9,927.
Total Liabilities 8,720.$ 5,006,384.$ 5,003,144.$ 11,960.$
FOR THE FISCAL YEAR ENDED JUNE 30, 2018
LAWRENCE TOWNSHIP SCHOOL DISTRICT
PAYROLL AGENCY FUND
SCHEDULE OF RECEIPTS AND DISBURSEMENTS
FIDUCIARY FUND
73

LONG-TERM DEBT

EX
HIB
IT I-1
Issue
Date
A
mount
School R
efu
ndin
g B
onds:
S
eri
es 2
007
12/2
7/2
007
2,3
45,0
00.
$
3/1
/16-1
7165,0
00.
$
3.0
0%
- 4
.16%
845,0
00.
$
0.
$
160,0
00.
$
685,0
00.
$
3/1
/18-2
1160,0
00.
3/1
/2022
155,0
00.
3/1
/2023
50,0
00.
1/2
1/2
010
2,2
16,0
00.
$
9/1
/2016
145,0
00.
2.7
5%
-3.7
5%
1,4
31,0
00.
0.
155,0
00.
1,2
76,0
00.
S
eri
es 2
010
9/1
/2017
155,0
00.
9/1
/2018
160,0
00.
9/1
/2019
165,0
00.
9/1
/2020
175,0
00.
9/1
/2021
180,0
00.
9/1
/2022
190,0
00.
9/1
/2023
200,0
00.
9/1
/2024
206,0
00.
TO
TA
L2,2
76,0
00.
$
0.
$
315,0
00.
$
1,9
61,0
00.
$
LA
WR
EN
CE
TO
WN
SH
IP S
CH
OO
L D
IST
RIC
T
DE
BT
SE
RV
ICE
FU
ND
SC
HE
DU
LE
OF
SE
RIA
L B
ON
DS
JU
NE
30, 2018
Retire
d
Bala
nce
June 3
0, 2018
Issued
Myro
n L
Pow
ell
Ele
menta
ry S
chool
Additio
ns
Date
of
Issue
Am
ount
Ori
gin
al Is
sue
Annual M
atu
rities
Inte
rest R
ate
Range
Bala
nce
July
1, 2017
74

EXHIBIT I-3
Original
Budget
Budget
Transfer
Final
Budget Actual
Variance
Final to
Actual
REVENUES:
Local Sources:
Local Tax Levy 132,582.$ 0.$ 132,582.$ 132,582.$ 0.$
State Sources:
Debt Service Aid - Type II 108,713. 0. 108,713. 108,713. 0.
Total Revenues 241,295. 0. 241,295. 241,295. 0.
EXPENDITURES:
Regular Debt Service:
Interest 81,295. 0. 81,295. 81,294. 1.
Redemption of Principal 315,000. 0. 315,000. 315,000. 0.
Total Regular Debt Service 396,295. 0. 396,295. 396,294. 1.
Total Expenditures 396,295. 0. 396,295. 396,294. 1.
Excess (deficiency) of revenues
(over)/under expenditures (155,000.) 0. (155,000.) (154,999.) 1.
Other Financing Sources (Uses):
Transfers from Capital Project Fund 155,000. 0. 155,000. 102,684. (52,316.)
Transfers from General Fund 0. 0. 0. 52,316. 52,316.
Total Other Financing Sources/(Uses) 155,000. 0. 155,000. 155,000. 0.
Excess (deficiency) of revenues and other sources
(over)/under expenditures and other uses 0. 0. 0. 1. 1.
Fund Balance, July 1 1. 0. 1. 1. 0.
Fund Balance, June 30 1.$ 0.$ 1.$ 2.$ 1.$
LAWRENCE TOWNSHIP SCHOOL DISTRICT BOARD OF EDUCATION
DEBT SERVICE FUND
BUDGETARY COMPARISON SCHEDULE
FOR THE FISCAL YEAR ENDED JUNE 30, 2018
75

STATISTICAL SECTION

FINANCIAL TRENDS

EX
HIB
IT J
-1
2009
2010
2011
2012
2013
2014
2015
2016
2017
2018
Govern
menta
l A
ctivitie
s:
Investe
d in c
apital assets
, net of re
late
d d
ebt
1,8
24,0
01.
$
1,0
26,8
48.
$
3,4
73,3
78.
$
4,2
95,0
03.
$
4,5
94,8
71.
$
5,0
77,4
40.
$
5,1
39,5
84.
$
5,2
32,1
99.
$
5,2
63,3
69.
$
5,9
80,1
13.
$
Restr
icte
d820,2
26.
821,9
43.
1,2
38,8
24.
1,8
61,2
13.
2,3
00,0
67.
2,2
32,8
98.
2,1
34,9
52.
2,2
24,5
06.
2,2
53,5
47.
1,9
88,2
09.
Unre
str
icte
d826,6
15.
790,5
06.
570,2
78.
(85,7
08.)
238,4
53.
(20,2
80.)
(1,3
12,0
32.)
(1,4
32,7
09.)
(1,5
74,2
90.)
(1,6
21,1
16.)
Tota
l govern
menta
l activitie
s n
et positio
n3,4
70,8
42.
$
2,6
39,2
97.
$
5,2
82,4
80.
$
6,0
70,5
08.
$
7,1
33,3
91.
$
7,2
90,0
58.
$
5,9
62,5
04.
$
6,0
23,9
96.
$
5,9
42,6
26.
$
6,3
47,2
06.
$
Busin
ess-T
ype A
ctivitie
s:
Investe
d in c
apital assets
, net of re
late
d d
ebt
9,6
20.
$
34,9
86.
$
106,8
68.
$
98,3
28.
$
91,9
39.
$
84,9
47.
$
77,9
55.
$
30,1
97.
$
26,7
29.
$
13,9
24.
$
Unre
str
icte
d130,4
68.
141,7
04.
41,2
67.
17,4
76.
31,0
57.
66,6
70.
33,0
78.
41,7
22.
48,9
99.
72,4
83.
Tota
l busin
ess-t
ype a
ctivitie
s n
et positio
n140,0
88.
$
176,6
90.
$
148,1
35.
$
115,8
04.
$
122,9
96.
$
151,6
17.
$
111,0
33.
$
71,9
19.
$
75,7
28.
$
86,4
07.
$
Dis
tric
t-W
ide:
Investe
d in c
apital assets
, net of re
late
d d
ebt
1,8
33,6
21.
$
1,0
61,8
34.
$
3,5
80,2
46.
$
4,3
93,3
31.
$
4,6
86,8
10.
$
5,1
62,3
87.
$
5,2
17,5
39.
$
5,2
62,3
96.
$
5,2
90,0
98.
$
5,9
94,0
37.
$
Restr
icte
d820,2
26.
821,9
43.
1,2
38,8
24.
1,8
61,2
13.
2,3
00,0
67.
2,2
32,8
98.
2,1
34,9
52.
2,2
24,5
06.
2,2
53,5
47.
1,9
88,2
09.
Unre
str
icte
d957,0
83.
932,2
10.
611,5
45.
(68,2
32.)
269,5
10.
46,3
90.
(1,2
78,9
54.)
(1,3
90,9
87.)
(1,5
25,2
91.)
(1,5
48,6
33.)
Tota
l D
istr
ict N
et P
ositio
n3,6
10,9
30.
$
2,8
15,9
87.
$
5,4
30,6
15.
$
6,1
86,3
12.
$
7,2
56,3
87.
$
7,4
41,6
75.
$
6,0
73,5
37.
$
6,0
95,9
15.
$
6,0
18,3
54.
$
6,4
33,6
13.
$
LA
ST
TE
N F
ISC
AL Y
EA
RS
NE
T P
OS
ITIO
N B
Y C
OM
PO
NE
NT
,
LA
WR
EN
CE
TO
WN
SH
IP S
CH
OO
L D
IST
RIC
T
Fis
cal Y
ear
Endin
g J
une 3
0,
(Accru
al B
asis
of A
ccounting)
76
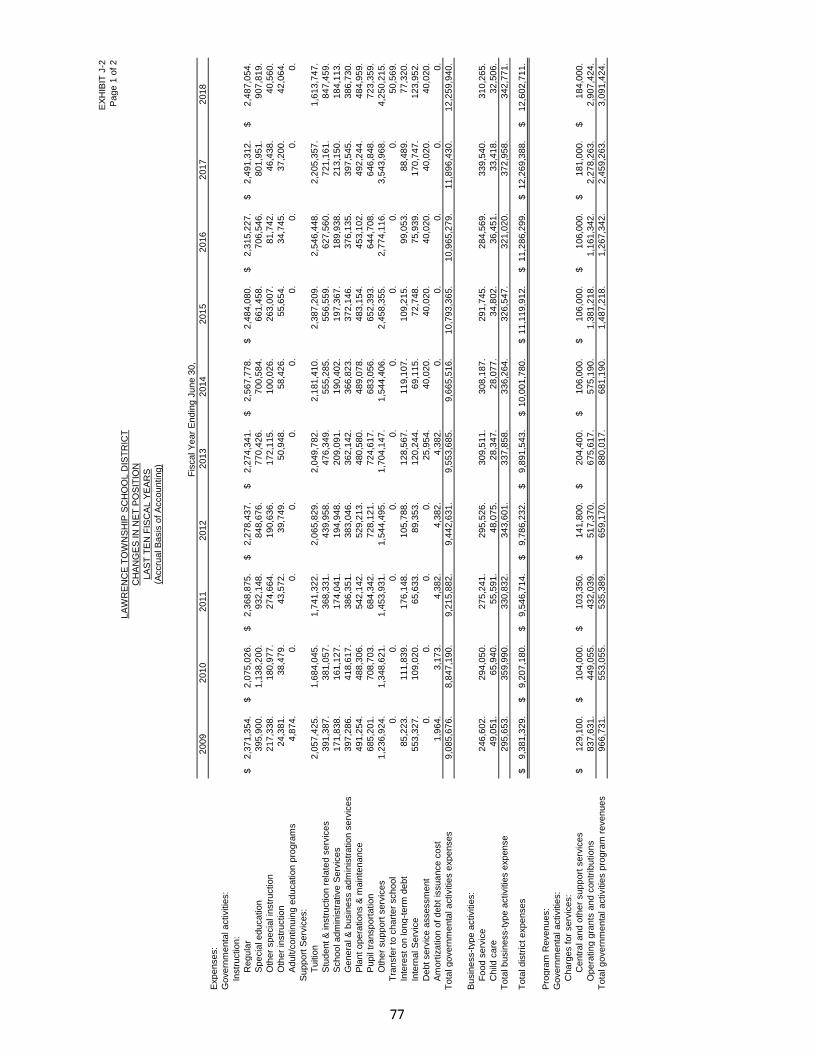
EX
HIB
IT J
-2
Pa
ge
1 o
f 2
20
09
20
10
20
11
20
12
20
13
20
14
20
15
20
16
20
17
20
18
Exp
en
se
s:
Go
ve
rnm
en
tal a
ctivitie
s:
Instr
uctio
n:
Re
gu
lar
2,3
71
,35
4.
$
2
,07
5,0
26
.$
2,3
68
,87
5.
$
2
,27
8,4
37
.$
2,2
74
,34
1.
$
2,5
67
,77
8.
$
2
,48
4,0
80
.$
2,3
15
,22
7.
$
2,4
91
,31
2.
$
2,4
87
,05
4.
$
Sp
ecia
l e
du
ca
tio
n3
95
,90
0.
1
,13
8,2
00
.
93
2,1
48
.
84
8,6
76
.
77
0,4
26
.
70
0,5
84
.
66
1,4
58
.
70
6,5
46
.
80
1,9
51
.
90
7,8
19
.
Oth
er
sp
ecia
l in
str
uctio
n2
17
,33
8.
1
80
,97
7.
2
74
,66
4.
1
90
,63
6.
1
72
,11
5.
1
00
,02
6.
2
63
,00
7.
8
1,7
42
.
4
6,4
38
.
4
0,5
60
.
Oth
er
instr
uctio
n2
4,3
81
.
3
8,4
79
.
4
3,5
72
.
3
9,7
49
.
5
0,9
48
.
5
8,4
26
.
5
5,6
54
.
3
4,7
45
.
3
7,2
00
.
4
2,0
64
.
Ad
ult/c
on
tin
uin
g e
du
ca
tio
n p
rog
ram
s4
,87
4.
0
.
0
.
0
.
0
.
0.
0.
0.
0
.
0.
Su
pp
ort
Se
rvic
es:
Tu
itio
n2
,05
7,4
25
.
1,6
84
,04
5.
1
,74
1,3
22
.
2,0
65
,82
9.
2
,04
9,7
82
.
2
,18
1,4
10
.
2,3
87
,20
9.
2
,54
6,4
48
.
2
,20
5,3
57
.
1
,61
3,7
47
.
Stu
de
nt
& in
str
uctio
n r
ela
ted
se
rvic
es
39
1,3
87
.
38
1,0
57
.
36
8,3
31
.
43
9,9
58
.
47
6,3
49
.
55
5,2
85
.
55
6,5
59
.
62
7,5
60
.
72
1,1
61
.
84
7,4
59
.
Sch
oo
l a
dm
inis
tra
tive
Se
rvic
es
17
1,8
38
.
16
1,1
27
.
17
4,0
41
.
19
4,9
48
.
20
9,0
91
.
19
0,4
02
.
19
7,3
67
.
18
9,9
38
.
21
3,1
50
.
18
4,1
13
.
Ge
ne
ral &
bu
sin
ess a
dm
inis
tra
tio
n s
erv
ice
s3
97
,28
6.
4
18
,61
7.
3
86
,35
1.
3
83
,04
6.
3
62
,14
2.
3
66
,82
3.
3
72
,14
6.
3
76
,13
5.
3
97
,54
5.
3
86
,73
0.
Pla
nt
op
era
tio
ns &
ma
inte
na
nce
49
1,2
54
.
48
8,3
06
.
54
2,1
42
.
52
9,2
13
.
48
0,5
80
.
48
9,0
78
.
48
3,1
54
.
45
3,1
02
.
49
2,2
44
.
48
4,9
59
.
Pu
pil
tra
nsp
ort
atio
n6
85
,20
1.
7
08
,70
3.
6
84
,34
2.
7
28
,12
1.
7
24
,61
7.
6
83
,05
6.
6
52
,39
3.
6
44
,70
8.
6
46
,84
8.
7
23
,35
9.
Oth
er
su
pp
ort
se
rvic
es
1,2
36
,92
4.
1
,34
8,6
21
.
1,4
53
,93
1.
1
,54
4,4
95
.
1,7
04
,14
7.
1,5
44
,40
6.
2
,45
8,3
55
.
2,7
74
,11
6.
3,5
43
,96
8.
4,2
50
,21
5.
Tra
nsfe
r to
ch
art
er
sch
oo
l0
.
0
.
0
.
0
.
0
.
0.
0.
0.
0
.
50
,56
9.
Inte
rest
on
lo
ng
-te
rm d
eb
t8
5,2
23
.
1
11
,83
9.
1
76
,14
8.
1
05
,78
8.
1
28
,56
7.
1
19
,10
7.
1
09
,21
5.
9
9,0
53
.
8
8,4
89
.
7
7,3
20
.
Inte
rna
l S
erv
ice
5
53
,32
7.
1
09
,02
0.
6
5,6
33
.
8
9,3
53
.
1
20
,24
4.
6
9,1
15
.
7
2,7
48
.
7
5,9
39
.
1
70
,74
7.
1
23
,95
2.
De
bt
se
rvic
e a
sse
ssm
en
t 0
.
0
.
0
.
0
.
2
5,9
54
.
4
0,0
20
.
4
0,0
20
.
4
0,0
20
.
4
0,0
20
.
4
0,0
20
.
Am
ort
iza
tio
n o
f d
eb
t is
su
an
ce
co
st
1,9
64
.
3,1
73
.
4,3
82
.
4,3
82
.
4,3
82
.
0.
0.
0.
0
.
0.
To
tal g
ove
rnm
en
tal a
ctivitie
s e
xp
en
se
s9
,08
5,6
76
.
8,8
47
,19
0.
9
,21
5,8
82
.
9,4
42
,63
1.
9
,55
3,6
85
.
9
,66
5,5
16
.
10
,79
3,3
65
.
1
0,9
65
,27
9.
1
1,8
96
,43
0.
1
2,2
59
,94
0.
Bu
sin
ess-t
yp
e a
ctivitie
s:
Fo
od
se
rvic
e2
46
,60
2.
2
94
,05
0.
2
75
,24
1.
2
95
,52
6.
3
09
,51
1.
3
08
,18
7.
2
91
,74
5.
2
84
,56
9.
3
39
,54
0.
3
10
,26
5.
Ch
ild c
are
49
,05
1.
65
,94
0.
55
,59
1.
48
,07
5.
28
,34
7.
28
,07
7.
34
,80
2.
36
,45
1.
33
,41
8.
32
,50
6.
To
tal b
usin
ess-t
yp
e a
ctivitie
s e
xp
en
se
29
5,6
53
.
35
9,9
90
.
33
0,8
32
.
34
3,6
01
.
33
7,8
58
.
33
6,2
64
.
32
6,5
47
.
32
1,0
20
.
37
2,9
58
.
34
2,7
71
.
To
tal d
istr
ict
exp
en
se
s9
,38
1,3
29
.$
9,2
07
,18
0.
$
9
,54
6,7
14
.$
9,7
86
,23
2.
$
9
,89
1,5
43
.$
1
0,0
01
,78
0.
$
11
,11
9,9
12
.$
1
1,2
86
,29
9.
$
1
2,2
69
,38
8.
$
1
2,6
02
,71
1.
$
Pro
gra
m R
eve
nu
es:
Go
ve
rnm
en
tal a
ctivitie
s:
Ch
arg
es f
or
se
rvic
es:
Ce
ntr
al a
nd
oth
er
su
pp
ort
se
rvic
es
12
9,1
00
.$
10
4,0
00
.$
10
3,3
50
.$
14
1,8
00
.$
20
4,4
00
.$
10
6,0
00
.$
10
6,0
00
.$
10
6,0
00
.$
18
1,0
00
.$
18
4,0
00
.$
Op
era
tin
g g
ran
ts a
nd
co
ntr
ibu
tio
ns
83
7,6
31
.
44
9,0
55
.
43
2,0
39
.
51
7,3
70
.
67
5,6
17
.
57
5,1
90
.
1,3
81
,21
8.
1
,16
1,3
42
.
2
,27
8,2
63
.
2
,90
7,4
24
.
96
6,7
31
.
55
3,0
55
.
53
5,3
89
.
65
9,1
70
.
88
0,0
17
.
68
1,1
90
.
1,4
87
,21
8.
1
,26
7,3
42
.
2
,45
9,2
63
.
3
,09
1,4
24
.
CH
AN
GE
S IN
NE
T P
OS
ITIO
N
LA
WR
EN
CE
TO
WN
SH
IP S
CH
OO
L D
IST
RIC
T
Fis
ca
l Y
ea
r E
nd
ing
Ju
ne
30
,
(Accru
al B
asis
of
Acco
un
tin
g)
LA
ST
TE
N F
ISC
AL
YE
AR
S
To
tal g
ove
rnm
en
tal a
ctivitie
s p
rog
ram
re
ve
nu
es
����77

EX
HIB
IT J
-2
Pa
ge 2
of
2
20
09
20
10
20
11
20
12
20
13
20
14
20
15
20
16
20
17
20
18
CH
AN
GE
S IN
NE
T P
OS
ITIO
N
LA
WR
EN
CE
TO
WN
SH
IP S
CH
OO
L D
IST
RIC
T
Fis
ca
l Y
ea
r E
nd
ing
Ju
ne
30
,
(Accru
al B
asis
of
Acco
un
tin
g)
LA
ST
TE
N F
ISC
AL
YE
AR
S
Bu
sin
ess-t
yp
e a
ctivitie
s:
Ch
arg
es f
or
se
rvic
es:
Fo
od
se
rvic
e1
02
,47
8.
$
9
7,7
08
.$
6
8,1
22
.$
6
8,5
95
.$
7
4,0
80
.$
7
4,0
78
.$
7
4,2
55
.$
7
5,1
70
.$
1
21
,62
5.
$
1
31
,37
4.
$
Ch
ild c
are
35
,24
6.
46
,63
2.
41
,74
1.
38
,59
1.
43
,14
9.
47
,30
2.
47
,09
5.
65
,64
7.
40
,49
5.
46
,28
3.
Op
era
tin
g g
ran
ts &
co
ntr
ibu
tio
ns
19
5,8
85
.
22
1,4
80
.
19
2,4
14
.
20
4,0
84
.
22
7,3
93
.
24
3,3
24
.
22
1,8
55
.
19
8,9
32
.
19
6,7
32
.
18
5,8
70
.
To
tal b
usin
ess t
yp
e a
ctivitie
s p
rog
ram
re
ve
nu
es
33
3,6
09
.
36
5,8
20
.
30
2,2
77
.
31
1,2
70
.
34
4,6
22
.
36
4,7
04
.
34
3,2
05
.
33
9,7
49
.
35
8,8
52
.
36
3,5
27
.
To
tal d
istr
ict
pro
gra
m r
eve
nu
es
1,3
00
,34
0.
$
9
18
,87
5.
$
8
37
,66
6.
$
9
70
,44
0.
$
1
,22
4,6
39
.$
1
,04
5,8
94
.$
1,8
30
,42
3.
$
1
,60
7,0
91
.$
2
,81
8,1
15
.$
3
,45
4,9
51
.$
Ne
t (E
xp
en
se
)/R
eve
nu
e
Go
ve
rnm
en
tal a
ctivitie
s(8
,11
8,9
45
.)
(8,2
94
,13
5.)
(8
,68
0,4
93
.)
(8,7
83
,46
1.)
(8
,67
3,6
68
.)
(8,9
84
,32
6.)
(9
,30
6,1
47
.)
(9,6
97
,93
7.)
(9
,43
7,1
67
.)
(9,1
68
,51
6.)
Bu
sin
ess-t
yp
e a
ctivitie
s3
7,9
56
.
5
,83
0.
(2
8,5
55
.)
(32
,33
1.)
6
,76
4.
2
8,4
40
.
1
6,6
58
.
1
8,7
29
.
(1
4,1
06
.)
2
0,7
56
.
To
tal d
istr
ict-
wid
e n
et
exp
en
se
(8,0
80
,98
9.)
$
(8
,28
8,3
05
.)$
(8,7
09
,04
8.)
$
(8
,81
5,7
92
.)$
(8,6
66
,90
4.)
$
(8
,95
5,8
86
.)$
(9,2
89
,48
9.)
$
(9
,67
9,2
08
.)$
(9,4
51
,27
3.)
$
(9
,14
7,7
60
.)$
Ge
ne
ral R
eve
nu
es a
nd
Oth
er
Ch
an
ge
s in
Ne
t P
ositio
n
Go
ve
rnm
en
tal a
ctivitie
s:
1,8
79
,69
1.
$
1
,92
7,6
91
.$
1,9
27
,69
1.
$
1
,92
7,6
91
.$
1,9
27
,69
1.
$
1,9
27
,69
1.
$
2
,15
7,5
71
.$
2,2
04
,38
4.
$
2,2
04
,38
4.
$
2,2
48
,47
2.
$
Ta
xe
s le
vie
d f
or
de
bt
se
rvic
e7
6,2
01
.
5
3,2
60
.
1
73
,80
5.
2
80
,56
7.
2
46
,70
9.
2
87
,12
2.
1
50
,74
9.
1
48
,63
9.
1
41
,81
3.
1
32
,58
2.
Gra
nts
an
d c
on
trib
utio
ns
6,5
76
,80
5.
6
,42
4,0
07
.
9,0
90
,96
2.
7
,28
6,6
39
.
7,2
88
,36
0.
6,9
25
,62
5.
6
,93
0,4
61
.
7,4
17
,99
1.
7,0
05
,73
4.
7,1
70
,23
5.
Tu
itio
n r
ece
ive
d5
,80
8.
2
2,4
36
.
4
5,6
80
.
2
,88
2.
6
1,6
84
.
2
4,2
41
.
9
,62
9.
8
,68
9.
0
.
0.
Inve
stm
en
t e
arn
ing
s1
3,7
59
.
2
6,7
47
.
3
4,9
21
.
3
4,3
76
.
2
0,0
77
.
1
1,7
81
.
1
0,9
03
.
6
,45
8.
6
,38
4.
5
,87
1.
Mis
ce
llan
eo
us in
co
me
3
4,5
71
.
3
6,5
09
.
5
0,6
13
.
3
9,3
36
.
1
96
,43
0.
1
0,9
91
.
1
9,8
12
.
1
1,7
20
.
1
5,2
31
.
1
9,7
28
.
Ad
justm
en
t0
.
0
.
0
.
0
.
0
.
0.
0.
(16
,97
3.)
0.
0
.
Ad
justm
en
t to
fix
ed
asse
ts0
.
(1
,02
0,0
00
.)
0.
(2.)
(4,4
00
.)
0.
(51
,92
3.)
(2
1,4
79
.)
0
.
(3,7
91
.)
Tra
nsfe
rs0
.
0
.
0
.
0
.
0
.
0.
0.
0.
(1
7,7
49
.)
0
.
To
tal g
ove
rnm
en
tal a
ctivitie
s8
,58
6,8
35
.
7,4
70
,65
0.
1
1,3
23
,67
2.
9,5
71
,48
9.
9
,73
6,5
51
.
9
,18
7,4
51
.
9,2
27
,20
2.
9
,75
9,4
29
.
9
,35
5,7
97
.
9
,57
3,0
97
.
Bu
sin
ess-t
yp
e a
ctivitie
s:
Inve
stm
en
t e
arn
ing
s0
.
3
6.
0
.
0
.
2
.
18
1.
22
5.
22
1.
1
66
.
20
9.
Ad
justm
en
t to
fix
ed
asse
ts0
.
3
0,7
36
.
0
.
0
.
0
.
0.
0.
(58
,99
4.)
0.
(1
0,2
86
.)
Tra
nsfe
rs0
.
0
.
0
.
0
.
4
26
.
0.
0.
93
0.
1
7,7
49
.
0
.
To
tal b
usin
ess-t
yp
e a
ctivitie
s0
.
3
0,7
72
.
0
.
0
.
4
28
.
18
1.
22
5.
(57
,84
3.)
17
,91
5.
(10
,07
7.)
To
tal d
istr
ict-
wid
e8
,58
6,8
35
.$
7,5
01
,42
2.
$
1
1,3
23
,67
2.
$
9,5
71
,48
9.
$
9
,73
6,9
79
.$
9
,18
7,6
32
.$
9,2
27
,42
7.
$
9
,70
1,5
86
.$
9
,37
3,7
12
.$
9
,56
3,0
20
.$
Ch
an
ge
in
ne
t p
ositio
n
Go
ve
rnm
en
tal a
ctivitie
s4
67
,89
0.
(8
23
,48
5.)
2,6
43
,17
9.
7
88
,02
8.
1
,06
2,8
83
.
2
03
,12
5.
(7
8,9
45
.)
61
,49
2.
(81
,37
0.)
40
4,5
81
.
Bu
sin
ess-t
yp
e a
ctivitie
s3
7,9
56
.
3
6,6
02
.
(2
8,5
55
.)
(32
,33
1.)
7
,19
2.
2
8,6
21
.
1
6,8
83
.
(3
9,1
14
.)
3
,80
9.
1
0,6
79
.
To
tal d
istr
ict
50
5,8
46
.$
(78
6,8
83
.)$
2
,61
4,6
24
.$
75
5,6
97
.$
1,0
70
,07
5.
$
23
1,7
46
.$
(62
,06
2.)
$
2
2,3
78
.$
(7
7,5
61
.)$
4
15
,26
0.
$
Pro
pe
rty t
axe
s le
vie
d f
or
ge
ne
ral p
urp
ose
s,
ne
t
���78

EX
HIB
IT J
-3
2009
2010
2011
2012
2013
2014
2015
2016
2017
2018
Genera
l F
und
Reserv
ed
1,7
68,3
44.
$
1,5
36,9
29.
$
1,4
41,4
24.
$
1,6
63,9
58.
$
2,0
40,3
21.
$
1,7
92,1
70.
$
1,7
60,8
49.
$
1,9
76,8
21.
$
2,1
50,8
63.
$
1,9
88,2
08.
$
Unre
serv
ed
(184,3
46.)
(301,3
72.)
(228,1
56.)
(257,3
96.)
(264,5
50.)
(281,6
38.)
(282,6
16.)
(318,7
29.)
(303,3
98.)
(299,6
54.)
To
tal genera
l fu
nd
1,5
83,9
98.
$
1,2
35,5
57.
$
1,2
13,2
68.
$
1,4
06,5
62.
$
1,7
75,7
71.
$
1,5
10,5
32.
$
1,4
78,2
33.
$
1,6
58,0
92.
$
1,8
47,4
65.
$
1,6
88,5
54.
$
All
Oth
er
Govern
menta
l F
unds
Reserv
ed
0.
$
298,8
27.
$
0.
$
0.
$
0.
$
0.
$
0.
$
0.
$
0.
$
0.
$
Unre
serv
ed,
report
ed in
:
Specia
l re
venue f
und
(23,2
91.)
(2
4,0
62.)
(2
4,9
91.)
(3
1,4
70.)
(2
7,3
50.)
(3
9,6
84.)
(2
9,0
37.)
(3
2,9
09.)
(2
4,1
98.)
(2
8,0
69.)
Capital pro
jects
fund
0.
1,8
88,2
85.
531,9
86.
227,0
35.
532,6
84.
522,6
84.
387,6
84.
247,6
84.
102,6
84.
0.
Debt
serv
ice f
und
22,4
94.
887.
32,8
87.
32,0
00.
0.
1.
2.
1.
0.
1.
To
tal all
oth
er
govern
menta
l fu
nds
(797.)
$
2,1
63,9
37.
$
539,8
82.
$
227,5
65.
$
505,3
34.
$
483,0
01.
$
358,6
49.
$
214,7
76.
$
78,4
86.
$
(28,0
68.)
$
LA
WR
EN
CE
TO
WN
SH
IP S
CH
OO
L D
IST
RIC
T
(Modifie
d A
ccru
al B
asis
of
Accountin
g)
LA
ST
TE
N F
ISC
AL Y
EA
RS
FU
ND
BA
LA
NC
ES
- G
OV
ER
NM
EN
TA
L F
UN
DS
Fis
cal Y
ear
Endin
g J
une 3
0,
79

EX
HIB
IT J
-4
Page 1
of
2
2009
2010
2011
2012
2013
2014
2015
2016
2017
2018
Revenue
Ta
x le
vy
1,9
55,8
92.
$
1,9
80,9
51.
$
2,1
01,4
96.
$
2,2
08,2
58.
$
2,1
74,4
00.
$
2,2
14,8
13.
$
2,3
08,3
20.
$
2,3
53,0
23.
$
2,3
46,1
97.
$
2,3
81,0
54.
$
Tu
itio
n c
harg
es
5,8
08.
22,4
36.
45,6
80.
2,8
82.
61,6
84.
24,2
41.
9,6
29.
8,6
89.
0.
0.
Inte
rest
earn
ings
13,7
59.
26,7
48.
34,9
21.
34,3
76.
20,0
77.
11,7
81.
10,9
03.
6,4
58.
6,3
84.
5,8
71.
Mis
cella
neous
34,5
71.
36,5
09.
50,6
13.
39,3
36.
196,4
30.
10,9
91.
19,8
12.
11,7
20.
15,2
31.
19,7
28.
Sta
te s
ourc
es
6,1
56,7
55.
5,1
09,4
72.
8,9
70,1
76.
7,1
55,3
97.
7,4
65,3
55.
7,0
36,8
75.
7,0
88,9
08.
7,2
60,5
10.
7,4
09,6
62.
7,6
98,3
56.
Fe
dera
l sourc
es
794,5
79.
1,7
20,7
15.
552,8
25.
648,6
12.
498,6
22.
463,9
40.
476,6
26.
440,8
01.
454,9
00.
451,3
99.
To
tal R
evenue
8,9
61,3
64.
8,8
96,8
31.
11,7
55,7
11.
10,0
88,8
61.
10,4
16,5
68.
9,7
62,6
41.
9,9
14,1
98.
10,0
81,2
01.
10,2
32,3
74.
10,5
56,4
08.
Expenditure
s
In
str
uctio
n:
Regula
r in
str
uctio
n2,2
81,7
94.
2,0
11,0
57.
2,3
06,6
53.
2,1
79,6
52.
2,1
37,1
01.
2,4
19,5
26.
2,3
55,9
27.
2,1
86,8
29.
2,3
29,6
41.
2,3
59,6
78.
Specia
l educatio
n in
str
uctio
n379,6
16.
1,1
26,5
69.
920,8
35.
830,7
15.
745,4
73.
673,6
28.
638,1
57.
683,2
01.
772,5
56.
884,6
60.
Oth
er
specia
l in
str
uctio
n217,3
38.
180,9
77.
274,6
64.
190,6
36.
172,1
15.
100,0
26.
263,0
07.
81,7
42.
46,4
38.
40,5
60.
School sponsore
d/o
ther
instr
uctio
n29,2
55.
38,4
79.
43,5
72.
39,7
49.
50,9
48.
58,4
26.
55,6
54.
34,7
45.
37,2
00.
42,0
64.
S
upport
serv
ices:
Tu
itio
n2,0
57,4
25.
1,6
84,0
45.
1,7
41,3
22.
2,0
65,8
29.
2,0
49,7
82.
2,1
81,4
10.
2,3
87,2
09.
2,5
46,4
48.
2,2
05,3
57.
1,6
13,7
47.
Stu
dent
& in
str
uctio
n r
ela
ted s
erv
ices
391,3
87.
381,0
57.
368,3
31.
439,9
58.
476,3
49.
555,2
85.
556,5
59.
627,5
60.
721,1
61.
847,4
59.
Genera
l adm
inis
tratio
n225,6
62.
235,6
70.
196,8
91.
179,5
22.
153,6
55.
155,3
61.
155,7
46.
154,9
66.
162,6
64.
176,5
86.
School adm
inis
tratio
n s
erv
ices
150,6
69.
146,0
07.
159,3
34.
171,5
99.
176,6
52.
149,7
16.
167,0
76.
159,5
90.
174,9
37.
154,0
06.
Centr
al S
erv
ices
150,4
55.
167,8
27.
174,7
53.
180,1
75.
176,0
48.
182,0
66.
186,1
09.
190,8
21.
196,6
68.
180,0
37.
Pla
nt
opera
tio
ns a
nd m
ain
tenance
476,5
99.
477,8
38.
531,9
60.
513,0
48.
458,1
24.
464,8
19.
462,1
83.
432,0
91.
465,7
89.
464,1
15.
Pupil
transport
atio
n685,2
01.
702,6
02.
684,3
42.
730,3
16.
724,6
17.
683,0
56.
652,3
93.
644,7
08.
646,8
48.
723,3
59.
Em
plo
yee b
enefits
1,2
27,3
89.
1,3
48,6
21.
1,3
97,7
68.
1,5
44,4
95.
1,7
36,5
03.
1,5
11,9
58.
1,6
91,2
16.
1,8
00,6
14.
1,9
61,7
26.
2,2
10,4
41.
C
hart
er
Schools
0.
0.
0.
0.
0.
0.
0.
0.
0.
50,5
69.
C
apital outla
y157,8
87.
565,9
73.
4,3
06,8
59.
737,1
09.
315,6
23.
507,5
73.
97,0
94.
77,3
89.
56,2
87.
678,2
98.
D
ebt
serv
ice:
Prin
cip
al
152,6
57.
140,0
00.
140,0
00.
265,0
00.
265,0
00.
285,0
00.
290,0
00.
305,0
00.
310,0
00.
315,0
00.
Inte
rest
and o
ther
charg
es
86,9
56.
81,7
56.
154,7
74.
140,0
81.
131,6
00.
122,3
63.
112,5
19.
102,5
38.
92,0
19.
81,2
94.
To
tal expenditure
s8,6
70,2
90.
9,2
88,4
78.
13,4
02,0
58.
10,2
07,8
84.
9,7
69,5
90.
10,0
50,2
13.
10,0
70,8
49.
10,0
28,2
42.
10,1
79,2
91.
10,8
21,8
73.
(Modifie
d A
ccru
al B
asis
of
Accountin
g)
LA
ST
TE
N F
ISC
AL Y
EA
RS
CH
AN
GE
S I
N F
UN
D B
ALA
NC
ES
, G
OV
ER
NM
EN
TA
L F
UN
DS
,
LA
WR
EN
CE
TO
WN
SH
IP S
CH
OO
L D
IST
RIC
T
Fis
cal Y
ear
Endin
g J
une 3
0,
80

EX
HIB
IT J
-4
Page
2 o
f 2
2009
2010
2011
2012
2013
2014
2015
2016
2017
2018
(Modifie
d A
ccru
al B
asis
of
Accountin
g)
LA
ST
TE
N F
ISC
AL Y
EA
RS
CH
AN
GE
S I
N F
UN
D B
ALA
NC
ES
, G
OV
ER
NM
EN
TA
L F
UN
DS
,
LA
WR
EN
CE
TO
WN
SH
IP S
CH
OO
L D
IST
RIC
T
Fis
cal Y
ear
Endin
g J
une 3
0,
Excess (
deficie
ncy)
of
revenues
over
(under)
expenditure
s291,0
74.
$
(3
91,6
47.)
$
(1
,646,3
47.)
$
(119,0
23.)
$
646,9
78.
$
(287,5
72.)
$
(1
56,6
51.)
$
52,9
59.
$
53,0
83.
$
(265,4
65.)
$
Oth
er
Fin
ancin
g S
ourc
es (
Uses):
Pro
ceeds f
rom
sale
of
bonds
0.
2,2
16,0
00.
0.
0.
0.
0.
0.
0.
0.
0.
Prio
r year
adju
stm
ent
0.
0.
0.
0.
0.
0.
0.
(1
6,9
73.)
0.
0.
Tra
nsfe
rs in
0.
301,6
72.
32,0
00.
0.
0.
0.
135,0
00.
140,0
00.
145,0
00.
778,0
10.
Tra
nsfe
rs o
ut
0.
(3
01,6
72.)
(3
2,0
00.)
0.
0.
0.
(1
35,0
00.)
(1
40,0
00.)
(1
45,0
00.)
(7
78,0
10.)
To
tal O
ther
Fin
ancin
g s
ourc
es (
uses)
0.
2,2
16,0
00.
0.
0.
0.
0.
0.
(1
6,9
73.)
0.
0.
Net
change in
fund b
ala
nce
291,0
74.
$
1,8
24,3
53.
$
(1,6
46,3
47.)
$
(119,0
23.)
$
646,9
78.
$
(287,5
72.)
$
(1
56,6
51.)
$
35,9
86.
$
53,0
83.
$
(265,4
65.)
$
Debt
Serv
ice a
s a
Perc
enta
ge o
f
Noncapital E
xpenditure
s2.8
1%
2.5
4%
3.2
4%
4.2
8%
4.2
0%
4.2
7%
4.0
4%
4.1
0%
3.9
7%
3.9
1%
Sourc
e:
Dis
tric
t R
ecord
s
81

EX
HIB
IT J
-5
Fis
cal Y
ear
Inte
rest
Ref/
Canc
Ended
On
Prior
Yr.
Tuitio
nE
-Rate
A
nnual
June 3
0 In
vestm
ents
E
xpend.
Adju
stm
ent
Mis
c.
Adju
stm
ent
Tow
nship
Tuitio
nS
ettle
ment
Tota
ls
2009
13,7
59.
$
6,2
19.
$
3,9
41.
$
8,3
82.
$
16,0
29.
$
0.
$
5,8
08.
$
0.
$
54,1
38.
$
2010
26,7
48.
0.
0.
17,3
82.
12,2
41.
6,0
00.
22,4
36.
0.
84,8
07.
2011
2,9
21.
4,0
35.
0.
1,8
90.
17,6
16.
6,0
00.
45,6
80.
0.
78,1
42.
2012
34,3
76.
0.
0.
7,8
42.
21,5
33.
0.
2,8
82.
0.
66,6
33.
2013
20,0
77.
0.
2,4
59.
19,8
43.
10,1
00.
0.
61,6
84.
162,5
00.
276,6
63.
2014
11,7
81.
0.
0.
0.
9,4
26.
0.
24,2
41.
0.
45,4
48.
2015
10,9
03.
0.
0.
6,5
30.
9,9
08.
0.
9,6
29.
0.
36,9
70.
2016
6,4
58.
0.
0.
0.
9,4
54.
0.
8,6
89.
0.
24,6
01.
2017
6,3
84.
0.
0.
7,1
42.
8,0
89.
0.
0.
0.
21,6
15.
2018
5,8
71.
1,5
81.
0.
8,8
69.
6,7
68.
0.
0.
0.
23,0
89.
Sourc
e: D
istr
ict re
cord
s
LA
WR
EN
CE
TO
WN
SH
IP S
CH
OO
L D
IST
RIC
T
UN
AU
DIT
ED
LA
ST
TE
N F
ISC
AL Y
EA
RS
GE
NE
RA
L F
UN
D O
TH
ER
LO
CA
L R
EV
EN
UE
BY
SO
UR
CE
82

REVENUE CAPACITY

EXHIBIT J-6
Year Estimated
Ended Net Assessed Full Cash
Dec. 31 Valuations Valuations
Lawrence Township 2008 117,779,054.$ 213,249,498.$
2009 119,645,809. 231,679,673.
2010 224,917,461. 239,272,794.
2011 244,010,260. 240,502,479.
2012 244,744,305. 241,144,772.
2013 242,106,183. 235,892,153.
2014 240,197,557. 219,143,933.
2015 239,717,632. 213,733,505.
2016 236,485,231. 211,326,371.
2017 233,729,137. 218,629,078.
Source: Abstract of Ratables, County Board of Taxation
106.91%
111.91%
Assessed to Estimated
Full Cash Valuations
55.23%
51.64%
94.00%
101.46%
101.49%
109.61%
112.16%
LAWRENCE TOWNSHIP SCHOOL DISTRICT
ASSESSED AND ESTIMATED ACTUAL VALUE OF TAXABLE PROPERTY
LAST TEN YEARS
UNAUDITED
Percentage of Net
102.63%
83

EX
HIB
IT J
-7
Fis
ca
l T
ota
l
Ye
ar
Ge
ne
ral
(Fro
m J
-6)
To
wn
ship
Dire
ct
and
En
de
dB
asic
O
blig
ation
To
tal D
ire
ct
of
Cu
mb
erlan
d
Ove
rlap
pin
g
Ju
ne
30
,R
ate
(a
)D
ebt
Se
rvic
e (
b)
Sch
oo
l T
ax R
ate
Law
rence
Co
un
tyT
ax R
ate
2008
1.5
96
$
0.0
66
$
1.6
62
$
0.6
31
$
1.7
20
$
4.0
13
$
2009
1.5
92
0.0
54
1.6
46
0.6
30
1.7
39
4.0
15
2010
0.8
12
0.0
22
0.8
34
0.3
10
0.8
94
2.0
38
2011
0.8
11
0.0
73
0.8
84
0.3
24
0.9
41
2.1
49
2012
0.7
82
0.1
14
0.8
96
0.3
44
0.9
38
2.1
78
2013
0.8
04
0.1
03
0.9
07
0.3
66
0.9
40
2.2
13
2014
0.8
36
0.1
06
0.9
42
0.3
82
0.9
48
2.2
72
2015
0.8
63
0.1
10
0.9
73
0.4
11
0.9
86
2.3
70
2016
0.8
82
0.1
12
0.9
94
0.4
53
1.0
01
2.4
48
2017
0.8
98
0.1
14
1.0
12
0.4
67
1.0
84
2.5
63
So
urc
e:
Mu
nic
ipal T
ax C
olle
cto
r
No
te:
N
JS
A 1
8A
:7F
-5d lim
its t
he a
mount
that
the d
istr
ict
can s
ubm
it f
or
a g
enera
l fu
nd t
ax levy.
The levy w
hen a
dded t
o o
ther
com
ponents
of
the d
istr
ict's n
et
budg
et
may n
ot
exceed t
he
p
re-b
udg
et
year
net
budg
et
by m
ore
than t
he s
pendin
g g
row
th lim
itation c
alc
ula
ted a
s
f
ollo
ws:
the p
re-b
udg
et
year
net
budg
et
incre
ased b
y t
he c
ost
of
livin
g o
r 2.5
perc
ent,
w
hic
hever
is g
reate
r, p
lus a
ny s
pendin
g g
row
th a
dju
stm
ents
.
a
The d
istr
ict's b
asic
tax r
ate
is c
alc
ula
ted f
rom
the A
4F
form
whic
h is s
ubm
itte
d w
ith t
he
b
udg
et
and t
he N
et
valu
ation t
axable
b
Rate
s f
or
debt
serv
ice a
re b
ased o
n e
ach y
ear's r
eq
uirem
ents
Law
rence
To
wn
ship
Sch
oo
l D
ire
ct
Ra
teO
ve
rlap
pin
g R
ate
s
LA
WR
EN
CE
TO
WN
SH
IP S
CH
OO
L D
IST
RIC
T
DIR
EC
T A
ND
OV
ER
LA
PP
ING
PR
OP
ER
TY
TA
X R
AT
ES
LA
ST
TE
N F
ISC
AL
YE
AR
S
(Ra
te p
er
$10
0 o
f A
sse
ssed
Va
lue)
84

EX
HIB
IT J
-8
% o
f T
ota
l%
of
Tota
l
Taxable
Dis
tric
t N
et
Taxable
Dis
tric
t N
et
Assessed
Rank
Assessed
Assessed
Rank
Assessed
Taxpayer
Valu
e(O
ptional)
Valu
eV
alu
e(O
ptional)
Valu
e
SF
Syste
m3,8
93,8
00.
$
11.6
7%
Ag-M
art
3,4
86,6
00.
21.4
9%
2,6
84,4
00.
$
12.2
8%
Taxpayer
1919,6
00.
30.3
9%
Taxpayer
2743,3
00.
40.3
2%
Secre
tary
of
Housin
g &
Urb
an D
evelo
pm
ent
663,4
00.
50.2
8%
Taxpayer
3653,5
00.
60.2
8%
Nard
elli
Bro
s648,5
00.
70.2
8%
E P
uglis
i &
Sons L
LC
612,1
00.
80.2
6%
Taxpayer
41,8
09,5
00.
21.5
4%
Taxpayer
5797,7
09.
30.6
8%
Taxpayer
6436,5
00.
40.3
7%
Taxpayer
7340,2
00.
50.2
9%
Tota
l11,6
20,8
00.
$
4.9
7%
6,0
68,3
09.
$
5.1
5%
Sourc
e: M
unic
ipal T
ax A
ssessor
2017
2008
LA
WR
EN
CE
TO
WN
SH
IP S
CH
OO
L D
IST
RIC
T
PR
INC
IPA
L P
RO
PE
RT
Y T
AX
PA
YE
RS
,
CU
RR
EN
T Y
EA
R A
ND
NIN
E Y
EA
RS
AG
O
85

EXHIBIT J-9
Fiscal Taxes Collection
Year Levies For in
Ended and Percentage Subsequent
June 30, Collections Amount of Levy Year
2009 1,955,892.$ 1,955,892.$ 100.00%
2010 1,980,951. 1,980,951. 100.00%
2011 2,101,496. 2,101,496. 100.00%
2012 2,208,258. 2,208,258. 100.00%
2013 2,174,400. 2,174,400. 100.00%
2014 2,214,813. 2,214,813. 100.00%
2015 2,308,320. 2,308,320. 100.00%
2016 2,353,023. 2,353,023. 100.00%
2017 2,346,197. 2,346,197. 100.00%
2018 2,381,054. 2,381,054. 100.00%
Source: District records including the Certificate and Report of School
Taxes (A4F Form)
a School taxes are collected by the Municipal Tax Collector.
Under New Jersey State Statue, a municipal is required to
remit to the school district the entire property tax balance,
in the amount voted upon or certified prior to the end of the
the school year.
Collected Within the Fiscal
Year of the Levy (a)
LAWRENCE TOWNSHIP SCHOOL DISTRICT
PROPERTY TAX LEVIES AND COLLECTIONS
LAST TEN FISCAL YEARS
86

DEBT CAPACITY

EX
HIB
IT J
-10
Busin
ess-
Fis
cal
Bond
Type
Perc
enta
ge
Year
Genera
l C
ert
ific
ate
sA
nticip
ation
Activitie
sof
Ended
Oblig
ation
of
Capital
Note
sC
apital
Tota
l P
ers
onal
June 3
0,
Bonds (
b)
Part
icip
ation
Leases
(BA
Ns)
Leases
Dis
tric
tIn
com
e (
a)
Per
Capita (
a)
2009
2,0
60,0
00.
$
0.
$
0.
$
0.
$
0.
$
2,0
60,0
00.
$
2.1
2%
690.
$
2010
4,1
36,0
00.
0.
0.
0.
0.
4,1
36,0
00.
4.1
3%
1,3
82.
2011
3,9
96,0
00.
0.
0.
0.
0.
3,9
96,0
00.
3.5
3%
1,2
14.
2012
3,7
31,0
00.
0.
0.
0.
0.
3,7
31,0
00.
3.1
9%
1,1
29.
2013
3,4
66,0
00.
0.
0.
0.
0.
3,4
66,0
00.
2.9
6%
1,0
48.
2014
3,1
81,0
00.
0.
0.
0.
0.
3,1
81,0
00.
2.6
9%
965.
2015
2,8
91,0
00.
0.
0.
0.
0.
2,8
91,0
00.
2.4
9%
883.
2016
2,5
86,0
00.
0.
0.
0.
0.
2,5
86,0
00.
2.2
1%
801.
2017
2,2
76,0
00.
0.
0.
0.
0.
2,2
76,0
00.
1.9
0%
711.
2018
1,9
61,0
00.
0.
0.
0.
0.
1,9
61,0
00.
N/A
616.
Note
: D
eta
ils r
egard
ing the d
istr
ict's
outs
tandin
g d
ebt can b
e f
ound in the n
ote
s to the f
inancia
l sta
tem
ents
.
aS
ee E
xhib
it N
J J
-14 f
or
pers
onal in
com
e a
nd p
opula
tion d
ata
. T
hese r
atios a
re c
alc
ula
ted u
sin
g
pers
onal in
com
e a
nd p
opula
tion f
or
the p
rior
cale
ndar
year.
bIn
clu
des E
arly
Retire
ment In
centive P
lan (
ER
IP)
refu
ndin
g
Govern
menta
l A
ctivitie
s
LA
WR
EN
CE
TO
WN
SH
IP S
CH
OO
L D
IST
RIC
T
RA
TIO
S O
F O
UT
ST
AN
DIN
G D
EB
T T
YP
E
LA
ST
TE
N F
ISC
AL Y
EA
RS
87

EX
HIB
IT J
-11
Ne
tP
erc
en
tag
e
Fis
ca
lG
ene
ral
of
Actu
al
Ye
ar
Ge
ne
ral
Bo
nd
ed
Ta
xa
ble
En
de
dO
blig
ation
De
bt
Va
lue (
a)
of
Ju
ne
30
,B
ond
sD
edu
ction
sO
uts
tand
ing
Pro
pe
rty
Pe
r C
apita
(b
)
2009
2,0
60
,00
0.
$
0.
$
2,0
60
,00
0.
$
1.7
2%
693.
2010
4,1
36
,00
0.
0.
4,1
36
,00
0.
1.8
4%
1,3
86
.
2011
3,9
96
,00
0.
0.
3,9
96
,00
0.
1.6
4%
1,3
36
.
2012
3,7
31
,00
0.
0.
3,7
31
,00
0.
1.5
2%
1,1
34
.
2013
3,4
66
,00
0.
0.
3,4
66
,00
0.
1.4
3%
1,0
49
.
2014
3,1
81
,00
0.
0.
3,1
81
,00
0.
1.3
2%
962.
2015
2,8
91
,00
0.
0.
2,8
91
,00
0.
1.2
1%
877.
2016
2,5
86
,00
0.
0.
2,5
86
,00
0.
1.0
9%
790.
2017
2,2
76
,00
0.
0.
2,2
76
,00
0.
0.9
7%
705.
2017
1,9
61
,00
0.
0.
1,9
61
,00
0.
N/A
613.
No
tes:
De
tails
re
ga
rdin
g t
he d
istr
ict's o
uts
tand
ing
deb
t ca
n b
e f
oun
d in
th
e n
ote
s
to t
he f
inan
cia
l sta
tem
ents
.
aS
ee E
xh
ibit N
J J
-6 f
or
pro
pe
rty t
ax d
ata
.
bP
opu
lation
da
ta c
an
be f
oun
g in
Exh
ibit N
J J
-14
Ge
ne
ral B
ond
ed
Deb
t O
uts
tand
ing
LA
WR
EN
CE
TO
WN
SH
IP S
CH
OO
L D
IST
RIC
T
RA
TIO
S O
F N
ET
GE
NE
RA
L B
ON
DE
D D
EB
T O
UT
ST
AN
DIN
G
LA
ST
TE
N F
ISC
AL
YE
AR
S
88

EX
HIB
IT J
-12
Estim
ate
d
Estim
ate
d S
hare
Debt
Perc
enta
ge
of
Overlappin
g
Govern
menta
l U
nit
Outs
tandin
gA
pplic
able
(a)
Debt
Debt R
epaid
With P
ropert
y T
axes:
L
aw
rence T
ow
nship
1,6
31,1
41
$
100.0
00%
1,6
31,1
41
$
C
ounty
of
Cum
berland -
Tow
nship
's S
hare
85,4
32,8
63
2.5
02%
2,1
37,5
30
Subto
tal, O
verlappin
g D
ebt
3,7
68,6
71
Law
rence T
ow
nship
School D
istr
ict D
irect D
ebt
1,9
61,0
00
Tota
l D
irect &
Overlappin
g D
ebt
5,7
29,6
71
Sourc
es:
Assessed v
alu
e d
ata
used to e
stim
ate
applic
able
perc
enta
ges p
rovid
ed b
y C
ounty
Board
of
Taxation.
Debt outs
tandin
g d
ata
pro
vid
ed b
y e
ach g
overn
ment unit.
Note
: O
verlappin
g g
overn
ments
are
those that conin
cid
e, at le
ast in
part
, w
ith the g
eogra
phic
boundaries o
f th
e
Dis
tric
t. T
his
schedule
estim
ate
s the p
ort
ion o
f th
e o
uts
tandin
g d
ebt of
those o
verlappin
g g
overn
ments
that
is b
orn
e b
y th
e r
esid
ents
and b
usin
esses o
f Law
rence T
wp. T
his
pro
cess r
ecogniz
es that w
hen c
onsid
ering
the D
istr
ict's
abili
ty to issue a
nd r
epay long-t
erm
debt, the e
ntire
debt burd
en b
orn
e b
y th
e r
esid
ents
and
busin
esses s
hould
be taken into
account. H
ow
ever,
this
does n
ot im
ply
that every
taxpayer
is a
resid
ent,
and there
fore
, re
sponsib
le f
or
repayin
g the d
ebt, o
f each o
verlappin
g p
aym
ent.
aF
or
debt re
paid
with p
ropert
y taxes, th
e p
erc
enta
ge o
f overlappin
g d
ebt applic
able
is e
stim
ate
d u
sin
g
taxable
assessed p
ropert
y valu
es. A
pplic
able
perc
enta
ges w
ere
estim
ate
d b
y d
ete
rmin
ing the p
ort
ion o
f anoth
er
govern
menta
l unit's
taxable
valu
e that is
within
the d
istr
ict's b
oundaries a
nd d
ivid
ing it by e
ach u
nit's
tota
l ta
xable
valu
e.
LA
WR
EN
CE
TO
WN
SH
IP S
CH
OO
L D
IST
RIC
T
DIR
EC
T A
ND
OV
ER
LA
PP
ING
GO
VE
RN
ME
NT
AL A
CT
IVIT
IES
DE
BT
AS
OF
JU
NE
30, 2017
89

Exhib
it J
-13
2009
2010
2011
2012
2013
2014
2015
2016
2017
2018
Debt Lim
it5,2
68,2
48.
$
6,6
65,8
46.
$
6,9
56,6
33.
$
7,0
95,1
34.
$
7,1
11,1
41.
$
6,9
10,2
35.
$
6,6
51,3
66.
$
6,4
10,7
62.
$
6,4
24,2
70.
$
6,5
56,2
93.
$
Tota
l N
et D
ebt A
pplic
able
to L
imit
2,1
90,0
00.
4,1
36,0
00.
3,9
96,0
00.
3,7
31,0
00.
3,4
66,0
00.
3,1
81,0
00.
2,8
91,0
00.
2,5
86,0
00.
2,2
76,0
00.
1,9
61,0
00.
Legal D
ebt M
arg
in3,0
78,2
48.
$
2,5
29,8
46.
$
2,9
60,6
33.
$
3,3
64,1
34.
$
3,6
45,1
41.
$
3,7
29,2
35.
$
3,7
60,3
66.
$
3,8
24,7
62.
$
4,1
48,2
70.
$
4,5
95,2
93.
$
Tota
l N
et D
ebt A
pplic
able
to the L
imit
a
s a
Perc
enta
ge o
f D
ebt Lim
it41.5
7%
62.0
5%
57.4
4%
52.5
9%
48.7
4%
46.0
3%
43.4
6%
40.3
4%
35.4
3%
29.9
1%
Legal D
ebt M
arg
in C
alc
ula
tion for
Fis
cal Y
ear
2018
Equaliz
ed V
alu
ation B
asis
2017
225,0
25,7
18.
$
2016
219,1
56,4
30.
2015
211,4
47,1
61.
6
55,6
29,3
09.
$
Avera
ge E
qualiz
ed V
alu
ation o
f T
axable
Pro
pert
y218,5
43,1
03.
Debt Lim
it (
3 %
of A
vera
ge E
qualiz
ation V
alu
e)
6,5
56,2
93.
(a)
Tota
l N
et D
ebt A
pplic
able
to L
imit
1,9
61,0
00.
Legal D
ebt M
arg
in4,5
95,2
93.
$
Sourc
e: E
qualiz
ed v
alu
ation b
ases w
ere
obta
ined fro
m the A
nnual R
eport
of th
e S
tate
of N
ew
Jers
ey,
Depart
ment of T
reasury
, D
ivis
ion o
f T
axation
(a)
Lim
it s
et by
NJS
A 1
8A
:24-1
9 for
a K
thro
ugh 8
dis
tric
t; o
ther
% lim
its w
ould
be a
pplic
able
for
oth
er
dis
tric
t ty
pes.
LA
WR
EN
CE
TO
WN
SH
IP S
CH
OO
L D
IST
RIC
T
LE
GA
L D
EB
T M
AR
GIN
IN
FO
RM
AT
ION
LA
ST
TE
N F
ISC
AL Y
EA
RS
90

DEMOGRAPHIC AND ECONOMIC
INFORMATION
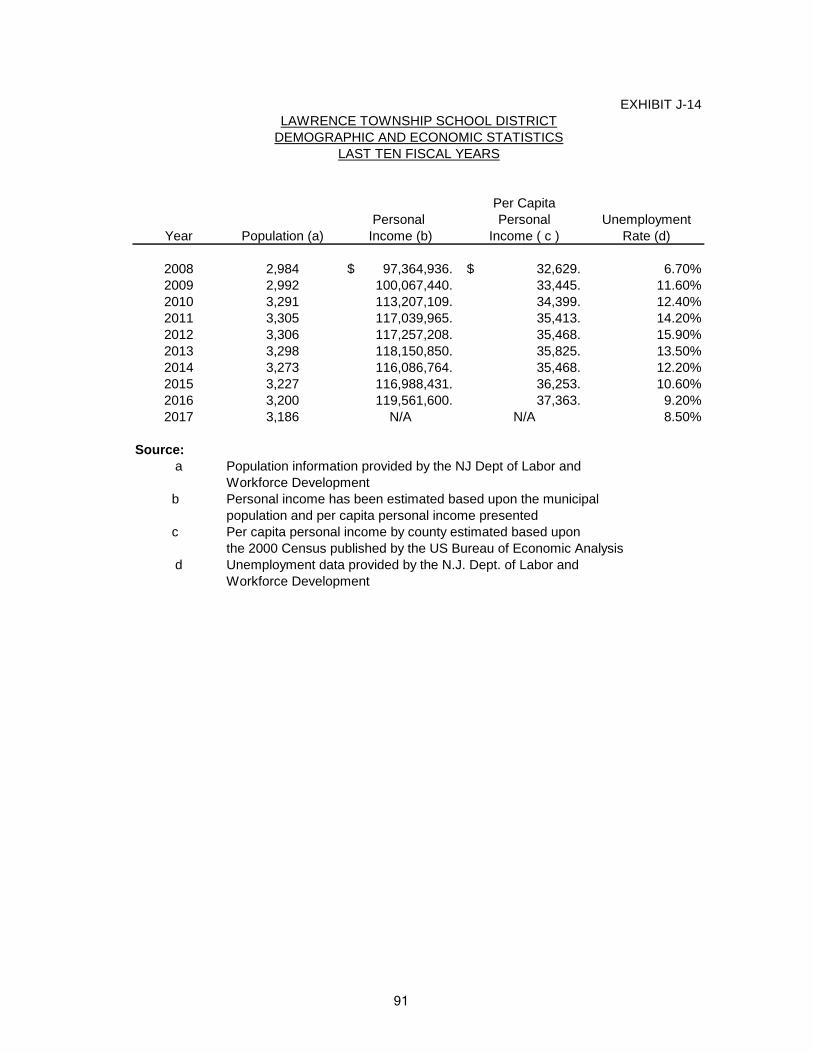
EXHIBIT J-14
Per Capita
Personal Personal Unemployment
Year Population (a) Income (b) Income ( c ) Rate (d)
2008 2,984 97,364,936.$ 32,629.$ 6.70%
2009 2,992 100,067,440. 33,445. 11.60%
2010 3,291 113,207,109. 34,399. 12.40%
2011 3,305 117,039,965. 35,413. 14.20%
2012 3,306 117,257,208. 35,468. 15.90%
2013 3,298 118,150,850. 35,825. 13.50%
2014 3,273 116,086,764. 35,468. 12.20%
2015 3,227 116,988,431. 36,253. 10.60%
2016 3,200 119,561,600. 37,363. 9.20%
2017 3,186 N/A N/A 8.50%
Source:
a Population information provided by the NJ Dept of Labor and
Workforce Development
b Personal income has been estimated based upon the municipal
population and per capita personal income presented
c Per capita personal income by county estimated based upon
the 2000 Census published by the US Bureau of Economic Analysis
d Unemployment data provided by the N.J. Dept. of Labor and
Workforce Development
LAWRENCE TOWNSHIP SCHOOL DISTRICT
DEMOGRAPHIC AND ECONOMIC STATISTICS
LAST TEN FISCAL YEARS
91

EX
HIB
IT J
-15
% o
f T
ota
l%
of
To
tal
Pe
rce
nta
ge
of
Pe
rce
nta
ge
of
To
tal M
un
icip
al
To
tal M
un
icip
al
Em
plo
ye
rE
mp
loye
es
Ra
nk
Em
plo
ym
en
tE
mp
loye
es
Ra
nk
Em
plo
ym
en
t
00
.00
%0
0.0
0%
So
urc
e: T
op
Em
plo
ye
er
of
Cu
mb
erl
an
d C
ou
nty
Info
rma
tio
n N
ot A
va
ilab
le
LA
WR
EN
CE
TO
WN
SH
IP S
CH
OO
L D
IST
RIC
T
PR
INC
IPA
L E
MP
LO
YE
RS
CU
RR
EN
T Y
EA
R A
ND
NIN
E Y
EA
RS
AG
O
20
17
20
08
92
OPERATING INFORMATION

EX
HIB
IT J
-16
Function/P
rogra
m2
00
92
01
02
01
12
01
22
01
32
01
42
01
52
01
62
01
72
01
8
Instr
uction:
Re
gu
lar
34
.53
8.0
39
.53
7.0
38
.04
0.0
39
.53
8.0
41
.04
2.0
S
pecia
l E
ducation
15
.51
7.0
15
.71
0.0
8.0
7.0
8.0
7.0
7.0
4.0
O
ther
Sp
ecia
l E
ducation
Suppo
rt S
erv
ices:
Stu
de
nt &
Instr
uction R
ela
ted
Serv
ices
2.0
2.0
1.0
1.0
2.0
2.0
4.0
3.0
8.0
11
.0
Genera
l adm
inis
tration
2.0
1.5
2.1
1.5
2.0
1.0
1.0
1.0
1.0
1.0
School adm
inis
trative s
erv
ices
3.0
3.0
3.0
3.5
3.0
4.0
4.0
4.0
4.7
4.0
Oth
er
Ad
min
istr
ative S
erv
ices
Centr
al serv
ices
2.0
2.0
2.0
2.0
2.0
2.0
2.0
2.0
3.0
2.0
Pla
nt O
pera
tions &
Main
ten
ance
5.7
5.7
4.0
5.7
5.7
5.7
5.7
5.2
5.2
4.0
Tota
l6
4.7
69
.26
7.3
60
.76
0.7
61
.76
4.2
60
.26
9.9
68
.0
Sourc
e: D
istr
ict P
ers
onne
l R
ecord
s
LA
WR
EN
CE
TO
WN
SH
IP B
OA
RD
OF
ED
UC
AT
ION
FU
LL-T
IME
EQ
UIV
ALE
NT
DIS
TR
ICT
EM
PLO
YE
ES
BY
FU
NC
TIO
N/P
RO
GR
AM
LA
ST
TE
N F
ISC
AL Y
EA
RS
93

EX
HIB
IT J
-17
Ave
rag
eA
ve
rag
e%
Ch
an
ge
In
Da
ilyD
aily
Ave
rag
eS
tud
en
t
Fis
ca
lO
pe
ratin
gC
ost
Pe
rce
nta
ge
Te
ach
ing
Mid
dle
Senio
rE
nro
llme
nt
Att
en
da
nce
Da
ilyA
tte
nd
an
ce
Year
En
rollm
en
tE
xp
en
ditu
res (
a)
Pe
r P
up
ilC
ha
ng
eS
taff
(b
)E
lem
en
tary
Sch
oo
lH
igh
Sch
oo
l(A
DE
) (c
)(A
DA
) (c
)E
nro
llme
nt
Pe
rce
nta
ge
2009
47
2.0
8
,27
2,7
90
.$
17
,52
7.
$
(0.9
4)%
50
.0
1:1
0N
/AN
/A4
59
.64
36
.1(2
.88
)%9
5.2
8%
2010
45
3.0
8,5
31
,27
5.
1
8,8
33
. 7
.45
%5
5.0
1
:08
N/A
N/A
44
9.1
42
3.3
2.4
3%
94
.89
%
2011
43
6.0
8,5
00
,74
9.
1
9,4
97
. 3
.53
%5
5.2
1
:08
N/A
N/A
43
4.0
41
6.0
(2.2
8)%
94
.26
%
2012
46
6.0
9,0
65
,69
4.
1
9,4
54
.(
0.2
2%
)4
7.0
1
:09
N/A
N/A
47
0.4
44
5.8
8.3
9%
94
.77
%
2013
50
4.0
9,0
57
,36
7.
1
7,9
71
.(
0.7
6%
)4
6.0
1
:10
N/A
N/A
50
1.0
47
0.0
6.5
1%
93
.81
%
2014
51
0.0
9,1
35
,27
7.
1
7,9
12
.(
0.3
3%
)4
7.0
1
:09
N/A
N/A
50
8.0
48
3.0
1.4
0%
95
.08
%
2015
49
9.0
9,5
71
,23
6.
1
9,1
81
. 7
.08
%4
7.5
1
:10
N/A
N/A
49
6.0
47
1.0
(2.3
6)%
94
.96
%
2016
48
6.0
9,5
43
,31
5.
1
9,6
36
. 2
.37
%4
5.0
1
:09
N/A
N/A
48
2.0
45
7.0
(2.9
7)%
94
.81
%
2017
47
2.0
9,7
20
,98
5.
2
0,5
95
. 4
.89
%4
8.0
1
:08
N/A
N/A
47
6.0
44
5.0
(1.2
4)%
93
.49
%
2018
46
5.0
9,7
47
,28
1.
2
0,9
62
. 1
.79
%4
6.0
1
:10
N/A
N/A
46
9.0
44
2.0
(1.4
7)%
94
.24
%
So
urc
es:
D
istr
ict
reco
rds
No
te:
En
rollm
en
t b
ase
d o
n a
nn
ua
l O
cto
be
r d
istr
ict
co
un
t.
aO
pe
ratin
g e
xp
en
ditu
res e
qu
al to
tal e
xp
en
ditu
res le
ss d
eb
t se
rvic
e a
nd
ca
pita
l o
utla
y.
bT
ea
ch
ing
sta
ff in
clu
de
s o
nly
fu
ll-tim
e e
qu
iva
len
ts o
f ce
rtific
ate
d s
taff
.
cA
ve
rag
e d
aily
en
rollm
en
t a
nd
ave
rag
e d
aily
att
en
da
nce
are
ob
tain
ed
fro
m t
he
Sch
oo
l R
eg
iste
r S
um
ma
ry (
SR
S).
LA
WR
EN
CE
TO
WN
SH
IP B
OA
RD
OF
ED
UC
AT
ION
OP
ER
AT
ING
ST
AT
IST
ICS
LA
ST
TE
N F
ISC
AL
YE
AR
S
Pu
pil/
Te
ach
er
Ra
tio
94

EX
HIB
IT J
-18
Dis
tric
t B
uild
ing
20
09
20
10
20
11
20
12
20
13
20
14
20
15
20
16
20
17
20
18
Ele
menta
ry:
M.L
. P
ow
ell
Ele
menta
ry (
1885
)
Sq
ua
re F
ee
t5
4,4
12
54
,41
25
9,1
49
59
,14
95
9,1
49
59
,14
95
9,1
49
59
,14
95
9,1
49
59
,14
9
Ca
pa
city (
Stu
de
nts
)5
78
57
86
28
62
86
28
62
86
28
62
86
28
62
8
En
rollm
en
t 4
72
45
34
36
46
65
04
51
04
99
48
64
72
46
5
Num
ber
of
Schools
at June 3
0, 2
018:
Ele
menta
ry =
1
Mid
dle
School =
0
Senio
r H
igh S
chool =
0
Oth
er
= 0
Sourc
e: D
istr
ict F
acili
ties O
ffic
e
Note
: Y
ear
of
ori
gin
al constr
uction is s
how
n in p
are
nth
eses. Incre
ases in s
quare
foota
ge a
nd c
apacity a
re the r
esult o
f add
itio
ns.
Enro
llment is
based o
n the
ann
ual O
cto
be
r dis
tric
t count.
LA
WR
EN
CE
TO
WN
SH
IP B
OA
RD
OF
ED
UC
AT
ION
SC
HO
OL B
UIL
DIN
G IN
FO
RM
AT
ION
LA
ST
TE
N F
ISC
AL Y
EA
RS
95

EXHIBIT J-19
LAWRENCE TOWNSHIP SCHOOL DISTRICT
SCHEDULE OF REQUIRED MAINTENANCE
LAST TEN FISCAL YEARS
UNDISTRIBUTED EXPENDITURES - REQUIRED
MAINTENANCE FOR SCHOOL FACILITIES
11-000-261-xxx
*School Facilities Myron Powell
Project #(s) School Total
2009 25,887.$ 25,887.$
2010 45,677. 45,677.
2011 71,021. 71,021.
2012 72,874. 72,874.
2013 85,866. 85,866.
2014 21,890. 21,890.
2015 44,856. 44,856.
2016 46,407. 46,407.
2017 75,224. 75,224.
2018 71,172. 71,172.
Total School Facilities $ 560,874. $ 560,874.
* School facilities as defined under EFCFA.
(N.J.A.C. 6A:26-1.2 and N.J.A.C. 6A:26A-1.3)
Source: District records
96

EXHIBIT J-20
Coverage Deductible
Commercial Policy
Property
Blanket Building & Contents $12,061,217. $ 1,000.
Utility Services - Time Element 500,000. 1,000.
General Liability 3,000,000.
Earthquake - Volcanic Eruption 1,000,000. 25,000.
Employee Benefits 1,000,000. 1,000.
Flood Coverage 1,015,000. 25,000.
Governmental Crime 100,000. 500.
Abuse or Molestation Liability 1,000,000.
Employee Related Practices Liability 1,000,000. 5,000.
Inland Marine
Computer 202,550. 500.
Miscellaneous Property 500,000. 500.
Valuable Papers & Records 100,000. 500.
Signs 30,000. 500.
Board of Education Liability 1,000,000. 7,500.
Governmental Crime-Computer and Funds Transfer 100,000. 500.
Commercial Excess Liability 1,000,000. 10,000.
Workers' Compensation and Employers Liability 2,000,000.
Commercial Automobile 1,000,000. 100.
Blanket Student Accident Liability 1,000,000.
Catastrophic Student Accident 2,500,000. 25,000.
Surety Bonds:
Business Administrator: Lisa DiNovi 189,000.
Source: District Records
LAWRENCE TOWNSHIP SCHOOL DISTRICT
INSURANCE SCHEDULE
JUNE 30, 2018
UNAUDITED
97

SINGLE AUDIT SECTION

K-1
REPORT ON INTERNAL CONTROL
OVER FINANCIAL REPORTING AND ON COMPLIANCE AND
OTHER MATTERS BASED ON AN AUDIT
OF FINANCIAL STATEMENTS PERFORMED IN ACCORDANCE
WITH GOVERNMENT AUDITING STANDARDS
Independent Auditor’s Report
Honorable President and
Members of the Board of Education
Lawrence Township School District
County of Cumberland, New Jersey
We have audited, in accordance with auditing standards generally accepted in the United States of America and the
standards applicable to financial audits contained in Government Auditing Standards, issued by the Comptroller
General of the United States; and audit requirements as prescribed by the Office of School Finance, Department of
Education, State of New Jersey, the financial statements of the governmental activities, the business-type activities,
each major fund, and the aggregate remaining fund information of the Board of Education of the Lawrence Township
School District in the County of Cumberland, State of New Jersey, as of and for the fiscal year ended June 30, 2018,
and the related notes to the financial statements, which collectively comprise Lawrence Township Board of
Education’s basic financial statements, and have issued our report thereon dated February 14, 2019.
Internal Control Over Financial Reporting
In planning and performing our audit of the financial statements, we considered the Lawrence Township Board of
Education’s internal control over financial reporting (internal control) to determine the audit procedures that are
appropriate in the circumstances for the purpose of expressing our opinions on the financial statements, but not for
the purpose of expressing an opinion on the effectiveness of the Lawrence Township Board of Education’s internal
control. Accordingly, we do not express an opinion on the effectiveness of the Lawrence Township Board of
Education’s internal control.
A deficiency in internal control exists when the design or operation of a control does not allow management or
employees, in the normal course of performing their assigned functions, to prevent, or detect and correct
misstatements on a timely basis. A material weakness is a deficiency, or combination of deficiencies, in internal
control, such that there is a reasonable possibility that a material misstatement of the entity’s financial statements will
not be prevented, or detected and corrected on a timely basis. A significant deficiency is a deficiency, or a
combination of deficiencies, in internal control that is less severe than a material weakness, yet important enough to
merit attention by those charged with governance.
Our consideration of internal control was for the limited purpose described in the first paragraph of this section and
was not designed to identify all deficiencies in internal control that might be material weakness or significant
deficiencies. Given these limitations, during our audit we did not identify any deficiencies in internal control that
we consider to be material weaknesses. However, material weaknesses may exist that have not been identified.
��98

K-1
Compliance and Other Matters
As part of obtaining reasonable assurance about whether the Lawrence Township Board of Education’s financial
statements are free from material misstatement, we performed tests of its compliance with certain provisions of laws,
regulations, contracts and grant agreements, noncompliance with which could have a direct and material effect on the
determination of financial statement amounts. However, providing an opinion on compliance with those provisions
was not an objective of our audit, and accordingly, we do not express such an opinion. The results of our tests
disclosed no instances of noncompliance or other matters that are required to be reported under Government
Auditing Standards and audit requirements as prescribed by the Office of School Finance, Department of Education,
State of New Jersey.
Purpose of this Report
The purpose of this report is solely to describe the scope of our testing of internal control and compliance and the
results of that testing, and not to provide an opinion on the effectiveness of the entity’s internal control or on
compliance. This report is an integral part of an audit performed in accordance with Government Auditing
Standards, in considering the entity’s internal control and compliance. Accordingly, this communication is not
suitable for any other purpose.
Respectfully submitted,
Samuel A. Delp, Jr.
Public School Accountant, #745
Triantos & Delp
Certified Public Accountants, LLC
February 14, 2019
�� 99

K-2
REPORT ON COMPLIANCE FOR EACH MAJOR PROGRAM AND ON INTERNAL
CONTROL OVER COMPLIANCE; AND REPORT ON SCHEDULE OF EXPENDITURES OF
FEDERAL AWARDS, AND REPORT ON SCHEDULE OF EXPENDITURES OF STATE
AWARDS, REQUIRED BY UNIFORM GUIDANCE AND NEW JERSEY OMB CIRCULAR 15-08
Independent Auditor’s Report
Honorable President and
Members of the Board of Education
Lawrence Township School District
County of Cumberland, New Jersey
Report on Compliance for Each Major State Program
We have audited the Board of Education of the Lawrence Township School District, in the County of
Cumberland, State of New Jersey, compliance with the types of compliance requirements described in
the OMB Compliance Supplement and the New Jersey State Aid/Grant Compliance Supplement that
could have a direct and material effect on each of Lawrence Township Board of Education’s major state
programs for the year ended June 30, 2018. Lawrence Township Board of Education’s major state
programs are identified in the summary of auditor’s results section of the accompanying schedule of
findings and questioned costs.
Management’s Responsibility
Management is responsible for compliance with the requirements of laws, regulations, contracts and
grants applicable to each of its federal and state programs.
Auditor’s Responsibility
Our responsibility is to express an opinion on compliance for each of Lawrence Township Board of
Education’s major state programs based on our audit of the types of compliance requirements referred to
above. We conducted our audit of compliance in accordance with auditing standards generally accepted
in the United States of America; the standards applicable to financial audits contained in Government
Auditing Standards, issued by the Comptroller General of the United States; and the audit requirements
of Title 2 U.S. Code of Federal Regulations Part 200, Uniform Administrative Requirement, Cost
Principles, and Audit Requirements for Federal Awards (Uniform Guidance); and the audit requirements
as prescribed by the Office of School Finance, Department of Education, State of New Jersey; and New
Jersey OMB’s Circular 15-08, Single Audit Policy for Recipients of Federal Grants, State Grants and
State Aid. Those standards, the Uniform Guidance and New Jersey OMB’s Circular 15-08, require that
we plan and perform the audit to obtain reasonable assurance about whether noncompliance with the
types of compliance requirements referred to above that could have a direct and material effect on a
major state program occurred. An audit includes examining, on a test basis, evidence about the
Lawrence Township Board of Education’s compliance with those requirements and performing such
other procedures as we considered necessary in the circumstances.
We believe that our audit provides a reasonable basis for our opinion on compliance for each major state
program. However, our audit does not provide a legal determination of the Lawrence Township Board of
Education’s compliance.
������100

K-2
Opinion on Each Major State Program
In our opinion, the Board of Education of the Lawrence Township School District, in the County of
Cumberland, State of New Jersey, complied, in all material respects, with the types of compliance
requirements referred to above that could have a direct and material effect on its major state programs for
the fiscal year ended June 30, 2018.
Report on Internal Control Over Compliance
Management of the Lawrence Township Board of Education is responsible for establishing and
maintaining effective internal control over compliance with the types of compliance requirements
referred to above. In planning and performing our audit of compliance, we considered Lawrence
Township Board of Education’s internal control over compliance with the types of requirements that
could have a direct and material effect on each major state program to determine the auditing procedures
that are appropriate in the circumstances for the purpose of expressing an opinion on compliance for each
major state program and to test and report on internal control over compliance in accordance with
Uniform Guidance, and the New Jersey State Aid/Grant Compliance Supplement, but not for the purpose
of expressing an opinion on the effectiveness of internal control over compliance. Accordingly, we do
not express an opinion on the effectiveness of Lawrence Township Board of Education’s internal control
over compliance.
A deficiency in internal control over compliance exists when the design or operation of a control over
compliance does not allow management or employees, in the normal course of performing their assigned
functions, to prevent, or detect and correct, noncompliance with a type of compliance requirement of a
federal or state program on a timely basis. A material weakness in internal control over compliance is a
deficiency, or combination of deficiencies, in internal control over compliance, such that there is a
reasonable possibility that material noncompliance with a type of compliance requirement of a federal or
state program will not be prevented, or detected and corrected, on a timely basis. A significant deficiency
in internal control over compliance is a deficiency, or a combination of deficiencies, in internal control
over compliance with a type of compliance requirement of a federal or state program that is less severe
than a material weakness in internal control over compliance, yet important enough to merit attention by
those charged with governance.
Our consideration of the internal control over compliance was for the limited purpose described in the
first paragraph of this section and was not designed to identify all deficiencies in internal control over
compliance that might be material weaknesses or significant deficiencies. We did not identify any
deficiencies in internal control over compliance that we consider to be material weaknesses. However,
material weaknesses may exist that have not been identified.
The purpose of this report on internal control over compliance is solely to describe the scope of our
testing of internal control over compliance and the results of that testing based on the requirements of
Uniform Guidance and NJ OMB Circular 15-08. Accordingly, this report is not suitable for any other
purpose.
Respectfully submitted,
Samuel A. Delp, Jr.
Public School Accountant, #745
Triantos & Delp
Certified Public Accountants, LLC
February 14, 2019
������101
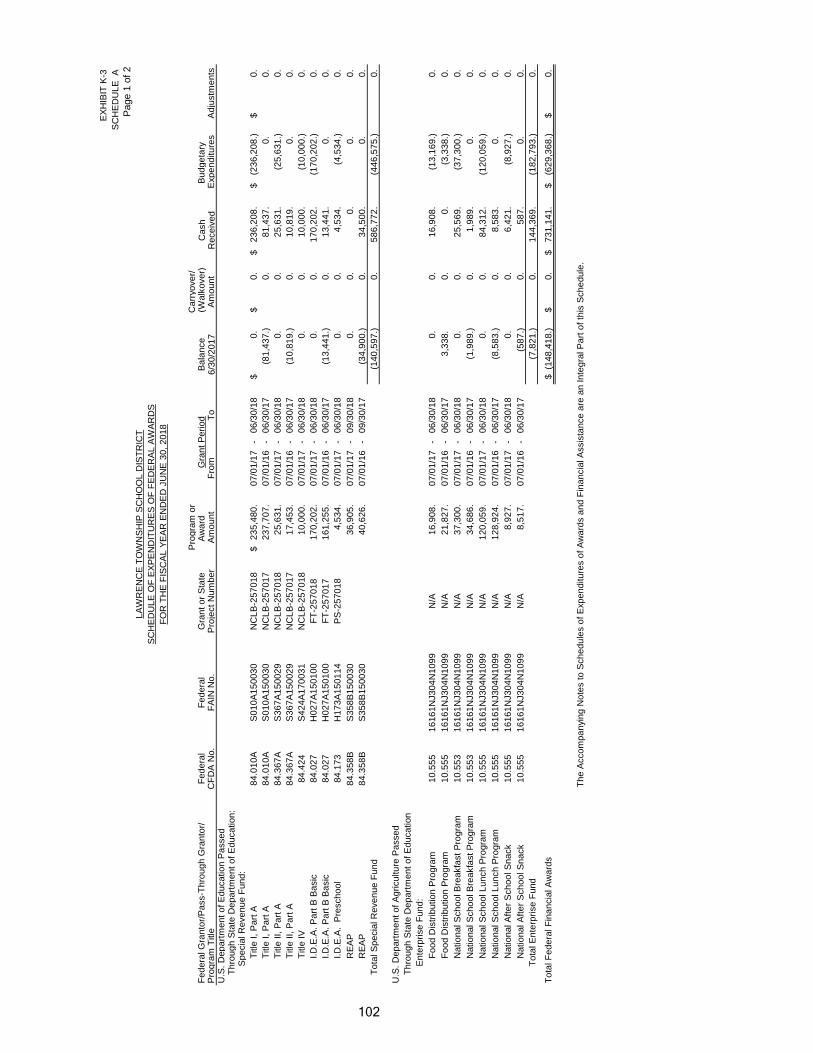
EX
HIB
IT K
-3
SC
HE
DU
LE
A
Page 1
of
2
Pro
gra
m o
rC
arr
yo
ve
r/
Fe
de
ral G
ran
tor/
Pa
ss-T
hro
ug
h G
ran
tor/
Fe
de
ral
Fe
de
ral
Gra
nt
or
Sta
teA
wa
rd
Gra
nt
Pe
rio
dB
ala
nce
(Wa
lko
ve
r)C
ash
Bu
dg
eta
ry
Pro
gra
m T
itle
CF
DA
No
.F
AIN
No
.P
roje
ct
Nu
mb
er
Am
ou
nt
Fro
mT
o6
/30
/20
17
Am
ou
nt
Re
ce
ive
dE
xp
en
ditu
res
Ad
justm
en
tsU
.S.
De
pa
rtm
en
t o
f E
du
ca
tio
n P
asse
dT
hro
ug
h S
tate
De
pa
rtm
en
t o
f E
du
ca
tio
n:
Sp
ecia
l R
eve
nu
e F
un
d:
Title
I,
Pa
rt A
84
.01
0A
S0
10
A1
50
03
0N
CL
B-2
57
01
82
35
,48
0.
$
0
7/0
1/1
7-
06
/30
/18
0.
$
0
.$
23
6,2
08
.$
(23
6,2
08
.)$
0.
$
Title
I,
Pa
rt A
8
4.0
10
AS
01
0A
15
00
30
NC
LB
-25
70
17
23
7,7
07
.
07
/01
/16
-0
6/3
0/1
7(8
1,4
37
.)
0.
8
1,4
37
.
0
.
0.
Title
II, P
art
A
84
.36
7A
S3
67
A1
50
02
9N
CL
B-2
57
01
82
5,6
31
.
0
7/0
1/1
7-
06
/30
/18
0.
0
.
25
,63
1.
(25
,63
1.)
0.
Title
II, P
art
A
84
.36
7A
S3
67
A1
50
02
9N
CL
B-2
57
01
71
7,4
53
.
0
7/0
1/1
6-
06
/30
/17
(10
,81
9.)
0
.
10
,81
9.
0.
0
.
Title
IV
84
.42
4S
42
4A
17
00
31
NC
LB
-25
70
18
10
,00
0.
07
/01
/17
-0
6/3
0/1
80
.
0.
1
0,0
00
.
(1
0,0
00
.)
0
.
I.D
.E.A
. P
art
B B
asic
84
.02
7H
02
7A
15
01
00
FT
-25
70
18
17
0,2
02
.
07
/01
/17
-0
6/3
0/1
80
.
0.
1
70
,20
2.
(1
70
,20
2.)
0
.
I.D
.E.A
. P
art
B B
asic
84
.02
7H
02
7A
15
01
00
FT
-25
70
17
16
1,2
55
.
07
/01
/16
-0
6/3
0/1
7(1
3,4
41
.)
0.
1
3,4
41
.
0
.
0.
I.D
.E.A
. P
resch
oo
l8
4.1
73
H1
73
A1
50
11
4P
S-2
57
01
84
,53
4.
0
7/0
1/1
7-
06
/30
/18
0.
0
.
4,5
34
.
(4,5
34
.)
0.
RE
AP
84
.35
8B
S3
58
B1
50
03
03
6,9
05
.
0
7/0
1/1
7-
09
/30
/18
0.
0
.
0.
0
.
0.
RE
AP
84
.35
8B
S3
58
B1
50
03
04
0,6
26
.
0
7/0
1/1
6-
09
/30
/17
(34
,90
0.)
0
.
34
,50
0.
0.
0
.
To
tal S
pe
cia
l R
eve
nu
e F
un
d(1
40
,59
7.)
0.
5
86
,77
2.
(4
46
,57
5.)
0
.
U.S
. D
ep
art
me
nt
of
Ag
ricu
ltu
re P
asse
d
Th
rou
gh
Sta
te D
ep
art
me
nt
of
Ed
uca
tio
n
En
terp
rise
Fu
nd
:
Fo
od
Dis
trib
utio
n P
rog
ram
10
.55
51
61
61
NJ3
04
N1
09
9N
/A1
6,9
08
.
0
7/0
1/1
7-
06
/30
/18
0.
0
.
16
,90
8.
(13
,16
9.)
0.
Fo
od
Dis
trib
utio
n P
rog
ram
10
.55
51
61
61
NJ3
04
N1
09
9N
/A2
1,8
27
.
0
7/0
1/1
6-
06
/30
/17
3,3
38
.
0.
0
.
(3,3
38
.)
0.
Na
tio
na
l S
ch
oo
l B
rea
kfa
st
Pro
gra
m1
0.5
53
16
16
1N
J3
04
N1
09
9N
/A3
7,3
00
.
0
7/0
1/1
7-
06
/30
/18
0.
0
.
25
,56
9.
(37
,30
0.)
0.
Na
tio
na
l S
ch
oo
l B
rea
kfa
st
Pro
gra
m1
0.5
53
16
16
1N
J3
04
N1
09
9N
/A3
4,6
86
.
0
7/0
1/1
6-
06
/30
/17
(1,9
89
.)
0
.
1,9
89
.
0.
0
.
Na
tio
na
l S
ch
oo
l L
un
ch
Pro
gra
m1
0.5
55
16
16
1N
J3
04
N1
09
9N
/A1
20
,05
9.
0
7/0
1/1
7-
06
/30
/18
0.
0
.
84
,31
2.
(12
0,0
59
.)
0.
Na
tio
na
l S
ch
oo
l L
un
ch
Pro
gra
m1
0.5
55
16
16
1N
J3
04
N1
09
9N
/A1
28
,92
4.
0
7/0
1/1
6-
06
/30
/17
(8,5
83
.)
0
.
8,5
83
.
0.
0
.
Na
tio
na
l A
fte
r S
ch
oo
l S
na
ck
10
.55
51
61
61
NJ3
04
N1
09
9N
/A8
,92
7.
0
7/0
1/1
7-
06
/30
/18
0.
0
.
6,4
21
.
(8,9
27
.)
0.
Na
tio
na
l A
fte
r S
ch
oo
l S
na
ck
10
.55
51
61
61
NJ3
04
N1
09
9N
/A8
,51
7.
0
7/0
1/1
6-
06
/30
/17
(58
7.)
0.
5
87
.
0.
0
.
To
tal E
nte
rpri
se
Fu
nd
(7,8
21
.)
0
.
14
4,3
69
.
(18
2,7
93
.)
0.
To
tal F
ed
era
l F
ina
ncia
l A
wa
rds
(14
8,4
18
.)$
0
.$
73
1,1
41
.$
(62
9,3
68
.)$
0.
$
FO
R T
HE
FIS
CA
L Y
EA
R E
ND
ED
JU
NE
30
, 2
01
8
Th
e A
cco
mp
an
yin
g N
ote
s t
o S
ch
ed
ule
s o
f E
xp
en
ditu
res o
f A
wa
rds a
nd
Fin
an
cia
l A
ssis
tan
ce
are
an
In
teg
ral P
art
of
this
Sch
ed
ule
.
LA
WR
EN
CE
TO
WN
SH
IP S
CH
OO
L D
IST
RIC
T
SC
HE
DU
LE
OF
EX
PE
ND
ITU
RE
S O
F F
ED
ER
AL
AW
AR
DS
102

EX
HIB
IT K
-3E
XH
IBIT
K-3
SC
HE
DU
LE
A
SC
HE
DU
LE
A
Page 2
of
2
Pro
gra
m o
rR
ep
aym
en
tF
ed
era
l G
ran
tor/
Pa
ss-T
hro
ug
h G
ran
tor/
Fe
de
ral
Fe
de
ral
Gra
nt
or
Sta
teA
wa
rd
Gra
nt
Pe
rio
do
f P
rio
r A
cco
un
ts
De
ferr
ed
Du
e t
oP
rog
ram
Title
CF
DA
No
.F
AIN
No
.P
roje
ct
Nu
mb
er
Am
ou
nt
Fro
mT
oY
ea
rs' B
al.
Re
ce
iva
ble
Re
ve
nu
eG
ran
tor
U.S
. D
ep
art
me
nt
of
Ed
uca
tio
n P
asse
dT
hro
ug
h S
tate
De
pa
rtm
en
t o
f E
du
ca
tio
n:
Sp
ecia
l R
eve
nu
e F
un
d:
Title
I,
Pa
rt A
84
.01
0A
S0
10
A1
50
03
0N
CL
B-2
57
01
82
35
,48
0.
$
0
7/0
1/1
7-
06
/30
/18
0.
$
0
.$
0
.$
0
.$
Title
I,
Pa
rt A
8
4.0
10
AS
01
0A
15
00
30
NC
LB
-25
70
17
23
7,7
07
.
07
/01
/16
-0
6/3
0/1
70
.
0.
0.
0.
Title
II, P
art
A
84
.36
7A
S3
67
A1
50
02
9N
CL
B-2
57
01
82
5,6
31
.
0
7/0
1/1
7-
06
/30
/18
0.
0
.
0
.
0
.
Title
II, P
art
A
84
.36
7A
S3
67
A1
50
02
9N
CL
B-2
57
01
71
7,4
53
.
0
7/0
1/1
6-
06
/30
/17
0.
0
.
0
.
0
.
Title
IV
84
.42
4S
42
4A
17
00
31
NC
LB
-25
70
18
10
,00
0.
07
/01
/17
-0
6/3
0/1
80
.
0.
0.
0.
I.D
.E.A
. P
art
B B
asic
84
.02
7H
02
7A
15
01
00
FT
-25
70
18
17
0,2
02
.
07
/01
/17
-0
6/3
0/1
80
.
0.
0.
0.
I.D
.E.A
. P
art
B B
asic
84
.02
7H
02
7A
15
01
00
FT
-25
70
17
16
1,2
55
.
07
/01
/16
-0
6/3
0/1
70
.
0.
0.
0.
I.D
.E.A
. P
resch
oo
l8
4.1
73
H1
73
A1
50
11
4P
S-2
57
01
84
,53
4.
0
7/0
1/1
7-
06
/30
/18
0.
0
.
0
.
0
.
RE
AP
84
.35
8B
S3
58
B1
50
03
03
6,9
05
.
0
7/0
1/1
7-
09
/30
/18
0.
0
.
0
.
0
.
RE
AP
84
.35
8B
S3
58
B1
50
03
04
0,6
26
.
0
7/0
1/1
6-
09
/30
/17
0.
(4
00
.)
0
.
0
.
To
tal S
pe
cia
l R
eve
nu
e F
un
d0
.
(40
0.)
0.
0.
U.S
. D
ep
art
me
nt
of
Ag
ricu
ltu
re P
asse
d
Th
rou
gh
Sta
te D
ep
art
me
nt
of
Ed
uca
tio
n
En
terp
rise
Fu
nd
:
Fo
od
Dis
trib
utio
n P
rog
ram
10
.55
51
61
61
NJ3
04
N1
09
9N
/A1
6,9
08
.
0
7/0
1/1
7-
06
/30
/18
0.
0
.
3
,73
9.
0
.
Fo
od
Dis
trib
utio
n P
rog
ram
10
.55
51
61
61
NJ3
04
N1
09
9N
/A2
1,8
27
.
0
7/0
1/1
6-
06
/30
/17
0.
0
.
0
.
0
.
Na
tio
na
l S
ch
oo
l B
rea
kfa
st
Pro
gra
m1
0.5
53
16
16
1N
J3
04
N1
09
9N
/A3
7,3
00
.
0
7/0
1/1
7-
06
/30
/18
0.
(1
1,7
31
.)
0.
0.
Na
tio
na
l S
ch
oo
l B
rea
kfa
st
Pro
gra
m1
0.5
53
16
16
1N
J3
04
N1
09
9N
/A3
4,6
86
.
0
7/0
1/1
6-
06
/30
/17
0.
0
.
0
.
0
.
Na
tio
na
l S
ch
oo
l L
un
ch
Pro
gra
m1
0.5
55
16
16
1N
J3
04
N1
09
9N
/A1
20
,05
9.
0
7/0
1/1
7-
06
/30
/18
0.
(3
5,7
47
.)
0.
0.
Na
tio
na
l S
ch
oo
l L
un
ch
Pro
gra
m1
0.5
55
16
16
1N
J3
04
N1
09
9N
/A1
28
,92
4.
0
7/0
1/1
6-
06
/30
/17
0.
0
.
0
.
0
.
Na
tio
na
l A
fte
r S
ch
oo
l S
na
ck
10
.55
51
61
61
NJ3
04
N1
09
9N
/A8
,92
7.
0
7/0
1/1
7-
06
/30
/18
0.
(2
,50
6.)
0.
0.
Na
tio
na
l A
fte
r S
ch
oo
l S
na
ck
10
.55
51
61
61
NJ3
04
N1
09
9N
/A8
,51
7.
0
7/0
1/1
6-
06
/30
/17
0.
0
.
0
.
0
.
To
tal E
nte
rpri
se
Fu
nd
0.
(4
9,9
84
.)
3,7
39
.
0.
To
tal F
ed
era
l F
ina
ncia
l A
wa
rds
0.
$
(5
0,3
84
.)$
3,7
39
.$
0.
$
SC
HE
DU
LE
OF
EX
PE
ND
ITU
RE
S O
F F
ED
ER
AL
AW
AR
DS
FO
R T
HE
FIS
CA
L Y
EA
R E
ND
ED
JU
NE
30
, 2
01
8
Th
e A
cco
mp
an
yin
g N
ote
s t
o S
ch
ed
ule
s o
f E
xp
en
ditu
res o
f A
wa
rds a
nd
Fin
an
cia
l A
ssis
tan
ce
are
an
In
teg
ral P
art
of
this
Sch
ed
ule
.
Ba
lan
ce
at
Ju
ne
30
, 2
01
8
LA
WR
EN
CE
TO
WN
SH
IP S
CH
OO
L D
IST
RIC
T
103

EX
HIB
IT K
-4
SC
HE
DU
LE
B
Pa
ge
1 o
f 2
Pro
gra
m
De
ferr
ed
Ca
rryo
ve
r/R
ep
aym
en
t
Gra
nt o
r S
tate
o
r A
wa
rd
Gra
nt P
erio
dR
eve
nu
eD
ue
to
(W
alk
ove
r)C
ash
Bu
dg
eta
ry
of P
rio
r
Sta
te G
ran
tor/
Pro
gra
m T
itle
Pro
ject N
o.
Am
ou
nt
Fro
mT
o(A
ccts
. R
ec.)
Gra
nto
rA
mo
un
tR
ece
ive
dE
xp
en
ditu
res
Ye
ars
' B
ala
nce
s
Sta
te D
ep
art
. o
f E
du
ca
tio
n:
Ge
ne
ral F
un
d:
Eq
ua
liza
tio
n A
id1
8-4
95
-03
4-5
12
0-0
78
5,2
06
,53
2.
$
07
/01
/17
-0
6/3
0/1
80
.$
0.
$
0.
$
5,2
06
,53
2.
$
(5,2
06
,53
2.)
$
0.
$
Sch
oo
l C
ho
ice
Aid
18
-49
5-0
34
-51
20
-06
84
28
,96
0.
07
/01
/17
-0
6/3
0/1
80
.
0.
0.
42
8,9
60
.
(42
8,9
60
.)
0.
Tra
nsp
ort
atio
n A
id1
8-4
95
-03
4-5
12
0-0
14
64
,74
0.
07
/01
/17
-0
6/3
0/1
80
.
0.
0.
64
,74
0.
(64
,74
0.)
0.
Sp
ecia
l E
du
ca
tio
n C
ate
go
rica
l A
id1
8-4
95
-03
4-5
12
0-0
89
33
5,9
85
.
07
/01
/17
-0
6/3
0/1
80
.
0.
0.
33
5,9
85
.
(33
5,9
85
.)
0.
Se
cu
rity
Aid
18
-49
5-0
34
-51
20
-08
41
60
,34
4.
07
/01
/17
-0
6/3
0/1
80
.
0.
0.
16
0,3
44
.
(16
0,3
44
.)
0.
Un
de
r A
de
qu
acy A
id1
8-4
95
-03
4-5
12
0-0
96
3,7
46
.
07
/01
/17
-0
6/3
0/1
80
.
0.
0.
3,7
46
.
(3,7
46
.)
0.
PA
RC
C R
ea
din
ess A
id1
8-4
95
-03
4-5
12
0-0
98
5,7
80
.
07
/01
/17
-0
6/3
0/1
80
.
0.
0.
5,7
80
.
(5,7
80
.)
0.
Pe
r P
up
il G
row
th A
id1
8-4
95
-03
4-5
12
0-0
97
5,7
80
.
07
/01
/17
-0
6/3
0/1
80
.
0.
0.
5,7
80
.
(5,7
80
.)
0.
Pro
fessio
na
l L
ea
rnin
g C
om
mu
nity A
id1
8-4
95
-03
4-5
12
0-1
01
6,0
10
.
07
/01
/17
-0
6/3
0/1
80
.
0.
0.
6,0
10
.
(6,0
10
.)
0.
Ho
st D
istr
ict S
up
po
t A
id1
8-4
95
-03
4-5
12
0-1
02
3,5
11
.
07
/01
/17
-0
6/3
0/1
80
.
0.
0.
3,5
11
.
(3,5
11
.)
0.
Extr
ao
rdin
ary
aid
1
8-4
95
-03
4-5
12
0-0
44
13
,31
7.
07
/01
/17
-0
6/3
0/1
80
.
0.
0.
0.
(13
,31
7.)
0.
Extr
ao
rdin
ary
aid
17
-49
5-0
34
-51
20
-04
41
6,4
17
.
07
/01
/16
-0
6/3
0/1
7(1
6,4
17
.)
0.
0.
16
,41
7.
0.
0.
On
Be
ha
lf T
PA
F P
ost R
etire
me
nt M
ed
ica
l1
8-4
95
-03
4-5
09
5-0
01
28
8,4
03
.
07
/01
/17
-0
6/3
0/1
80
.
0.
0.
28
8,4
03
.
(28
8,4
03
.)
0.
On
Be
ha
lf T
PA
F L
on
g-T
erm
Dis
ab
ility
18
-49
5-0
34
-50
95
-00
46
25
.
07
/01
/17
-0
6/3
0/1
80
.
0.
0.
62
5.
(62
5.)
0.
On
Be
ha
lf T
PA
F P
en
sio
n1
8-4
95
-03
4-5
09
5-0
02
44
6,5
28
.
07
/01
/17
-0
6/3
0/1
80
.
0.
0.
44
6,5
28
.
(44
6,5
28
.)
0.
Re
imb
urs
ed
TP
AF
So
cia
l S
ecu
rity
Co
ntr
ibu
tio
ns
18
-49
5-0
34
-50
95
-00
32
43
,96
4.
07
/01
/17
-0
6/3
0/1
80
.
0.
0.
23
2,5
11
.
(24
3,9
64
.)
0.
Re
imb
urs
ed
TP
AF
So
cia
l S
ecu
rity
Co
ntr
ibu
tio
ns
17
-49
5-0
34
-50
95
-00
32
39
,71
6.
07
/01
/16
-0
6/3
0/1
7(1
1,7
74
.)
0.
0.
11
,77
4.
0.
0.
Ad
ditio
na
l N
on
-Pu
blic
Tra
ns
18
-49
5-0
34
-51
20
-01
43
,77
0.
07
/01
/17
-0
6/3
0/1
80
.
0.
0.
0.
(3,7
70
.)
0.
Ad
ditio
na
l N
on
-Pu
blic
Tra
ns
17
-49
5-0
34
-51
20
-01
42
,26
2.
07
/01
/16
-0
6/3
0/1
7(2
,72
2.)
0.
0.
2,7
22
.
0.
0.
To
tal G
en
era
l F
un
d(3
0,9
13
.)
0.
0.
7,2
20
,36
8.
(7,2
17
,99
5.)
0.
Sp
ecia
l R
eve
nu
e F
un
d:
Pre
sch
oo
l E
du
ca
tio
n A
id1
8-4
95
-03
4-5
12
0-0
25
28
0,6
91
.
07
/01
/17
-0
6/3
0/1
80
.
0.
10
1,1
93
.
28
0,6
91
.
(36
9,6
80
.)
0.
Pre
sch
oo
l E
du
ca
tio
n A
id1
7-4
95
-03
4-5
12
0-0
25
24
1,9
75
.
07
/01
/16
-0
6/3
0/1
71
01
,19
3.
0.
(10
1,1
93
.)
0.
0.
0.
To
tal S
pe
cia
l R
eve
nu
e F
un
d1
01
,19
3.
0.
0.
28
0,6
91
.
(36
9,6
80
.)
0.
De
bt S
erv
ice
Fu
nd
:
De
bt S
erv
ice
Aid
Typ
e II
18
-49
5-0
34
-51
20
-12
51
08
,71
3.
07
/01
/17
-0
6/3
0/1
80
.
0.
0.
10
8,7
13
.
(10
8,7
13
.)
0.
To
tal D
eb
t S
erv
ice
Fu
nd
0.
0.
0.
10
8,7
13
.
(10
8,7
13
.)
0.
Sta
te D
ep
art
me
nt o
f A
gricu
ltu
re:
En
terp
rise
Fu
nd
:
Na
tio
na
l S
ch
oo
l L
un
ch
Pro
gra
m (
Sta
te S
ha
re)
18
-10
0-0
10
-33
50
-02
32
,67
6.
07
/01
/17
-0
6/3
0/1
80
.
0.
0.
1,8
82
.
(2,6
76
.)
0.
Na
tio
na
l S
ch
oo
l L
un
ch
Pro
gra
m (
Sta
te S
ha
re)
17
-10
0-0
10
-33
50
-02
32
,77
8.
07
/01
/16
-0
6/3
0/1
7(1
85
.)
0.
0.
18
5.
0.
0.
To
tal E
nte
rprise
Fu
nd
(18
5.)
0.
0.
2,0
67
.
(2,6
76
.)
0.
To
tal S
tate
Fin
an
cia
l A
ssis
tan
ce
70
,09
5.
$
0.
$
0.
$
7,6
11
,83
9.
$
(7,6
99
,06
4.)
$
0.
$
Th
e A
cco
mp
an
yin
g N
ote
s to
Sch
ed
ule
s o
f E
xp
en
ditu
res o
f S
tate
Aw
ard
s a
nd
Fin
an
cia
l A
ssis
tan
ce
are
an
In
teg
ral P
art
of th
is S
ch
ed
ule
.
SC
HE
DU
LE
OF
EX
PE
ND
ITU
RE
S O
F S
TA
TE
FIN
AN
CIA
L A
SS
IST
AN
CE
FO
R T
HE
FIS
CA
L Y
EA
R E
ND
ED
JU
NE
30
, 2
01
8
LA
WR
EN
CE
TO
WN
SH
IP S
CH
OO
L D
IST
RIC
T
104

EX
HIB
IT K
-4
SC
HE
DU
LE
B
Pa
ge
2 o
f 2
Pro
gra
m
Gra
nt o
r S
tate
o
r A
wa
rd
Gra
nt P
erio
d(A
cco
un
tsD
ef. R
ev./
Du
e to
Bu
dg
eta
ryC
um
ula
tive
Sta
te G
ran
tor/
Pro
gra
m T
itle
Pro
ject N
o.
Am
ou
nt
Fro
mT
o.R
ece
iva
ble
)In
terf
un
d P
ay
Gra
nto
rR
ece
iva
ble
To
tal E
xp
en
d.
Sta
te D
ep
art
. o
f E
du
ca
tio
n:
Ge
ne
ral F
un
d:
Eq
ua
liza
tio
n A
id1
8-4
95
-03
4-5
12
0-0
78
5,2
06
,53
2.
$
07
/01
/17
-0
6/3
0/1
80
.$
0.
$
0.
$
46
5,2
55
.
5,2
06
,53
2.
$
Sch
oo
l C
ho
ice
Aid
18
-49
5-0
34
-51
20
-06
84
28
,96
0.
07
/01
/17
-0
6/3
0/1
80
.
0.
0.
42
,89
6.
42
8,9
60
.
Tra
nsp
ort
atio
n A
id1
8-4
95
-03
4-5
12
0-0
14
64
,74
0.
07
/01
/17
-0
6/3
0/1
80
.
0.
0.
6,4
74
.
64
,74
0.
Sp
ecia
l E
du
ca
tio
n C
ate
go
rica
l A
id1
8-4
95
-03
4-5
12
0-0
89
33
5,9
85
.
07
/01
/17
-0
6/3
0/1
80
.
0.
0.
33
,59
9.
33
5,9
85
.
Se
cu
rity
Aid
18
-49
5-0
34
-51
20
-08
41
60
,34
4.
07
/01
/17
-0
6/3
0/1
80
.
0.
0.
16
,03
4.
16
0,3
44
.
Un
de
r A
de
qu
acy A
id1
8-4
95
-03
4-5
12
0-0
96
3,7
46
.
07
/01
/17
-0
6/3
0/1
80
.
0.
0.
37
5.
3,7
46
.
PA
RC
C R
ea
din
ess A
id1
8-4
95
-03
4-5
12
0-0
98
5,7
80
.
07
/01
/17
-0
6/3
0/1
80
.
0.
0.
57
8.
5,7
80
.
Pe
r P
up
il G
row
th A
id1
8-4
95
-03
4-5
12
0-0
97
5,7
80
.
07
/01
/17
-0
6/3
0/1
80
.
0.
0.
57
8.
5,7
80
.
Pro
fessio
na
l L
ea
rnin
g C
om
mu
nity A
id1
8-4
95
-03
4-5
12
0-1
01
6,0
10
.
07
/01
/17
-0
6/3
0/1
80
.
0.
0.
60
1.
6,0
10
.
Ho
st D
istr
ict S
up
po
t A
id1
8-4
95
-03
4-5
12
0-1
02
3,5
11
.
07
/01
/17
-0
6/3
0/1
80
.
0.
0.
35
1.
3,5
11
.
Extr
ao
rdin
ary
aid
1
8-4
95
-03
4-5
12
0-0
44
13
,31
7.
07
/01
/17
-0
6/3
0/1
8(1
3,3
17
.)
0.
0.
0.
13
,31
7.
Extr
ao
rdin
ary
aid
17
-49
5-0
34
-51
20
-04
41
6,4
17
.
07
/01
/16
-0
6/3
0/1
70
.
0.
0.
0.
0.
On
Be
ha
lf T
PA
F P
ost R
etire
me
nt M
ed
ica
l1
8-4
95
-03
4-5
09
5-0
01
28
8,4
03
.
07
/01
/17
-0
6/3
0/1
80
.
0.
0.
0.
28
8,4
03
.
On
Be
ha
lf T
PA
F L
on
g-T
erm
Dis
ab
ility
18
-49
5-0
34
-50
95
-00
46
25
.
07
/01
/17
-0
6/3
0/1
80
.
0.
0.
0.
62
5.
On
Be
ha
lf T
PA
F P
en
sio
n1
8-4
95
-03
4-5
09
5-0
02
44
6,5
28
.
07
/01
/17
-0
6/3
0/1
80
.
0.
0.
0.
44
6,5
28
.
Re
imb
urs
ed
TP
AF
So
cia
l S
ecu
rity
Co
ntr
ibu
tio
ns
18
-49
5-0
34
-50
95
-00
32
43
,96
4.
07
/01
/17
-0
6/3
0/1
8(1
1,4
53
.)
0.
0.
0.
24
3,9
64
.
Re
imb
urs
ed
TP
AF
So
cia
l S
ecu
rity
Co
ntr
ibu
tio
ns
17
-49
5-0
34
-50
95
-00
32
39
,71
6.
07
/01
/16
-0
6/3
0/1
70
.
0.
0.
0.
0.
Ad
ditio
na
l N
on
-Pu
blic
Tra
ns
18
-49
5-0
34
-51
20
-01
43
,77
0.
07
/01
/17
-0
6/3
0/1
8(3
,77
0.)
0.
0.
0.
3,7
70
.
Ad
ditio
na
l N
on
-Pu
blic
Tra
ns
17
-49
5-0
34
-51
20
-01
42
,26
2.
07
/01
/16
-0
6/3
0/1
70
.
0.
0.
0.
0.
To
tal G
en
era
l F
un
d(2
8,5
40
.)
0.
0.
56
6,7
41
.
7,2
17
,99
5.
Sp
ecia
l R
eve
nu
e F
un
d:
Pre
sch
oo
l E
du
ca
tio
n A
id1
8-4
95
-03
4-5
12
0-0
25
28
0,6
91
.
07
/01
/17
-0
6/3
0/1
80
.
12
,20
4.
0.
28
,06
9.
36
9,6
80
.
Pre
sch
oo
l E
du
ca
tio
n A
id1
7-4
95
-03
4-5
12
0-0
25
24
1,9
75
.
07
/01
/16
-0
6/3
0/1
70
.
0.
0.
0.
0.
To
tal S
pe
cia
l R
eve
nu
e F
un
d0
.
12
,20
4.
0.
28
,06
9.
36
9,6
80
.
De
bt S
erv
ice
Fu
nd
:
De
bt S
erv
ice
Aid
Typ
e II
18
-49
5-0
34
-51
20
-12
51
08
,71
3.
07
/01
/17
-0
6/3
0/1
80
.
0.
0.
0.
10
8,7
13
.
To
tal D
eb
t S
erv
ice
Fu
nd
0.
0.
0.
0.
10
8,7
13
.
Sta
te D
ep
art
me
nt o
f A
gricu
ltu
re:
En
terp
rise
Fu
nd
:
Na
tio
na
l S
ch
oo
l L
un
ch
Pro
gra
m (
Sta
te S
ha
re)
18
-10
0-0
10
-33
50
-02
32
,67
6.
07
/01
/17
-0
6/3
0/1
8(7
94
.)
0.
0.
0.
2,6
76
.
Na
tio
na
l S
ch
oo
l L
un
ch
Pro
gra
m (
Sta
te S
ha
re)
17
-10
0-0
10
-33
50
-02
32
,77
8.
07
/01
/16
-0
6/3
0/1
70
.
0.
0.
0.
0.
To
tal E
nte
rprise
Fu
nd
(79
4.)
0.
0.
0.
2,6
76
.
To
tal S
tate
Fin
an
cia
l A
ssis
tan
ce
(29
,33
4.)
$
12
,20
4.
$
0.
$
59
4,8
10
.$
7,6
99
,06
4.
$
Th
e A
cco
mp
an
yin
g N
ote
s to
Sch
ed
ule
s o
f E
xp
en
ditu
res o
f S
tate
Aw
ard
s a
nd
Fin
an
cia
l A
ssis
tan
ce
are
an
In
teg
ral P
art
of th
is S
ch
ed
ule
.
ME
MO
Ba
lan
ce
at Ju
ne
30
, 2
01
8
LA
WR
EN
CE
TO
WN
SH
IP S
CH
OO
L D
IST
RIC
T
SC
HE
DU
LE
OF
EX
PE
ND
ITU
RE
S O
F S
TA
TE
FIN
AN
CIA
L A
SS
IST
AN
CE
FO
R T
HE
FIS
CA
L Y
EA
R E
ND
ED
JU
NE
30
, 2
01
8
105

K-5
Page 1 of 2
LAWRENCE TOWNSHIP SCHOOL DISTRICT
NOTES TO THE SCHEDULES OF EXPENDITURES AWARDS
AND FINANCIAL ASSISTANCE
JUNE 30, 2018
NOTE 1. GENERAL
The accompanying schedules of expenditures of federal awards and state financial assistance include federal
and state award activity of the Board of Education, Lawrence Township School District. The Board of
Education is defined in Note 1 to the Board’s basic financial statements. All federal and state awards
received directly from federal and state agencies, as well as federal awards and state financial assistance
passed through other government agencies is included on the schedule of expenditures of federal awards
and state financial assistance.
NOTE 2. BASIS OF ACCOUNTING
The accompanying schedules of expenditures of awards and financial assistance are presented on the
budgetary basis of accounting with the exception of programs recorded in the food service fund, which are
presented using the accrual basis of accounting. These bases of accounting are described in Note 1 to the
Board’s basic financial statements. The information in this schedule is presented in accordance with the
requirements of 2 CFR 200-Uniform Administrative Requirements, Cost Principles, and Audit
Requirements for Federal Awards. Therefore, some amounts presented in this schedule may differ from
amounts presented in, or used in the preparation of, the basic financial statements.
NOTE 3. RELATIONSHIP TO BASIC FINANCIAL STATEMENTS
The basic financial statements present the general fund and special revenue fund on a GAAP basis.
Budgetary comparison statements or schedules (RSI) are presented for the general fund and special revenue
fund to demonstrate finance-related legal compliance in which certain revenue is permitted by law or grant
agreement to be recognized in the audit year, whereas for GAAP reporting, revenues is not recognized until
the subsequent year or when expenditures have been made.
The general fund is presented in the accompanying schedules on the modified accrual basis with the
exception of the revenue recognition of the last state aid payments in the current budget year, which is
mandated pursuant to N.J.S.A. 18A:22-4.2. For GAAP purposes, that payments are recognized until the
subsequent budget year due to the state deferral and recording of the last state aid payments in the
subsequent year. The special revenue fund is presented in the accompanying schedules on the grant
accounting budgetary basis which recognized encumbrances as expenditures and also recognizes the related
revenues, whereas the GAAP basis does not. The special revenue fund also recognizes the last state aid
payments in the current budget year, consistent with N.J.S.A., 18A:22-4.2.
The net adjustment to reconcile from the budgetary basis to the GAAP basis is $5,839 for the general fund
and $953 for the special revenue fund. See Exhibit C-3 for a reconciliation of the budgetary basis to the
modified accrual basis of accounting for the general and special revenue funds. Awards and financial
assistance revenues are reported in the Board’s basic financial statements on a GAAP basis as follows:
Federal State Total
General Fund $ 0. $ 7,223,834. $ 7,223,834.
Special Revenue Fund 365,809. 365,809. 731,618.
Debt Service Fund 0. 108,713. 108,713.
Food Service Fund 183,194. 2,676. 185,870.
Total Financial Assistance $ 549,003. $ 7,701,032. $ 8,250,035.
106

K-5
Page 2 of 2
LAWRENCE TOWNSHIP SCHOOL DISTRICT
NOTES TO THE SCHEDULES OF EXPENDITURES AWARDS
AND FINANCIAL ASSISTANCE
JUNE 30, 2018
NOTE 4. RELATIONSHIP TO FEDERAL AND STATE FINANCIAL REPORTS
Amounts reported in the accompanying schedules agree with the amounts reported in the related federal and
state financial reports.
NOTE 5. OTHER
Revenues and expenditures reported under the Food Distribution Program represent current year value
received and current year distributions respectively. The amount reported as TPAF Pension Contributions
represents the amount paid by the state on behalf of the District for the year ended June 30, 2018. TPAF
Social Security Contributions represents the amount reimbursed by the state for the employer’s share of
social security contributions for TPAF members for the year ended June 30, 2018.
NOTE 6. SUBRECIPIENTS
The District had no expenditures to subrecipients during the year ended June 30, 2018.
NOTE 7. INDIRECT COSTS
The District has elected not to use the 10% de minimis indirect cost rate as allowed under the Uniform
Guidance.
107
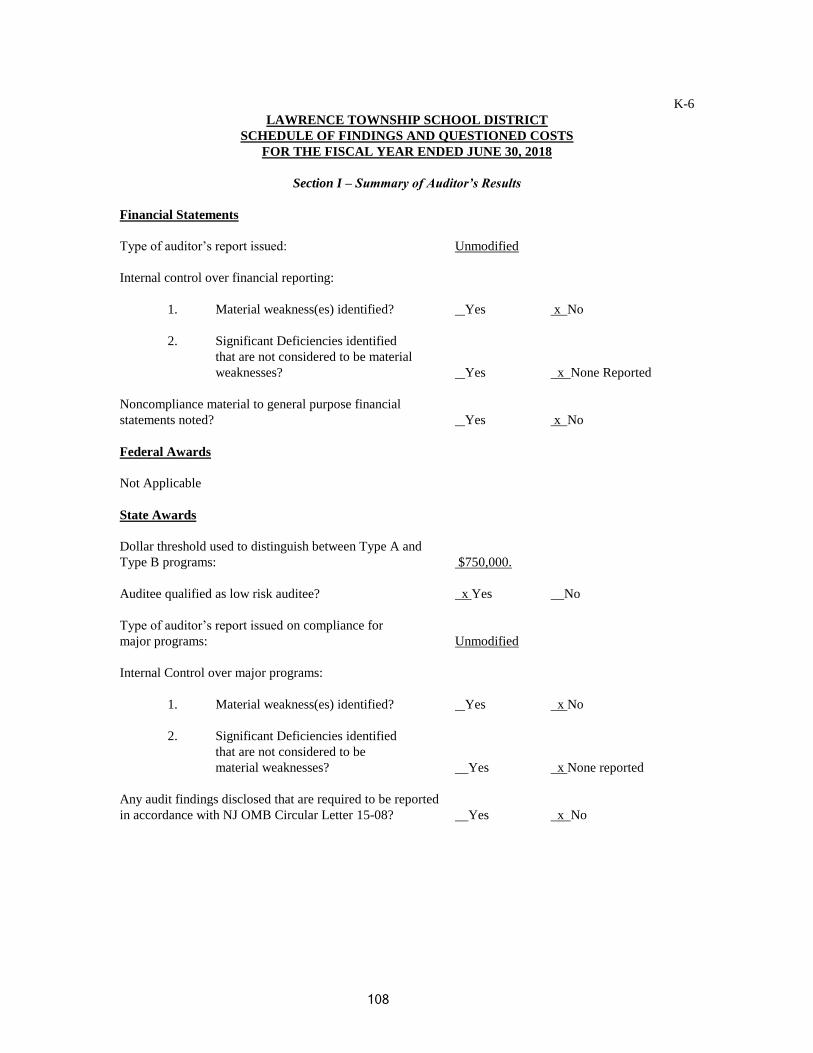
K-6
LAWRENCE TOWNSHIP SCHOOL DISTRICT
SCHEDULE OF FINDINGS AND QUESTIONED COSTS
FOR THE FISCAL YEAR ENDED JUNE 30, 2018
Section I – Summary of Auditor’s Results
Financial Statements
Type of auditor’s report issued: Unmodified
Internal control over financial reporting:
1. Material weakness(es) identified? Yes x No
2. Significant Deficiencies identified
that are not considered to be material
weaknesses? Yes x None Reported
Noncompliance material to general purpose financial
statements noted? Yes x No
Federal Awards
Not Applicable
State Awards
Dollar threshold used to distinguish between Type A and
Type B programs: $750,000.
Auditee qualified as low risk auditee? x Yes No
Type of auditor’s report issued on compliance for
major programs: Unmodified
Internal Control over major programs:
1. Material weakness(es) identified? Yes x No
2. Significant Deficiencies identified
that are not considered to be
material weaknesses? Yes x None reported
Any audit findings disclosed that are required to be reported
in accordance with NJ OMB Circular Letter 15-08? Yes x No
�����108

K-6
LAWRENCE TOWNSHIP SCHOOL DISTRICT
SCHEDULE OF FINDINGS AND QUESTIONED COSTS
FOR THE FISCAL YEAR ENDED JUNE 30, 2018
Identification of major programs:
GMIS Number(s) Name of State Program
495-034-5120-078 Equalization Aid
495-034-5120-089 Special Education Aid
495-034-5120-068 School Choice Aid
495-034-5120-084 Security Aid
495-034-5120-096 Under Adequacy Aid
495-034-5120-098 PARCC Readiness Aid
495-034-5120-097 Per Pupil Growth Aid
495-034-5120-014 Transportation Aid
495-034-5120-101 Professional Learning Community Aid
495-034-5120-102 Host District Support Aid
495-034-5120-086 Preschool Education Aid
Section II – Financial Statement Findings
None Reported
Section III – Federal Awards and State Financial Assistance
Findings and Questioned Costs
Federal Awards
N/A
State Awards
None Reported
�����
109

K-7
LAWRENCE TOWNSHIP SCHOOL DISTRICT
SUMMARY SCHEDULE OF PRIOR YEAR AUDIT FINDINGS
AND QUESTIONED COSTS AS PREPARED BY MANAGEMENT
FOR THE FISCAL YEAR ENDED JUNE 30, 2018
STATUS OF PRIOR YEAR FINDINGS
N/A – No Prior Year Findings
������110
Top Related