


Languages
Pages
Legal

City of Poulsbo, Washington
Comprehensive Annual Financial Report
For the fiscal year ended December 31, 2014

Cover Photo – Flickr Selbe<3 (4.30.12)

CITY OF POULSBO
WASHINGTON
COMPREHENSIVE ANNUAL FINANCIAL REPORT
For the fiscal year ended
December 31, 2014
Finance Director Deborah Booher

PREPARED BY
THE CITY FINANCE TEAM:
Finance Director Deborah Booher
Accounting Manager Jana McQuade
Accounting Technician Sonya Roberts
Accounting Technician Sandi Ryen
Accounting Technician Kelly Ziemann
Accounting Clerk Trina Lee
Administrative Assistant Dawn Hamrick For comments or questions, contact City of Poulsbo, Finance Department 360.394.9881
TABLE OF CONTENTS
INTRODUCTORY SECTION PAGE
Letter of Transmittal ................................................................................................................................................... 1 GFOA Certificate of Achievement for Excellence in Financial Reporting ................................................................... 7 Organization Chart ..................................................................................................................................................... 8 City of Poulsbo Principal Officials ............................................................................................................................... 9
FINANCIAL SECTION
Independent Auditor’s Report ................................................................................................................................. 11 Management’s Discussion and Analysis ................................................................................................................... 15
BASIC FINANCIAL STATEMENTS
Government‐Wide Financial Statements: Statement of Net Position ........................................................................................................................... 33 Statement of Activities ................................................................................................................................ 34 Fund Financial Statements: Balance Sheet – Governmental Funds ........................................................................................................ 36 Reconciliation of Governmental Fund Balances to the Net Position of Governmental Activities .............. 37 Statement of Revenues, Expenditures, and Changes in Fund Balances – Governmental Funds ................ 38 Reconciliation of the Statement of Revenues, Expenditures, and Changes in Fund Balances –
Governmental Funds to the Statement of Activities .......................................................................... 39 Statement of Revenues, Expenditures, and Changes in Fund Balance – Budget and Actual: General Fund ....................................................................................................................................... 40 Statement of Net Position – Proprietary Funds .......................................................................................... 42 Statement of Revenues, Expenses, and Changes in Net Position – Proprietary Funds .............................. 43 Statement of Cash Flows – Proprietary Funds ............................................................................................ 44 Statement of Fiduciary Net Position ........................................................................................................... 46 Notes to the Basic Financial Statements ........................................................................................................... 47 Required Supplementary Information LEOFF I retiree Medical Benefits Schedule of Funding Progress ................................................................. 74
COMBINING AND INDIVIDUAL FUND STATEMENTS AND SCHEDULES
Governmental Funds: Fund Descriptions ........................................................................................................................................ 75 Combining Balance Sheet – Nonmajor Governmental Funds ..................................................................... 78 Combining Statement of Revenues, Expenditures, and Changes in Fund Balances – Nonmajor Governmental Funds .................................................................................................................. 82
2014 COMPREHENSIVE ANNUAL FINANCIAL REPORT i
CITY OF POULSBO INTRODUCTORY SECTION
FINANCIAL SECTION (continued)
Schedules of Revenues, Expenditures, and Changes in Fund Balance – Budget to Actual: City Street Fund ........................................................................................................................................... 86 Capital Improvement Fund .......................................................................................................................... 87 Transportation Development Fund ............................................................................................................. 88 Park Development Fund .............................................................................................................................. 89 Historic Downtown Poulsbo Association Fund ............................................................................................ 90 Paths and Trails Reserve Fund ..................................................................................................................... 91 Drug Enforcement Fund .............................................................................................................................. 92 Transient Occupancy Tax Fund .................................................................................................................... 93 Police Restricted Fund ................................................................................................................................. 94 Miscellaneous Governmental Debt Fund .................................................................................................... 95 Non‐Voted General Obligation Debt Fund .................................................................................................. 96 Equipment Acquisition Fund ....................................................................................................................... 97 Park Reserve Fund ....................................................................................................................................... 98 Street Reserve Fund .................................................................................................................................... 99 Cemetery Reserve Fund ............................................................................................................................. 100 City Street Equipment Reserve Fund ......................................................................................................... 101 Facilities Fund ............................................................................................................................................ 102
STATISTICAL SECTION
Financial: Net Position by Component – Last Ten Fiscal Years .................................................................................. 105 Changes in Net Position – Last Ten Fiscal Years ........................................................................................ 106 Governmental Activities Tax Revenues by Source – Last Ten Fiscal Years ................................................ 108 Fund Balances of Governmental Funds – Last Ten Fiscal Years ................................................................ 109 Changes in Fund Balances of Governmental Funds – Last Ten Fiscal Years .............................................. 110 General Governmental Revenues by Source – Last Ten Fiscal Years ........................................................ 111 Revenue Capacity: Assessed Value and Estimated Actual Value of Taxable Property – Last Ten Fiscal Years ........................ 112 Property Tax Rates – Direct and Overlapping Governments – Last Ten Fiscal Years ............................... 113 Principal Taxpayers – Current Year and Nine Years Ago ........................................................................... 114 Property Tax Levies and Collections – Last Ten Fiscal Years ..................................................................... 115 Sales Tax Rate Direct and Overlapping Government –Last Ten Fiscal Years ............................................. 116 Retail Sales Tax Revenue by Sector‐Last Ten Fiscal Years ......................................................................... 117 Debt Capacity: Ratios of Outstanding Debt by Type – Last Ten Fiscal Years ..................................................................... 118 Ratios of General Bonded Debt Outstanding – Last Ten Fiscal Years ....................................................... 119 Direct and Overlapping Governmental Activities Debt ............................................................................. 120 Legal Debt Margin Information – Last Ten Fiscal Years ............................................................................ 121 Pledged‐Revenue Coverage – Last Ten Fiscal Years .................................................................................. 122
ii 2014 COMPREHENSIVE ANNUAL FINANCIAL REPORT
CITY OF POULSBO INTRODUCTORY SECTION
STATISTICAL SECTION(continued) Demographic and Economic: Demographic Statistics – Last Ten Fiscal Years ......................................................................................... 123 Principal Employers – Current Year and Ten Years Ago ............................................................................ 124 Operating: Full‐time Equivalent City Government Employees by Function ................................................................ 125 Operating Indicators by Function – Last Ten Fiscal Years ......................................................................... 126 Capital Assets Statistics by Function – Last Ten Fiscal Years ..................................................................... 128
2014 COMPREHENSIVE ANNUAL FINANCIAL REPORT iii
CITY OF POULSBO INTRODUCTORY SECTION
iv 2014 COMPREHENSIVE ANNUAL FINANCIAL REPORT
CITY OF POULSBO INTRODUCTORY SECTION

City of Poulsbo June 29, 2015 Mayor Erickson, The Poulsbo City Council, and Citizens of Poulsbo, Washington: I am pleased to provide the Comprehensive Annual Financial Report (CAFR) of the City of Poulsbo for the fiscal year ended December 31, 2014. This report is published annually as the official annual financial report and complies with state law (RCW 43.09.230) requiring annual reports for Washington municipal governments to be certified and filed with the State Auditor’s Office in a timely fashion.
As management for the City, we are responsible for both the accuracy of the data, and the completeness and fairness of the presentation, including all related disclosures. The City operates under a system of accounting internal controls that are concerned with the safeguarding of assets and the reliability of financial records. The definition of accounting control assumes reasonable, but not absolute, assurance the objectives expressed in it will be accomplished by the system. The concept of reasonable assurance recognized the cost of internal control should not exceed the benefits expected to be derived.
Cities and counties of the State of Washington use the Budgeting, Accounting and Reporting System (BARS) developed and prescribed by the Office of the State Auditor. State law provides for an annual independent audit to be conducted by the Office of the State Auditor.
As a recipient of federal, state and county financial assistance, the City is required to undergo an annual federal mandated “Single Audit” designed to meet the special needs of federal grantor agencies. The standards governing Single Audit engagements require the independent auditor to report not only on the fair presentation of the financial statements, but also the audited government’s internal controls and compliance with legal requirements, with special emphasis on internal controls and legal requirements involving the administration of federal awards. The City’s Single Audit Report is issued separately and is available upon request.
Generally Accepted Accounting Principles (GAAP) requires management provide a narrative introduction, overview and analysis to accompany the basic financial statements in the form of Management’s Discussion and Analysis (MD&A). This letter of transmittal is designed to complement the MD&A and should be read in conjunction with it. The City of Poulsbo’s MD&A can be found immediately following the independent auditor’s report.
Profile of the Government
The City of Poulsbo is located in Kitsap County, west of Seattle. Originally settled by Norwegian immigrants in the late 1800's on Liberty Bay, a fjord of Puget Sound, Poulsbo continues to maintain its Scandinavian atmosphere through its architecture, celebrations and hospitality. Holding to its Scandinavian heritage has earned the city the nickname "Little Norway" and visits from two Norwegian Kings.
The City of Poulsbo has a strong Mayor form of government, organized under the Optional Municipal Code as provided in State law. The Optional Municipal code confers a limited form of “home rule” to those municipalities organized under this provision. The independently elected mayor is the executive officer of the
2014 COMPREHENSIVE ANNUAL FINANCIAL REPORT 1
City and is responsible for all administrative transactions of the City, for overseeing the day-to-day operations of the City, and for appointment of department heads. The City Council is the policy-making branch and is responsible for, among other things, passing ordinances, exercising legislative and quasi-judicial functions, and adopting the budget. The seven members of the City Council and mayor serve four-year staggered terms, with four council positions up for election one year and then two years later, the mayor and remaining the three council positions appear on the ballot.
To provide a full range of services to its citizens, the City of Poulsbo is divided into departments, financial management and control systems. Services provided include: police protection; maintenance of water and sewer services; garbage and recycling disposal; street maintenance, construction and repair of facilities and assets; municipal court; land use administration, and general administration. The City designs and maintains many parks and green spaces, coordinates recreation activities, fosters neighborhood livability and works to preserve the City’s environmental quality and historic legacy. Additional information may be found in the Notes to the Financial Statements, thus readers are encouraged to review this CAFR in its entirety.
Local Economy
Poulsbo has evolved from a small town with fishing and farming as its chief industries into a city that has marketed itself as a very attractive place for people to live, work and visit.
Poulsbo’s economy is largely influenced by the presence of significant Naval bases, its geographic location for a commuting workforce to Seattle and other large cities, as well as an entrance point for access to the Olympic Peninsula. Serving as North Kitsap’s commercial and employment center, Poulsbo has been able to maintain a conservative growth of economy during the on-going national recession. Economic development continues to diversify consistent with the City’s long range plan. The City encompasses over 2954 acres and for economical analysis and contrasting purposes is divided into four geographical areas:
• Central Downtown Poulsbo – the Historic area and waterfront • West Side Junction Area – Viking Avenue Corridor • East Side State Highway 305 and Lincoln Hill • Northwest Corner College Market Place
Centrally located in the heart of Poulsbo, the downtown area has maintained its history including restoration of many of the original buildings. Graced with a photographic waterfront parkway and boardwalk, the area invites tourists to shop and spend an afternoon or weekend. Poulsbo's waterfront is active year round and a favorite destination for day excursions and vacationing boaters. Poulsbo has continued to witness new food establishments open in the downtown corridor providing many dining options for City residents and visiting tourists. Many are referring to the increased activity as “Destination Dining”. Along with commerce the City Hall is located in the heart of the historic downtown corridor. All City Departments are located in the building, with the exception of Park & Recreation and Public Works operation. The central location provides a one stop shop for City residents. The building also offers multiple meeting rooms available to the public, bringing more opportunities for visitors and citizens to support the local economy.
On the west side of the City, the Viking Avenue Corridor is a five lane highway including a turn-lane spanning the length of the City limits. The avenue contains sidewalks on both sides allowing for pedestrian and bicycle safety. The corridor hosts various small businesses and restaurants and provides access to two busy City parks. The city, along with hundreds of volunteers have worked on the development of the 20 acre Fish Park that boasts
2 2014 COMPREHENSIVE ANNUAL FINANCIAL REPORT
CITY OF POULSBO INTRODUCTORY SECTION
trails, boardwalks, viewing platforms, interpretive signs, small natural amphitheater and numerous forms of wildlife. The City was donated two parcels of land and able to purchase through grant proceeds an additional land parcel to connect with Fish Park. These parcels will be developed in accordance with the park master plan and allow additional public access for viewing the Poulsbo’s natural shoreline.
Unfortunately Poulsbo was not exempt from some of the economic challenges experienced by the rest of the nation. While some new businesses opened their doors, there were also some long time establishments which closed their doors. Unfortunate victims of the national economy were automobile dealerships occupying much of the Viking Avenue corridor. The Mayor and City Council continue to work actively with current business owners to support growth, stability and encourage new potential opportunities. Slowly, but surely some of the properties are acquiring owners and business establishments. A new pre-owned auto dealership opened for business in 2014 and another large vacant dealership was purchased at the end of 2014, with planned occupation in 2015. Fishline, who provides meals and support to those who are in need of this assistance, also relocated their food bank to Viking Avenue, while maintaining their second hand store in the historic downtown section.
State Highway 305 runs through the east side of Poulsbo providing access to the Bainbridge Island/Seattle ferry, twelve miles to the south. SR 305 includes peak hour high occupancy vehicle (HOV) and is the primary roadway for residents to travel in their morning and afternoon commutes to work and school. In years past, this was the agricultural area of Poulsbo. Today, "Poulsbo Village," a shopping mall with retail stores, offices, athletic club and medical facilities, occupies the land, which was previously a dairy farm. The commercial area on both sides of State Highway 305 continues to enjoy a healthy customer base. A business park campus located on Lincoln Hill, east of State Highway 305 changed an old gravel pit into a contemporary business park with a spectacular view of the Olympic Mountains. The campus continues to expand and attract new businesses and professional services to our area. These companies are able to provide family wage earning jobs for professionals who prefer not to commute to the Seattle area. Poulsbo is the home of several large grocery store options including a large Central Market, which has been deemed a destination market, boasting local produce and many quick gourmet dining options. In 2014, a new large Safeway store inclusive of a gas station opened for business. This large retail grocery development will enhance the options for residents as well as entice travelers to make a quick stop with easy highway access and a covered parking option to help protect from any climate impacts. A new CVS full service pharmacy opened for business in 2014, providing more options for resident’s pharmacy and other needs. Poulsbo is served by the North Kitsap School District. The Lincoln Hill area includes the North Kitsap Senior High, Poulsbo Middle School, Poulsbo Elementary and the North Kitsap School District Administrative offices.
The newest and fastest growing area of the City is located in the northwest corner, called College Market Place. This is a 215 acre development which is anticipated to take approximately 10 years to become fully developed. The master plan includes commercial buildings, business parks, single and multi-family units as well as a satellite campus of Olympic Community College. The college continues to enhance their program and partner with Western Washington University offering several 4 year baccalaureate programs. As of today, several anchor stores including Wal-Mart, Home Depot, Petco, Big 5 and Office Max are located in the development. Several
2014 COMPREHENSIVE ANNUAL FINANCIAL REPORT 3
CITY OF POULSBO INTRODUCTORY SECTION
other businesses are located in adjacent strip malls. The growing retail development has significantly helped diversify Poulsbo’s resources and reduce the impact of the declining revenues in other areas of the City. The local economy slowed construction; however, activity seems to be seeing a resurgent beginning in 2014. A new full serve restaurant offering Asian cuisine opened for business in 2014. Conversations and marketing regarding future development in this area continue.
The City of Poulsbo continues to promote smart growth with new businesses coming into the area and providing local employment as well as maintaining our “small but sophisticated” atmosphere. The depth and impact of the on-going recession has changed the way the City looks at revenues and expenditures; we will have to do more with less until revenue sources stabilize and grow. However, Poulsbo is a very fortunate community where leaders have been conservative in spending. Excess funds have been banked in reserves to help stabilize the declining revenues. We feel government, citizens, and developers working together can successfully accomplish the goal of keeping Poulsbo the premier place to live work and play on the Kitsap Peninsula.
Cash Management
Careful financial control of the City’s daily operations is an important part of Poulsbo’s overall fiscal management program. Achieving adequate cash management and investment control requires sound financial planning to ensure sufficient revenues are available to meet the current expenditures of any one operating period.
The City continues to operate under their Financial Management Policy, requiring the Fund Balance be in excess of twelve percent of the operating revenues and cash and investment balances to be in excess of two months of operating expenses. This is consistent with GFOA’s recommended practices. These items are reviewed quarterly with Council Members to assure compliance or bring focus to an area, which may not be meeting the minimum levels.
Once steps are taken to ensure the City maintains a protected cash position in its daily operations, it is to the City’s advantage to prudently invest idle funds until such time as they are required to make expenditures according to the following guidelines:
• The City’s idle cash will be invested on a continuous basis in accordance with the City’s adopted investment policies.
• The City has and will maintain a formal investment policy that is reviewed and endorsed by professional financial organizations.
• The City will invest all funds (in excess of current requirements) based upon the following order of priority: 1) Legality, 2) Safety, 3) Liquidity and Yield.
• Investments with City funds will not be made for purposes of speculation. • The City is prohibited from investing in any financial instruments that are not approved for legal
investments for municipalities in the State of Washington. • Proper security measures will be taken to safeguard investments. The City’s designated banking
institution will provide adequate collateral to insure City funds. Long Range Financial Planning
The City continues to not only look at current financial conditions, but improve and incorporate long range planning. A model with several years of actual data and using the information to project out five years was developed and used to work with City Staff and elected officials to plan for operating and capital budgets. As
4 2014 COMPREHENSIVE ANNUAL FINANCIAL REPORT
CITY OF POULSBO INTRODUCTORY SECTION

with all statistical and trending information, it is used with caution, as there can be conditions and impacts which do not follow the trend. Experiences with the recent economic downturn resulted in an adjusted budget knowing the trend needed to be altered. The 2014 budget was developed, delaying some capital acquisitions and postponing capital projects as well as developing additional revenue streams. The City updates the Capital Improvement Plan to be consistent with the City’s long range comprehensive and functional plans; reviewing priorities and assuring funding for projects set in the future years. Due to conservatism and knowledge that the plan is a tool and not an exact science, the City has a healthy reserve balance to support fluctuations from the plan.
The City balanced the 2014 Budget with the intention of using reserve funds, but still maintaining levels consistent with the City’s policies. Due to increased and unanticipated revenues and conservative spending, it was not necessary to use reserves in 2014 to stabilize the fund. For the first time in several years the General Fund current operating revenues supported expenditures.
Risk Management
Effective January 1, 2014, the City changed carriers for its liability and property coverage to Washington Cities Insurance Authority (WCIA). Due to the larger pool of Cities, WCIA is able to offer a lower premium and options for more training at no additional cost to the City. The carrier also requires mandatory levels of training, attendance at board meetings and internal audits which makes the City much more active and accountable with the change in coverage. In 2014 the City reorganized and created a Risk Manager position to support the risk management function, be more proactive and monitor the City’s program to maintain our eligibility compliance.
The City’s industrial insurance is provided by Washington State and is administered by the Department of Labor and Industries. Coverage is purchased by means of standard state assessed rates per working hour which are computed using risk categories as well as the City’s loss history.
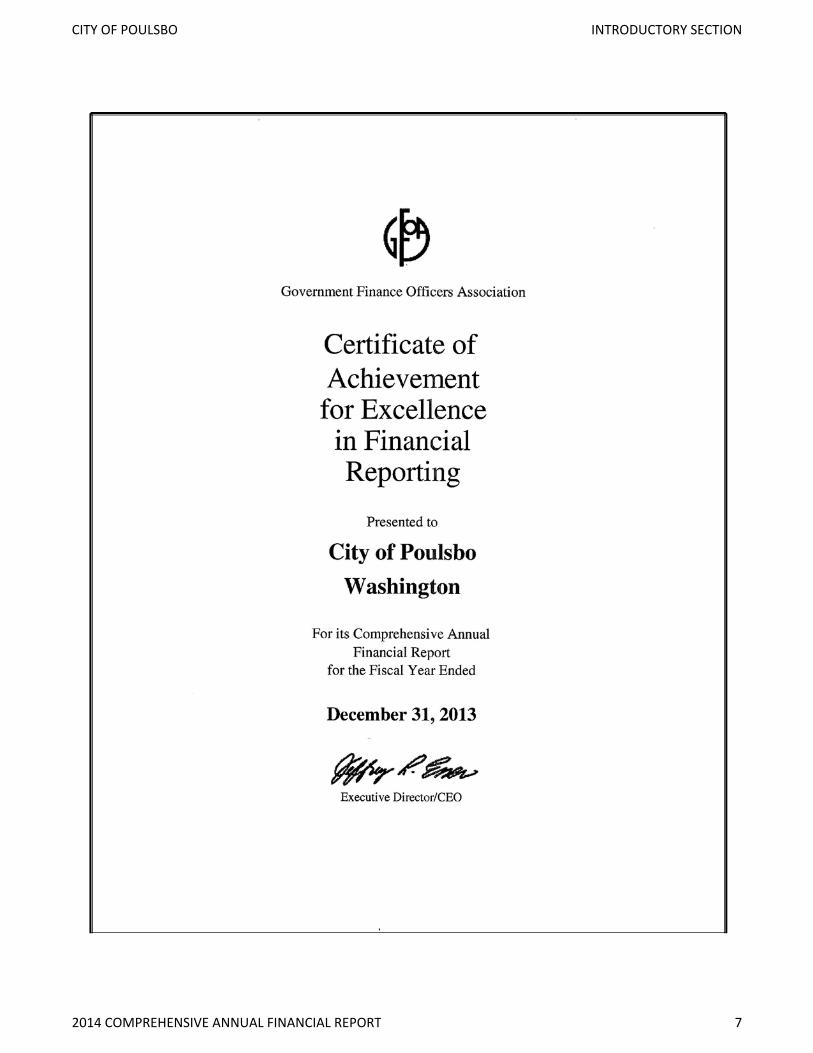
Awards
The City of Poulsbo has committed itself to financial excellence for many years as experienced by the receipt of the Government Finance Officers Association (GFOA) Certificate of Achievement for Excellence in Financial Reporting as well as the Distinguished Budget Presentation Award. Commitment to the residents of the City of Poulsbo has always been full disclosure of the financial position of the City.
The City has received the Distinguished Budget Presentation award for several years, including the 2014 Budget.
The Government Finance Officers Association of the United States and Canada (GFOA) awarded a Certificate of Achievement for Excellence in Financial Reporting to the City of Poulsbo, Washington for its Comprehensive Annual Financial Report (CAFR) for the fiscal year ended December 31, 2013.
In order to be awarded a Certificate of Achievement a governmental unit must publish an easily readable and efficiently organized CAFR that conforms to program standards. Such reports must satisfy both generally accepted accounting principles and applicable legal requirements.
A Certificate of Achievement is valid for a period of one year only. We believe our current report continues to conform to the requirements and standards of the Certificate of Achievement Program, and we are submitting the 2014 Comprehensive Annual Financial Report to the GFOA for review. The Certificate of Achievement is the
2014 COMPREHENSIVE ANNUAL FINANCIAL REPORT 5
CITY OF POULSBO INTRODUCTORY SECTION
highest form of recognition in the area of Governmental Financial Reporting, and its award represents significant accomplishment by a government and its management.
Acknowledgements The preparation of this Comprehensive Annual Financial Report represents the culmination of months of collaborative teamwork by the entire Finance Department staff. The preparation of this report could not have been accomplished without the professional, efficient and dedicated staff of the Finance team, and to each member I extend my sincere appreciation, in particular to our Accounting Manager, Jana McQuade, who manages the CAFR preparation.
Further appreciation is also offered to the City’s management team, the Mayor, and the City Council for their encouragement, interest and support in conducting the financial operations of the City in a sound and progressive manner. In addition, I would express thanks to the efficient assistance of our local auditor from the Washington State Auditor’s Office.
Respectfully submitted,
Deborah L. Booher Finance Director
6 2014 COMPREHENSIVE ANNUAL FINANCIAL REPORT
CITY OF POULSBO INTRODUCTORY SECTION
2014 COMPREHENSIVE ANNUAL FINANCIAL REPORT 7
CITY OF POULSBO INTRODUCTORY SECTION
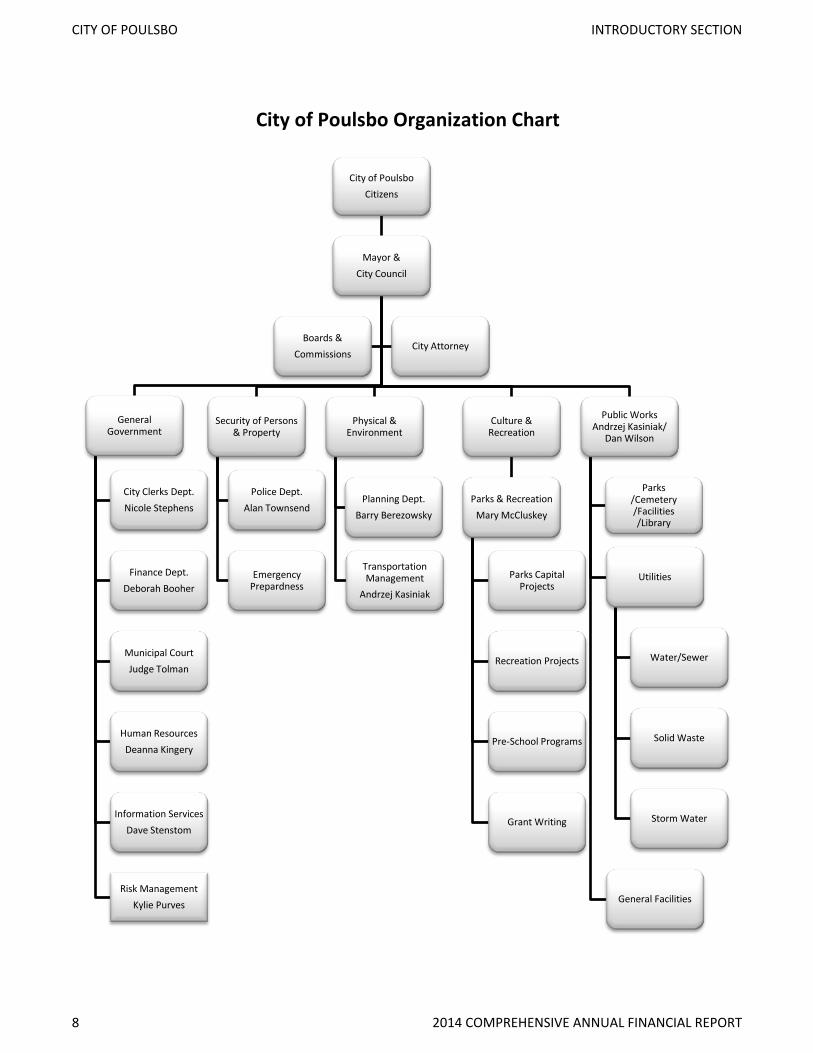
City of Poulsbo Citizens
Mayor & City Council
General Government
City Clerks Dept. Nicole Stephens
Finance Dept. Deborah Booher
Municipal Court Judge Tolman
Human Resources Deanna Kingery
Information Services Dave Stenstom
Risk Management Kylie Purves
Security of Persons & Property
Police Dept. Alan Townsend
Emergency Prepardness
Physical & Environment
Planning Dept. Barry Berezowsky
Transportation Management
Andrzej Kasiniak
Culture & Recreation
Parks & Recreation Mary McCluskey
Parks Capital Projects
Recreation Projects
Pre-School Programs
Grant Writing
Public Works Andrzej Kasiniak/
Dan Wilson
Parks /Cemetery /Facilities /Library
Utilities
Water/Sewer
Solid Waste
Storm Water
General Facilities
Boards & Commissions
City Attorney
City of Poulsbo Organization Chart
8 2014 COMPREHENSIVE ANNUAL FINANCIAL REPORT
CITY OF POULSBO INTRODUCTORY SECTION
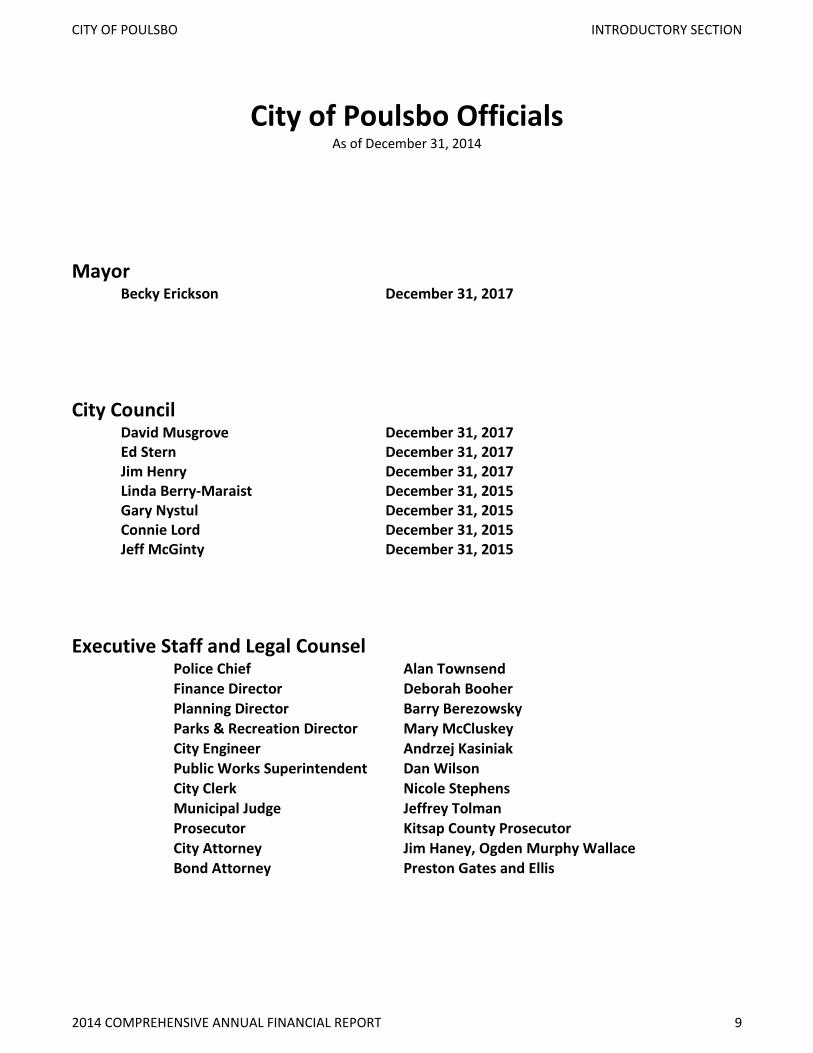
City of Poulsbo Officials As of December 31, 2014
Mayor Becky Erickson December 31, 2017
City Council David Musgrove December 31, 2017 Ed Stern December 31, 2017 Jim Henry December 31, 2017 Linda Berry-Maraist December 31, 2015 Gary Nystul December 31, 2015 Connie Lord December 31, 2015 Jeff McGinty December 31, 2015
Executive Staff and Legal Counsel Police Chief Alan Townsend Finance Director Deborah Booher Planning Director Barry Berezowsky Parks & Recreation Director Mary McCluskey City Engineer Andrzej Kasiniak Public Works Superintendent Dan Wilson City Clerk Nicole Stephens Municipal Judge Jeffrey Tolman Prosecutor Kitsap County Prosecutor City Attorney Jim Haney, Ogden Murphy Wallace Bond Attorney Preston Gates and Ellis
2014 COMPREHENSIVE ANNUAL FINANCIAL REPORT 9
CITY OF POULSBO INTRODUCTORY SECTION

.
10 2014 COMPREHENSIVE ANNUAL FINANCIAL REPORT
CITY OF POULSBO INTRODUCTORY SECTION


14 2014 COMPREHENSIVE ANNUAL FINANCIAL REPORT
CITY OF POULSBO FINANCIAL SECTION

MANAGEMENT’S DISCUSSION AND ANALYSIS
Management’s Discussion and Analysis (MD&A) of the City of Poulsbo’s financial performance provides an overall review of the City’s financial activities for the year ended December 31, 2014. The intent of this discussion and analysis is to look at the City’s financial performance as a whole.
This Management’s Discussion and Analysis (MD&A) combined with the Transmittal Letter, the Financial Statements and the Notes to the Financial Statements represent the complete 2014 financial activities for the City of Poulsbo.
These are all intended to:
• Assist the reader in focusing on significant financial issues • Provide an overview of the City’s financial activity • Identify changes in the City’s financial position • Identify any material deviations from the financial plan and adopted annual budget • Identify individual fund issues or concerns
FINANCIAL INFORMATION
The City’s government wide financial statements have been prepared on the full-accrual basis of accounting in conformity with generally accepted accounting principles (GAAP). The City’s Fund Financial Statements for governmental funds have been prepared on the modified accrual basis in conformity with GAAP. The City’s proprietary funds are accounted for on the accrual basis.
The City of Poulsbo’s financial system integrates financial and administrative controls that ensure the safeguarding of assets and the reliability of financial reports. These controls are designed to provide:
• Reasonable assurance that transactions are executed in accordance to management understanding and approval • Reasonable assurance that transactions are executed in accordance to GAAP principles • Accountability for control of assets and obligations • Assurance that sufficient reporting and review exists to provide adequate information for analysis and
comparability of data
Internal control is a high priority for the City. The Washington State Auditor’s Office (SAO) reviews the City’s internal controls, and the City receives and takes action on all recommendations made by SAO.
FINANCIAL HIGHLIGHTS
• City of Poulsbo assets exceeded its liabilities at the close of the 2014 fiscal year by $127.6 million (net position). Of this amount, $20.5 million (unrestricted net position) may be used to meet the city’s ongoing obligations to its citizens and creditors.
• Reported net position increased $4.6 million. Net position of governmental activities increased $2.5 million, or 3.76%, during 2014. Net position of business-type activities increased $2.1 million, or 3.7%, during 2014. In 2014 much of the variation can be attributed to increases in capital assets and a decrease in debt as principal payments made in 2014 decreased the outstanding amount due.
• Investments in capital assets net of debt, increased $3.4 million with the bulk of the increase occurring in the governmental activities. Much of this is due to clearing and refunding custodial accounts, which were deposits held from contractors for pending projects and a large invoice due to a contractor for a transportation project.
2014 COMPREHENSIVE ANNUAL FINANCIAL REPORT 15
CITY OF POULSBO FINANCIAL SECTION

• Total liabilities decreased by $438 thousand. This is primarily due to debt principal payments reducing the amount owed for existing issues and an outstanding invoice for a contractor on a large transportation project that awaits payment.
• The book value of capital assets has increased $2.3 million over 2013. Total capital assets from governmental activities increased $1.8 million or 2.4%. The increase in capital assets is primarily attributed to a large transportation project located on Lincoln Road. Capital assets of business-type activities increased $480 thousand or 1.1%. This is due to utility projects being completed in 2014.
• City governmental fund tax revenue has increased an average of 2% for the past several years. This average is based on the largest increase in 2014 of 5% and the lowest of -54% in 2013. Sales tax is the largest revenue source for Poulsbo. In 2014 the City saw an increase over the prior year of $354 thousand. Poulsbo is fortunate the increase is attributable to several categories, proving the hard work the Mayor and Council has done to diversify development. Utility taxes have seen an increase due to a combination of the number of new homes in the area and due to Council increasing the City utility tax rates for water and sewer services. Sales tax saw a significant increase, which is reflective of the recovering economy and new commercial businesses constructing and opening their doors for business. The new Safeway opened for business in 2014 with retail sales tax replacing the revenue generated in the construction category and a new CVS was built and opened for business in late 2014. The City continues to focus and promote diversification, planning for future growth and not remaining dependent on a single line of business.
• The financial statements represent fund balances as required by GASB. Balance Sheets display fund balances in the following manner:
o Unassigned – Residual net resources without any of the other fund balance limitations. The only fund which has an unassigned fund balance is General Fund.
o Assigned – Amounts assigned for specific uses such city road maintenance or law enforcement funds not restricted by law
o Committed – Self-imposed limitations at the highest level of decision makers that requires formal action at the same level. The City of Poulsbo does not have any committed fund balance for 2014.
o Restricted – Fund balances which have externally enforceable limitations on use by grantors, creditors or legal restrictions
o Nonspendable – This is compromised of assets, which will never convert to cash such as inventory or portion of proceeds which cannot be expended because they must be intact such as imprest funds
• At the close of the current fiscal year, the City’s governmental funds reported combined ending fund balances of $5.2 million. Approximately 83% of this total amount, or $4.3 million, is available for spending at the government’s discretion and 17% or $877 thousand is non-spendable or restricted per debt or legal requirements.
• At the end of the current fiscal year, the unassigned fund balance for the General Fund was $661,204 or 6.62% of the total General Fund expenditures. The total General Fund balance inclusive of the amount assigned for revenue stabilization and legal expenditures amounts to $2.18 million which equates 21.8% of General Fund expenditures.
16 2014 COMPREHENSIVE ANNUAL FINANCIAL REPORT
CITY OF POULSBO FINANCIAL SECTION
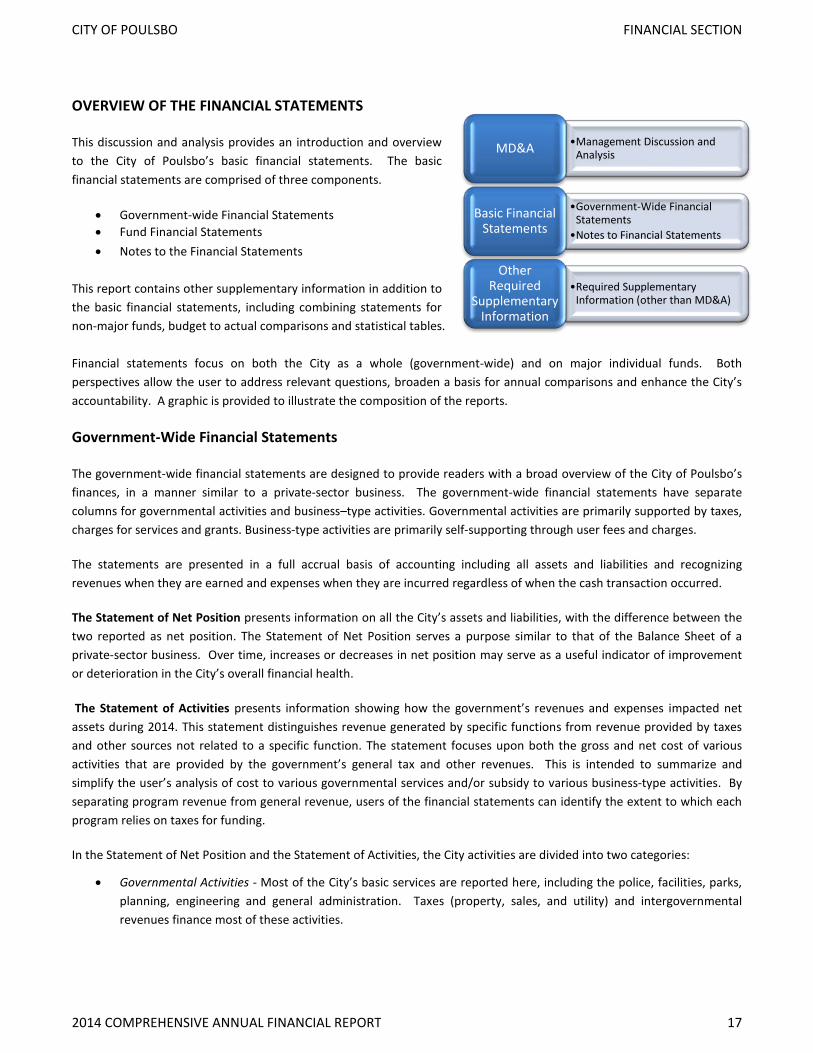
OVERVIEW OF THE FINANCIAL STATEMENTS
This discussion and analysis provides an introduction and overview to the City of Poulsbo’s basic financial statements. The basic financial statements are comprised of three components.
• Government-wide Financial Statements • Fund Financial Statements • Notes to the Financial Statements
This report contains other supplementary information in addition to the basic financial statements, including combining statements for non-major funds, budget to actual comparisons and statistical tables. Financial statements focus on both the City as a whole (government-wide) and on major individual funds. Both perspectives allow the user to address relevant questions, broaden a basis for annual comparisons and enhance the City’s accountability. A graphic is provided to illustrate the composition of the reports.
Government-Wide Financial Statements
The government-wide financial statements are designed to provide readers with a broad overview of the City of Poulsbo’s finances, in a manner similar to a private-sector business. The government-wide financial statements have separate columns for governmental activities and business–type activities. Governmental activities are primarily supported by taxes, charges for services and grants. Business-type activities are primarily self-supporting through user fees and charges.
The statements are presented in a full accrual basis of accounting including all assets and liabilities and recognizing revenues when they are earned and expenses when they are incurred regardless of when the cash transaction occurred.
The Statement of Net Position presents information on all the City’s assets and liabilities, with the difference between the two reported as net position. The Statement of Net Position serves a purpose similar to that of the Balance Sheet of a private-sector business. Over time, increases or decreases in net position may serve as a useful indicator of improvement or deterioration in the City’s overall financial health.
The Statement of Activities presents information showing how the government’s revenues and expenses impacted net assets during 2014. This statement distinguishes revenue generated by specific functions from revenue provided by taxes and other sources not related to a specific function. The statement focuses upon both the gross and net cost of various activities that are provided by the government’s general tax and other revenues. This is intended to summarize and simplify the user’s analysis of cost to various governmental services and/or subsidy to various business-type activities. By separating program revenue from general revenue, users of the financial statements can identify the extent to which each program relies on taxes for funding.
In the Statement of Net Position and the Statement of Activities, the City activities are divided into two categories:
• Governmental Activities - Most of the City’s basic services are reported here, including the police, facilities, parks, planning, engineering and general administration. Taxes (property, sales, and utility) and intergovernmental revenues finance most of these activities.
•Management Discussion and Analysis MD&A
•Government-Wide Financial Statements
•Notes to Financial Statements
Basic Financial Statements
•Required Supplementary Information (other than MD&A)
Other Required
Supplementary Information
2014 COMPREHENSIVE ANNUAL FINANCIAL REPORT 17
CITY OF POULSBO FINANCIAL SECTION
• Business-Type Activities - The City charges a fee to customers to help cover all or most of the costs of certain services provided. The City charges fees to recoup the cost of the operations of water, sewer, storm drain, and solid waste utilities as well as all capital and debt expenses associated with the individual utility.
Fund Financial Statements
Traditional users of governmental financial statements will find the Fund Financial Statements presentation more familiar. A fund is a fiscal and accounting entity with a self-balancing set of accounts used to account for specific activities or meet certain objectives. Funds are often set up in accordance with special regulations, restrictions or limitations.
The focus is on Major Funds rather than types. A Major Fund has three elements.
• Total assets, liabilities, revenues, or expenditures/expenses of that individual governmental or enterprise funds are at least ten percent (10%) of the corresponding total (assets, liabilities, etc) for all funds of that category or type (i.e. governmental, proprietary , or fiduciary); and
• Total assets, liabilities, revenues, or expenditures/expenses of the individual government fund or enterprise funds are at least five percent (5%) of the corresponding total for all governmental and enterprise funds combined; or
• Any other governmental or enterprise fund the government’s officials believe is particularly important
Governmental Funds: Governmental Funds are used to account for essentially the same functions reported as governmental activities in the Government-wide Financial Statements. These reports use a different “basis of accounting” than that used in government-wide financial statements. The focus of governmental fund financial statements is on near-term inflows and outflows of available resources and on balances of resources available at the end of the fiscal year. Such information is useful in evaluating whether there are more or less financial resources that can be spent in the near future to finance City services.
Because the focus of governmental funds is narrower than that of the governmental-wide financial statements, it is useful to compare the information presented for governmental funds with similar information presented for governmental activities in the government-wide financial statements. This provides the reader a better understanding of the long-term impact of the government’s near term financial decisions. To assist with the comparison, reconciliations between the governmental fund statements and the government-wide financial statements are included with the governmental fund balance sheet and the governmental fund statement of revenues, expenditures, and changes in fund balances.
The City of Poulsbo maintains budgetary controls over the governmental funds to ensure compliance with state law and council adoption at a fund level.
Proprietary Funds: The City’s Proprietary funds are the enterprise funds which provide services to customers. The City uses enterprise funds to account for its water, sewer, solid waste and storm drain activities. Proprietary funds use the same basis of accounting as business type activities.
Fiduciary Funds: Fiduciary Funds are used to account for resources held for the benefit of parties outside the City. All of the City’s fiduciary activities are reported in separate Statements of Fiduciary Net Position and consist of Agency funds only. These activities are excluded from the City’s government-wide financial statements because the assets cannot be used to finance the City’s operations.
Notes to the Financial Statements: The notes provide additional information that is essential to a full understanding of the data provided, and are an integral part of the government-wide and fund financial statements.
18 2014 COMPREHENSIVE ANNUAL FINANCIAL REPORT
CITY OF POULSBO FINANCIAL SECTION
Other Information: In addition to the basic financial statements and accompanying notes, this report also contains certain required supplementary information concerning the City of Poulsbo’s funding Police employee pension obligation. Required supplementary information may be found immediately following the notes to the financial statements.
GOVERNMENT-WIDE FINANCIAL ANALYSIS
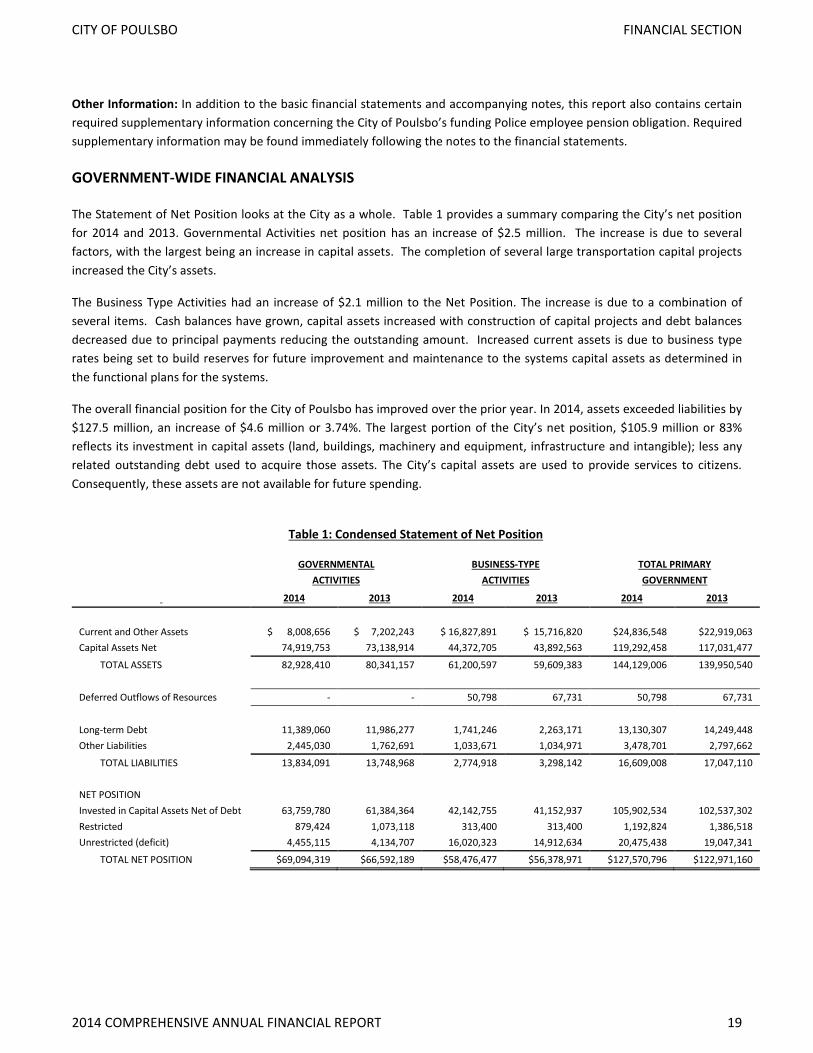
The Statement of Net Position looks at the City as a whole. Table 1 provides a summary comparing the City’s net position for 2014 and 2013. Governmental Activities net position has an increase of $2.5 million. The increase is due to several factors, with the largest being an increase in capital assets. The completion of several large transportation capital projects increased the City’s assets.
The Business Type Activities had an increase of $2.1 million to the Net Position. The increase is due to a combination of several items. Cash balances have grown, capital assets increased with construction of capital projects and debt balances decreased due to principal payments reducing the outstanding amount. Increased current assets is due to business type rates being set to build reserves for future improvement and maintenance to the systems capital assets as determined in the functional plans for the systems.
The overall financial position for the City of Poulsbo has improved over the prior year. In 2014, assets exceeded liabilities by $127.5 million, an increase of $4.6 million or 3.74%. The largest portion of the City’s net position, $105.9 million or 83% reflects its investment in capital assets (land, buildings, machinery and equipment, infrastructure and intangible); less any related outstanding debt used to acquire those assets. The City’s capital assets are used to provide services to citizens. Consequently, these assets are not available for future spending.
Table 1: Condensed Statement of Net Position
GOVERNMENTAL BUSINESS-TYPE TOTAL PRIMARY ACTIVITIES ACTIVITIES GOVERNMENT
2014 2013 2014 2013 2014 2013
Current and Other Assets $ 8,008,656 $ 7,202,243 $ 16,827,891 $ 15,716,820 $24,836,548 $22,919,063 Capital Assets Net 74,919,753 73,138,914 44,372,705 43,892,563 119,292,458 117,031,477
TOTAL ASSETS 82,928,410 80,341,157 61,200,597 59,609,383 144,129,006 139,950,540
Deferred Outflows of Resources - - 50,798 67,731 50,798 67,731
Long-term Debt 11,389,060 11,986,277 1,741,246 2,263,171 13,130,307 14,249,448 Other Liabilities 2,445,030 1,762,691 1,033,671 1,034,971 3,478,701 2,797,662
TOTAL LIABILITIES 13,834,091 13,748,968 2,774,918 3,298,142 16,609,008 17,047,110
NET POSITION Invested in Capital Assets Net of Debt 63,759,780 61,384,364 42,142,755 41,152,937 105,902,534 102,537,302 Restricted 879,424 1,073,118 313,400 313,400 1,192,824 1,386,518 Unrestricted (deficit) 4,455,115 4,134,707 16,020,323 14,912,634 20,475,438 19,047,341
TOTAL NET POSITION $69,094,319 $66,592,189 $58,476,477 $56,378,971 $127,570,796 $122,971,160
2014 COMPREHENSIVE ANNUAL FINANCIAL REPORT 19
CITY OF POULSBO FINANCIAL SECTION

-
10,000,000
20,000,000
30,000,000
40,000,000
50,000,000
60,000,000
70,000,000
2014 2013
Governmental Type Unrestricted (deficit)
Restricted
Invested in Capital Assets Net of Debt
-
10,000,000
20,000,000
30,000,000
40,000,000
50,000,000
60,000,000
2014 2013
Business Type
Unrestricted (deficit)
Restricted
Invested in Capital Assets Net of Debt
The City’s total restricted net position amounts to 1%. These represent resources which are subject to external restrictions on how they may be used. The majority of this amount can be attributed to restrictions for debt purposes.
20 2014 COMPREHENSIVE ANNUAL FINANCIAL REPORT
CITY OF POULSBO FINANCIAL SECTION
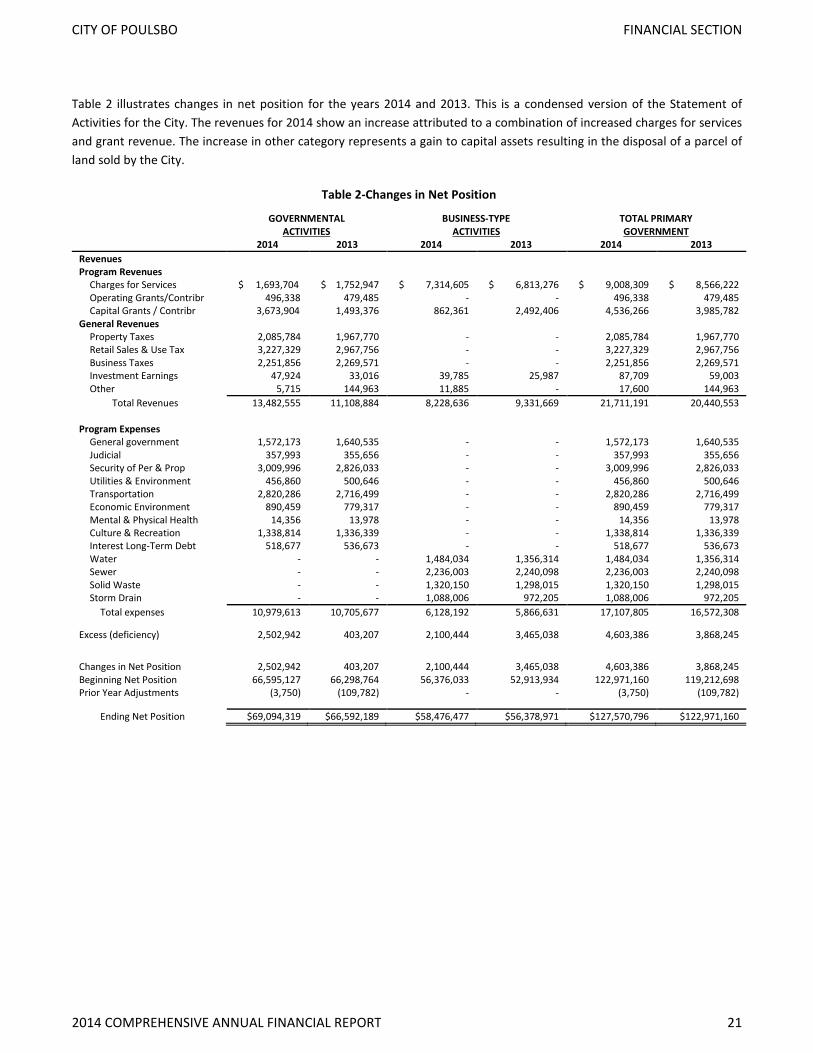
Table 2 illustrates changes in net position for the years 2014 and 2013. This is a condensed version of the Statement of Activities for the City. The revenues for 2014 show an increase attributed to a combination of increased charges for services and grant revenue. The increase in other category represents a gain to capital assets resulting in the disposal of a parcel of land sold by the City.
Table 2-Changes in Net Position
GOVERNMENTAL BUSINESS-TYPE TOTAL PRIMARY ACTIVITIES ACTIVITIES GOVERNMENT
2014 2013 2014 2013 2014 2013 Revenues Program Revenues
Charges for Services $ 1,693,704 $ 1,752,947 $ 7,314,605 $ 6,813,276 $ 9,008,309 $ 8,566,222 Operating Grants/Contribr 496,338 479,485 - - 496,338 479,485 Capital Grants / Contribr 3,673,904 1,493,376 862,361 2,492,406 4,536,266 3,985,782
General Revenues Property Taxes 2,085,784 1,967,770 - - 2,085,784 1,967,770 Retail Sales & Use Tax 3,227,329 2,967,756 - - 3,227,329 2,967,756 Business Taxes 2,251,856 2,269,571 - - 2,251,856 2,269,571 Investment Earnings 47,924 33,016 39,785 25,987 87,709 59,003 Other 5,715 144,963 11,885 - 17,600 144,963
Total Revenues 13,482,555 11,108,884 8,228,636 9,331,669 21,711,191 20,440,553 Program Expenses
General government 1,572,173 1,640,535 - - 1,572,173 1,640,535 Judicial 357,993 355,656 - - 357,993 355,656 Security of Per & Prop 3,009,996 2,826,033 - - 3,009,996 2,826,033 Utilities & Environment 456,860 500,646 - - 456,860 500,646 Transportation 2,820,286 2,716,499 - - 2,820,286 2,716,499 Economic Environment 890,459 779,317 - - 890,459 779,317 Mental & Physical Health 14,356 13,978 - - 14,356 13,978 Culture & Recreation 1,338,814 1,336,339 - - 1,338,814 1,336,339 Interest Long-Term Debt 518,677 536,673 - - 518,677 536,673 Water - - 1,484,034 1,356,314 1,484,034 1,356,314 Sewer - - 2,236,003 2,240,098 2,236,003 2,240,098 Solid Waste - - 1,320,150 1,298,015 1,320,150 1,298,015 Storm Drain - - 1,088,006 972,205 1,088,006 972,205
Total expenses 10,979,613 10,705,677 6,128,192 5,866,631 17,107,805 16,572,308 Excess (deficiency) 2,502,942 403,207 2,100,444 3,465,038 4,603,386 3,868,245 Changes in Net Position 2,502,942 403,207 2,100,444 3,465,038 4,603,386 3,868,245 Beginning Net Position 66,595,127 66,298,764 56,376,033 52,913,934 122,971,160 119,212,698 Prior Year Adjustments (3,750) (109,782) - - (3,750) (109,782)
Ending Net Position $69,094,319 $66,592,189 $58,476,477 $56,378,971 $127,570,796 $122,971,160
2014 COMPREHENSIVE ANNUAL FINANCIAL REPORT 21
CITY OF POULSBO FINANCIAL SECTION
Chrgs for Serv. 13%
Oper. Grants
4%
Capital Grants
27%
Property Taxes 16%
Sales & Use Taxes 24%
Business Taxes 12%
Excise Taxes
4%
Investment Earnings
0%
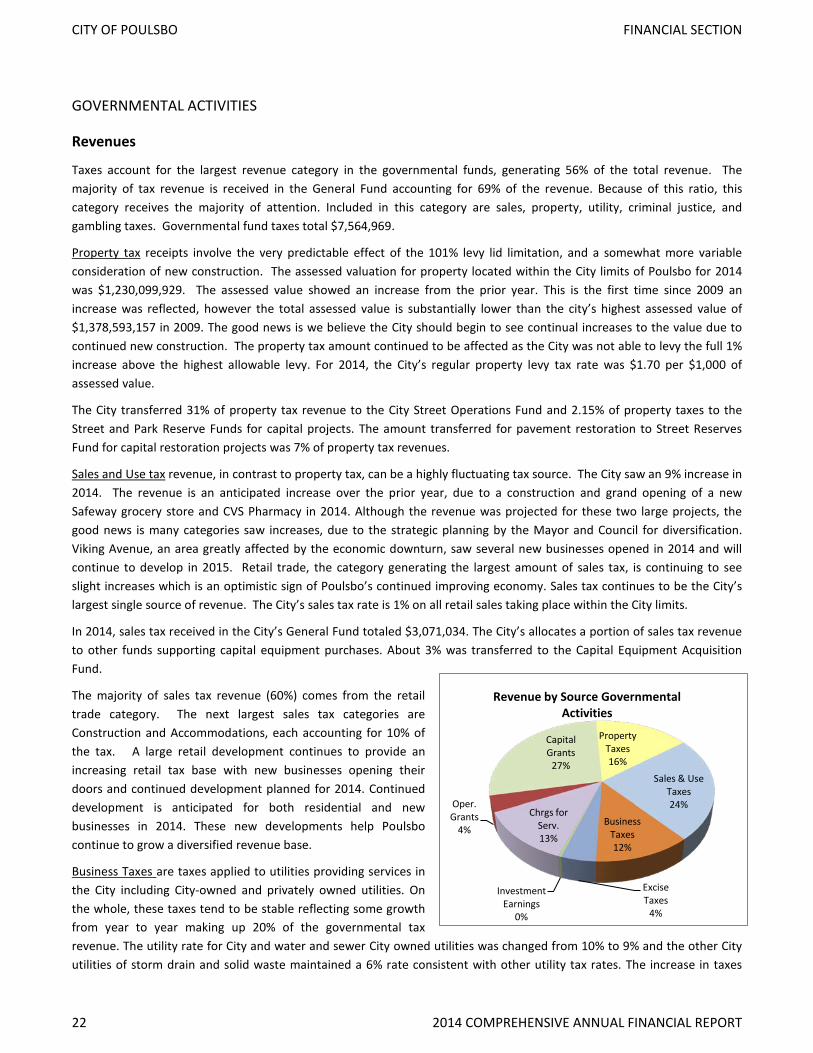
Revenue by Source Governmental Activities
GOVERNMENTAL ACTIVITIES
Revenues
Taxes account for the largest revenue category in the governmental funds, generating 56% of the total revenue. The majority of tax revenue is received in the General Fund accounting for 69% of the revenue. Because of this ratio, this category receives the majority of attention. Included in this category are sales, property, utility, criminal justice, and gambling taxes. Governmental fund taxes total $7,564,969.
Property tax receipts involve the very predictable effect of the 101% levy lid limitation, and a somewhat more variable consideration of new construction. The assessed valuation for property located within the City limits of Poulsbo for 2014 was $1,230,099,929. The assessed value showed an increase from the prior year. This is the first time since 2009 an increase was reflected, however the total assessed value is substantially lower than the city’s highest assessed value of $1,378,593,157 in 2009. The good news is we believe the City should begin to see continual increases to the value due to continued new construction. The property tax amount continued to be affected as the City was not able to levy the full 1% increase above the highest allowable levy. For 2014, the City’s regular property levy tax rate was $1.70 per $1,000 of assessed value.
The City transferred 31% of property tax revenue to the City Street Operations Fund and 2.15% of property taxes to the Street and Park Reserve Funds for capital projects. The amount transferred for pavement restoration to Street Reserves Fund for capital restoration projects was 7% of property tax revenues.
Sales and Use tax revenue, in contrast to property tax, can be a highly fluctuating tax source. The City saw an 9% increase in 2014. The revenue is an anticipated increase over the prior year, due to a construction and grand opening of a new Safeway grocery store and CVS Pharmacy in 2014. Although the revenue was projected for these two large projects, the good news is many categories saw increases, due to the strategic planning by the Mayor and Council for diversification. Viking Avenue, an area greatly affected by the economic downturn, saw several new businesses opened in 2014 and will continue to develop in 2015. Retail trade, the category generating the largest amount of sales tax, is continuing to see slight increases which is an optimistic sign of Poulsbo’s continued improving economy. Sales tax continues to be the City’s largest single source of revenue. The City’s sales tax rate is 1% on all retail sales taking place within the City limits.
In 2014, sales tax received in the City’s General Fund totaled $3,071,034. The City’s allocates a portion of sales tax revenue to other funds supporting capital equipment purchases. About 3% was transferred to the Capital Equipment Acquisition Fund.
The majority of sales tax revenue (60%) comes from the retail trade category. The next largest sales tax categories are Construction and Accommodations, each accounting for 10% of the tax. A large retail development continues to provide an increasing retail tax base with new businesses opening their doors and continued development planned for 2014. Continued development is anticipated for both residential and new businesses in 2014. These new developments help Poulsbo continue to grow a diversified revenue base.
Business Taxes are taxes applied to utilities providing services in the City including City-owned and privately owned utilities. On the whole, these taxes tend to be stable reflecting some growth from year to year making up 20% of the governmental tax revenue. The utility rate for City and water and sewer City owned utilities was changed from 10% to 9% and the other City utilities of storm drain and solid waste maintained a 6% rate consistent with other utility tax rates. The increase in taxes
22 2014 COMPREHENSIVE ANNUAL FINANCIAL REPORT
CITY OF POULSBO FINANCIAL SECTION

$- $500,000 $1,000,000 $1,500,000 $2,000,000 $2,500,000 $3,000,000 $3,500,000 $4,000,000
General government
Judicial
Security of Persons & Property
Utilities & Environment
Transportation
Economic Environment
Mental & Physical Health
Culture & Recreation
Governmental Activities - Expense and Program Revenue
Expenses
Program Revenues
represents a portion of the growing revenue and the increase rate to City utilities.
Excise Taxes are admissions tax, leasehold and real estate excise tax (REET). The majority of these taxes are the REET which make up 80% of the category. Revenues have fluctuated due to the change in the economy and home sales. The City uses the revenue generated by REET to fund debt payments related to the City Hall and transportation capital projects. Another portion is used to support the operations of street maintenance.
Expenses
General Government services encompass a variety of services including legislative, executive, financial, legal, judicial, personnel, building maintenance, and audit/risk management.
Judicial services provide support of the City’s Municipal Court system.
Security of Persons and Property services are provided by the City’s Police Department who works to provide professional law enforcement services to keep our citizens and their property safe. Special emphasis is placed on community-oriented programs that will prevent crime and forge a partnership between the officers and the citizens they serve.
Utility and Environment services create a satisfactory living environment for the City’s residents. Inspection of private construction projects and coordinating the design of City projects are two examples of physical environment activities.
Transportation services provide maintenance of the City’s streets, sidewalks, paths and traffic control signs/signals. In 2014 revenues greatly exceed expenditures due to the receipt of capital grants for capital projects which will then be reported on a balance sheet as an asset and not an operational expenditure.
Economic Environment services include land use planning, zoning and community development.
Mental and Physical Health services include the City’s support for the county’s substance abuse program. The City is required by State law to commit 2% of our revenues from liquor profits and liquor tax to this program. The City has a contract with the Kitsap County Health District, which uses a formula based on population and assessed value to determine the City’s level of subsidy.
Culture and Recreation services include expenditures for participant recreation programs and maintenance of the park facilities.
The chart below illustrates the surplus or net subsidy required for different, key City governmental-type programs. As illustrated, very few if any governmental activities are supported by direct revenue, which would mean they are largely supported by tax revenue.
2014 COMPREHENSIVE ANNUAL FINANCIAL REPORT 23
CITY OF POULSBO FINANCIAL SECTION
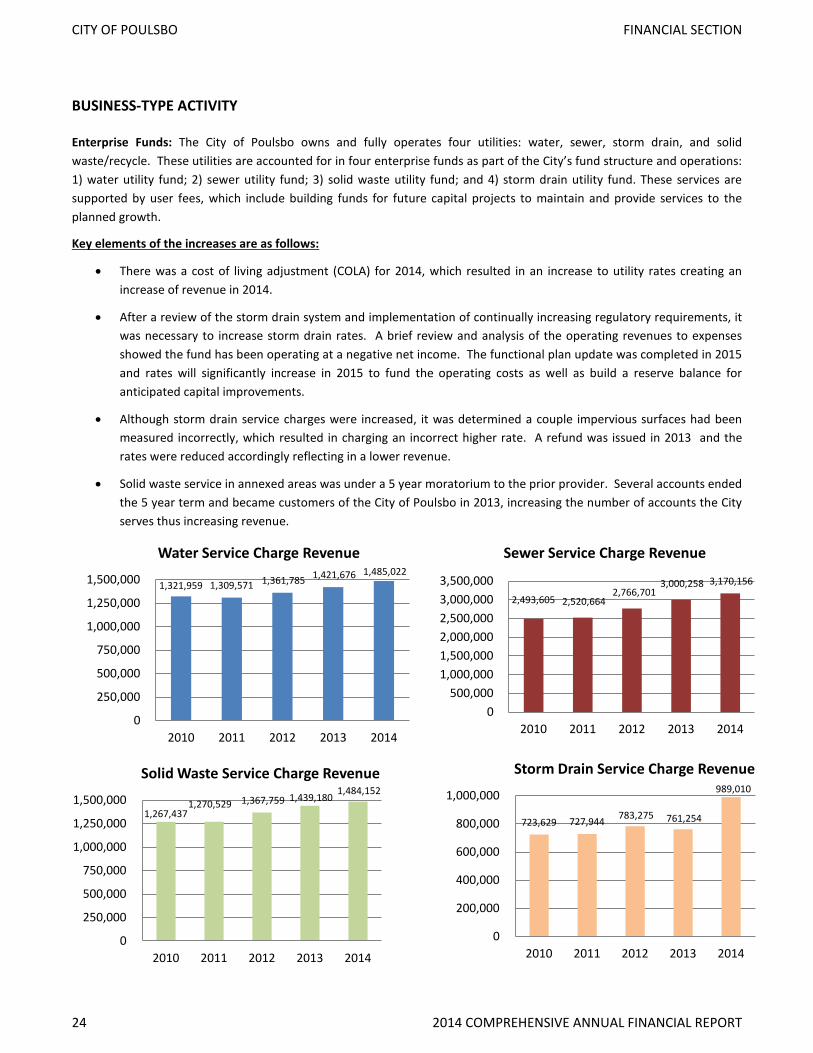
1,321,959 1,309,571 1,361,785 1,421,676 1,485,022
0
250,000
500,000
750,000
1,000,000
1,250,000
1,500,000
2010 2011 2012 2013 2014
Water Service Charge Revenue
2,493,605 2,520,664 2,766,701
3,000,258 3,170,156
0 500,000
1,000,000 1,500,000 2,000,000 2,500,000 3,000,000 3,500,000
2010 2011 2012 2013 2014
Sewer Service Charge Revenue
1,267,437 1,270,529 1,367,759 1,439,180
1,484,152
0
250,000
500,000
750,000
1,000,000
1,250,000
1,500,000
2010 2011 2012 2013 2014
Solid Waste Service Charge Revenue
723,629 727,944 783,275 761,254
989,010
0
200,000
400,000
600,000
800,000
1,000,000
2010 2011 2012 2013 2014
Storm Drain Service Charge Revenue
BUSINESS-TYPE ACTIVITY
Enterprise Funds: The City of Poulsbo owns and fully operates four utilities: water, sewer, storm drain, and solid waste/recycle. These utilities are accounted for in four enterprise funds as part of the City’s fund structure and operations: 1) water utility fund; 2) sewer utility fund; 3) solid waste utility fund; and 4) storm drain utility fund. These services are supported by user fees, which include building funds for future capital projects to maintain and provide services to the planned growth.
Key elements of the increases are as follows:
• There was a cost of living adjustment (COLA) for 2014, which resulted in an increase to utility rates creating an increase of revenue in 2014.
• After a review of the storm drain system and implementation of continually increasing regulatory requirements, it was necessary to increase storm drain rates. A brief review and analysis of the operating revenues to expenses showed the fund has been operating at a negative net income. The functional plan update was completed in 2015 and rates will significantly increase in 2015 to fund the operating costs as well as build a reserve balance for anticipated capital improvements.
• Although storm drain service charges were increased, it was determined a couple impervious surfaces had been measured incorrectly, which resulted in charging an incorrect higher rate. A refund was issued in 2013 and the rates were reduced accordingly reflecting in a lower revenue.
• Solid waste service in annexed areas was under a 5 year moratorium to the prior provider. Several accounts ended the 5 year term and became customers of the City of Poulsbo in 2013, increasing the number of accounts the City serves thus increasing revenue.
24 2014 COMPREHENSIVE ANNUAL FINANCIAL REPORT
CITY OF POULSBO FINANCIAL SECTION

The City seeks to supplement business activities, as well as governmental activities, through the prudent application of third party funding sources in the form of grants wherever possible. During 2014, business activity program revenues exceeded expenditures because rates were set to accommodate future capital improvements for a fully functioning system. Although all utilities either implemented or updated their functional plans to evaluate future improvements and operating costs, the City began updates in 2014 to address future needs and implementation of new and ever changing regulatory requirements. Rates will be set to reflect these updated plans. It is anticipated a joint project with the County to upgrade the sewer’s processing plant will occur in the near future, which is why sewer revenue has a larger variance between revenues and expenditures than the other utilities.
The chart below illustrates the surplus or net subsidy required for the City’s business-type programs.
Internal Service Funds: In 2014, the City eliminated its last Internal Service Fund. Prior to 2014 the City accounted for mechanic services in an internal service fund then charged back to the functions where the services were provided. In 2014 expenses were directly accounted for in the pertaining function.
Major Fund Analysis The City’s Funds: Information about the City’s major governmental funds begins on page 36. The City, in accordance with GASB 34, performed the major fund calculation and determined the Street Reserve Fund and the General Fund met the requirements to qualify as major funds. These funds are accounted for using the modified accrual basis of accounting. As reported on the Statement of Revenues, Expenditures, and Changes in Fund Balances, governmental funds have total revenues of $14 million and expenditures of $13.8 million. • General Fund: General Fund accounts for the main operating revenues and expenditures of the City’s governmental
functions. Revenues and expenditures related to Administrative Services, Executive, Legislative, Finance, Police, Engineering, Planning and Park Maintenance are some of the primary functions of the general government accounted for in General Fund. The majority of tax revenues are receipted into the General Fund supporting the governmental functions of the City. The Fund Balance for the General Fund has increased by 6.3%. The City’s revenues were greater than expenditures in 2014 increasing the fund balance. Although some of the increased revenues can be attributed to revenue related to
- 500,000 1,000,000 1,500,000 2,000,000 2,500,000 3,000,000 3,500,000 4,000,000
Water
Sewer
Solid Waste
Storm Drain
Business Activities - Expense and Program Revenue
Revenue
Expenses
2014 COMPREHENSIVE ANNUAL FINANCIAL REPORT 25
CITY OF POULSBO FINANCIAL SECTION

development, creating one time fees, some of the revenues such as sales tax and utility taxes are increasing because of the growing economy. Expenditures are also substantially less than prior years for legal fees, jail costs and departmental conservative spending. Although the use of reserves was anticipated, it was not necessary and no reserves were used. Revenues have shown modest growth in almost every category. Some of the contributing factors are:
o Increases in utility taxes due to an increased rate for City Utilities and increased revenues from outside providers.
o Increase in development revenues for new projects constructing in Poulsbo o Increase in Business License revenue due to moving on the state system which resulted in businesses
complying with the need for a City license o Expenditures not reaching their anticipated levels due to conservatism o Positions remaining vacant for a portion of the year upon employee’s exits
The City maintains the bulk of general reserves in an Assigned Fund Balance which requires a super majority of City Council to approve allocation from the fund balance. • Street Reserves Fund: Accounts for major capital improvements to City streets and transportation projects. The City
continues to be successful in receiving grants for transportation projects. Large projects in 2014 included: o Lincoln Road improvements o Major pavement restoration to three City locations
Both projects were major construction projects supporting traffic and pedestrian safety as well as maintaining the roadway for increased traffic flow. The fund balance will fluctuate based on capital projects in construction and use of City reserves to fund the projects.
• Enterprise Funds: The City’s utilities are accounted for in four enterprise funds: 1) water utility fund; 2) sewer utility fund; 3) solid waste utility fund; and 4) storm drain utility fund. The funds are reported on a full-accrual basis, accounting for all assets and liabilities. Fund balances remained fairly consistent with the prior year, but slightly increased, building stronger fund balances in anticipation of long-term capital projects to maintain a functioning system.
BUDGETARY HIGHLIGHTS
General Fund Budget Analysis: The following is a brief review of the budgeting changes from the adopted to the amended final budget for the General Fund. Please note, budget to actual comparisons start on page 40 for the major current expense and special revenue funds. Budget to Actuals for all other funds begin on page 86. The significant budgetary changes in the General Fund include:
• The final General Fund revenue budget increased by 3.6%, or $343 thousand of the original adopted budget. This was primarily due to increase in grant revenue to fund a county wide transportation plan and a midyear sales tax projection increase in order to fund the related transfers to reserves.
• The final General Fund expenditure budget increased by approximately 2.2%, or $231 thousand. The majority of increase can be attributed to:
o Items such as professional services and small tools carried over from the prior year’s budget to expend in 2014 o Expenditures to support the operation of the historical museum o Expenditures related to the county wide transportation plan funded by a grant o Salary and Wage increases due to retirement leave cashouts
26 2014 COMPREHENSIVE ANNUAL FINANCIAL REPORT
CITY OF POULSBO FINANCIAL SECTION
• The General Fund amended budget anticipated the Fund Balance to increase $70,649. This increase is primarily due to the actual beginning balance being higher than the original projection and increased sales tax revenue projection.
• Copies of the City’s Budget and Budget-in-Brief are available on our website www.cityofpoulsbo.com. The complete budget provides details of the City’s plans for using its resources during the year and may also be obtained by contacting our Finance Director at 360-394-9720 or [email protected].
CASH MANAGEMENT
Aggressive efforts to maximize interest earnings of temporary cash reserves have been as successful as the economy allows. The City contracts with an investment broker for professional recommendations to maintain security and liquidity of the City’s cash in accordance with the City’s certified Investment Policy. The City manages cash accounts by the pooled cash management concept and plans investment maturities to coincide with cash needs. The pool concept provides for investing greater amounts of money at more favorable interest rates, but still maintaining liquidity.
The City has a Financial Management Policy with recommended levels of cash and reserves. These balances are regularly monitored to assure compliance with the requirements of the policy. In order to use the reserves, which are intended for one time not ongoing expenditures, a super majority of City Council must approve the use. Ongoing obligations will be built into future budgets supported by City revenues. Quarterly, the City Council receives and reviews an extensive variance report including cash levels and budgetary compliance, noting items which are less or greater than the recommended variance.
DEBT ADMINISTRATION
The City participates in various forms of debt, which is summarized as follows: $10.6 million of a General Obligation (GO) bond type. There are two types of GO debt; those that are retired by tax levies (Voted GO/Levy) and those that, while secured by the tax base, are actually being retired by revenue from the various sources and funds. The City also has two Public Works Trust Fund loans (PWTF). One is recorded in Governmental Activities with a principal balance of $446,210 and one is recorded in Business-Type Activities with a principal balance of $45,848.
Revenue bonds are retired by means of revenue in the proprietary funds. There is no general tax liability for these obligations. Revenue bond debt in utilities is controlled by bond covenants. The outstanding principal amount is $1,375,000.
The City’s debt obligations are well within the statutory limits for debt capacity. There are three types of statutory limits on general obligation debt capacity:
1. The first limit is on the amount of general obligation debt that can be incurred without a vote of the people. For this type of debt, a city is limited to 1.5% of its assessed value ($1,230,099,929), or $18,451,499;
2. The second statutory limit is the amount of general obligation debt a city may incur for general governmental purposes with a vote of the people. This limit is 2.5% of the assessed value ($1, 230,099,929). For 2014 the City’s limit is $30,752,498 less any amount issued as non-voted debt. At this time the City does not have any voted debt.
3. The third limit is also calculated as a percentage of assessed value. This statutory limit allows a City to incur general obligation debt of up to an additional 2.5% of its assessed value for bond issues approved by the voters for the purpose of utility improvements and an additional 2.5% for parks or open space development.
2014 COMPREHENSIVE ANNUAL FINANCIAL REPORT 27
CITY OF POULSBO FINANCIAL SECTION
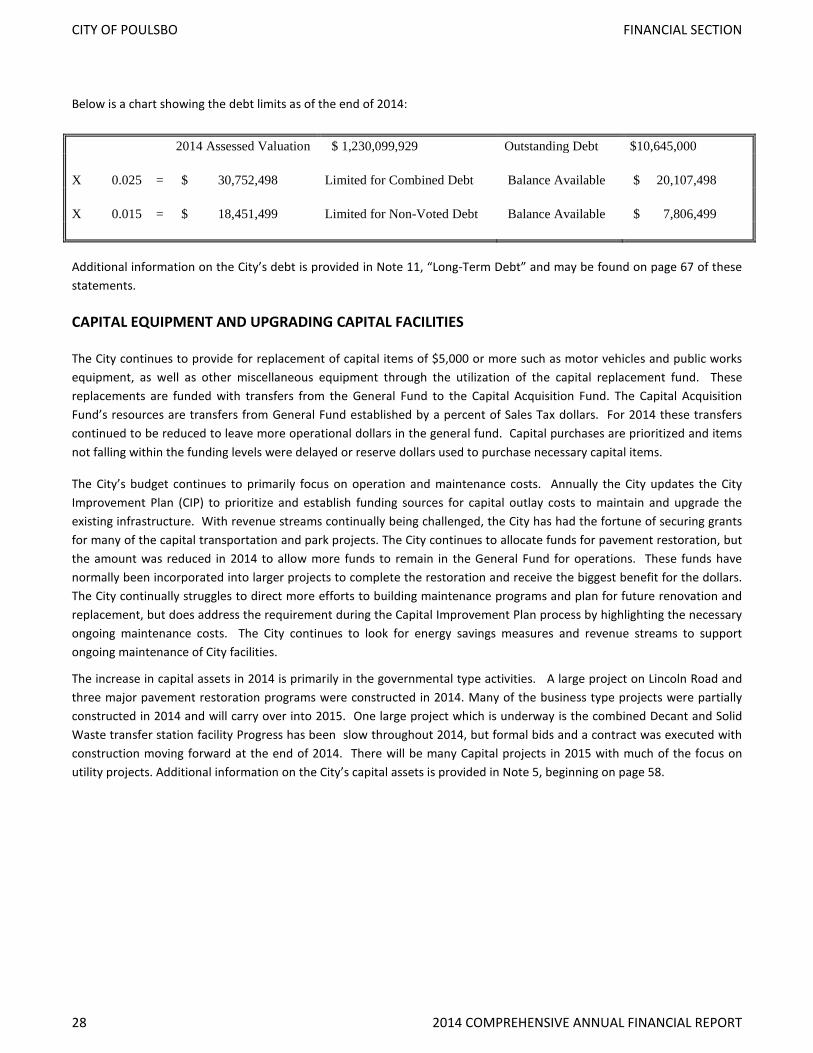
Below is a chart showing the debt limits as of the end of 2014:
Additional information on the City’s debt is provided in Note 11, “Long-Term Debt” and may be found on page 67 of these statements.
CAPITAL EQUIPMENT AND UPGRADING CAPITAL FACILITIES
The City continues to provide for replacement of capital items of $5,000 or more such as motor vehicles and public works equipment, as well as other miscellaneous equipment through the utilization of the capital replacement fund. These replacements are funded with transfers from the General Fund to the Capital Acquisition Fund. The Capital Acquisition Fund’s resources are transfers from General Fund established by a percent of Sales Tax dollars. For 2014 these transfers continued to be reduced to leave more operational dollars in the general fund. Capital purchases are prioritized and items not falling within the funding levels were delayed or reserve dollars used to purchase necessary capital items.
The City’s budget continues to primarily focus on operation and maintenance costs. Annually the City updates the City Improvement Plan (CIP) to prioritize and establish funding sources for capital outlay costs to maintain and upgrade the existing infrastructure. With revenue streams continually being challenged, the City has had the fortune of securing grants for many of the capital transportation and park projects. The City continues to allocate funds for pavement restoration, but the amount was reduced in 2014 to allow more funds to remain in the General Fund for operations. These funds have normally been incorporated into larger projects to complete the restoration and receive the biggest benefit for the dollars. The City continually struggles to direct more efforts to building maintenance programs and plan for future renovation and replacement, but does address the requirement during the Capital Improvement Plan process by highlighting the necessary ongoing maintenance costs. The City continues to look for energy savings measures and revenue streams to support ongoing maintenance of City facilities.
The increase in capital assets in 2014 is primarily in the governmental type activities. A large project on Lincoln Road and three major pavement restoration programs were constructed in 2014. Many of the business type projects were partially constructed in 2014 and will carry over into 2015. One large project which is underway is the combined Decant and Solid Waste transfer station facility Progress has been slow throughout 2014, but formal bids and a contract was executed with construction moving forward at the end of 2014. There will be many Capital projects in 2015 with much of the focus on utility projects. Additional information on the City’s capital assets is provided in Note 5, beginning on page 58.
2014 Assessed Valuation $ 1,230,099,929 Outstanding Debt $10,645,000
X 0.025 = $ 30,752,498 Limited for Combined Debt Balance Available $ 20,107,498
X 0.015 = $ 18,451,499 Limited for Non-Voted Debt Balance Available $ 7,806,499
28 2014 COMPREHENSIVE ANNUAL FINANCIAL REPORT
CITY OF POULSBO FINANCIAL SECTION
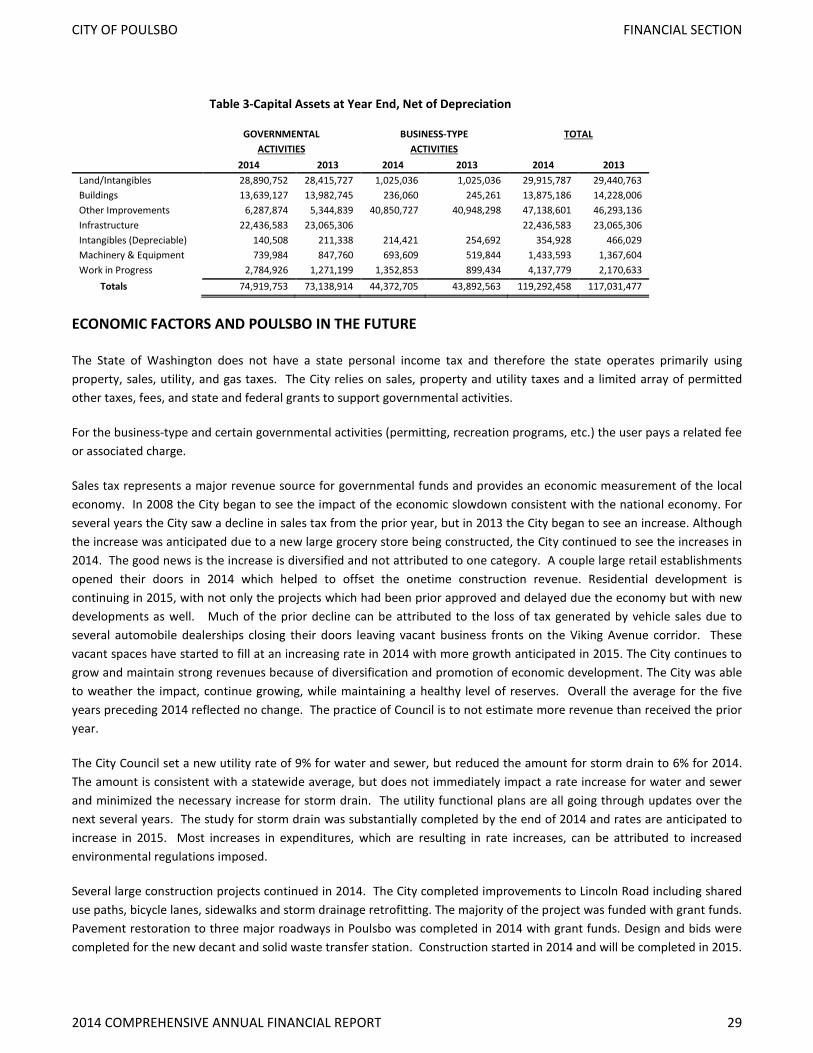
Table 3-Capital Assets at Year End, Net of Depreciation
GOVERNMENTAL BUSINESS-TYPE TOTAL ACTIVITIES ACTIVITIES
2014 2013 2014 2013 2014 2013 Land/Intangibles 28,890,752 28,415,727 1,025,036 1,025,036 29,915,787 29,440,763 Buildings 13,639,127 13,982,745 236,060 245,261 13,875,186 14,228,006 Other Improvements 6,287,874 5,344,839 40,850,727 40,948,298 47,138,601 46,293,136 Infrastructure 22,436,583 23,065,306 22,436,583 23,065,306 Intangibles (Depreciable) 140,508 211,338 214,421 254,692 354,928 466,029 Machinery & Equipment 739,984 847,760 693,609 519,844 1,433,593 1,367,604 Work in Progress 2,784,926 1,271,199 1,352,853 899,434 4,137,779 2,170,633
Totals 74,919,753 73,138,914 44,372,705 43,892,563 119,292,458 117,031,477
ECONOMIC FACTORS AND POULSBO IN THE FUTURE
The State of Washington does not have a state personal income tax and therefore the state operates primarily using property, sales, utility, and gas taxes. The City relies on sales, property and utility taxes and a limited array of permitted other taxes, fees, and state and federal grants to support governmental activities.
For the business-type and certain governmental activities (permitting, recreation programs, etc.) the user pays a related fee or associated charge.
Sales tax represents a major revenue source for governmental funds and provides an economic measurement of the local economy. In 2008 the City began to see the impact of the economic slowdown consistent with the national economy. For several years the City saw a decline in sales tax from the prior year, but in 2013 the City began to see an increase. Although the increase was anticipated due to a new large grocery store being constructed, the City continued to see the increases in 2014. The good news is the increase is diversified and not attributed to one category. A couple large retail establishments opened their doors in 2014 which helped to offset the onetime construction revenue. Residential development is continuing in 2015, with not only the projects which had been prior approved and delayed due the economy but with new developments as well. Much of the prior decline can be attributed to the loss of tax generated by vehicle sales due to several automobile dealerships closing their doors leaving vacant business fronts on the Viking Avenue corridor. These vacant spaces have started to fill at an increasing rate in 2014 with more growth anticipated in 2015. The City continues to grow and maintain strong revenues because of diversification and promotion of economic development. The City was able to weather the impact, continue growing, while maintaining a healthy level of reserves. Overall the average for the five years preceding 2014 reflected no change. The practice of Council is to not estimate more revenue than received the prior year.
The City Council set a new utility rate of 9% for water and sewer, but reduced the amount for storm drain to 6% for 2014. The amount is consistent with a statewide average, but does not immediately impact a rate increase for water and sewer and minimized the necessary increase for storm drain. The utility functional plans are all going through updates over the next several years. The study for storm drain was substantially completed by the end of 2014 and rates are anticipated to increase in 2015. Most increases in expenditures, which are resulting in rate increases, can be attributed to increased environmental regulations imposed.
Several large construction projects continued in 2014. The City completed improvements to Lincoln Road including shared use paths, bicycle lanes, sidewalks and storm drainage retrofitting. The majority of the project was funded with grant funds. Pavement restoration to three major roadways in Poulsbo was completed in 2014 with grant funds. Design and bids were completed for the new decant and solid waste transfer station. Construction started in 2014 and will be completed in 2015.
2014 COMPREHENSIVE ANNUAL FINANCIAL REPORT 29
CITY OF POULSBO FINANCIAL SECTION

This is the first phase for the City’s planned new Public Works facility to be located on the west side of Poulsbo at the north end of Viking Avenue.
The City’s estimated population in 2015 has grown by 190 people or 1.9% as reported by the Office of Financial Management (OFM). The daytime population is much higher and will continue to grow as Poulsbo becomes a destination for many county residents to shop, obtain medical treatments and send students to school for all grade levels including Community College. This continues to be a challenge to allow for utilities to provide services in peak hours. The City has established an agreement with the Kitsap Public Utility District (KPUD) to provide water services in a new development which is adjacent to their service area and also the ability to purchase water if needed. At this point it has not been necessary for the City to purchase additional water, but some of the new developments in the City’s formally annexed area will be serviced by the KPUD for water services. This will continue to allow development but not tax the City’s water system for fire protection and peak hours. The City will provide sewer, garbage and storm drain service and receive utility tax for all of these services.
In early 2015 the functional plan for Storm Drain and Water were completed and new rates were updated per the plans. Water rate increases were minimal with the exception of connection fees which were much lower than comparable cities. Storm Drain rates were increased almost 40% due to the growing expenditures related to new regulatory environmental laws for reporting and monitoring the system. Also impacting the fund was allocation of street expenditures directly related to the function of storm drain, but had been funded with governmental funds.
Washington continues to be a state impacted by tax limiting initiatives and a struggling state budget. The City receives funds related to liquor sales in two different distributions. The first is liquor profits and the second is liquor excise tax. Both are distributed as a state shared revenue based on population. An initiative passed in 2011 which called for state operated liquor stores to be closed and the ability for retail establishments to apply for a license to sell liquor from their establishment. The initiative eliminated state shared liquor profits but called for local entities to be funded at the same levels which are to be supplemented by the licensing and permitting fees. The state reduced the shared excise taxes, and has brought back a small amount to localities, but at a much larger reduced level. As the biennial state budget is being debated at the state capital it is again proposed to reduce amounts distributed to cities. Representatives on behalf of cities are continuing to lobby for local funds to be maintained to support the increased enforcement necessary to regulate. The funds distributed to Poulsbo are not substantial, so although it is an impact, it is slight.
The Mayor and City Council continues to be proactive with other agencies to monitor and lobby for regulations to minimize the impact to the City and provide funds for City services. The City continues to support a possible street utility to provide funding to maintain streets and pay for growing electricity charges related to street lights. The City will continue to work with surrounding agencies for sharing of service opportunities and minimize expenses.
An allowable fee the City may be able to implement through councilmatic action or a larger amount by the voters is for Transportation Benefit District Fees. The fees must be used for transportation expenditures clearly defined when implementing. The Council continues to discuss this option and in the 2015 budget process directed staff to develop the transportation plan and documents necessary to approve by Council action a $20 car tab fee. Once passed the fee cannot be collected for 6 months. Two surrounding Cities within Kitsap County have implemented the fee.
The City Council approved a 6% Cable Utility tax to be implemented in 2015. This will be receipted into the governmental funds and is anticipated to support transportation maintenance and capital improvements which has continually been reduced with the decline in tax revenue experiences over the past several years.
A large change for the State of Washington, contradictory to federal laws, passed by voters is the legalization of marijuana,
30 2014 COMPREHENSIVE ANNUAL FINANCIAL REPORT
CITY OF POULSBO FINANCIAL SECTION
not only for medicinal but recreational use. A state excise tax and license fees will be imposed on retailers. All of these funds will remain at the state level and will not be distributed back to Cities and Counties. Sales will also be subject to retail sales tax and distributed back to the local agencies in their sales tax distributions. It is being proposed at the state legislature to share a portion of the proceeds with localities that have these establishments in their jurisdiction. At this time there are no existing businesses located in the City of Poulsbo, and formal council action was passed to not allow any of these establishments to operate within the City limits. The local Olympic Community College has partnered with Western Washington University to offer four year programs allowing citizens the option for an affordable and local degree program. The City Council is working collaboratively with local organizations to market and emphasize this asset bringing more citizens and businesses to our local area. The level of taxes, fees and charges for services (including development related mitigation fees) will have a bearing on the City’s competitive ability to encourage retail, office, residential, and industrial development to locate in their jurisdiction. The City places significant emphasis on encouraging economic development to attract family wage paying jobs, and as an incentive does not assess a business and occupation tax.
Request for Financial Information
This financial report is designed to provide our citizens, taxpayers, creditors and investors with a general overview of the City’s finances and to show the City’s accountability for the monies it receives. Any questions about this report or requests for additional financial information should be addressed to the Finance Department, City of Poulsbo, 200 NE Moe Street, Poulsbo, Washington, 98370. Personal inquiries may be directed to Jana McQuade, Accounting Manager at (360) 394-9721, [email protected] or Deborah Booher, Finance Director at (360) 394-9720, [email protected].
2014 COMPREHENSIVE ANNUAL FINANCIAL REPORT 31
CITY OF POULSBO FINANCIAL SECTION

32 2014 COMPREHENSIVE ANNUAL FINANCIAL REPORT
CITY OF POULSBO FINANCIAL SECTION
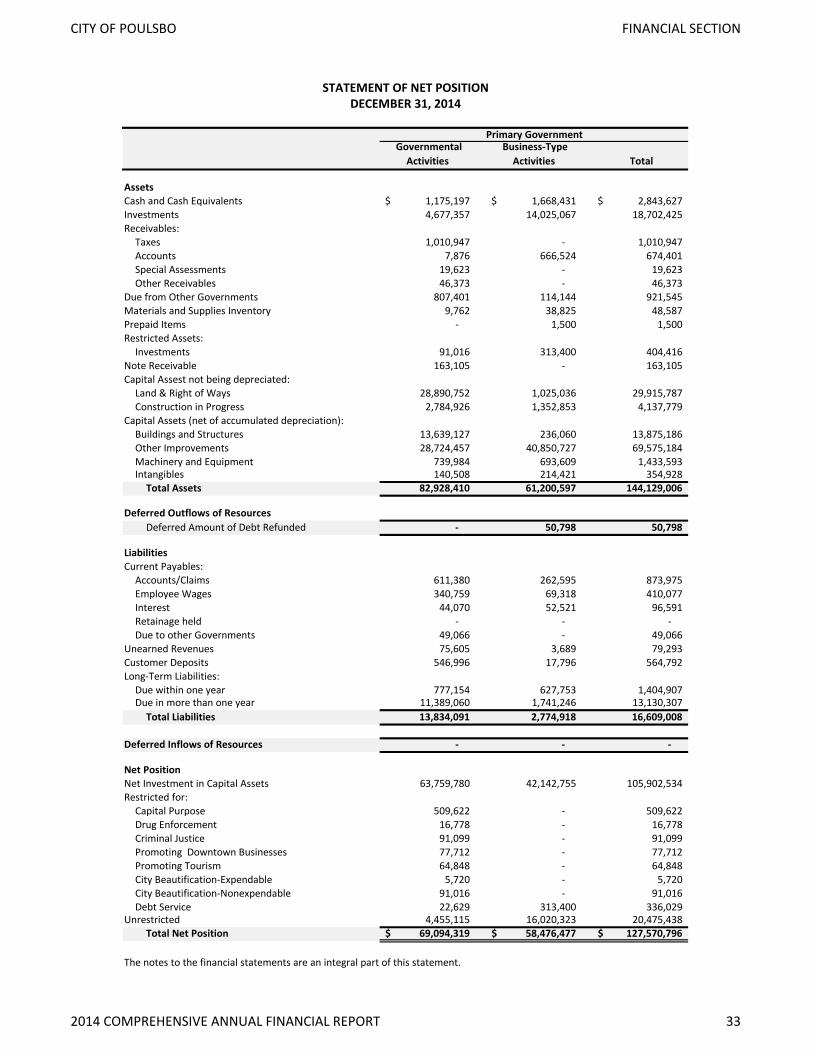
Governmental Activities
Business-Type Activities Total
AssetsCash and Cash Equivalents 1,175,197$ 1,668,431$ 2,843,627$ Investments 4,677,357 14,025,067 18,702,425 Receivables:
Taxes 1,010,947 - 1,010,947 Accounts 7,876 666,524 674,401 Special Assessments 19,623 - 19,623 Other Receivables 46,373 - 46,373
Due from Other Governments 807,401 114,144 921,545 Materials and Supplies Inventory 9,762 38,825 48,587 Prepaid Items - 1,500 1,500 Restricted Assets:
Investments 91,016 313,400 404,416 Note Receivable 163,105 - 163,105 Capital Assest not being depreciated:
Land & Right of Ways 28,890,752 1,025,036 29,915,787 Construction in Progress 2,784,926 1,352,853 4,137,779
Capital Assets (net of accumulated depreciation):Buildings and Structures 13,639,127 236,060 13,875,186 Other Improvements 28,724,457 40,850,727 69,575,184 Machinery and Equipment 739,984 693,609 1,433,593 Intangibles 140,508 214,421 354,928
Total Assets 82,928,410 61,200,597 144,129,006
Deferred Outflows of ResourcesDeferred Amount of Debt Refunded - 50,798 50,798
LiabilitiesCurrent Payables:
Accounts/Claims 611,380 262,595 873,975 Employee Wages 340,759 69,318 410,077 Interest 44,070 52,521 96,591 Retainage held - - - Due to other Governments 49,066 - 49,066
Unearned Revenues 75,605 3,689 79,293 Customer Deposits 546,996 17,796 564,792 Long-Term Liabilities:
Due within one year 777,154 627,753 1,404,907 Due in more than one year 11,389,060 1,741,246 13,130,307
Total Liabilities 13,834,091 2,774,918 16,609,008
Deferred Inflows of Resources - - -
Net PositionNet Investment in Capital Assets 63,759,780 42,142,755 105,902,534 Restricted for:
Capital Purpose 509,622 - 509,622 Drug Enforcement 16,778 - 16,778 Criminal Justice 91,099 - 91,099 Promoting Downtown Businesses 77,712 - 77,712 Promoting Tourism 64,848 - 64,848 City Beautification-Expendable 5,720 - 5,720 City Beautification-Nonexpendable 91,016 - 91,016 Debt Service 22,629 313,400 336,029
Unrestricted 4,455,115 16,020,323 20,475,438 Total Net Position 69,094,319$ 58,476,477$ 127,570,796$
The notes to the financial statements are an integral part of this statement.
Primary Government
STATEMENT OF NET POSITIONDECEMBER 31, 2014
2014 COMPREHENSIVE ANNUAL FINANCIAL REPORT 33
CITY OF POULSBO FINANCIAL SECTION
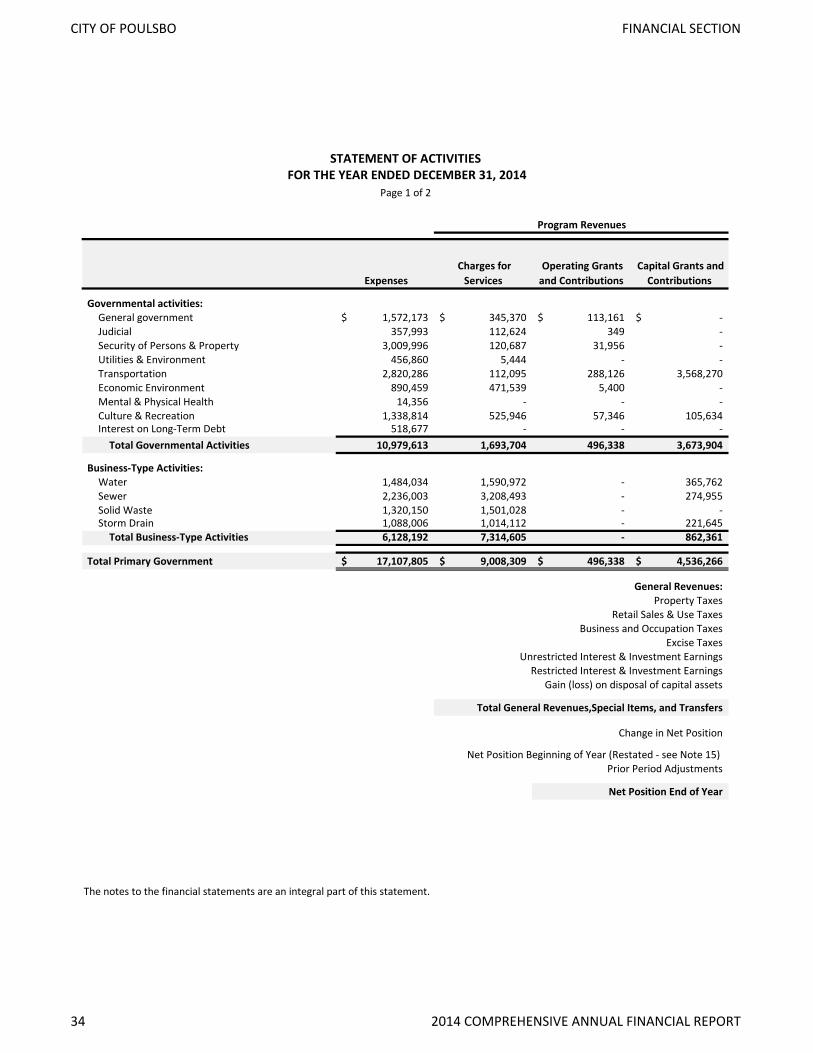
Governmental activities:General government 1,572,173$ 345,370$ 113,161$ -$ Judicial 357,993 112,624 349 - Security of Persons & Property 3,009,996 120,687 31,956 - Utilities & Environment 456,860 5,444 - - Transportation 2,820,286 112,095 288,126 3,568,270 Economic Environment 890,459 471,539 5,400 - Mental & Physical Health 14,356 - - - Culture & Recreation 1,338,814 525,946 57,346 105,634 Interest on Long-Term Debt 518,677 - - -
Total Governmental Activities 10,979,613 1,693,704 496,338 3,673,904
Business-Type Activities:Water 1,484,034 1,590,972 - 365,762 Sewer 2,236,003 3,208,493 - 274,955 Solid Waste 1,320,150 1,501,028 - - Storm Drain 1,088,006 1,014,112 - 221,645
Total Business-Type Activities 6,128,192 7,314,605 - 862,361
Total Primary Government 17,107,805$ 9,008,309$ 496,338$ 4,536,266$
General Revenues: Property Taxes
Retail Sales & Use Taxes Business and Occupation Taxes
Excise Taxes Unrestricted Interest & Investment Earnings
Restricted Interest & Investment Earnings Gain (loss) on disposal of capital assets
Total General Revenues,Special Items, and Transfers
Change in Net Position
Net Position Beginning of Year (Restated - see Note 15) Prior Period Adjustments
Net Position End of Year
The notes to the financial statements are an integral part of this statement.
STATEMENT OF ACTIVITIES FOR THE YEAR ENDED DECEMBER 31, 2014
Page 1 of 2
Expenses
Program Revenues
Operating Grants and Contributions
Capital Grants and Contributions
Charges for Services
34 2014 COMPREHENSIVE ANNUAL FINANCIAL REPORT
CITY OF POULSBO FINANCIAL SECTION
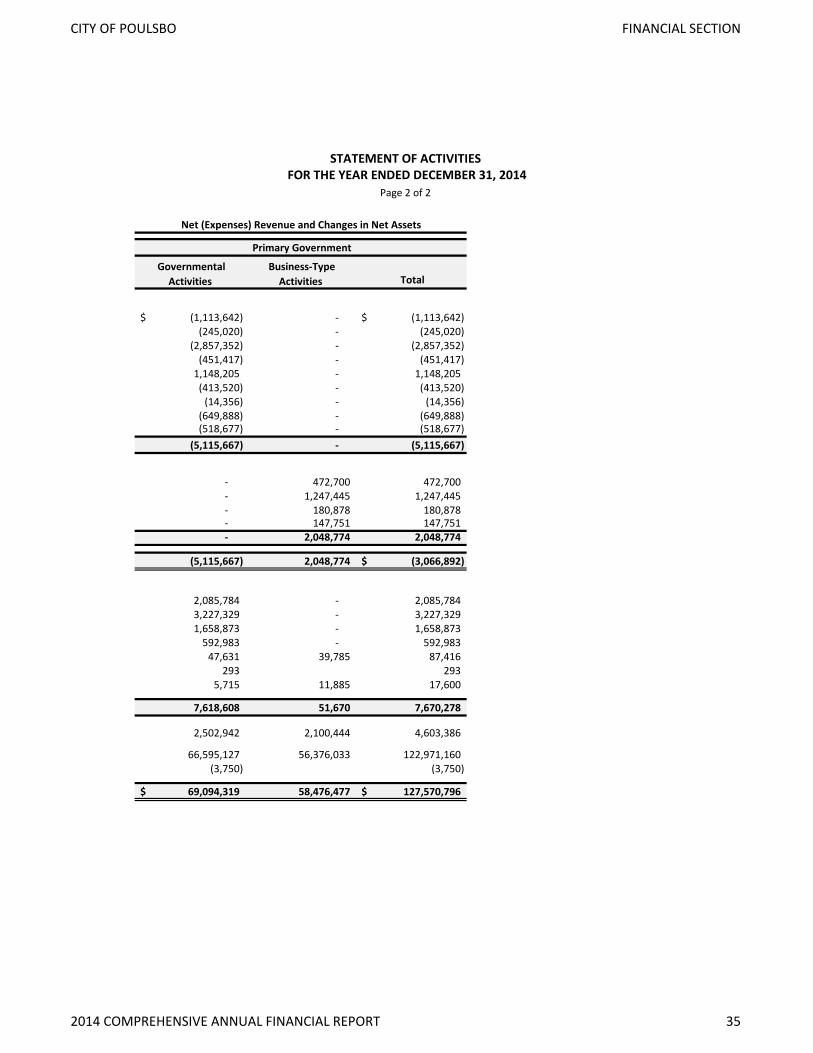
Total
(1,113,642)$ - (1,113,642)$ (245,020) - (245,020)
(2,857,352) - (2,857,352) (451,417) - (451,417)
1,148,205 - 1,148,205 (413,520) - (413,520)
(14,356) - (14,356) (649,888) - (649,888) (518,677) - (518,677)
(5,115,667) - (5,115,667)
- 472,700 472,700 - 1,247,445 1,247,445 - 180,878 180,878 - 147,751 147,751 - 2,048,774 2,048,774
(5,115,667) 2,048,774 (3,066,892)$
2,085,784 - 2,085,784 3,227,329 - 3,227,329
1,658,873 - 1,658,873 592,983 - 592,983
47,631 39,785 87,416 293 293
5,715 11,885 17,600
7,618,608 51,670 7,670,278
2,502,942 2,100,444 4,603,386
66,595,127 56,376,033 122,971,160 (3,750) (3,750)
69,094,319$ 58,476,477 127,570,796$
STATEMENT OF ACTIVITIES FOR THE YEAR ENDED DECEMBER 31, 2014
Page 2 of 2
Net (Expenses) Revenue and Changes in Net Assets
Governmental Activities
Business-Type Activities
Primary Government
2014 COMPREHENSIVE ANNUAL FINANCIAL REPORT 35
CITY OF POULSBO FINANCIAL SECTION

General Fund
Street Reserve Fund
Non-Major Governmental
Funds
Total Governmental
Funds
AssetsCash and Cash Equivalents 194,752$ 330,537$ 649,908$ 1,175,197$ Investments 3,006,698 - 1,670,659 4,677,357 Receivables:
Taxes 12,198 - 28,927 41,126 Accounts 7,209 - 668 7,876 Special Assessments - - 19,623 19,623
Due from other govern units 12,152 748,888 46,360 807,401 Inventories 9,762 - - 9,762 Cash and Investments-Restricted - - 91,016 91,016
Total Assets 3,242,772 1,079,425 2,507,160 6,829,357
Deferred Outflows of Resources - - - -
Liabilities and Fund BalancesLiabilitiesAccounts Payable 97,488 457,434 56,458 611,380 Payroll Payable 319,806 3,872 17,081 340,759 Due to Other Governments 49,066 - - 49,066 Unearned Revenues 4,534 - 12,347 16,881 Revenues Collected in Advance 58,724 - - 58,724 Custodial Accounts 537,778 - 9,218 546,996
Total Liabilities 1,067,397 461,306 95,104 1,623,806
Deferred Inflows of Resources - - - -
Fund Balances:Nonspendable fund balance 12,412 - 91,016 103,428 Restricted fund balance - - 773,736 773,736 Assigned fund balance 1,501,759 618,120 1,547,305 3,667,183 Unassigned fund balance 661,204 - - 661,204
Total Fund Balances 2,175,375 618,120 2,412,057 5,205,551
Total Liabilities, Deferred Inflows of Resources and Fund Balances
3,242,772$ 1,079,425$ 2,507,160$ 6,829,357$
The notes to the financial statements are an integral part of this statement.
BALANCE SHEET-GOVERNMENTAL FUNDSFOR THE YEAR ENDED DECEMBER 31, 2014
36 2014 COMPREHENSIVE ANNUAL FINANCIAL REPORT
CITY OF POULSBO FINANCIAL SECTION

Total Governmental Fund Balances: 5,205,551$
Capital assets used in governmental activities are not financial resourcesand therefore are not reported in the governmental funds. 74,919,753 These assets consist of:
Land 28,890,752$ Buildings and structures 17,118,430 Improvements 41,290,430 Machinery and Equipment 3,013,240 Construction in Progress 2,784,926
Intangibles 647,486 Less: Accumulated Depreciation (18,825,511)
1,179,299
Interest Payable 44,070 Long-term Liabilities 12,166,215 (12,210,285)
Net Position of governmental activities 69,094,319$
The notes to the financial statements are an integral part of this statement.
Long-term liabilities, including bonds payable are not due and payable in the current period and therefore are not reported in the governmental funds.
Amounts reported for governmental activities in the statement of net position are different because:
RECONCILIATION OF TOTAL GOVERNMENTAL FUND BALANCES TONET POSITION OF GOVERNMENTAL ACTIVITIES
FOR THE YEAR ENDED DECEMBER 31, 2014
Other Assets that are not available to pay for current-period expenditures and therefore are not reported in governmental funds.
2014 COMPREHENSIVE ANNUAL FINANCIAL REPORT 37
CITY OF POULSBO FINANCIAL SECTION

General Fund
Street Reserve Fund
Non-Major Governmental
Funds Total
RevenuesTaxes 6,929,422$ -$ 580,248$ 7,509,669$ Licenses and Permits 541,433 - 16,680 558,113 Intergovernmental 207,686 2,752,065 424,948 3,384,699 Charges for Services 2,071,043 - 157,897 2,228,941 Fines and Forfeitures 83,029 - 209 83,238 Interest and Other Earnings 49,330 129 2,896 52,355 Miscellaneous 95,569 - 60,989 156,557
Total Revenues 9,977,512 2,752,194 1,243,866 13,973,573
ExpendituresCurrent:
General Government 2,704,029 - - 2,704,029 Security of Persons & Property 2,805,702 - 41,426 2,847,128 Utilities and Environment 443,940 - - 443,940 Transportation 535,520 - 1,024,174 1,559,694 Economic Environment 774,401 - 111,986 886,387 Mental and Physical Health 14,356 - - 14,356 Culture and Recreation 1,039,993 - 57,584 1,097,577
Debt Service:Principal - - 589,368 589,368 Interest & Fiscal Charges - - 479,814 479,814
Capital Outlay - 2,964,835 231,756 3,196,591 Total Expenditures 8,317,941 2,964,835 2,536,109 13,818,885
Excess of Revenues Over (Under) Expenditures 1,659,572 (212,641) (1,292,243) 154,688
Other Financing Sources (Uses)Transfers In 21,246 558,465 2,056,276 2,635,988 Transfers Out (1,662,986) (24,535) (948,467) (2,635,988) Sale of Capital Assets 5,715 - - 5,715 Compensation for Impairment of Capital Assets 1,506 - 6,022 7,528 Insurance Recoveries 613 - - 613
Total Other Financing Sources and Uses (1,633,906) 533,930 1,113,832 13,856
Net Change in Fund Balances 25,666 321,290 (178,412) 168,544
Fund Balances Beginning of Year (Restated-See Note 15) 2,057,143 296,830 2,686,783 5,040,757 Prior Year Adjustment 92,565 - (96,315) (3,750) Fund Balances End of Year 2,175,375$ 618,120$ 2,412,057$ 5,205,551$
The notes to the financial statements are an integral part of this statement.
FOR THE YEAR ENDED DECEMBER 31, 2014
STATEMENT OF REVENUES, EXPENDITURES, AND CHANGES IN FUND BALANCESGOVERNMENTAL FUNDS
38 2014 COMPREHENSIVE ANNUAL FINANCIAL REPORT
CITY OF POULSBO FINANCIAL SECTION
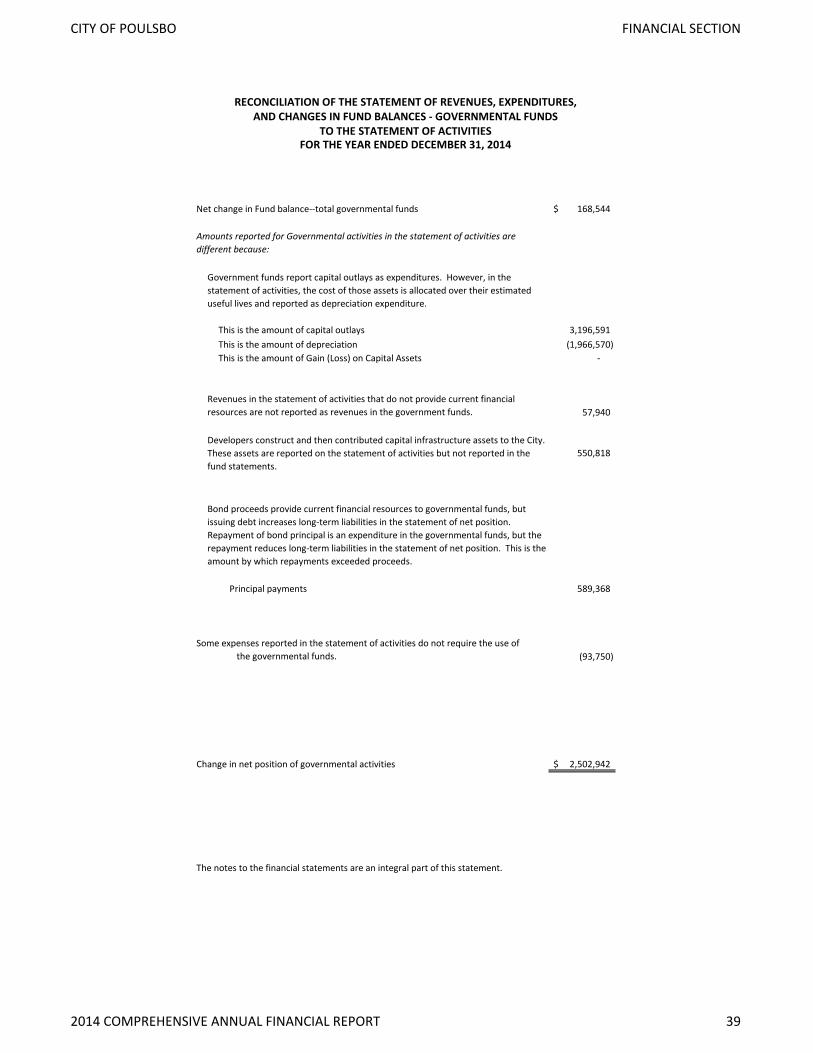
Net change in Fund balance--total governmental funds 168,544$
This is the amount of capital outlays 3,196,591 This is the amount of depreciation (1,966,570) This is the amount of Gain (Loss) on Capital Assets -
57,940
550,818
Principal payments 589,368
(93,750)
Change in net position of governmental activities 2,502,942$
The notes to the financial statements are an integral part of this statement.
Some expenses reported in the statement of activities do not require the use of the governmental funds.
FOR THE YEAR ENDED DECEMBER 31, 2014
RECONCILIATION OF THE STATEMENT OF REVENUES, EXPENDITURES,AND CHANGES IN FUND BALANCES - GOVERNMENTAL FUNDS
TO THE STATEMENT OF ACTIVITIES
Amounts reported for Governmental activities in the statement of activities are different because:
Government funds report capital outlays as expenditures. However, in the statement of activities, the cost of those assets is allocated over their estimated useful lives and reported as depreciation expenditure.
Revenues in the statement of activities that do not provide current financial resources are not reported as revenues in the government funds.
Developers construct and then contributed capital infrastructure assets to the City. These assets are reported on the statement of activities but not reported in the fund statements.
Bond proceeds provide current financial resources to governmental funds, but issuing debt increases long-term liabilities in the statement of net position. Repayment of bond principal is an expenditure in the governmental funds, but the repayment reduces long-term liabilities in the statement of net position. This is the amount by which repayments exceeded proceeds.
2014 COMPREHENSIVE ANNUAL FINANCIAL REPORT 39
CITY OF POULSBO FINANCIAL SECTION
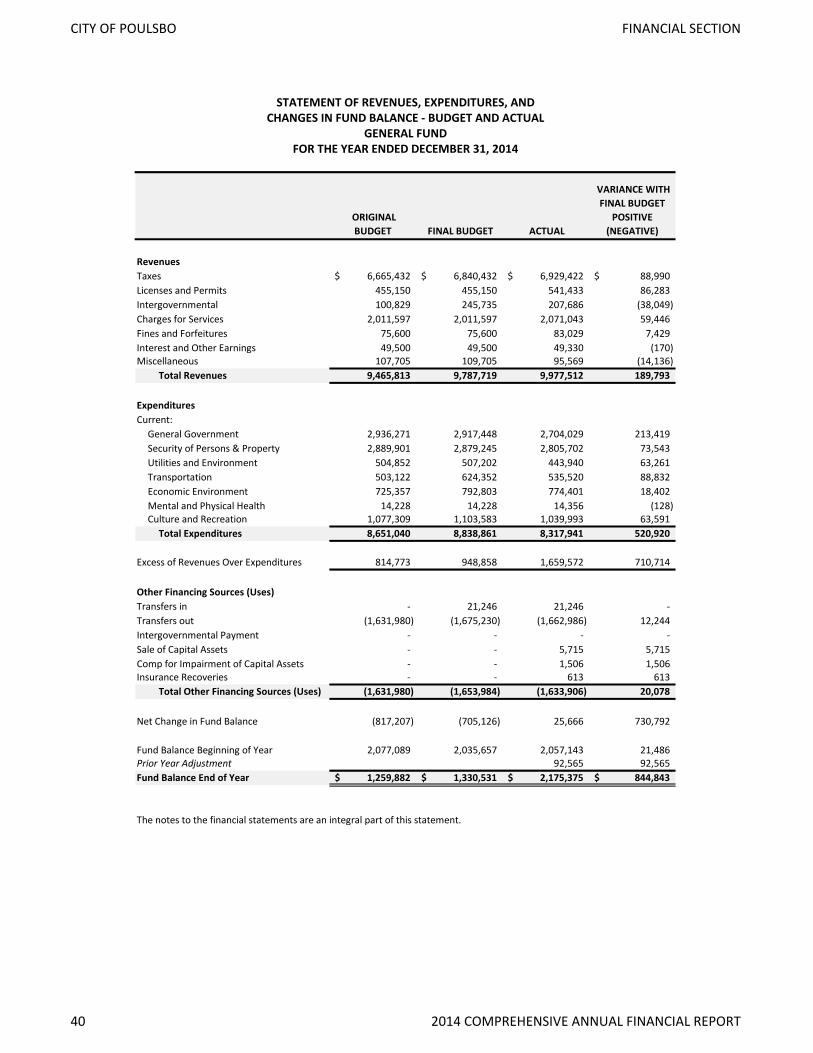
ORIGINAL BUDGET FINAL BUDGET ACTUAL
VARIANCE WITH FINAL BUDGET
POSITIVE (NEGATIVE)
RevenuesTaxes 6,665,432$ 6,840,432$ 6,929,422$ 88,990$ Licenses and Permits 455,150 455,150 541,433 86,283 Intergovernmental 100,829 245,735 207,686 (38,049) Charges for Services 2,011,597 2,011,597 2,071,043 59,446 Fines and Forfeitures 75,600 75,600 83,029 7,429 Interest and Other Earnings 49,500 49,500 49,330 (170) Miscellaneous 107,705 109,705 95,569 (14,136)
Total Revenues 9,465,813 9,787,719 9,977,512 189,793 ExpendituresCurrent:
General Government 2,936,271 2,917,448 2,704,029 213,419 Security of Persons & Property 2,889,901 2,879,245 2,805,702 73,543 Utilities and Environment 504,852 507,202 443,940 63,261 Transportation 503,122 624,352 535,520 88,832 Economic Environment 725,357 792,803 774,401 18,402 Mental and Physical Health 14,228 14,228 14,356 (128) Culture and Recreation 1,077,309 1,103,583 1,039,993 63,591
Total Expenditures 8,651,040 8,838,861 8,317,941 520,920
Excess of Revenues Over Expenditures 814,773 948,858 1,659,572 710,714
Other Financing Sources (Uses)Transfers in - 21,246 21,246 - Transfers out (1,631,980) (1,675,230) (1,662,986) 12,244 Intergovernmental Payment - - - - Sale of Capital Assets - - 5,715 5,715 Comp for Impairment of Capital Assets - - 1,506 1,506 Insurance Recoveries - - 613 613
Total Other Financing Sources (Uses) (1,631,980) (1,653,984) (1,633,906) 20,078
Net Change in Fund Balance (817,207) (705,126) 25,666 730,792
Fund Balance Beginning of Year 2,077,089 2,035,657 2,057,143 21,486 Prior Year Adjustment 92,565 92,565 Fund Balance End of Year 1,259,882$ 1,330,531$ 2,175,375$ 844,843$
The notes to the financial statements are an integral part of this statement.
STATEMENT OF REVENUES, EXPENDITURES, ANDCHANGES IN FUND BALANCE - BUDGET AND ACTUAL
GENERAL FUNDFOR THE YEAR ENDED DECEMBER 31, 2014
40 2014 COMPREHENSIVE ANNUAL FINANCIAL REPORT
CITY OF POULSBO FINANCIAL SECTION

.
2014 COMPREHENSIVE ANNUAL FINANCIAL REPORT 41
CITY OF POULSBO FINANCIAL SECTION
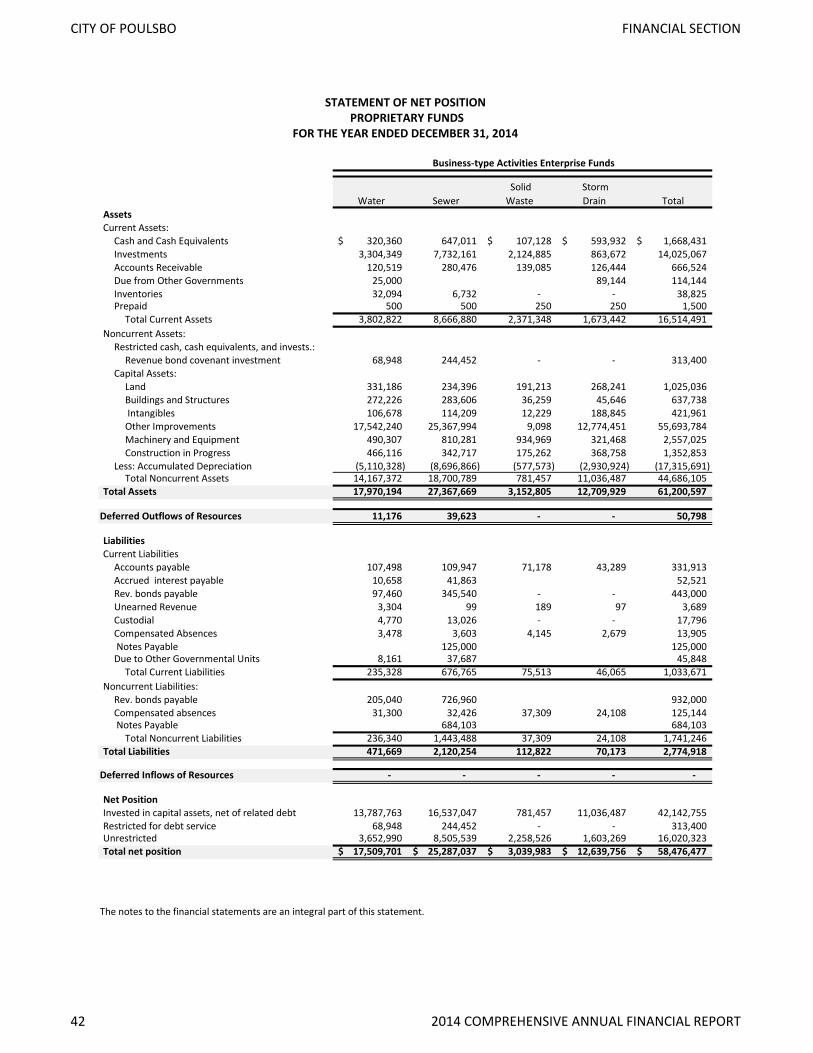
AssetsCurrent Assets:
Cash and Cash Equivalents 320,360$ 647,011 107,128$ 593,932$ 1,668,431$ Investments 3,304,349 7,732,161 2,124,885 863,672 14,025,067 Accounts Receivable 120,519 280,476 139,085 126,444 666,524 Due from Other Governments 25,000 89,144 114,144 Inventories 32,094 6,732 - - 38,825 Prepaid 500 500 250 250 1,500
Total Current Assets 3,802,822 8,666,880 2,371,348 1,673,442 16,514,491 Noncurrent Assets:
Restricted cash, cash equivalents, and invests.:Revenue bond covenant investment 68,948 244,452 - - 313,400
Capital Assets:Land 331,186 234,396 191,213 268,241 1,025,036 Buildings and Structures 272,226 283,606 36,259 45,646 637,738 Intangibles 106,678 114,209 12,229 188,845 421,961 Other Improvements 17,542,240 25,367,994 9,098 12,774,451 55,693,784 Machinery and Equipment 490,307 810,281 934,969 321,468 2,557,025 Construction in Progress 466,116 342,717 175,262 368,758 1,352,853
Less: Accumulated Depreciation (5,110,328) (8,696,866) (577,573) (2,930,924) (17,315,691) Total Noncurrent Assets 14,167,372 18,700,789 781,457 11,036,487 44,686,105
Total Assets 17,970,194 27,367,669 3,152,805 12,709,929 61,200,597
Deferred Outflows of Resources 11,176 39,623 - - 50,798
LiabilitiesCurrent Liabilities
Accounts payable 107,498 109,947 71,178 43,289 331,913 Accrued interest payable 10,658 41,863 52,521 Rev. bonds payable 97,460 345,540 - - 443,000 Unearned Revenue 3,304 99 189 97 3,689 Custodial 4,770 13,026 - - 17,796 Compensated Absences 3,478 3,603 4,145 2,679 13,905 Notes Payable 125,000 125,000 Due to Other Governmental Units 8,161 37,687 45,848
Total Current Liabilities 235,328 676,765 75,513 46,065 1,033,671 Noncurrent Liabilities:
Rev. bonds payable 205,040 726,960 932,000 Compensated absences 31,300 32,426 37,309 24,108 125,144 Notes Payable 684,103 684,103
Total Noncurrent Liabilities 236,340 1,443,488 37,309 24,108 1,741,246 Total Liabilities 471,669 2,120,254 112,822 70,173 2,774,918
Deferred Inflows of Resources - - - - -
Net PositionInvested in capital assets, net of related debt 13,787,763 16,537,047 781,457 11,036,487 42,142,755 Restricted for debt service 68,948 244,452 - - 313,400 Unrestricted 3,652,990 8,505,539 2,258,526 1,603,269 16,020,323 Total net position 17,509,701$ 25,287,037$ 3,039,983$ 12,639,756$ 58,476,477$
The notes to the financial statements are an integral part of this statement.
STATEMENT OF NET POSITION
Water Solid Waste
Storm Drain Sewer
FOR THE YEAR ENDED DECEMBER 31, 2014
Total
Business-type Activities Enterprise Funds
PROPRIETARY FUNDS
CITY OF POULSBO FINANCIAL SECTION
42 2014 COMPREHENSIVE ANNUAL FINANCIAL REPORT
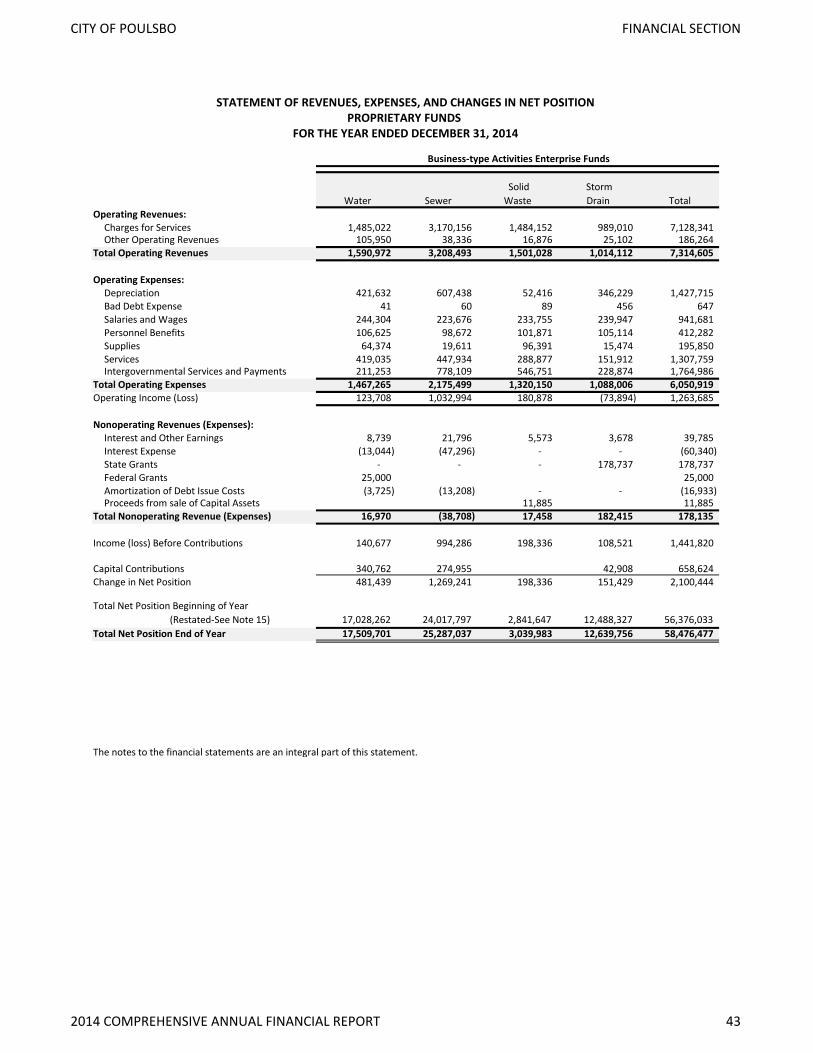
Operating Revenues:Charges for Services 1,485,022 3,170,156 1,484,152 989,010 7,128,341 Other Operating Revenues 105,950 38,336 16,876 25,102 186,264
Total Operating Revenues 1,590,972 3,208,493 1,501,028 1,014,112 7,314,605
Operating Expenses:Depreciation 421,632 607,438 52,416 346,229 1,427,715 Bad Debt Expense 41 60 89 456 647 Salaries and Wages 244,304 223,676 233,755 239,947 941,681 Personnel Benefits 106,625 98,672 101,871 105,114 412,282 Supplies 64,374 19,611 96,391 15,474 195,850 Services 419,035 447,934 288,877 151,912 1,307,759 Intergovernmental Services and Payments 211,253 778,109 546,751 228,874 1,764,986
Total Operating Expenses 1,467,265 2,175,499 1,320,150 1,088,006 6,050,919 Operating Income (Loss) 123,708 1,032,994 180,878 (73,894) 1,263,685
Nonoperating Revenues (Expenses):Interest and Other Earnings 8,739 21,796 5,573 3,678 39,785 Interest Expense (13,044) (47,296) - - (60,340) State Grants - - - 178,737 178,737 Federal Grants 25,000 25,000 Amortization of Debt Issue Costs (3,725) (13,208) - - (16,933) Proceeds from sale of Capital Assets 11,885 11,885
Total Nonoperating Revenue (Expenses) 16,970 (38,708) 17,458 182,415 178,135
Income (loss) Before Contributions 140,677 994,286 198,336 108,521 1,441,820
Capital Contributions 340,762 274,955 42,908 658,624 Change in Net Position 481,439 1,269,241 198,336 151,429 2,100,444
Total Net Position Beginning of Year (Restated-See Note 15) 17,028,262 24,017,797 2,841,647 12,488,327 56,376,033 Total Net Position End of Year 17,509,701 25,287,037 3,039,983 12,639,756 58,476,477
The notes to the financial statements are an integral part of this statement.
STATEMENT OF REVENUES, EXPENSES, AND CHANGES IN NET POSITIONPROPRIETARY FUNDS
FOR THE YEAR ENDED DECEMBER 31, 2014
Sewer Solid Waste
Business-type Activities Enterprise Funds
Water StormDrain Total
CITY OF POULSBO FINANCIAL SECTION
2014 COMPREHENSIVE ANNUAL FINANCIAL REPORT 43
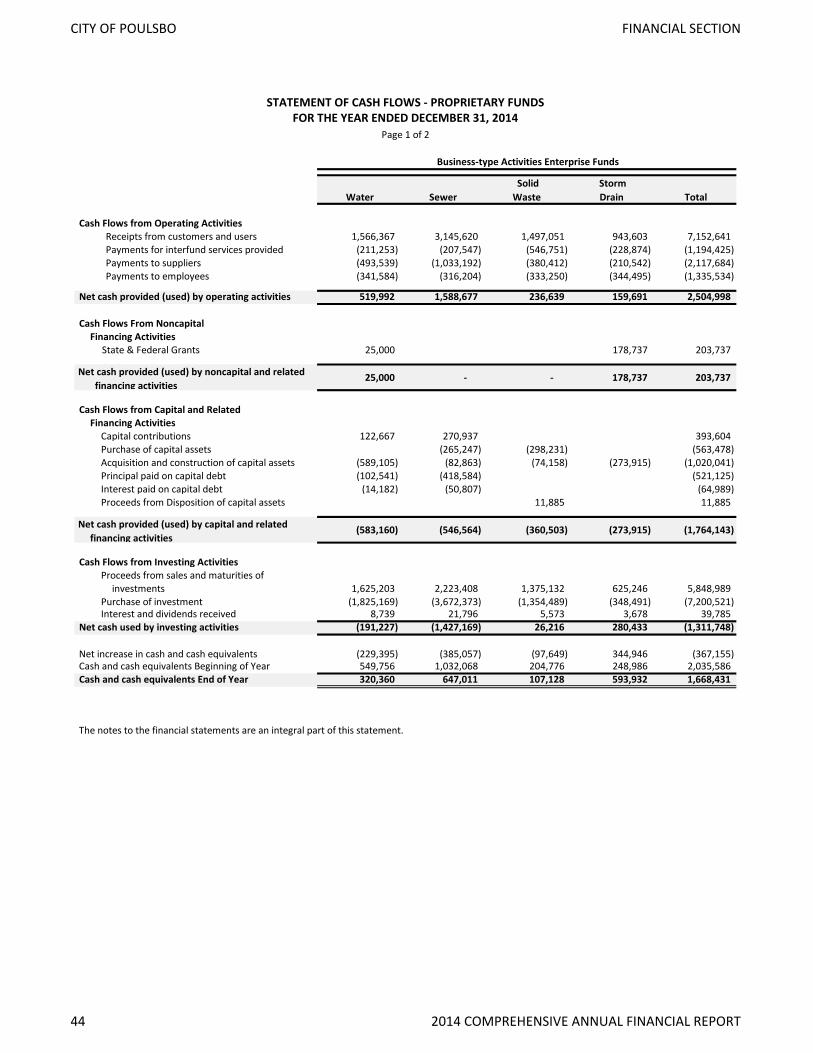
Cash Flows from Operating Activities Receipts from customers and users 1,566,367 3,145,620 1,497,051 943,603 7,152,641 Payments for interfund services provided (211,253) (207,547) (546,751) (228,874) (1,194,425) Payments to suppliers (493,539) (1,033,192) (380,412) (210,542) (2,117,684) Payments to employees (341,584) (316,204) (333,250) (344,495) (1,335,534)
Net cash provided (used) by operating activities 519,992 1,588,677 236,639 159,691 2,504,998
Cash Flows From NoncapitalFinancing Activities State & Federal Grants 25,000 178,737 203,737
Net cash provided (used) by noncapital and related financing activities
25,000 - - 178,737 203,737
Cash Flows from Capital and RelatedFinancing Activities
Capital contributions 122,667 270,937 393,604 Purchase of capital assets (265,247) (298,231) (563,478) Acquisition and construction of capital assets (589,105) (82,863) (74,158) (273,915) (1,020,041) Principal paid on capital debt (102,541) (418,584) (521,125) Interest paid on capital debt (14,182) (50,807) (64,989) Proceeds from Disposition of capital assets 11,885 11,885
Net cash provided (used) by capital and related financing activities
(583,160) (546,564) (360,503) (273,915) (1,764,143)
Cash Flows from Investing ActivitiesProceeds from sales and maturities of
investments 1,625,203 2,223,408 1,375,132 625,246 5,848,989 Purchase of investment (1,825,169) (3,672,373) (1,354,489) (348,491) (7,200,521) Interest and dividends received 8,739 21,796 5,573 3,678 39,785
Net cash used by investing activities (191,227) (1,427,169) 26,216 280,433 (1,311,748)
Net increase in cash and cash equivalents (229,395) (385,057) (97,649) 344,946 (367,155) Cash and cash equivalents Beginning of Year 549,756 1,032,068 204,776 248,986 2,035,586 Cash and cash equivalents End of Year 320,360 647,011 107,128 593,932 1,668,431
The notes to the financial statements are an integral part of this statement.
STATEMENT OF CASH FLOWS - PROPRIETARY FUNDSFOR THE YEAR ENDED DECEMBER 31, 2014
Page 1 of 2
Business-type Activities Enterprise Funds
Water Sewer Solid Waste
Storm Drain Total
44 2014 COMPREHENSIVE ANNUAL FINANCIAL REPORT
CITY OF POULSBO FINANCIAL SECTION
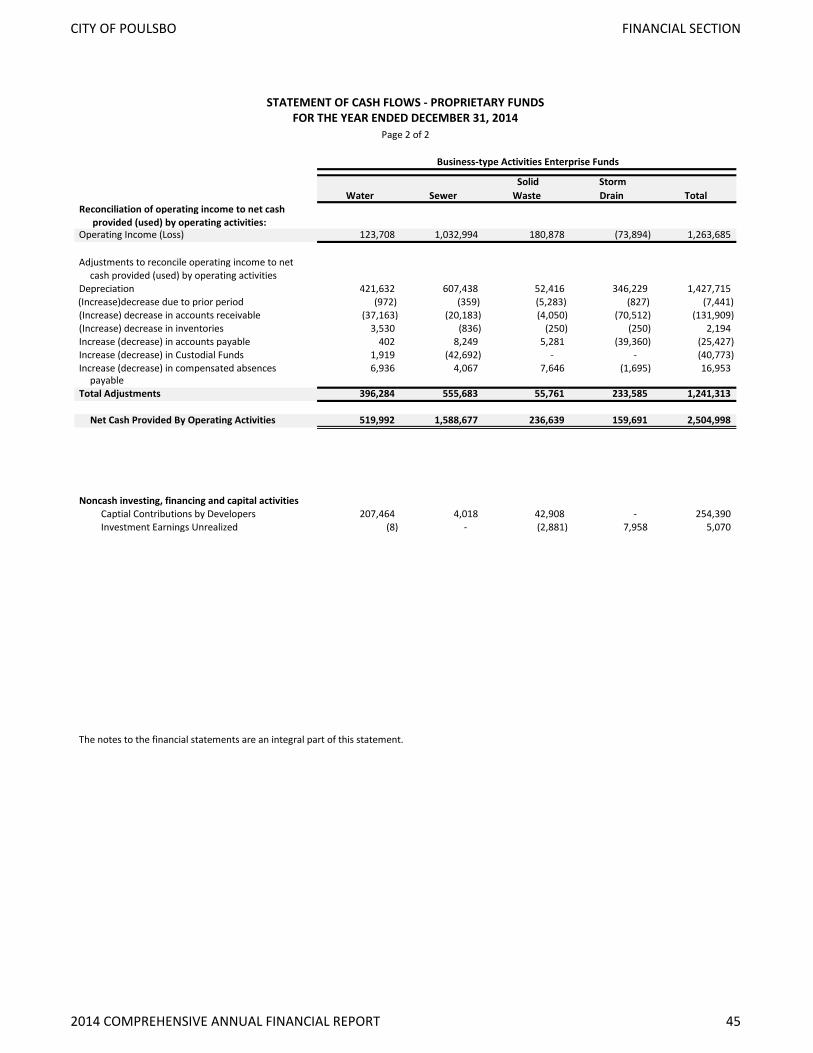
Reconciliation of operating income to net cash provided (used) by operating activities:
Operating Income (Loss) 123,708 1,032,994 180,878 (73,894) 1,263,685
Adjustments to reconcile operating income to netcash provided (used) by operating activities
Depreciation 421,632 607,438 52,416 346,229 1,427,715 (Increase)decrease due to prior period (972) (359) (5,283) (827) (7,441)(Increase) decrease in accounts receivable (37,163) (20,183) (4,050) (70,512) (131,909) (Increase) decrease in inventories 3,530 (836) (250) (250) 2,194 Increase (decrease) in accounts payable 402 8,249 5,281 (39,360) (25,427) Increase (decrease) in Custodial Funds 1,919 (42,692) - - (40,773) Increase (decrease) in compensated absences 6,936 4,067 7,646 (1,695) 16,953
payableTotal Adjustments 396,284 555,683 55,761 233,585 1,241,313
Net Cash Provided By Operating Activities 519,992 1,588,677 236,639 159,691 2,504,998
Noncash investing, financing and capital activitiesCaptial Contributions by Developers 207,464 4,018 42,908 - 254,390 Investment Earnings Unrealized (8) - (2,881) 7,958 5,070
The notes to the financial statements are an integral part of this statement.
FOR THE YEAR ENDED DECEMBER 31, 2014STATEMENT OF CASH FLOWS - PROPRIETARY FUNDS
Business-type Activities Enterprise Funds
Page 2 of 2
Water Sewer SolidWaste
StormDrain Total
2014 COMPREHENSIVE ANNUAL FINANCIAL REPORT 45
CITY OF POULSBO FINANCIAL SECTION
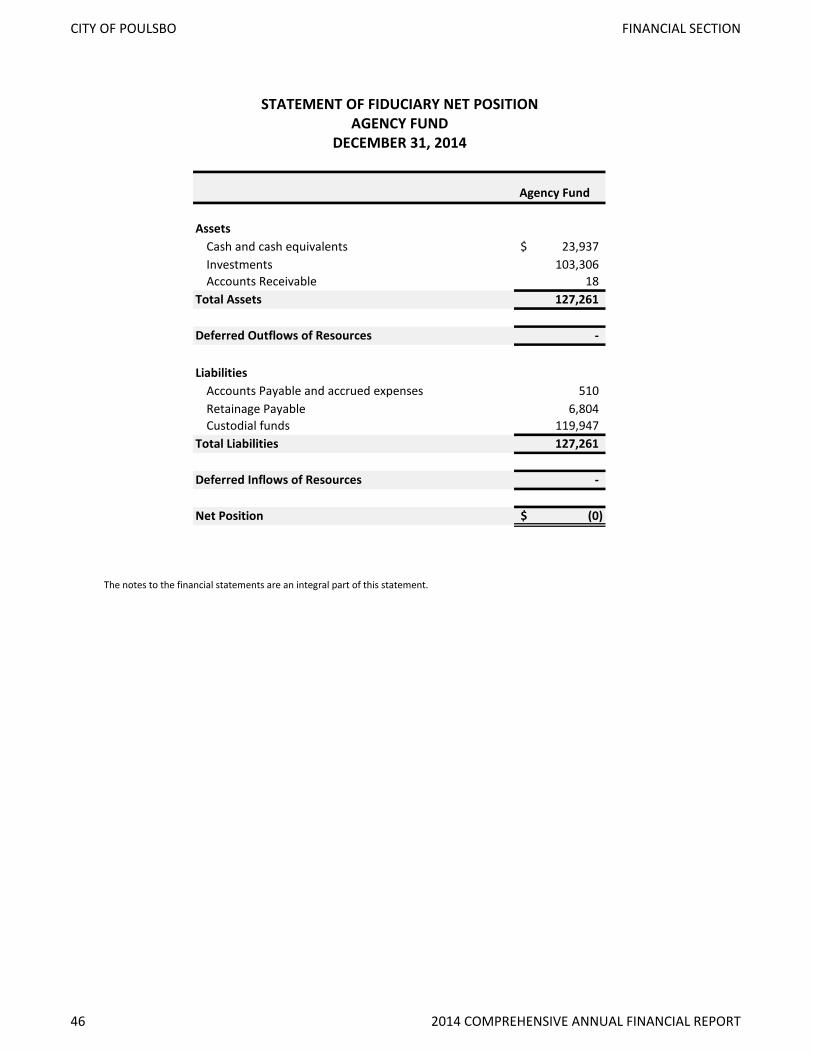
Agency Fund
AssetsCash and cash equivalents 23,937$ Investments 103,306 Accounts Receivable 18
Total Assets 127,261
Deferred Outflows of Resources -
LiabilitiesAccounts Payable and accrued expenses 510 Retainage Payable 6,804 Custodial funds 119,947
Total Liabilities 127,261
Deferred Inflows of Resources -
Net Position (0)$
The notes to the financial statements are an integral part of this statement.
STATEMENT OF FIDUCIARY NET POSITIONAGENCY FUND
DECEMBER 31, 2014
46 2014 COMPREHENSIVE ANNUAL FINANCIAL REPORT
CITY OF POULSBO FINANCIAL SECTION
NOTES TO THE FINANCIAL STATEMENTS
INDEX
ITEM PAGE
NOTE 1: SUMMARY OF SIGNIFICANT ACCOUNTING POLICIES ............................................................ 48
NOTE 2: STEWARDSHIP, COMPLIANCE AND ACCOUNTABILITY .......................................................... 55
NOTE 3: DEPOSITS AND INVESTMENTS ............................................................................................. 56
NOTE 4: PROPERTY TAXES................................................................................................................ 57
NOTE 5: CAPITAL ASSETS ................................................................................................................. 58
NOTE 6: EMPLOYEE RETIREMENT AND PENSION PLANS .................................................................... 59
NOTE 7: RISK MANAGEMENT ........................................................................................................... 65
NOTE 8: ADOPTION OF NEW GASB PRONOUNCEMENTS ................................................................... 66
NOTE 9: FUTURE ADOPTION OF GASB PRONOUNCEMENTS .............................................................. 66
NOTE 10: CONSTRUCTION AND OTHER SIGNIFICANT COMMITMENTS ............................................... 67
NOTE 11: LONG-TERM DEBT ............................................................................................................ 67
NOTE 12: CONTINGENCIES AND COMMITMENTS .............................................................................. 70
NOTE 13: JOINT VENTURES .............................................................................................................. 71
NOTE 14: POSTEMPLOYMENT BENEFITS OTHER THAN PENSIONS ...................................................... 71
NOTE 15: PRIOR PERIOD ADJUSTMENTS AND CHANGES IN ACCOUNTING PRINCIPALS ....................... 73
NOTE 16: RECONCILIATION OF NET INVESTMENT IN CAPITAL ASSETS ................................................ 73
2014 COMPREHENSIVE ANNUAL FINANCIAL REPORT 47
CITY OF POULSBO FINANCIAL SECTION
NOTE 1: SUMMARY OF SIGNIFICANT ACCOUNTING POLICIES
The financial statements of the City of Poulsbo have been prepared in conformity with generally accepted accounting principles (GAAP) as applied to governmental units. The Governmental Accounting Standards Board (GASB) is the accepted standard setting body for establishing governmental accounting and financial reporting principles. The significant accounting policies are described below.
A. REPORTING ENTITY The City of Poulsbo, located in Kitsap County, Washington, was incorporated in 1908. It operates under the laws of the State of Washington applicable to code cities with a Mayor-Council form of government. A full-time mayor and seven council members, all elected at large for four-year terms, administer the City. The City provides what are considered general government services including public safety, streets, parks and recreation, planning and zoning, permits and inspection, general administrative, water, sanitary sewer collection, solid waste collection and storm drainage services.
The City’s Comprehensive Annual Financial Report (CAFR) includes all funds, agencies and boards controlled by, or dependent on, the City. Control by or dependence on the City was determined on the basis of financial accountability, budget adoption, taxing authority, outstanding debt service secured by revenues or general obligations of the City, obligations of the City to finance any deficits that may occur, or receipt of significant subsidies from the City.
B. GOVERNMENT-WIDE AND FUND FINANCIAL STATEMENTS The City’s basic financial statements consist of government-wide statements, including a statement of net position and a statement of activities, and fund financial statements, which provide a more detailed level of financial information.
The government-wide financial statements report information on all of the nonfiduciary activities of the primary government. For the most part, the effect of interfund activity has been removed from these statements. Governmental activities, which normally are supported by taxes and intergovernmental revenues, are reported separately from business- type activities, which rely to a significant extent on fees and charges for support.
The Statement of Activities presents changes in the government-wide net assets by function or program. It focuses on expenses rather than expenditures and shows to what extent direct program revenues offset expenses for a given function. Our policy is to allocate indirect costs to a specific function. Program revenues include: 1) charges to customers or applicants who purchase, use or directly benefit from a program; and 2) grants and contributions that are restricted for the purpose of operational or capital use for a particular program. Taxes and other items such as investment interest, not restricted for specific programs, are reported on the statement as general revenues. The comparison of direct expenses with program revenues identifies the extent to which each function is self-financing, or draws from the general revenues of the City.
The Statement of Net Position presents the financial condition of the City’s governmental and business-type activities at year-end. It reports all financial and capital assets including infrastructure and all liabilities, including current and long-term.
During the year, the City segregates transactions related to certain City functions or activities into separate funds in order to aid financial management and to demonstrate legal compliance. Fund financial statements are designed to present financial information of the City at this more detailed level and include statements for governmental, proprietary, and fiduciary funds, even though the fiduciary funds are excluded from the government-wide statements. In the basic financial statements, the governmental and enterprise fund financial statements focus on major funds. Major individual government funds and major individual enterprise funds are reported as separate columns in the fund financial statements.
C. MEASUREMENT FOCUS, BASIS OF ACCOUNTING, AND FINANCIAL STATEMENT PRESENTATION The government-wide financial statements are reported using the economic resources measurement focus and the accrual basis of accounting, as are the proprietary fund and fiduciary fund financial statements. Revenues are recorded when earned and expenses are recorded when a liability is incurred, regardless of the timing of related cash flows. Property taxes are recognized as revenues in the year for which they are levied. Grants and similar items are recognized as revenue as soon as all eligibility requirements imposed by the provider have been met.
48 2014 COMPREHENSIVE ANNUAL FINANCIAL REPORT
CITY OF POULSBO FINANCIAL SECTION

Governmental fund financial statements are reported using the current financial resources measurement focus and the modified accrual basis of accounting, Revenues are recognized as soon as they are both measurable and available. Revenues are considered to be available when they are collectible within the current period or soon enough thereafter to pay liabilities of the current period. For this purpose, the City considers revenues to be available if they are collected within 60 days of the end of the current fiscal period. Expenditures generally are recorded when a liability is incurred, as under accrual accounting. However, debt service expenditures, as well as expenditures related to compensated absences and claims and judgments, are recorded only when payment is due.
Property taxes, licenses, and interest associated within the current fiscal period are all considered to be susceptible to accrual and so have been recognized as revenues of the current fiscal period. Only the portion of special assessment receivable due within the current fiscal period is considered to be susceptible to accrual as revenue of the current period. All other revenue items are considered to be measurable and available only when cash is received by the City.
The City reports the following major governmental funds:
The General Fund is the City’s primary operating fund. It accounts for all financial resources of the general government, except those required to be accounted for in another fund.
The Street Reserve Fund was established to account for capital improvements to the City street system. The significant resources accounted for in this fund are Federal and State transportation grants, developer contributions and transfers from allocations made of taxes received by the City designated to fund Street improvements.
The City reports the following major proprietary funds:
The Water Fund accounts for providing water services. Its revenues are mostly received from service charges and system connection charges. Expenses are for maintenance and operations of a water supply, storage and distribution system. This fund also reflects the operation of revenue bonds outstanding, the funds available for redemption of bonds, cumulative reserve and construction funds.
The Sewer Fund accounts for providing sewer services. Its revenues are mostly received from service charges and system connection charges. Expenses are for maintenance and extensions of drainage, sewer service facilities, maintaining sewer collection and transmission systems. This fund also reflects the operation of revenue bonds outstanding, the funds available for redemption of bonds, cumulative reserve and construction funds.
The Solid Waste Fund accounts for operations of the collection and transportation of solid waste. Its revenues are received from service charges. Expenses are made up of the cost of collection and disposal of solid waste.
The Storm Drain Fund accounts for the operation, construction, and maintenance of the storm water management system.
Additionally, the City reports the following fund types:
Special Revenue Funds account for the proceeds of specific revenue sources to finance specific activities as required by law or administration regulation. Their revenues are earmarked to finance certain activities or functions.
Debt Service Funds account for resources accumulated and payment made for principal and interest on the general government debt except those required to be accounted for in another fund.
Capital Project Funds account for the acquisition or development of capital facilities for governmental activities. The major sources of revenue are from proceeds from general obligation bonds, grants, and contributions from other funds.
Agency funds account for assets held by the City as an agent for private individuals or other governments. Agency funds are custodial in nature (assets equal liabilities) and do not involve the measurement of the results of operation.
2014 COMPREHENSIVE ANNUAL FINANCIAL REPORT 49
CITY OF POULSBO FINANCIAL SECTION

Permanent Funds account for resources that are legally restricted to the extent that only the earnings, and not the principal, may be used for specific purposes that support the City’s programs and benefit the City and its citizens. The City has one Permanent fund, the Bernice Borgen Beautification Fund. The fund accounts for a trust established from Ms. Borgen’s estate of an original donation of $90,002 in 2000 and an additional contribution of $1,014 in 2002. Only the interest earned on this donation can be used for beautification of the City. The City Council has the authority to determine what these expenditures will be. As of year-end, funds available for expenditure are $5,720. This amount also represents the designated unrealized investment earnings.
As a general rule the effect of interfund activity has been eliminated from the government-wide financial statements. Direct expenses of the functional categories are included in the government-wide statement of activities while indirect expense allocations are eliminated ($1,110,632 in 2014) Exceptions to this general rule are payments-in-lieu of taxes and other charges between the government’s utility functions and various other functions of the government. Elimination of these charges would distort the direct costs and program revenues reported for the various functions concerned.
Amounts reported as program revenues include 1) charges to customers or applicants for goods, services or privileges provided, 2) operating grants and contributions, and 3) capital grants and contributions, including special assessments. Internally dedicated resources are reported as general revenues rather than as program revenues. Likewise, general revenues include all taxes.
Proprietary funds distinguish operating revenues and expenses from non-operating items. Operating revenues and expenses generally result from providing services and producing and delivering goods in connection with a proprietary fund’s principal ongoing operations. The principal operating revenues of the proprietary funds are the charges for goods and services. Operating expenses for enterprise funds and internal service funds include the cost of sales and services, administrative expenses, and depreciation on capital assets. All revenue and expenses not meeting this definition are reported as non-operating revenues and expenses.
When both restricted and unrestricted resources are available for use, it is the City’s policy to use restricted resources first, then unrestricted resources as needed.
D. ASSETS, LIABILITIES, AND NET ASSETS OR EQUITY 1. Cash and Investments The City’s cash and equivalents are considered to be currency on hand and demand deposits with banks. Investments are obligations of the U.S. Government, U.S. agency issues, obligations of the state of Washington, general obligations of Washington State municipalities (the State Treasurer’s Local Government Investment Pool (LGIP)), or certificates of deposit with Washington State Banks and savings and loan institutions. It is the City's policy to invest all temporary cash surpluses. Interest on these investments is allocated to each fund on the basis of investments owned. These investments are reported on the Statement of Net Position and Combining Balance Sheets as cash and cash equivalents or investments.
In accordance with City policy and Washington State law, authorized investment purchases include Certificates of Deposit with financial institutions qualified by the Washington Public Deposit Protection Commission, US Treasury and Agency Securities, bankers‘ acceptances, bonds of Washington state and any local government in Washington state which have, at the time of purchase, one of the three highest credit ratings of a nationally recognized rating agency, repurchase agreements, the State Investment Pool (which is a 2a7 pool), and mutual funds used specifically for debt issues related to arbitrage.
The City reports its deposit and investment risk disclosures in accordance with GASB 40 (see note 3). All investments are stated at fair value as of December 31, 2014.
2. Receivables The City of Poulsbo recognizes receivables in its various funds using the accounting basis required for that fund. These receivables are as follows:
Property Taxes The City’s annual property tax levy is billed and collected by Kitsap County. Taxes collected by the County, but not
50 2014 COMPREHENSIVE ANNUAL FINANCIAL REPORT
CITY OF POULSBO FINANCIAL SECTION
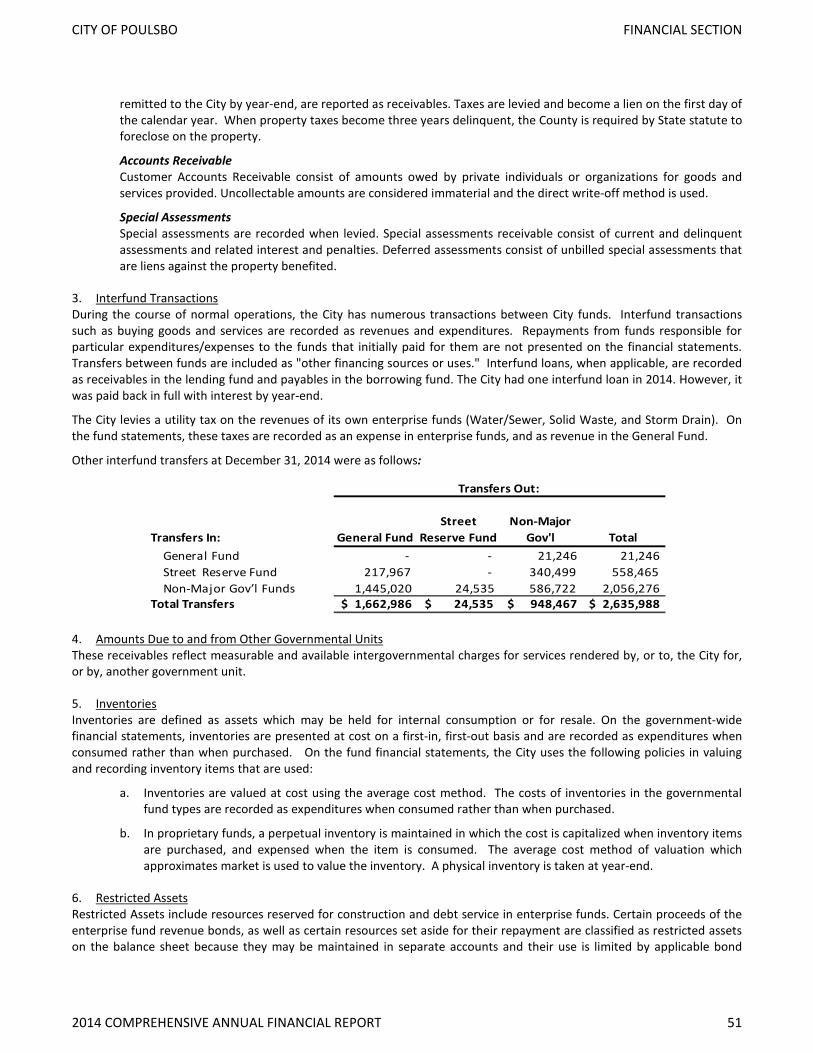
remitted to the City by year-end, are reported as receivables. Taxes are levied and become a lien on the first day of the calendar year. When property taxes become three years delinquent, the County is required by State statute to foreclose on the property.
Accounts Receivable Customer Accounts Receivable consist of amounts owed by private individuals or organizations for goods and services provided. Uncollectable amounts are considered immaterial and the direct write-off method is used.
Special Assessments Special assessments are recorded when levied. Special assessments receivable consist of current and delinquent assessments and related interest and penalties. Deferred assessments consist of unbilled special assessments that are liens against the property benefited.
3. Interfund Transactions During the course of normal operations, the City has numerous transactions between City funds. Interfund transactions such as buying goods and services are recorded as revenues and expenditures. Repayments from funds responsible for particular expenditures/expenses to the funds that initially paid for them are not presented on the financial statements. Transfers between funds are included as "other financing sources or uses." Interfund loans, when applicable, are recorded as receivables in the lending fund and payables in the borrowing fund. The City had one interfund loan in 2014. However, it was paid back in full with interest by year-end.
The City levies a utility tax on the revenues of its own enterprise funds (Water/Sewer, Solid Waste, and Storm Drain). On the fund statements, these taxes are recorded as an expense in enterprise funds, and as revenue in the General Fund.
Other interfund transfers at December 31, 2014 were as follows:
Transfers In: General FundStreet
Reserve FundNon-Major
Gov'l TotalGeneral Fund - - 21,246 21,246 Street Reserve Fund 217,967 - 340,499 558,465 Non-Major Gov’l Funds 1,445,020 24,535 586,722 2,056,276
Total Transfers $ 1,662,986 $ 24,535 $ 948,467 $ 2,635,988
Transfers Out:
4. Amounts Due to and from Other Governmental Units These receivables reflect measurable and available intergovernmental charges for services rendered by, or to, the City for, or by, another government unit.
5. Inventories Inventories are defined as assets which may be held for internal consumption or for resale. On the government-wide financial statements, inventories are presented at cost on a first-in, first-out basis and are recorded as expenditures when consumed rather than when purchased. On the fund financial statements, the City uses the following policies in valuing and recording inventory items that are used:
a. Inventories are valued at cost using the average cost method. The costs of inventories in the governmental fund types are recorded as expenditures when consumed rather than when purchased.
b. In proprietary funds, a perpetual inventory is maintained in which the cost is capitalized when inventory items are purchased, and expensed when the item is consumed. The average cost method of valuation which approximates market is used to value the inventory. A physical inventory is taken at year-end.
6. Restricted Assets Restricted Assets include resources reserved for construction and debt service in enterprise funds. Certain proceeds of the enterprise fund revenue bonds, as well as certain resources set aside for their repayment are classified as restricted assets on the balance sheet because they may be maintained in separate accounts and their use is limited by applicable bond
2014 COMPREHENSIVE ANNUAL FINANCIAL REPORT 51
CITY OF POULSBO FINANCIAL SECTION

covenants. The amount listed in the governmental funds represents the permanent trust fund.
7. Note Receivable Note Receivable consists of the amount owed to the City from the Poulsbo Historical Society for a portion of real estate sold to house the Poulsbo Historical Museum.
8. Capital Assets The City defines a capital asset as assets with an initial, individual cost of $5,000 or greater and an estimated life in excess of three years. Capital assets include property, equipment, and infrastructure (i.e. roads, bridges, sidewalks, and similar items).
In the fund financial statements, these assets are accounted for and reported based on the measurement focus of the fund. In other words, in the governmental funds, acquired capital assets are accounted for as expenditures when the asset is purchased. In the proprietary funds, the expense is capitalized and the current year’s depreciation is reported as the expense.
All capital assets are capitalized at cost (or estimated historical cost) and updated for additions and retirements during the year. Donated assets are valued at estimated fair market value at time of acquisition. Where historical cost is not known, assets are recorded at estimated historical costs. The City maintains a capitalization threshold of $5,000. The City’s infrastructure consists of roads, bridges, storm sewers, and water and sewer distribution and collection systems. Improvements are capitalized but the costs of normal maintenance and repairs, not adding to the value of the asset or materially extending an asset’s life, are not. Property, plant, and equipment of the primary government are depreciated using the straight-line method and reported in the government-wide statements and proprietary funds using the following estimate useful lives:
Estimated Useful Life in YearsBuildings and Improvements 10-100Equipment 3-25Roads-collectors and residential 30Water and Sewer distribution and collection systems 40
9. Compensated Absences It is the City’s policy to permit employees to accumulate earned, but unused, vacation leave up to a maximum of 240 hours. Vacation pay is payable to the maximum upon resignation, retirement, or the death of an employee. Compensatory time is accruable to a maximum of 80 hours.
Sick leave accumulation is unlimited, but the annual accrual could be elected to be cashed out for 50% once a 1,000 hour balance is reached. All sick leave is payable upon resignation, retirement or the death of an employee for 50% up to a maximum balance of 1,200 hours.
In accordance with GASB Statement No. 16, the City accrues vacation pay and no liability is recorded for non-vesting accumulating rights to receive sick pay benefits. However, a liability is recognized for that portion of the accumulating sick leave benefits that it is estimated will be taken as termination leave prior to resignation. This provides for the termination pay for eligible employees vacation and 50% percent of their sick leave to a maximum of 1,200 hours accrued.
The entire compensated absence liability is reported on the government-wide financial statements. In the proprietary funds, the entire amount of compensated absences is reported as a fund liability.
In prior years, the General Fund and proprietary funds have typically been used to liquidate these liabilities.
10. Other Post-Employment Benefits Lifetime full medical coverage is provided to uniformed Police and Fire personnel who became members of the Law Enforcement Officers and Fire Fighters (LEOFF 1) retirement system prior to October 1, 1977. A liability for the accumulated unfunded actuarially required contribution is reported in the Statement of Net Position. The actual medical costs are reported as expenditures in the year they are incurred.
52 2014 COMPREHENSIVE ANNUAL FINANCIAL REPORT
CITY OF POULSBO FINANCIAL SECTION

11. Custodial Accounts These accounts reflect the liability for net monetary assets being held by the City in its trustee or agency capacity.
12. Accrued Liabilities and Long-Term Obligations All payables, accrued liabilities and long-term obligations are reported in the government-wide financial statements. Also, all payables, accrued liabilities and long-term obligations payable from proprietary funds are reported on the proprietary fund financial statements.
In general, governmental fund payables and accrued liabilities, those once incurred, are paid in a timely manner and in full from current financial resources, are reported as obligations of the funds. When due, bonds, capital leases, and long-term loans are recognized as a liability on the governmental fund financial statements.
13. Unearned Revenues Unearned revenues consist of receivables for charges for services to be recognized in the following year or funds paid in advance by customers for services to be recognized in the following year.
14. Fund Balance Classification In the fund financial statements, governmental funds report fund balances based on the extent to which the City is bound to observe constraints on the use of the governmental funds’ resources. Fund balances are classified in the following manner:
• Nonspendable - includes amounts that are either 1) not in spendable form, or 2) legally or contractually required to be maintained intact. Inventories, prepaid items, and permanent trusts are classified as nonspendable fund balances.
• Restricted - includes amounts which are constrained for specific purposes that are 1) externally imposed by creditors, grantors, contributors, or laws or regulations of other governments, or 2) imposed by law through enabling legislation.
• Committed - includes amounts that can be used for specific purposes with constraints imposed by formal action of the highest level of decision-making authority. The authorization specifying the purposes for which committed funds can be used should have the consent of both the legislative and executive branches of government. The City operates under a Mayor-Council form of government. As Executive Officer, the Mayor supervises the administrative process of the City and works with the City Council. The City Council enacts ordinances and resolutions that may impose, modify or rescind fund balance commitments. (The City does not have any committed balances)
• Assigned - includes amounts that are intended to be used for specific purposes, but are neither restricted nor committed. The authority for assignment of funds is not required to be the government’s highest level of decision making authority. Furthermore, the constraints imposed on the use of assigned amounts are more easily removed or modified than those imposed on committed fund balances. The City Council may authorize executive officers to assign fund balances for specific purposes through Council files, ordinances and resolutions.
• Unassigned - includes amounts that are not assigned to other funds and do not meet the criteria for being classified as restricted, committed, or assigned. Fund balances that can be utilized for economic stabilization, emergencies and contingencies that do not qualify as restricted or committed are reported as unassigned.
The primary flow assumption utilized by the City is: 1) Restricted, 2) Committed, 3) Assigned, 4) Unassigned. However, prior to the commencement of any project, the flow assumption is reviewed to ensure that the proper resources are being used. The following is the breakdown:
2014 COMPREHENSIVE ANNUAL FINANCIAL REPORT 53
CITY OF POULSBO FINANCIAL SECTION

Nonspendable Purposes
Restricted Purposes
Assigned Purposes
Unassigned Purposes Totals
General FundGeneral Government 12,412$ -$ -$ 661,204$ 673,616$ Stabilization Fund 1,277,265 1,277,265 Legal Reserves 224,494 224,494
Subtotals, General Fund 12,412 - 1,501,759 661,204 2,175,375
Street Reserve FundCapital Improvements 618,120 618,120
Subtotals, City Street Fund - - 618,120 - 618,120
Other Governmental FundsTransportation Improvements - 241,270 241,270 Parks Improvements 127,393 246,316 373,709 Cemetery Improvements 72,093 72,093 Capital Equipment 534,991 534,991 Capital Improvements 382,229 437,963 820,192 Drug Enforcement 16,778 16,778 Criminal Justice 91,099 14,672 105,771 Promote Dow ntow n Businesses 77,712 77,712 Promoting Tourism 64,848 64,848 City Beautif ication 91,016 5,720 96,736 Debt Service 7,957 7,957
Subtotals, Other Governmental Funds 91,016 773,736 1,547,305 - 2,412,057
Totals 103,428$ 773,736$ 3,667,183$ 661,204$ 5,205,551$
15. Minimum Fund Balances The City has formally adopted a minimum fund balance policy because it is the belief adequate reserve levels are a necessary component of the City’s overall financial management strategy and a key factor in external agencies’ measurement of the City’s financial strength.
General Fund It will be the policy of the city to maintain a General Fund Reserve at a level of at least equal to twelve percent (12%) of the total General Fund budgeted operating revenue, excluding the beginning fund balance and identified one-time revenue. This shall be in addition to the maintenance of two months operating cash within the General Fund itself.
These operating reserves are maintained to:
• address temporary revenue shortfalls; • payment of approved expenditures due to cash flow shortage; • reserves for expenditures deemed necessary by the Mayor and City Council; and • temporary short-term interfund loans.
Annual contribution will be budgeted from General Fund resources as available to maintain the target reserve level.
Capital Reserve Funds The city shall maintain capital reserve funds to provide funding for the six years Capital Improvement Plan, less proprietary fund projects. The use of any funds within the Capital Improvement Funds shall be approved by the City Council.
Contributions to the capital reserve funds will be made as per the budget recommendations set by the City Council.
All expenditures drawn from reserve accounts shall require prior Council super majority approval unless previously specifically authorized by the City Council for expenditure in the annual budget
54 2014 COMPREHENSIVE ANNUAL FINANCIAL REPORT
CITY OF POULSBO FINANCIAL SECTION

NOTE 2: STEWARDSHIP, COMPLIANCE AND ACCOUNTABILITY
A. BUDGETARY INFORMATION The City prepares an annual budget in accordance with the Revised Code of Washington (RCW) 35.33 that is on a basis consistent with accounting principles generally accepted in the United States of America. All funds except custodial agency funds and permanent funds are budgeted to the fund level. Annual appropriated budgets are adopted for all funds and lapse at the end of each year. However, some of the special revenue and capital funds may carry forward budgeted amounts beyond the year for completion of certain projects.
Budget amounts shown in the basic financial statements include the original budget amount and all appropriation transfers and adjustments approved by the City Council, as required. The Mayor is authorized to approve intra-fund budget transfers from one department to another or between line items of the same department. Only the City Council has the authority to increase a given fund’s budget. This is executed by City ordinance.
In addition to authorizing the budget, the City Council approves the Capital Improvement Plan. This is a five year plan for capital project expenditures and anticipated revenue sources. Expenditures and revenue for these projects are budgeted in the Capital Project Funds.
The calendar below outlines the process for preparing, reviewing and adopting the annual budget:
MAY – JULY
• Capital Improvement team begins process to update Capital Improvement Plan (CIP)
JULY – AUGUST
• Council meets to review and set budgetary policies • Budgetary packets with instruction and initial allocations provided • Revenues are reviewed and forecasted • Departments meet with Council committees to finalize recommended budget proposals • Department budget proposals submitted to Finance Department
SEPTEMBER – DECEMBER
• Budget submission reviewed with Mayor • Mayor’s proposed preliminary budget prepared and distributed to Council • Public Hearings held • CIP presented to Council • Additional funding & New Program requests reviewed • Property tax levy set • Department budgets presented to full Council for review and discussion • Preliminary budget with all changed prepared and distributed
DECEMBER
• Final review and adoption of budget
The final budget, as adopted, is published within the first three months of the new budget year and distributed to various governmental agencies as well as to the local library to be available to the citizens and all interested members of the public.
B. BUDGETARY COMPLIANCE In 2014, there were no City funds that reported actual expenditures above budgeted appropriations. Though specific line items may be exceeded, no fund's appropriations can be legally exceeded. It should be noted, however, that the "Statement of Revenues, Expenditures and Changes in Fund Balances” including the comparisons of “Budget and Actual," could be misinterpreted due to its format and, by so doing, lead one to believe that budgeted expenditures have been exceeded. The City budgets not only expenditures but also "Beginning Fund Balances" so as to maintain a budget in balance with receipts and disbursements. By increasing expenditure appropriations by the budget values for these items, it
2014 COMPREHENSIVE ANNUAL FINANCIAL REPORT 55
CITY OF POULSBO FINANCIAL SECTION
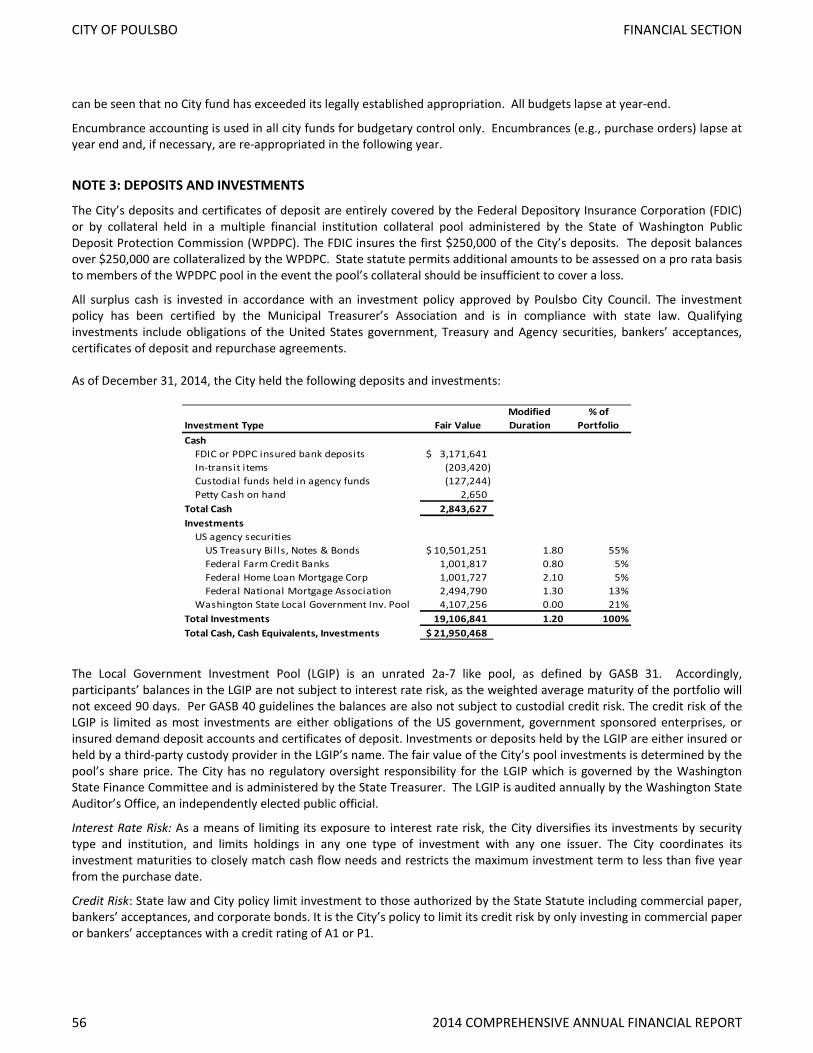
can be seen that no City fund has exceeded its legally established appropriation. All budgets lapse at year-end.
Encumbrance accounting is used in all city funds for budgetary control only. Encumbrances (e.g., purchase orders) lapse at year end and, if necessary, are re-appropriated in the following year.
NOTE 3: DEPOSITS AND INVESTMENTS
The City’s deposits and certificates of deposit are entirely covered by the Federal Depository Insurance Corporation (FDIC) or by collateral held in a multiple financial institution collateral pool administered by the State of Washington Public Deposit Protection Commission (WPDPC). The FDIC insures the first $250,000 of the City’s deposits. The deposit balances over $250,000 are collateralized by the WPDPC. State statute permits additional amounts to be assessed on a pro rata basis to members of the WPDPC pool in the event the pool’s collateral should be insufficient to cover a loss.
All surplus cash is invested in accordance with an investment policy approved by Poulsbo City Council. The investment policy has been certified by the Municipal Treasurer’s Association and is in compliance with state law. Qualifying investments include obligations of the United States government, Treasury and Agency securities, bankers’ acceptances, certificates of deposit and repurchase agreements. As of December 31, 2014, the City held the following deposits and investments:
Investment Type Fair Value Modified Duration
% of Portfolio
CashFDIC or PDPC insured bank deposits 3,171,641$ In-transit items (203,420) Custodial funds held in agency funds (127,244) Petty Cash on hand 2,650
Total Cash 2,843,627 Investments
US agency securitiesUS Treasury Bil ls, Notes & Bonds 10,501,251$ 1.80 55%Federal Farm Credit Banks 1,001,817 0.80 5%Federal Home Loan Mortgage Corp 1,001,727 2.10 5%Federal National Mortgage Association 2,494,790 1.30 13%
Washington State Local Government Inv. Pool 4,107,256 0.00 21%Total Investments 19,106,841 1.20 100%Total Cash, Cash Equivalents, Investments 21,950,468$
The Local Government Investment Pool (LGIP) is an unrated 2a-7 like pool, as defined by GASB 31. Accordingly, participants’ balances in the LGIP are not subject to interest rate risk, as the weighted average maturity of the portfolio will not exceed 90 days. Per GASB 40 guidelines the balances are also not subject to custodial credit risk. The credit risk of the LGIP is limited as most investments are either obligations of the US government, government sponsored enterprises, or insured demand deposit accounts and certificates of deposit. Investments or deposits held by the LGIP are either insured or held by a third-party custody provider in the LGIP’s name. The fair value of the City’s pool investments is determined by the pool’s share price. The City has no regulatory oversight responsibility for the LGIP which is governed by the Washington State Finance Committee and is administered by the State Treasurer. The LGIP is audited annually by the Washington State Auditor’s Office, an independently elected public official.
Interest Rate Risk: As a means of limiting its exposure to interest rate risk, the City diversifies its investments by security type and institution, and limits holdings in any one type of investment with any one issuer. The City coordinates its investment maturities to closely match cash flow needs and restricts the maximum investment term to less than five year from the purchase date.
Credit Risk: State law and City policy limit investment to those authorized by the State Statute including commercial paper, bankers’ acceptances, and corporate bonds. It is the City’s policy to limit its credit risk by only investing in commercial paper or bankers’ acceptances with a credit rating of A1 or P1.
56 2014 COMPREHENSIVE ANNUAL FINANCIAL REPORT
CITY OF POULSBO FINANCIAL SECTION
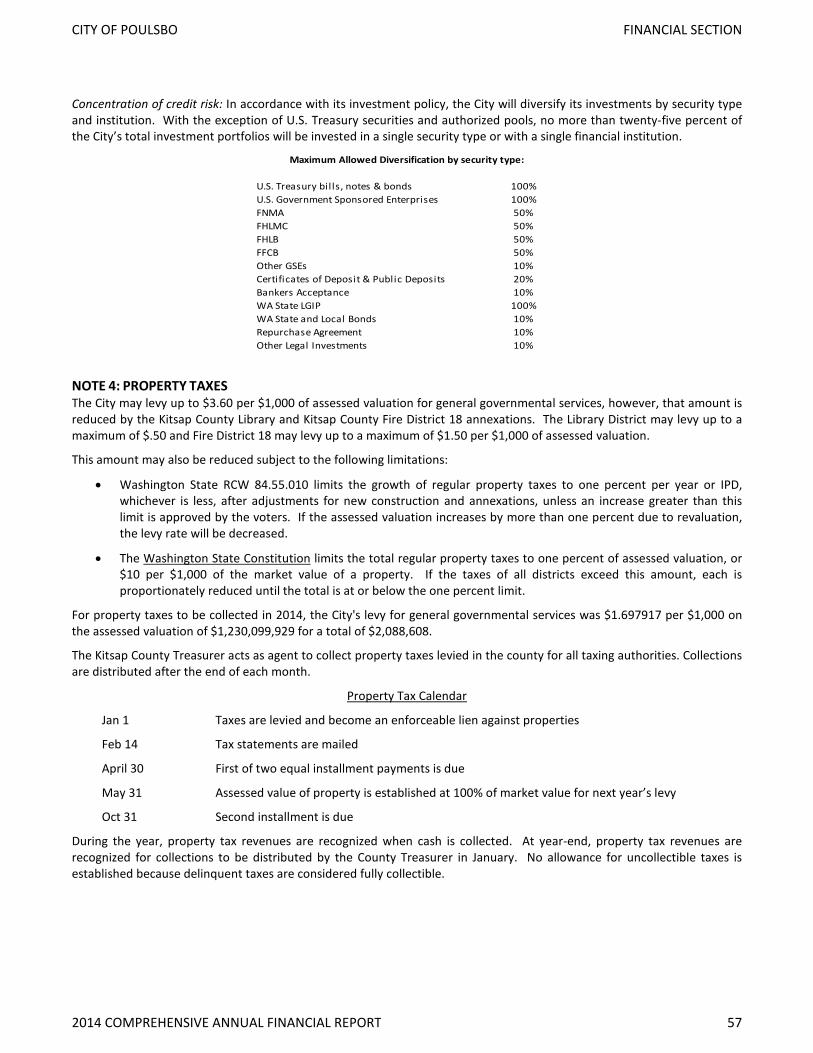
Concentration of credit risk: In accordance with its investment policy, the City will diversify its investments by security type and institution. With the exception of U.S. Treasury securities and authorized pools, no more than twenty-five percent of the City’s total investment portfolios will be invested in a single security type or with a single financial institution.
U.S. Treasury bil ls, notes & bonds 100%U.S. Government Sponsored Enterprises 100%FNMA 50%FHLMC 50%FHLB 50%FFCB 50%Other GSEs 10%Certificates of Deposit & Public Deposits 20%Bankers Acceptance 10%WA State LGIP 100%WA State and Local Bonds 10%Repurchase Agreement 10%Other Legal Investments 10%
Maximum Allowed Diversification by security type:
NOTE 4: PROPERTY TAXES The City may levy up to $3.60 per $1,000 of assessed valuation for general governmental services, however, that amount is reduced by the Kitsap County Library and Kitsap County Fire District 18 annexations. The Library District may levy up to a maximum of $.50 and Fire District 18 may levy up to a maximum of $1.50 per $1,000 of assessed valuation.
This amount may also be reduced subject to the following limitations:
• Washington State RCW 84.55.010 limits the growth of regular property taxes to one percent per year or IPD, whichever is less, after adjustments for new construction and annexations, unless an increase greater than this limit is approved by the voters. If the assessed valuation increases by more than one percent due to revaluation, the levy rate will be decreased.
• The Washington State Constitution limits the total regular property taxes to one percent of assessed valuation, or $10 per $1,000 of the market value of a property. If the taxes of all districts exceed this amount, each is proportionately reduced until the total is at or below the one percent limit.
For property taxes to be collected in 2014, the City's levy for general governmental services was $1.697917 per $1,000 on the assessed valuation of $1,230,099,929 for a total of $2,088,608.
The Kitsap County Treasurer acts as agent to collect property taxes levied in the county for all taxing authorities. Collections are distributed after the end of each month.
Property Tax Calendar
Jan 1 Taxes are levied and become an enforceable lien against properties
Feb 14 Tax statements are mailed
April 30 First of two equal installment payments is due
May 31 Assessed value of property is established at 100% of market value for next year’s levy
Oct 31 Second installment is due
During the year, property tax revenues are recognized when cash is collected. At year-end, property tax revenues are recognized for collections to be distributed by the County Treasurer in January. No allowance for uncollectible taxes is established because delinquent taxes are considered fully collectible.
2014 COMPREHENSIVE ANNUAL FINANCIAL REPORT 57
CITY OF POULSBO FINANCIAL SECTION

NOTE 5: CAPITAL ASSETS
All reported capital assets of the City are depreciated. Improvements are depreciated over the remaining useful lives of the related capital assets. Useful lives for infrastructure were estimated based on the City’s historical records of necessary improvements and replacement.
Capital asset activity for the primary government for the year ended December 31, 2014, was as follows:
BEGINNING BALANCE INCREASES DECREASES ENDING BALANCE
Governmental-Type Activities Capital assets, not being depreciated:
Land 8,576,588$ 475,025$ -$ 9,051,612$ Intangible - Right of Way 19,839,139 - - 19,839,139 Construction Work in Progress 1,271,199 3,091,813 (1,578,086) 2,784,926
Total capital assets not being depreciated 29,686,926 3,566,838 (1,578,086) 31,675,678 Capital assets, being depreciated:
Buildings 17,118,430 - - 17,118,430 Other Improvements 8,268,980 1,668,822 - 9,937,803 Machinery and Equipment 2,952,326 89,835 (28,921) 3,013,240 Intangible 647,486 - - 647,486 Infrastructure 31,352,627 - - 31,352,627
Total capital assets being depreciated 60,339,849 1,758,657 (28,921) 62,069,586 Less accumulated depreciation for:
Buildings (3,135,685) (343,618) - (3,479,303) Other Improvements (2,924,141) (725,787) - (3,649,929) Machinery and Equipment (2,104,566) (197,611) 28,921 (2,273,256) Intangible (436,148) (70,830) - (506,979) Infrastructure (8,287,321) (628,723) - (8,916,044)
Total accumulated depreciation (16,887,862) (1,966,570) 28,921 (18,825,511) Total capital assets, being depreciated, net 43,451,988 (207,913) - 43,244,075 Governmental activity capital assets, net 73,138,914$ 3,358,925$ (1,578,086)$ 74,919,753
Depreciation expense was charged to functions/programs of the primary government as follows:
Governmental activities:General Government 358,306$ Security of Persons and Property 94,209 Util ities and Environment 2,889 Transportation 1,275,832 Economic Environment - Culture and Recreation 235,334
Total depreciation expense - governmental activities 1,966,570$
58 2014 COMPREHENSIVE ANNUAL FINANCIAL REPORT
CITY OF POULSBO FINANCIAL SECTION

BEGINNING BALANCE INCREASES DECREASES ENDING BALANCE
Business-Type ActivitiesCapital assets, not being depreciated:
Land 1,025,036$ -$ -$ 1,025,036$ Construction Work in Progress 899,434 1,090,376 (636,957) 1,352,853
Total capital assets not being depreciated 1,924,469 1,090,376 (636,957) 2,377,888 Capital assets, being depreciated:
Buildings 637,738 - - 637,738 Other Improvements 54,537,576 1,156,594 (387) 55,693,784 Machinery and Equipment 2,546,888 298,231 (288,093) 2,557,025 Intangible 421,961 - - 421,961
Total capital assets being depreciated 58,144,162 1,454,825 (288,480) 59,310,508 Less accumulated depreciation for:
Buildings (392,477) (9,201) - (401,678) Other Improvements (13,589,279) (1,253,778) - (14,843,057) Machinery and Equipment (2,027,044) (124,465) 288,093 (1,863,416) Intangible (167,269) (40,271) - (207,540)
Total accumulated depreciation (16,176,068) (1,427,715) 288,093 (17,315,691) Total capital assets, being depreciated, net 41,968,094 27,109 (387) 41,994,817 Business-type activity capital assets, net 43,892,563$ 1,117,485$ (637,343)$ 44,372,705
Depreciation expense was charged Business-Type Activities of the primary government as follows:
Business-type activities:Water 421,632$ Sewer 607,438 Solid Waste 52,416 Storm Drain 346,229 Public Works AdministrationTotal depreciation expense - business-type activities 1,427,715$
NOTE 6: EMPLOYEE RETIREMENT AND PENSION PLANS
Substantially, all of the City of Poulsbo’s full-time and qualifying part-time employees participate in one of the following statewide retirement systems administered by the Washington State Department of Retirement Systems, under cost-sharing multiple-employer public employee defined benefit retirement plans. The Department of Retirement Systems (DRS), a department within the primary government of the State of Washington, issues a publicly available comprehensive annual financial report (CAFR) that includes financial statements and required supplementary information for each plan. The DRS CAFR may be obtained by writing to: Department of Retirement Systems, Communications Unit, P.O. Box 48380, Olympia, WA 98504-8380; or it may be downloaded from the DRS website at www.drs.wa.gov.
PUBLIC EMPLOYEES' RETIREMENT SYSTEM (PERS) PLANS 1, 2, and 3
Plan Descriptions: The Legislature established PERS in 1947. Membership in the system includes: elected officials; state employees; employees of the Supreme, Appeals, and Superior courts; employees of legislative committees; employees of district and municipal courts; and employees of local governments. Membership also includes higher education employees not participating in higher education retirement programs. Approximately 49 percent of PERS salaries are accounted for by state employment. PERS retirement benefit provisions are established in Chapters 41.34 and 41.40 RCW and may be amended only by the State Legislature.
2014 COMPREHENSIVE ANNUAL FINANCIAL REPORT 59
CITY OF POULSBO FINANCIAL SECTION

PERS is a cost-sharing multiple-employer retirement system comprised of three separate plans for membership purposes: Plans 1 and 2 are defined benefit plans and Plan 3 is a defined benefit plan with a defined contribution component.
PERS members who joined the system by September 30, 1977 are Plan 1 members. Those who joined on or after October 1, 1977 and by either, February 28, 2002 for state and higher education employees, or August 31, 2002 for local government employees, are Plan 2 members unless they exercised an option to transfer their membership to Plan 3. PERS members joining the system on or after March 1, 2002 for state and higher education employees, or September 1, 2002 for local government employees have the irrevocable option of choosing membership in either PERS Plan 2 or Plan 3. The option must be exercised within 90 days of employment. Employees who fail to choose within 90 days default to Plan 3.
PERS is comprised of and reported as three separate plans for accounting purposes: Plan 1, Plan 2/3, and Plan 3. Plan 1 accounts for the defined benefits of Plan 1 members. Plan 2/3 accounts for the defined benefits of Plan 2 members, and the defined benefit portion of benefits for Plan 3 members. Plan 3 accounts for the defined contribution portion of benefits for Plan 3 members. Although members can only be a member of either Plan 2 or Plan 3, the defined benefit portions of Plan 2 and Plan 3 are accounted for in the same pension trust fund. All assets of this Plan 2/3 may legally be used to pay the defined benefits of any of the Plan 2 or Plan 3 members or beneficiaries, as defined by the terms of the plan. Therefore, Plan 2/3 is considered to be a single plan for accounting purposes.
PERS Plan 1 and Plan 2 retirement benefits are financed from a combination of investment earnings and employer and employee contributions. Employee contributions to the PERS Plan 1 and Plan 2 defined benefit plans accrue interest at a rate specified by the Director of DRS. During DRS’ Fiscal Year 2013, the rate was five and one-half percent compounded quarterly. Members in PERS Plan 1 and Plan 2 can elect to withdraw total employee contributions and interest thereon, in lieu of any retirement benefit, upon separation from PERS-covered employment.
PERS Plan 1 members are vested after the completion of five years of eligible service.
PERS Plan 1 members are eligible for retirement from active status at any age with at least 30 years of service, at age 55 with 25 years of service, or at age 60 with at least 5 years of service. Plan 1 members retiring from inactive status prior to the age of 65 may receive actuarially reduced benefits.
The monthly benefit is 2 percent of the average final compensation (AFC) per year of service, but the benefit may not exceed 60 percent of the AFC. The AFC is the monthly average of the 24 consecutive highest-paid service credit months.
PERS Plan 1 retirement benefits are actuarially reduced to reflect the choice, if made, of a survivor option.
Plan 1 members may elect to receive an optional COLA that provides an automatic annual adjustment based on the Consumer Price Index. The adjustment is capped at 3 percent annually. To offset the cost of this annual adjustment, the benefit is reduced.
PERS Plan 1 provides duty and non-duty disability benefits. Duty disability retirement benefits for disablement prior to the age of 60 consist of a temporary life annuity. The benefit amount is $350 a month, or two-thirds of the monthly AFC, whichever is less. The benefit is reduced by any workers’ compensation benefit and is payable as long as the member remains disabled or until the member attains the age of 60, at which time the benefit is converted to the member’s service retirement amount.
A member with five years of covered employment is eligible for non-duty disability retirement. Prior to the age of 55, the benefit amount is 2 percent of the AFC for each year of service reduced by 2 percent for each year that the member’s age is less than 55. The total benefit is limited to 60 percent of the AFC and is actuarially reduced to reflect the choice of a survivor option. Plan 1 members may elect to receive an optional COLA amount (based on the Consumer Price Index), capped at 3 percent annually. To offset the cost of this annual adjustment, the benefit is reduced.
PERS Plan 2 members are vested after the completion of five years of eligible service. Plan 2 members are eligible for normal retirement at the age of 65 with five years of service. The monthly benefit is 2 percent of the AFC per year of service. The AFC is the monthly average of the 60 consecutive highest-paid service months. There is no cap on years of service credit; and a cost-of-living allowance is granted (based on the Consumer Price Index), capped at 3 percent annually.
PERS Plan 2 members who have at least 20 years of service credit, and are 55 years of age or older, are eligible for early retirement with a reduced benefit. The benefit is reduced by an early retirement factor (ERF) that varies according to age, for each year before age 65.
60 2014 COMPREHENSIVE ANNUAL FINANCIAL REPORT
CITY OF POULSBO FINANCIAL SECTION

PERS Plan 2 members who have 30 or more years of service credit and are at least 55 years old can retire under one of two provisions, if hired prior to May 1, 2013:
• With a benefit that is reduced by 3 percent for each year before age 65; or
• With a benefit that has a smaller (or no) reduction (depending on age) that imposes stricter return-to-work rules.
PERS Plan 2 members hired on or after May 1, 2013 have the option to retire early by accepting a reduction of 5 percent for each year of retirement before age 65. This option is available only to those who are age 55 or older and have at least 30 years of service.
PERS Plan 2 retirement benefits are actuarially reduced to reflect the choice, if made, of a survivor option.
PERS Plan 3 has a dual benefit structure. Employer contributions finance a defined benefit component and member contributions finance a defined contribution component. As established by Chapter 41.34 RCW, employee contribution rates to the defined contribution component range from 5 percent to 15 percent of salaries, based on member choice. Members who do not choose a contribution rate default to a 5 percent rate. There are currently no requirements for employer contributions to the defined contribution component of PERS Plan 3.
PERS Plan 3 defined contribution retirement benefits are dependent upon the results of investment activities. Members may elect to self-direct the investment of their contributions. Any expenses incurred in conjunction with self-directed investments are paid by members. Absent a member’s self-direction, PERS Plan 3 contributions are invested in the Retirement Strategy Fund that assumes the member will retire at age 65.
For DRS’ Fiscal Year 2013, PERS Plan 3 employee contributions were $99.0 million, and plan refunds paid out were $69.4 million.
The defined benefit portion of PERS Plan 3 provides members a monthly benefit that is 1 percent of the AFC per year of service. The AFC is the monthly average of the 60 consecutive highest-paid service months. There is no cap on years of service credit, and Plan 3 provides the same cost-of-living allowance as Plan 2.
Effective June 7, 2006, PERS Plan 3 members are vested in the defined benefit portion of their plan after ten years of service; or after five years of service, if twelve months of that service are earned after age 44; or after five service credit years earned in PERS Plan 2 by June 1, 2003. Plan 3 members are immediately vested in the defined contribution portion of their plan.
Vested Plan 3 members are eligible for normal retirement at age 65, or they may retire early with the following conditions and benefits:
• If they have at least ten service credit years and are 55 years old, the benefit is reduced by an ERF that varies with age, for each year before age 65.
• If they have 30 service credit years and are at least 55 years old, and were hired before May 1, 2013, they have the choice of a benefit that is reduced by 3 percent for each year before age 65; or a benefit with a smaller (or no) reduction factor (depending on age) that imposes stricter return-to-work rules.
• If they have 30 service credit years, are at least 55 years old, and were hired after May 1, 2013, they have the option to retire early by accepting a reduction of 5 percent for each year before age 65.
PERS Plan 3 benefits are actuarially reduced to reflect the choice, if made, of a survivor option.
PERS Plan 2 and Plan 3 provide disability benefits. There is no minimum amount of service credit required for eligibility. The Plan 2 monthly benefit amount is 2 percent of the AFC per year of service. For Plan 3, the monthly benefit amount is 1 percent of the AFC per year of service. These disability benefit amounts are actuarially reduced for each year that the member’s age is less than 65, and to reflect the choice of a survivor option. There is no cap on years of service credit, and a cost-of-living allowance is granted (based on the Consumer Price Index) capped at 3 percent annually.
PERS members meeting specific eligibility requirements have options available to enhance their retirement benefits. Some of these options are available to their survivors.
2014 COMPREHENSIVE ANNUAL FINANCIAL REPORT 61
CITY OF POULSBO FINANCIAL SECTION
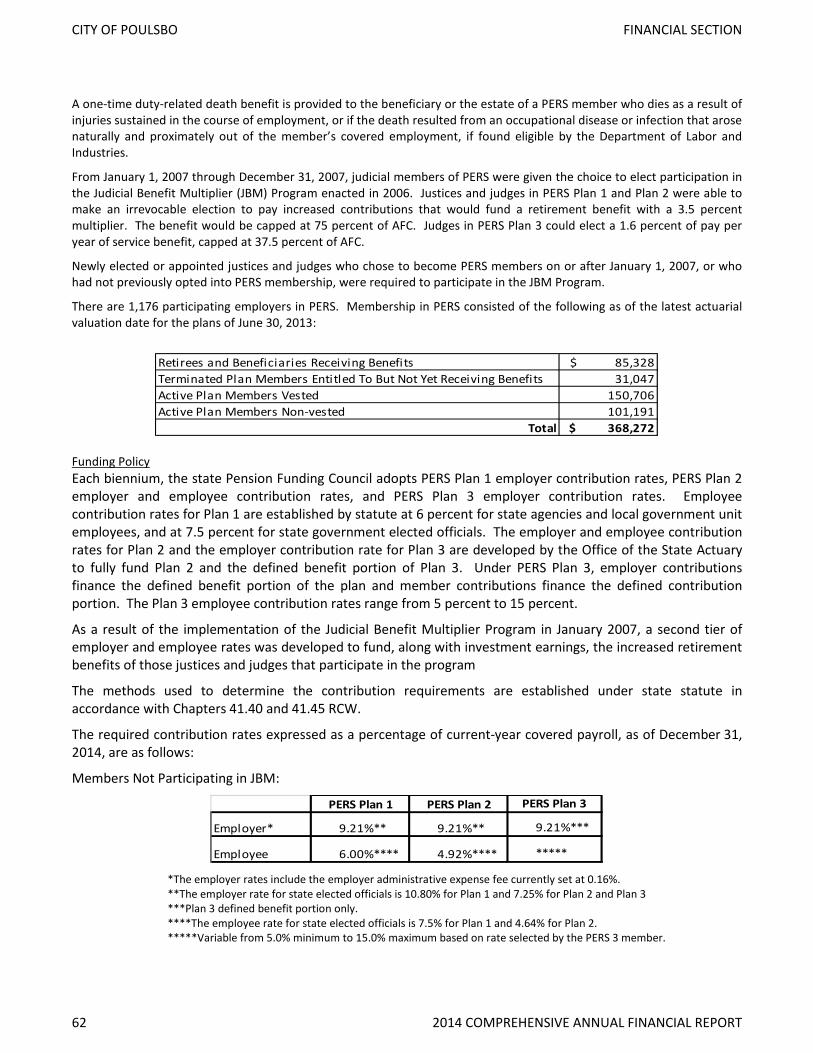
A one-time duty-related death benefit is provided to the beneficiary or the estate of a PERS member who dies as a result of injuries sustained in the course of employment, or if the death resulted from an occupational disease or infection that arose naturally and proximately out of the member’s covered employment, if found eligible by the Department of Labor and Industries.
From January 1, 2007 through December 31, 2007, judicial members of PERS were given the choice to elect participation in the Judicial Benefit Multiplier (JBM) Program enacted in 2006. Justices and judges in PERS Plan 1 and Plan 2 were able to make an irrevocable election to pay increased contributions that would fund a retirement benefit with a 3.5 percent multiplier. The benefit would be capped at 75 percent of AFC. Judges in PERS Plan 3 could elect a 1.6 percent of pay per year of service benefit, capped at 37.5 percent of AFC.
Newly elected or appointed justices and judges who chose to become PERS members on or after January 1, 2007, or who had not previously opted into PERS membership, were required to participate in the JBM Program.
There are 1,176 participating employers in PERS. Membership in PERS consisted of the following as of the latest actuarial valuation date for the plans of June 30, 2013:
$ 85,328 31,047 150,706 101,191 $ 368,272
Retirees and Beneficiaries Receiving BenefitsTerminated Plan Members Entitled To But Not Yet Receiving BenefitsActive Plan Members VestedActive Plan Members Non-vested
Total Funding Policy Each biennium, the state Pension Funding Council adopts PERS Plan 1 employer contribution rates, PERS Plan 2 employer and employee contribution rates, and PERS Plan 3 employer contribution rates. Employee contribution rates for Plan 1 are established by statute at 6 percent for state agencies and local government unit employees, and at 7.5 percent for state government elected officials. The employer and employee contribution rates for Plan 2 and the employer contribution rate for Plan 3 are developed by the Office of the State Actuary to fully fund Plan 2 and the defined benefit portion of Plan 3. Under PERS Plan 3, employer contributions finance the defined benefit portion of the plan and member contributions finance the defined contribution portion. The Plan 3 employee contribution rates range from 5 percent to 15 percent.
As a result of the implementation of the Judicial Benefit Multiplier Program in January 2007, a second tier of employer and employee rates was developed to fund, along with investment earnings, the increased retirement benefits of those justices and judges that participate in the program
The methods used to determine the contribution requirements are established under state statute in accordance with Chapters 41.40 and 41.45 RCW.
The required contribution rates expressed as a percentage of current-year covered payroll, as of December 31, 2014, are as follows:
Members Not Participating in JBM:
PERS Plan 1 PERS Plan 2 PERS Plan 3
Employer* 9.21%** 9.21%** 9.21%***
Employee 6.00%**** 4.92%**** ***** *The employer rates include the employer administrative expense fee currently set at 0.16%. **The employer rate for state elected officials is 10.80% for Plan 1 and 7.25% for Plan 2 and Plan 3 ***Plan 3 defined benefit portion only. ****The employee rate for state elected officials is 7.5% for Plan 1 and 4.64% for Plan 2. *****Variable from 5.0% minimum to 15.0% maximum based on rate selected by the PERS 3 member.
62 2014 COMPREHENSIVE ANNUAL FINANCIAL REPORT
CITY OF POULSBO FINANCIAL SECTION

Members Participating in JBM: PERS Plan 1 PERS Plan 2 PERS Plan 3
Employer-State Agency* 11.71% 11.71% 11.71%Employer-Local Govt.* 9.21% 9.21% 9.21%Employee-State Agency 9.76% 9.80% 7.50%***Employee- Local Govt. 12.26% 12.30% 7.50%***
*The employer rates include the employer administrative expense fee currently set at 0.16%. **Plan 3 defined benefit portion only. ***Minimum rate.
Both the City of Poulsbo and its employees made the required contributions. The City of Poulsbo’s required contributions for the years ending December 31 were as follows:
PERS Plan 2 PERS Plan 32014 301,935$ $ 81,593 2013 255,032$ $ 75,783 2012 216,648$ $ 64,115
C. LAW ENFORCEMENT OFFICERS AND FIRE FIGHTERS RETIREMENT SYSTEM (LEOFF)
Plan Description: LEOFF was established in 1970 by the Legislature. Membership includes all full-time, fully compensated, local law enforcement commissioned officers, firefighters and, as of July 24, 2005, emergency medical technicians. LEOFF membership is comprised primarily of non-state employees, with Department of Fish and Wildlife enforcement officers, who were first included effective July 27, 2003, being an exception. LEOFF retirement benefit provisions are established in chapter 41.26 RCW and may be amended only by the State Legislature.
LEOFF is a cost-sharing multiple-employer retirement system comprised of two separate defined benefit plans. LEOFF members who joined the system by September 30, 1977 are Plan 1 members. Those who joined on or after October 1, 1977 are Plan 2 members.
Effective July 1, 2003, the LEOFF Plan 2 Retirement Board was established by Initiative 790 to provide governance of LEOFF Plan 2. The Board’s duties include adopting contribution rates and recommending policy changes to the Legislature.
LEOFF retirement benefits are financed from a combination of investment earnings, employer and employee contributions, and a special funding situation in which the state pays through legislative appropriations. Employee contributions to the LEOFF Plan 1 and Plan 2 defined benefit plans accrue interest at a rate specified by the Director of DRS. During DRS’ Fiscal Year 2013, the rate was five and one-half percent compounded quarterly. Members in LEOFF Plan 1 and Plan 2 can elect to withdraw total employee contributions and interest earnings, in lieu of any retirement benefit, upon separation from LEOFF-covered employment.
LEOFF Plan 1 members are vested after the completion of five years of eligible service. Plan 1 members are eligible for retirement with five years of service at the age of 50.
The benefit per year of service calculated as a percent of final average salary (FAS) is as follows:
Term of Service20 or more years
10 but less than 20 years5 but less than 10 years
Percent of Final Average2.0%1.5%1.0%
The FAS is the basic monthly salary received at the time of retirement, provided a member has held the same position or rank for 12 months preceding the date of retirement. Otherwise, it is the average of the highest consecutive 24 months’ salary within the last 10 years of service. A cost-of-living allowance is granted (based on the Consumer Price Index).
2014 COMPREHENSIVE ANNUAL FINANCIAL REPORT 63
CITY OF POULSBO FINANCIAL SECTION

LEOFF Plan 1 provides death and disability benefits. Death benefits for survivors of Plan 1 members on active duty consist of the following: (1) If there is an eligible spouse, 50 percent of the FAS, plus 5 percent of the FAS for each eligible surviving child, with a limitation on the combined benefit of 60 percent of the FAS; or (2) If there is no eligible spouse, eligible children receive 30 percent of the FAS for the first child plus 10 percent for each additional child, subject to a 60 percent limitation of the FAS, divided equally.
A one-time duty-related death benefit is provided to the beneficiary or the estate of a LEOFF Plan 1 member who dies as a result of injuries or illness sustained in the course of employment, or if the death resulted from an occupational disease or infection that arose naturally and proximately out of the member’s covered employment, if found eligible by the Department of Labor and Industries.
The LEOFF Plan 1 disability benefit is 50 percent of the FAS plus 5 percent for each child up to a maximum of 60 percent. Upon recovery from disability before the age of 50, a member is restored to service with full credit for service while disabled. Upon recovery after the age of 50, the benefit continues as the greater of the member’s disability benefit or service retirement benefit.
LEOFF Plan 2 members are vested after the completion of five years of eligible service.
Plan 2 members are eligible for retirement at the age of 53 with five years of service, or at age 50 with 20 years of service. Plan 2 members receive a benefit of 2 percent of the FAS per year of service (the FAS is based on the highest consecutive 60 months), actuarially reduced to reflect the choice of a survivor option. Members who retire prior to the age of 53 receive reduced benefits. If the member has at least 20 years of service and is age 50, the reduction is 3 percent for each year prior to age 53. Otherwise, the benefits are actuarially reduced for each year prior to age 53. A cost-of-living allowance is granted (based on the Consumer Price Index), capped at 3 percent annually.
LEOFF Plan 2 provides disability benefits. There is no minimum amount of service credit required for eligibility. The Plan 2 benefit amount is 2 percent of the FAS for each year of service. Benefits are reduced to reflect the choice of survivor option and for each year that the member’s age is less than 53, unless the disability is duty-related. If the member has at least 20 years of service and is age 50, the reduction is 3 percent for each year prior to age 53.
A disability benefit equal to 70 percent of their FAS, subject to offsets for workers’ compensation and Social Security disability benefits received, is also available to those LEOFF Plan 2 members who are catastrophically disabled in the line of duty and incapable of future substantial gainful employment in any capacity. Effective June 2010, benefits to LEOFF Plan 2 members who are catastrophically disabled include payment of eligible health care insurance premiums.
Members of LEOFF Plan 2 who leave service because of a line of duty disability are allowed to withdraw 150 percent of accumulated member contributions. This withdrawal benefit is not subject to federal income tax. Alternatively, members of LEOFF Plan 2 who leave service because of a line of duty disability may be eligible to receive a retirement benefit of at least 10 percent of FAS and 2 percent per year of service beyond five years. The first 10 percent of the FAS is not subject to federal income tax.
LEOFF Plan 2 retirees may return to work in an eligible position covered by another retirement system, choose membership in that system and suspend their pension benefits, or not choose membership and continue receiving pension benefits without interruption.
A one-time duty-related death benefit is provided to the beneficiary or the estate of a LEOFF Plan 2 member who dies as a result of injuries or illness sustained in the course of employment, or if the death resulted from an occupational disease or infection that arose naturally and proximately out of the member’s covered employment, if found eligible by the Department of Labor and Industries.
Benefits to eligible surviving spouses and dependent children of LEOFF Plan 2 members killed in the course of employment include the payment of eligible health care insurance premiums.
Legislation passed in 2009 provides to the Washington state registered domestic partners of LEOFF Plan 2 members the same treatment as married spouses, to the extent that the treatment is not in conflict with federal laws.
LEOFF members meeting specific eligibility requirements have options available to enhance their retirement benefits. Some of these options are available to their survivors
64 2014 COMPREHENSIVE ANNUAL FINANCIAL REPORT
CITY OF POULSBO FINANCIAL SECTION

There are 374 participating employers in LEOFF. Membership in LEOFF consisted of the following as of the latest actuarial valuation date for the plans of June 30, 2013:
$ 10,511 699 16,830 1,600 $ 29,640
Retirees and Beneficiaries Receiving BenefitsTerminated Plan Members Entitled To But Not Yet Receiving BenefitsActive Plan Members VestedActive Plan Members Non-vested
Total
Funding Policy: Employer and employee contribution rates are developed by the Office of the State Actuary to fully fund the plans. Starting on July 1, 2000, Plan 1 employers and employees contribute zero percent, as long as the plan remains fully funded. Plan 2 employers and employees are required to pay at the level adopted by the LEOFF Plan 2 Retirement Board.
The Legislature, by means of a special funding arrangement, appropriates money from the state General Fund to supplement the current service liability and fund the prior service costs of Plan 2 in accordance with the recommendations of the Pension Funding Council and the LEOFF Plan 2 Retirement Board. This special funding situation is not mandated by the state constitution and could be changed by statute. For DRS’ Fiscal Year 2014, the state contributed $55.6 million to LEOFF Plan 2.
The methods used to determine the contribution requirements are established under state statute in accordance with Chapters 41.26 and 41.45 RCW.
The required contribution rates expressed as a percentage of current-year covered payrolls, as of December 31, 2014 were as follows:
LEOFF Plan 1 LEOFF Plan 2Employer* 0.18% 5.23%**Employee 0.00% 8.41%State n/a 3.36%
*The employer rates include the employer administrative expense fee currently set at 0.18% ** The employer rate for ports and universities is 8.59%
Both the City of Poulsbo and the employees made the required contributions. The City of Poulsbo’s required contributions for the years ending December 31 were as follows:
LEOFF Plan 1 LEOFF Plan 22014 -$ 81,201$ 2013 -$ 71,335$ 2012 -$ 72,623$
NOTE 7: RISK MANAGEMENT
At the beginning of 2014, The City of Poulsbo changed coverage by terminating membership with the Association of Washington Cities Risk Management Service Agency (AWC RMSA) and became a member of the Washington Cities Insurance Authority (WCIA). There are no outstanding or reported potential claims that would be covered under AWC RMSA.
Utilizing Chapter 48.62 RCW (self-insurance regulation) and Chapter 39.34 RCW (Interlocal Cooperation Act), nine cities originally formed WCIA on January 1, 1981. WCIA was created for the purpose of providing a pooling mechanism for jointly purchasing insurance, jointly self-insuring, and/or jointly contracting for risk management services. WCIA has a total of 175 Members.
New members initially contract for a three-year term, and thereafter automatically renew on an annual basis. A one-year
2014 COMPREHENSIVE ANNUAL FINANCIAL REPORT 65
CITY OF POULSBO FINANCIAL SECTION

withdrawal notice is required before membership can be terminated. Termination does not relieve a former member from its unresolved loss history incurred during membership.
Liability coverage is written on an occurrence basis, without deductibles. Coverage includes general, automobile, police, public officials’ errors or omissions, stop gap, and employee benefits liability. Limits are $4 million per occurrence self insured layer, and $16 million per occurrence in the re-insured excess layer. The excess layer is insured by the purchase of reinsurance and insurance and is subject to aggregate limits. Total limits are $20 million per occurrence subject to aggregate sublimits in the excess layers. The Board of Directors determines the limits and terms of coverage annually.
Insurance coverage for property, automobile physical damage, fidelity, inland marine, and boiler and machinery are purchased on a group basis. Various deductibles apply by type of coverage. Property insurance and auto physical damage are self-funded from the members’ deductible to $750,000, for all perils other than flood and earthquake, and insured above that amount by the purchase of insurance.
In-house services include risk management consultation, loss control field services, claims and litigation administration, and loss analyses. WCIA contracts for the claims investigation consultants for personnel issues and land use problems, insurance brokerage, and lobbyist services.
WCIA is fully funded by its members, who make annual assessments on a prospectively rated basis, as determined by an outside, independent actuary. The assessment covers loss, loss adjustment, and administrative expenses. As outlined in the interlocal, WCIA retains the right to additionally assess the membership for any funding shortfall.
The City has not had any settlement exceeding the insurance coverage over the past three years.
An investment committee, using investment brokers, produces additional revenue by investment of WCIA’s assets in financial instruments which comply with all State guidelines.
A Board of Directors governs WCIA, which is comprised of one designated representative from each member. The Board elects an Executive Committee and appoints a Treasurer to provide general policy direction for the organization. The WCIA Executive Director reports to the Executive Committee and is responsible for conducting the day to day operations of WCIA.
NOTE 8: ADOPTION OF NEW GASB PRONOUNCEMENTS
GASB Statement No. 67 Financial Reporting for Pension Plans- This Statement was implemented by Washington State Department of Retirement Systems who administers the cost-sharing multiple-employer public employee defined benefit retirement plan the City participates in. There are no changes to be implemented in City of Poulsbo’s financial statements.
NOTE 9: FUTURE ADOPTION OF GASB PRONOUNCEMENTS
The following GASB pronouncements have been issued, but are not yet effective at December 31, 2014: • GASB Statement No. 68 Accounting and Financial Reporting for Pensions an amendment of GASB Statement No.
27- The primary objective of this Statement is to improve accounting and financial reporting by state and local governments for pensions. It also improves information provided by state and local governmental employers about financial support for pensions that is provided by other entities.
• GASB Statement No. 71 Pension Transition for Contributions Made Subsequent to the Measurement Date—an amendment of GASB Statement No. 68-The objective of this Statement is to address an issue regarding application of the transition provisions of Statement No. 68, Accounting and Financial Reporting for Pensions. The issue relates to amounts associated with contributions, if any, made by a state or local government employer or nonemployer contributing entity to a defined benefit pension plan after the measurement date of the government’s beginning net pension liability.
• GASB Statement No. 72 Fair Value Measurement and Application- The objective of this Statement is to provide guidance for determining a fair value measurement for financial reporting purposes. This Statement also provides guidance for applying fair value to certain investments and disclosures related to all fair value measurements.
The City of Poulsbo will implement the new GASB pronouncements in the fiscal year no later than the required effective
66 2014 COMPREHENSIVE ANNUAL FINANCIAL REPORT
CITY OF POULSBO FINANCIAL SECTION
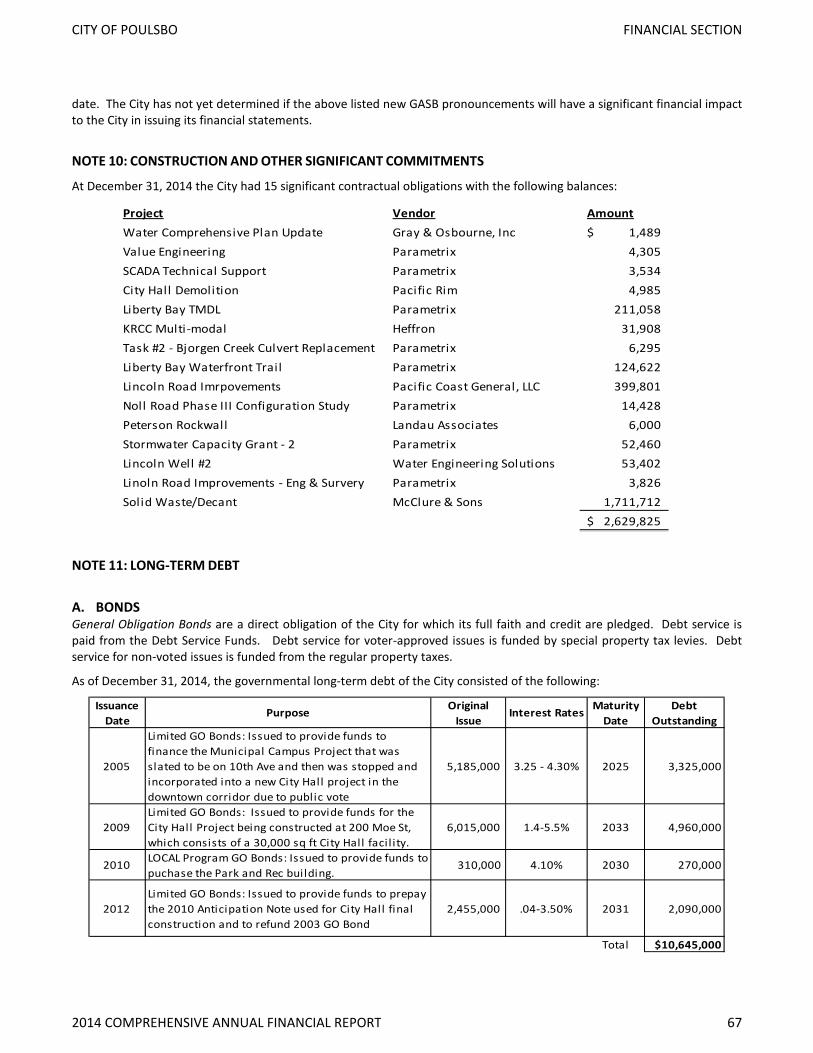
date. The City has not yet determined if the above listed new GASB pronouncements will have a significant financial impact to the City in issuing its financial statements.
NOTE 10: CONSTRUCTION AND OTHER SIGNIFICANT COMMITMENTS
At December 31, 2014 the City had 15 significant contractual obligations with the following balances:
Project Vendor AmountWater Comprehensive Plan Update Gray & Osbourne, Inc 1,489$ Value Engineering Parametrix 4,305 SCADA Technical Support Parametrix 3,534 City Hall Demolition Pacific Rim 4,985 Liberty Bay TMDL Parametrix 211,058 KRCC Multi-modal Heffron 31,908 Task #2 - Bjorgen Creek Culvert Replacement Parametrix 6,295 Liberty Bay Waterfront Trail Parametrix 124,622 Lincoln Road Imrpovements Pacific Coast General, LLC 399,801 Noll Road Phase III Configuration Study Parametrix 14,428 Peterson Rockwall Landau Associates 6,000 Stormwater Capacity Grant - 2 Parametrix 52,460 Lincoln Well #2 Water Engineering Solutions 53,402 Linoln Road Improvements - Eng & Survery Parametrix 3,826 Solid Waste/Decant McClure & Sons 1,711,712
2,629,825$
NOTE 11: LONG-TERM DEBT
A. BONDS General Obligation Bonds are a direct obligation of the City for which its full faith and credit are pledged. Debt service is paid from the Debt Service Funds. Debt service for voter-approved issues is funded by special property tax levies. Debt service for non-voted issues is funded from the regular property taxes.
As of December 31, 2014, the governmental long-term debt of the City consisted of the following:
Issuance Date
Purpose Original Issue
Interest Rates Maturity Date
Debt Outstanding
2005
Limited GO Bonds: Issued to provide funds to finance the Municipal Campus Project that was slated to be on 10th Ave and then was stopped and incorporated into a new City Hall project in the downtown corridor due to public vote
5,185,000 3.25 - 4.30% 2025 3,325,000
2009Limited GO Bonds: Issued to provide funds for the City Hall Project being constructed at 200 Moe St, which consists of a 30,000 sq ft City Hall facil ity.
6,015,000 1.4-5.5% 2033 4,960,000
2010 LOCAL Program GO Bonds: Issued to provide funds to puchase the Park and Rec building.
310,000 4.10% 2030 270,000
2012Limited GO Bonds: Issued to provide funds to prepay the 2010 Anticipation Note used for City Hall final construction and to refund 2003 GO Bond
2,455,000 .04-3.50% 2031 2,090,000
Total $10,645,000
2014 COMPREHENSIVE ANNUAL FINANCIAL REPORT 67
CITY OF POULSBO FINANCIAL SECTION

Revenue Bonds are payable from revenues generated by the Water/Sewer Enterprise Fund. As of December 31, 2014, the long-term debt payable from proprietary fund resources consisted of the following:
Issuance Date
Purpose Original Issue Interest Rates Maturity Date
Debt Outstanding
2005 Refunding of 1998 Water/Sewer Revenue Bonds 3,134,000 3.45% 2017 1,375,000 Total 1,375,000$
B. PUBLIC WORKS TRUST FUND LOANS State of Washington Public Works Trust Fund Loans (PWTF) are an intergovernmental loan from the Public Works Board to undertake local public works projects. These loans are a direct responsibility of the City. Poulsbo currently has two such loans. The first PWTF loan of $869,025, which is being repaid from the Water/Sewer Fund, was used for the Jensen Way sewer improvements. The second PWTF loan of $1,406,930 which will be repaid from governmental funds, is for Front Street reconstruction.
As of December 31, 2014, the long-term debt payable for PWTF loans consisted of the following:
Issuance Date
Purpose Original Issue Interest Rates Maturity Date
Debt Outstanding
1995 Sewer Improvements to Jensen Way $ 869,025 3.0% 2015 $ 45,848 2000 Street Improvements to Front Street 1,406,930 3.0% 2020 446,210
Total 492,058$
C. NOTES PAYABLE In March 2009 the City negotiated an agreement to pay Olhava Associates, LP for the City’s share of the Bond Road pump station and force main improvements needed for the College Market Place Development. It is intended as an addendum to the Olhava Development Agreement entered into between the parties in April 2004. The total cost of the improvement was $ 5,101,894. The parties agreed Olhava Associates, LP’s share is $ 2,959,098 and the City of Poulsbo’s share was $2,142,796. The original agreement stated reimbursement would be paid with no interest applied and by using sewer connections fees collected from those whose properties benefited with the completed improvement. As of December, 2014 the City has paid $ 1,311,742.
D. DEBT SERVICE REQUIREMENTS TO MATURITY FOR PRIMARY GOVERNMENT
Principal Interest Total Principal Interest Total2015 620,000 448,300 1,068,300 443,000 47,438 490,438 2016 630,000 428,995 1,058,995 457,000 32,154 489,154 2017 655,000 408,933 1,063,933 475,000 16,388 491,388 2018 575,000 387,428 962,428 - - - 2019 595,000 365,976 960,976
2020-2024 3,340,000 1,457,194 4,797,194 - - - 2025-2029 2,490,000 775,223 3,265,223 - - - 2030-2033 1,740,000 219,875 1,959,875 - - -
10,645,000$ 4,491,923$ 15,136,923$ 1,375,000$ 95,979$ 1,470,979$
Year Ended Dec 31
General Obligation BondsGovernmental Activities
Revenue Bonds Business-Type Activities
68 2014 COMPREHENSIVE ANNUAL FINANCIAL REPORT
CITY OF POULSBO FINANCIAL SECTION

Principal Interest Total Principal Interest Total2015 74,368 13,386 87,755 45,848 1,375 47,223 2016 74,368 11,155 85,524 - - - 2017 74,368 8,924 83,292 - - - 2018 74,368 6,693 81,061 - - - 2019 74,368 4,462 78,830 - - - 2020 74,368 2,231 76,599 - - -
446,210$ 46,852$ 493,062$ 45,848$ 1,375$ 47,223$
Year Ended Dec 31
Public Works Trust Fund LoansGovernmental Activities Business-Type Activities
E. Arbitrage Rebate Rebatable arbitrage is defined by the Internal Revenue Service Code Section 148 as earnings on investments purchased from the gross proceeds of a bond issue that are in excess of the amount that would have been earned if the investments were invested at a yield equal to the yield on the bond issue. The rebatable arbitrage must be paid to the federal government. The City of Poulsbo monitors its investments to restrict earnings to a yield less than the bond issue, and therefore limit any arbitrage liability. As of December 31, 2014 the City has no arbitrage rebate liability.
F. LONG-TERM LIABILITIES
1. Long-term liability activity:
Beginning EndingBalance Additions Reductions Balance
Governmental ActivitiesBonds payable:General obligation bonds 11,160,000$ -$ 515,000$ 10,645,000$ Less Unamortized Bond Discount (50,408) - (4,595) (45,813) Plus Unamortized Bond Premium 124,380 - 9,803 114,577 Compensated Absences 714,458 554,861 493,537 775,782 Due to Other Governmental Units 520,578 - 74,368 446,210 Misc NonCurrent Liabil ity 183,290 47,168 - 230,459 Total Governmental activity long-term liabilities 12,652,298$ 602,029$ 1,088,112$ 12,166,214$
Business-type ActivitiesBonds payable:Revenue Bonds 1,804,000$ -$ 429,000$ 1,375,000$ Compensated Absences 137,103 101,678 99,733 139,048 Notes Payable 843,931 - 34,828 809,103 Due to Other Governmental Units 91,696 - 45,848 45,848 Total Business-type activity long-term liabilities 2,876,729$ 101,678$ 609,408$ 2,368,999$
2014 COMPREHENSIVE ANNUAL FINANCIAL REPORT 69
CITY OF POULSBO FINANCIAL SECTION
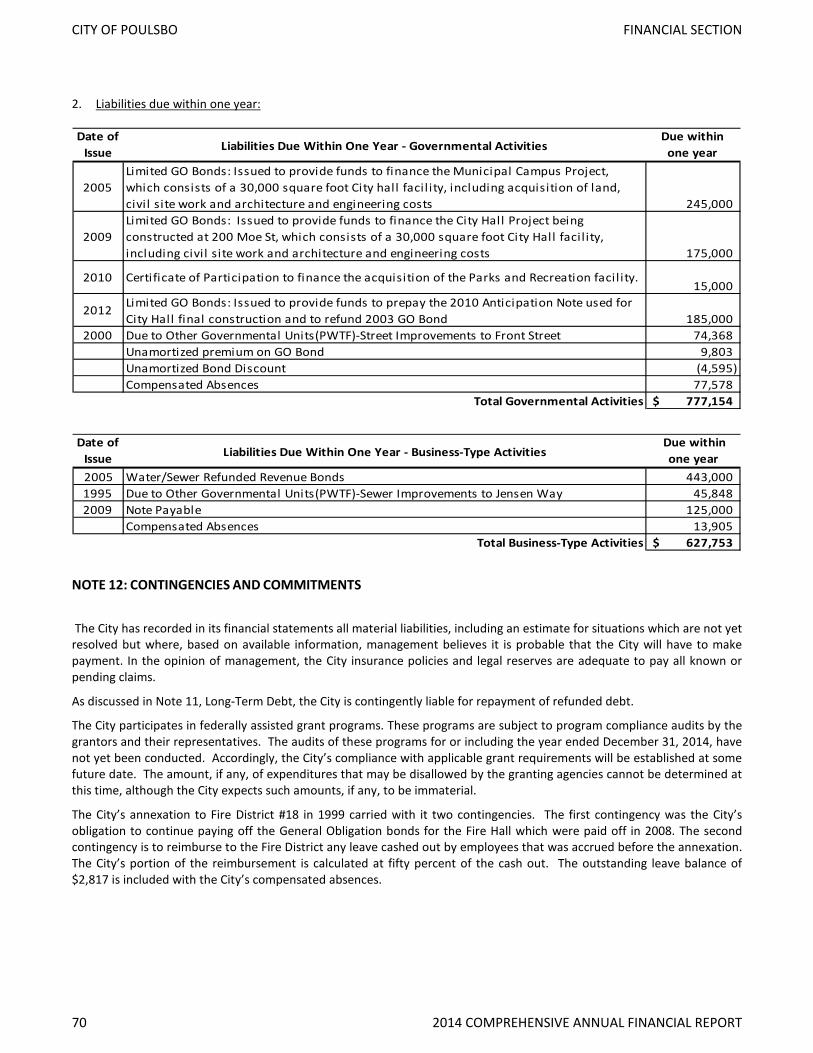
2. Liabilities due within one year:
Date of Issue Liabilities Due Within One Year - Governmental Activities
Due within one year
2005Limited GO Bonds: Issued to provide funds to finance the Municipal Campus Project, which consists of a 30,000 square foot City hall facil ity, including acquisition of land, civil site work and architecture and engineering costs 245,000
2009Limited GO Bonds: Issued to provide funds to finance the City Hall Project being constructed at 200 Moe St, which consists of a 30,000 square foot City Hall facil ity, including civil site work and architecture and engineering costs 175,000
2010 Certificate of Participation to finance the acquisition of the Parks and Recreation facil ity.15,000
2012 Limited GO Bonds: Issued to provide funds to prepay the 2010 Anticipation Note used for City Hall final construction and to refund 2003 GO Bond 185,000
2000 Due to Other Governmental Units(PWTF)-Street Improvements to Front Street 74,368 Unamortized premium on GO Bond 9,803 Unamortized Bond Discount (4,595) Compensated Absences 77,578
Total Governmental Activities 777,154$
Date of Issue Liabilities Due Within One Year - Business-Type Activities
Due within one year
2005 Water/Sewer Refunded Revenue Bonds 443,000 1995 Due to Other Governmental Units(PWTF)-Sewer Improvements to Jensen Way 45,848 2009 Note Payable 125,000
Compensated Absences 13,905 Total Business-Type Activities 627,753$
NOTE 12: CONTINGENCIES AND COMMITMENTS
The City has recorded in its financial statements all material liabilities, including an estimate for situations which are not yet resolved but where, based on available information, management believes it is probable that the City will have to make payment. In the opinion of management, the City insurance policies and legal reserves are adequate to pay all known or pending claims.
As discussed in Note 11, Long-Term Debt, the City is contingently liable for repayment of refunded debt.
The City participates in federally assisted grant programs. These programs are subject to program compliance audits by the grantors and their representatives. The audits of these programs for or including the year ended December 31, 2014, have not yet been conducted. Accordingly, the City’s compliance with applicable grant requirements will be established at some future date. The amount, if any, of expenditures that may be disallowed by the granting agencies cannot be determined at this time, although the City expects such amounts, if any, to be immaterial.
The City’s annexation to Fire District #18 in 1999 carried with it two contingencies. The first contingency was the City’s obligation to continue paying off the General Obligation bonds for the Fire Hall which were paid off in 2008. The second contingency is to reimburse to the Fire District any leave cashed out by employees that was accrued before the annexation. The City’s portion of the reimbursement is calculated at fifty percent of the cash out. The outstanding leave balance of $2,817 is included with the City’s compensated absences.
70 2014 COMPREHENSIVE ANNUAL FINANCIAL REPORT
CITY OF POULSBO FINANCIAL SECTION

NOTE 13: JOINT VENTURES
The City, Kitsap County, and the Kitsap Regional Library agreed back in 1997 to be jointly responsible for the improvement of the library with the City being the lead agency for the construction management. The City owns the building and grounds which is reflected in the Government‐Wide Statement of Net Position. The City is responsible for its continued maintenance and the Kitsap Regional Library is responsible for running the day to day operations of the library within the building.
Any capital improvements needed will be funded out of the Facilities Fund like all other City owned properties. Routine maintenance costs are funded out of the General Fund central services budget.
The financials for the Kitsap County Library Capital Facilities District are available at Kitsap County, Washington. County information can be obtained from their website at www.kitsapgov.com.
NOTE 14: POSTEMPLOYMENT BENEFITS OTHER THAN PENSIONS
Plan Description As required by the Revised Code of Washington (RCW) Chapter 41.26, the City provides lifetime medical care for members of the Law Enforcement Officers and Firefighters (LEOFF) retirement system hired before October 1, 1977 under a defined benefit healthcare plan administered by the City. The members necessary hospital, medical, and nursing care expenses not payable by worker’s compensation, social security, insurance provided by another employer, other pension plan, or any other similar source are covered. Most medical coverage for eligible retirees is provided by the City’s employee medical insurance program. Under the authorization of the LEOFF Disability Board, direct payment is made for other retiree medical expenses not covered by standard medical plan benefit provisions. A separate post employment benefit plan report is not available. As of December 31, 2014 the City has two retired members in this group.
Funding Policy Funding for LEOFF retiree healthcare costs is provided entirely by the City as required by RCW. The City currently funds post‐employment healthcare benefits on a pay‐as‐you‐go basis. The city finances the plan by purchasing medical insurance and self‐funding deductibles and co‐pays not covered by the insurance. The expenditures are budgeted in the Police annual operating budget. The city reimburses 100% of the amount of validated claims for medical, dental, vision and hospitalization costs incurred by the retirees.
Annual OPEB Cost and Net OPEB Obligation The City’s annual other post employment benefit (OPEB) cost is calculated based upon the annual required contribution (ARC), an amount actuarially determined in accordance with the parameters of GASB No. 45. The ARC represents a level of funding that if paid on an ongoing basis is projected to cover the normal cost each year and amortized any unfunded actuarial liabilities over a period of ten years as of December 31, 2014.
Actuarial Methods and Assumptions The City used the alternative measurement method permitted under GASB Statement No. 45. Actual retirement ages are used for the City’s two LEOFF members who benefit for the purpose of determining the Actuarial accrued liability (AAL) and normal cost. The mortality rate is assumed following the LEOFF 1 mortality rates used in the June 30, 2011 actuarial valuation report issued by the Office of the Washington State Actuary (OSA). Healthcare costs and trends were determined by Milliman and used by OSA in the state‐wide LEOFF 1 medical study performed in 2013 and using a 1% medical inflation rate. The results were based on grouped data with 4 active groupings and 4 inactive groupings. The actuarial cost method used to determine the AAL was Projected Unit Credit. The AAL and NOO are amortized on an open basis as a level dollar over 15 years with an annual budget growth of 2%. Since everything is paid as the expenses are incurred there are no investments held. These assumptions are individually and collectively reasonable for the purposes of this valuation.
2014 COMPREHENSIVE ANNUAL FINANCIAL REPORT 71
CITY OF POULSBO FINANCIAL SECTION

The following charts show the trends and assumptions used by Milliman in the assumptions:
Medical Long-Term Care
2012 7.0% 4.8%2013 7.5% 4.8%2014 6.2% 4.8%2015 5.8% 4.8%2016 5.7% 4.8%2017 12.9% 4.8%2018 6.3% 4.8%2019 6.5% 4.8%
2020+ 5.6% 4.8%
Medical Inflation Trend Over Age 65 w/Excise Tax
MedicalLong-Term Care2012 7.0% 4.8%
2013 7.5% 4.8%2014 6.2% 4.8%2015 5.8% 4.8%2016 5.7% 4.8%2017 24.7% 4.8%2018 6.2% 4.8%
Medical Inflation Trend Under Age 65 w/Excise Tax
Age Non-Medicare Medicare
57 $12,776 N/A62 $16,401 N/A67 N/A $10,94772 N/A $12,13477 N/A $13,13382 N/A $13,79187 N/A $14,119
Annual Medical Cost by Age
The following table shows the components of the City’s annual OPEB cost for the year, the amount actually contributed to the plan, and changes in the City’s net OPEB. The net OPEB obligation (NOO) of $230,458 is included as a non‐current liability on the Statement of Position.
Determination of Annual Required
Contribution:
Year Ending
2012
Year Ending
2013
Year Ending
2014
Normal Cost at Year End $0 $0 $0
Amorization of Unfunded Actuarial Accrued Liability (UAAL) 60,895 57,308 84,506
Annual Required Contribution $60,895 $57,308 $84,506
Determination of Net OPEB Obligation:
Annual Required Contribution $60,895 $57,308 $84,506
Interest prior year Net OPEB Obligation 6,161 7,233 7,332
Adjustments to ARC (12,747) (14,966) (16,485)
Annual OPEB Cost $54,309 $49,575 $75,352
Contributions (30,476) (27,017) (28,184)
Increase in Net OPEB Obligations $23,833 $22,558 $47,168
Net OPEB Obligation‐Beginning of Year $136,900 $160,732 $183,290
NET OPEB Obligation‐End of Year $160,732 $183,290 $230,458
The City’s OPEB cost, the percentage of OPEB cost contributed to the plan and the net OPEB obligation were as follows:
Year EndingAnnual OPEB
Cost
Contribution as a Percentage of
OPEB CostNet OPEB Obligation
12/31/2008 65,964 40.5% 39,244 12/31/2009 59,838 45.3% 71,962 12/31/2010 58,264 48.3% 102,080 12/31/2011 58,803 40.8% 136,900 12/31/2012 54,309 56.1% 160,732 12/31/2013 49,575 54.5% 183,290 12/31/2014 75,352 37.4% 230,458
Funded Status and Funding Progress As of December 31, 2014, the most recent actuarial valuation date, the plan was 0% funded. The actuarial accrued liability (AAL) for benefits was $939,567 and the actuarial value of the assets was $0 resulting in a UAAL of $939,567. Actuarial
72 2014 COMPREHENSIVE ANNUAL FINANCIAL REPORT
CITY OF POULSBO FINANCIAL SECTION
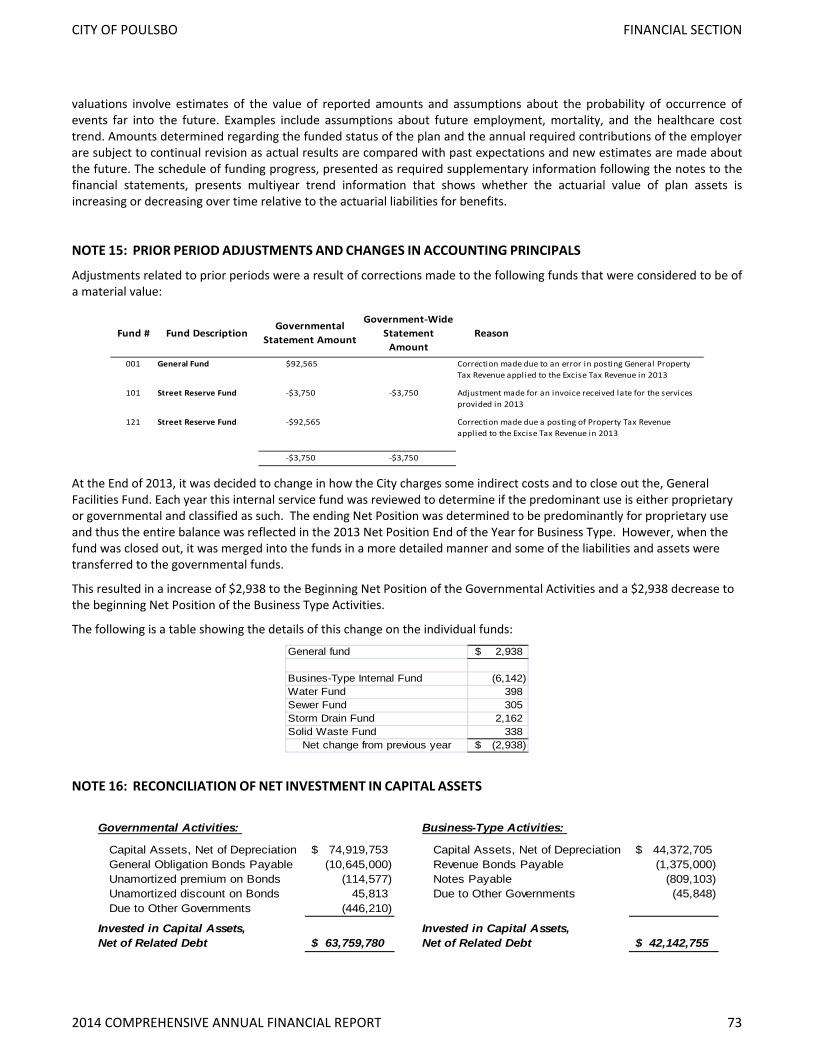
valuations involve estimates of the value of reported amounts and assumptions about the probability of occurrence of events far into the future. Examples include assumptions about future employment, mortality, and the healthcare cost trend. Amounts determined regarding the funded status of the plan and the annual required contributions of the employer are subject to continual revision as actual results are compared with past expectations and new estimates are made about the future. The schedule of funding progress, presented as required supplementary information following the notes to the financial statements, presents multiyear trend information that shows whether the actuarial value of plan assets is increasing or decreasing over time relative to the actuarial liabilities for benefits.
NOTE 15: PRIOR PERIOD ADJUSTMENTS AND CHANGES IN ACCOUNTING PRINCIPALS
Adjustments related to prior periods were a result of corrections made to the following funds that were considered to be of a material value:
Fund # Fund DescriptionGovernmental
Statement Amount
Government‐Wide
Statement
Amount
Reason
001 General Fund $92,565 Correction made due to an error in posting General Property Tax Revenue applied to the Excise Tax Revenue in 2013
101 Street Reserve Fund ‐$3,750 ‐$3,750 Adjustment made for an invoice received late for the services provided in 2013
121 Street Reserve Fund ‐$92,565 Correction made due a posting of Property Tax Revenue applied to the Excise Tax Revenue in 2013
‐$3,750 ‐$3,750 At the End of 2013, it was decided to change in how the City charges some indirect costs and to close out the, General Facilities Fund. Each year this internal service fund was reviewed to determine if the predominant use is either proprietary or governmental and classified as such. The ending Net Position was determined to be predominantly for proprietary use and thus the entire balance was reflected in the 2013 Net Position End of the Year for Business Type. However, when the fund was closed out, it was merged into the funds in a more detailed manner and some of the liabilities and assets were transferred to the governmental funds.
This resulted in a increase of $2,938 to the Beginning Net Position of the Governmental Activities and a $2,938 decrease to the beginning Net Position of the Business Type Activities.
The following is a table showing the details of this change on the individual funds:
General fund 2,938$
Busines-Type Internal Fund (6,142) Water Fund 398 Sewer Fund 305 Storm Drain Fund 2,162 Solid Waste Fund 338
Net change from previous year (2,938)$
NOTE 16: RECONCILIATION OF NET INVESTMENT IN CAPITAL ASSETS
Governmental Activities: Business-Type Activities:
Capital Assets, Net of Depreciation 74,919,753$ Capital Assets, Net of Depreciation 44,372,705$ General Obligation Bonds Payable (10,645,000) Revenue Bonds Payable (1,375,000) Unamortized premium on Bonds (114,577) Notes Payable (809,103) Unamortized discount on Bonds 45,813 Due to Other Governments (45,848) Due to Other Governments (446,210)
Invested in Capital Assets, Net of Related Debt $ 63,759,780
Invested in Capital Assets, Net of Related Debt $ 42,142,755
2014 COMPREHENSIVE ANNUAL FINANCIAL REPORT 73
CITY OF POULSBO FINANCIAL SECTION

UnfundedActuarial UAAL as a
Actuarial Actuarial Accrued PercentageActuarial Value of Accrued Liability Funded Covered of CoveredValuation Assets Liability (UAAL) Ratio Payroll Payroll
Date (a) (b) (b-a) (a/b) (c) [(b-a)/c]
12/31/2010 -$ 662,910$ 662,910$ 0% - N/A*
12/31/2011 -$ 684,261$ 684,261$ 0% - N/A*
12/31/2012 -$ 653,990$ 653,990$ 0% - N/A*
12/31/2013 -$ 939,567$ 939,567$ 0% - N/A*
12/31/2014 -$ 939,567$ 939,567$ 0% - N/A*
LEOFF I RETIREE MEDICAL BENEFITS
* Since the covered payroll is $0, the UAAL as a percentage of covered payroll cannot be defined
REQUIRED SUPPLEMENTARY INFORMATION
SCHEDULE OF FUNDING PROGRESSDecember 31, 2014
74 2014 COMPREHENSIVE ANNUAL FINANCIAL REPORT
CITY OF POULSBO FINANCIAL SECTION
NONMAJOR GOVERNMENTAL FUNDS Special Revenue Funds
Special Revenue Funds are established to account for the proceeds of specific revenue sources that are internally or legally restricted to expenditures for specific purposes.
The City Street Fund accounts for special revenue funds received to provide general governmental services for the administration and operation of street-oriented maintenance and repair.
The Capital Improvements Fund accounts for the receipt and expenditure of the first ¼ of 1% real estate excise tax authorized by State RCW 82.46. These revenues are dedicated for capital purposes defined in RCW 35.43.040, including public buildings and facilities.
The Transportation Development Fund accounts for all traffic and sidewalk mitigation fees collected from developers.
The Park Development Fund was established to account for park mitigation and impact fees paid by developers.
The Historic Downtown Poulsbo Association accounts for the assessments collected by the City for the use by the downtown business improvement area expenses to promote downtown business.
The Paths & Trails Fund receives its funding from the .5 of the State fuel taxes to be used specifically for paths and trails reserves.
The Drug Enforcement Fund accounts for monies and property seized during drug investigations per RCW 69.50.505. All monies paid into the funds are to be used by the police department for drug enforcement purposes.
The Transient Occupancy Fund accounts for the City’s share of the hotel-motel taxes for the purpose of promoting tourism.
The Police Restricted Fund accounts for various revenues to be used specifically for criminal justice activities.
Debt Service Funds
Debt Service Funds account for the accumulation of resources for and the payment of general obligation and special assessment bonds.
The Miscellaneous Governmental Debt was created in 2003 to account for the revenue and debt expenditures associated with miscellaneous governmental debt. Beginning in 2003 the Public Works Trust Fund Loans will be accounted for in this fund. Previously the Public Works Trust Fund loan was accounted for in Fund 204 – Non-Voted General Obligation Debt.
The Non-Voted General Obligation Debt accounts for the debt service on Council approved general obligation debt. Currently this includes two bond issues and the postage machine lease.
2014 COMPREHENSIVE ANNUAL FINANCIAL REPORT 75
CITY OF POULSBO FINANCIAL SECTION
Capital Projects Funds
Capital Projects Funds account for the acquisition or construction of capital facilities (except for those financed primarily by proprietary funds). These funds are financed primarily by general obligation bonds, special assessments, federal and state grants and contributions from other funds. Budget-to-Actual for the one major capital project funds is also presented here. The fund name is italicized for identification purposes.
The Equipment Acquisition Fund was established to account for money used to replace existing capital equipment. Funding for the purchases is from a percentage of sales tax revenues.
The Park Reserve Fund was established to account for money used for improvements to the City parks and the urban forestry program. Funding is from a transfer from the General Fund.
The Cemetery Reserve Fund was established to account for money collected from gravesite sales used to make improvements to the City cemetery.
The Street Equipment Reserve Fund was established to build reserves for the purchase of street equipment.
The Facilities Fund was established to fund capital improvements to the City facilities.
Permanent Fund
Permanent funds are used to report resources that are legally restricted to the extent that only earnings, not principal, may be used for purposes that support the reporting government’s programs.
The Bernice Borgen Beautification Fund is used to account for principal trust amounts received from Bernice Borgen estate and related interest income. The interest portion of the trust can be used for the beautification of the City.
76 2014 COMPREHENSIVE ANNUAL FINANCIAL REPORT
CITY OF POULSBO FINANCIAL SECTION
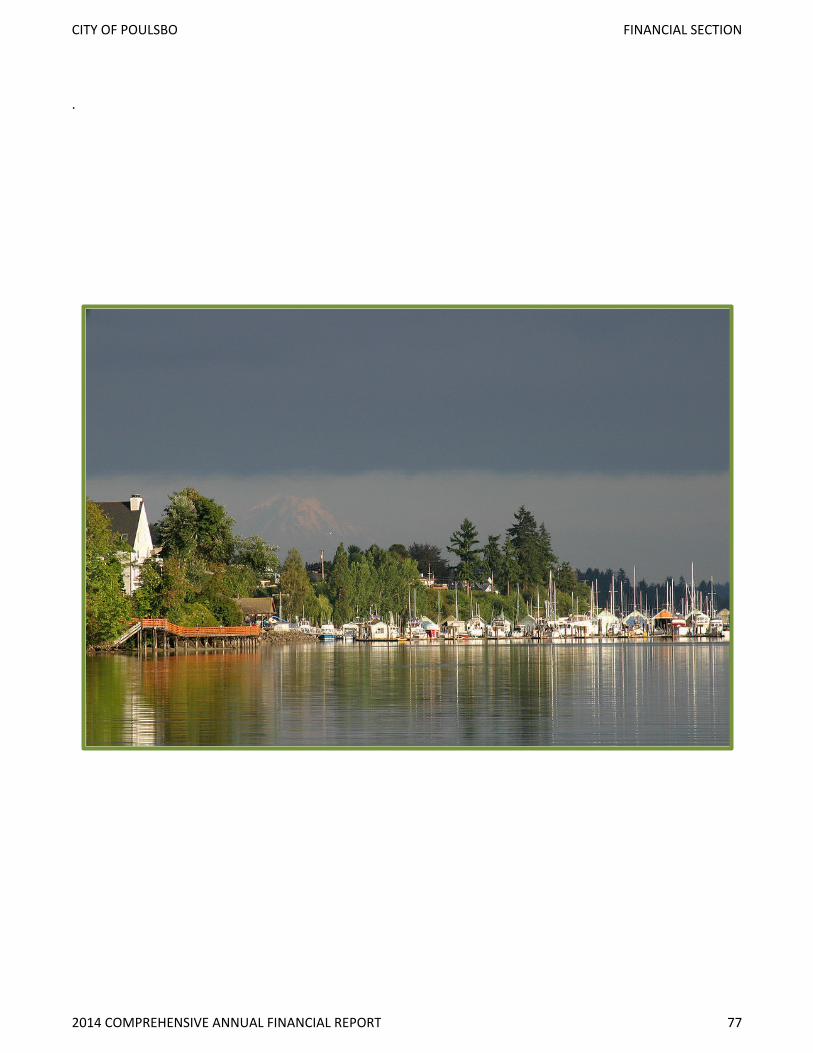
.
2014 COMPREHENSIVE ANNUAL FINANCIAL REPORT 77
CITY OF POULSBO FINANCIAL SECTION
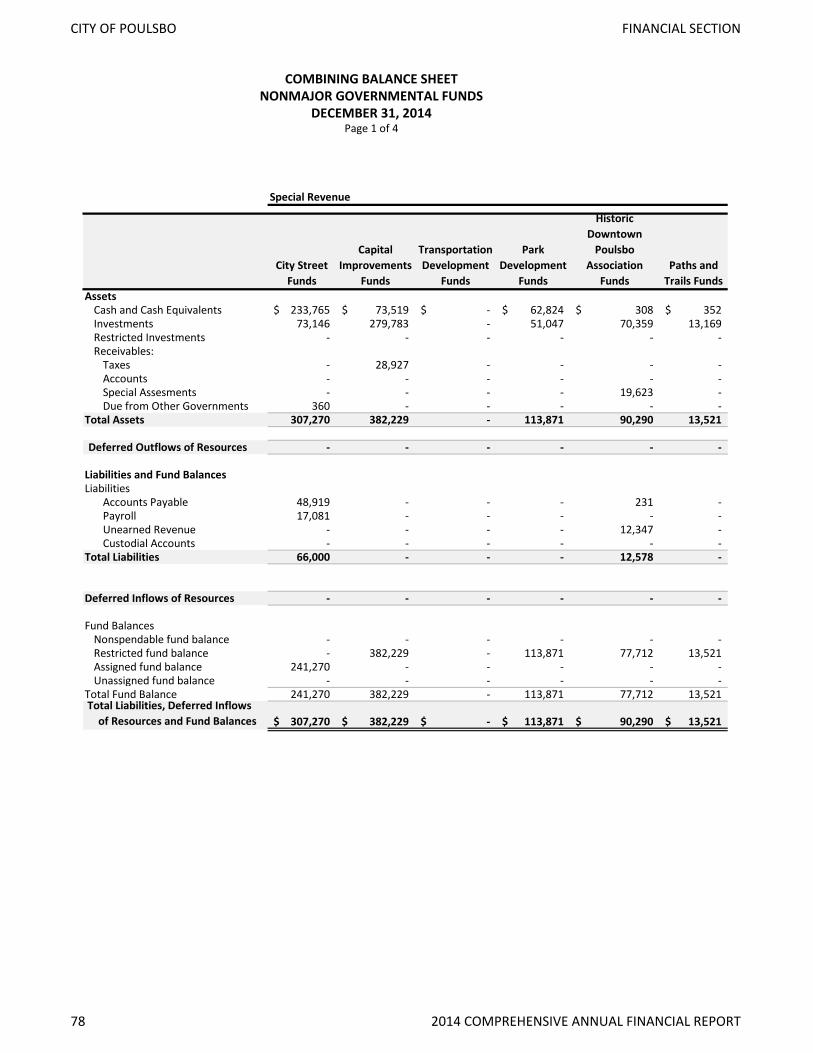
City Street Funds
Capital Improvements
Funds
Transportation Development
Funds
Park Development
Funds
Historic Downtown
Poulsbo Association
FundsPaths and
Trails FundsAssets
Cash and Cash Equivalents 233,765$ 73,519$ -$ 62,824$ 308$ 352$ Investments 73,146 279,783 - 51,047 70,359 13,169 Restricted Investments - - - - - - Receivables:
Taxes - 28,927 - - - - Accounts - - - - - - Special Assesments - - - - 19,623 - Due from Other Governments 360 - - - - -
Total Assets 307,270 382,229 - 113,871 90,290 13,521
Deferred Outflows of Resources - - - - - -
Liabilities and Fund BalancesLiabilities
Accounts Payable 48,919 - - - 231 - Payroll 17,081 - - - - - Unearned Revenue - - - - 12,347 - Custodial Accounts - - - - - -
Total Liabilities 66,000 - - - 12,578 -
Deferred Inflows of Resources - - - - - -
Fund BalancesNonspendable fund balance - - - - - - Restricted fund balance - 382,229 - 113,871 77,712 13,521 Assigned fund balance 241,270 - - - - - Unassigned fund balance - - - - - -
Total Fund Balance 241,270 382,229 - 113,871 77,712 13,521 Total Liabilities, Deferred Inflows of Resources and Fund Balances 307,270$ 382,229$ -$ 113,871$ 90,290$ 13,521$
Special Revenue
COMBINING BALANCE SHEETNONMAJOR GOVERNMENTAL FUNDS
DECEMBER 31, 2014Page 1 of 4
78 2014 COMPREHENSIVE ANNUAL FINANCIAL REPORT
CITY OF POULSBO FINANCIAL SECTION

Drug Enforcement
Funds
Transient Occupancy
Funds
Police Restricted
Funds
Total Non-Major Special Revenue
Funds
Misc Governmental Debt Funds
Non-voted General
Oblig Debt Fund
Total Non-Major Debt Service
Funds
192$ 11,187$ 18,261$ 400,408$ -$ 370$ 370$ 24,890 60,905 87,819 661,119 3,219 4,369 7,588
- - - - - - -
- - - 28,927 - - - 668 - - 668 - - -
- - - 19,623 - - - - - - 360 - - -
25,750 72,092 106,081 1,111,104 3,219 4,738 7,957
- - - - - - -
14 7,244 50 56,458 - - - - - - 17,081 - - - - - - 12,347 - - -
8,958 - 260 9,218 - - - 8,972 7,244 310 95,104 - - -
- - - - - - -
- - - - - - - 16,778 64,848 91,099 760,059 3,219 4,738 7,957
- - 14,672 255,942 - - - - - - - - - -
16,778 64,848 105,771 1,016,001 3,219 4,738 7,957
25,750$ 72,092$ 106,081$ 1,111,104$ 3,219$ 4,738$ 7,957$
Debt Service
COMBINING BALANCE SHEETNONMAJOR GOVERNMENTAL FUNDS (continued)
DECEMBER 31, 2014Page 2 of 4
2014 COMPREHENSIVE ANNUAL FINANCIAL REPORT 79
CITY OF POULSBO FINANCIAL SECTION
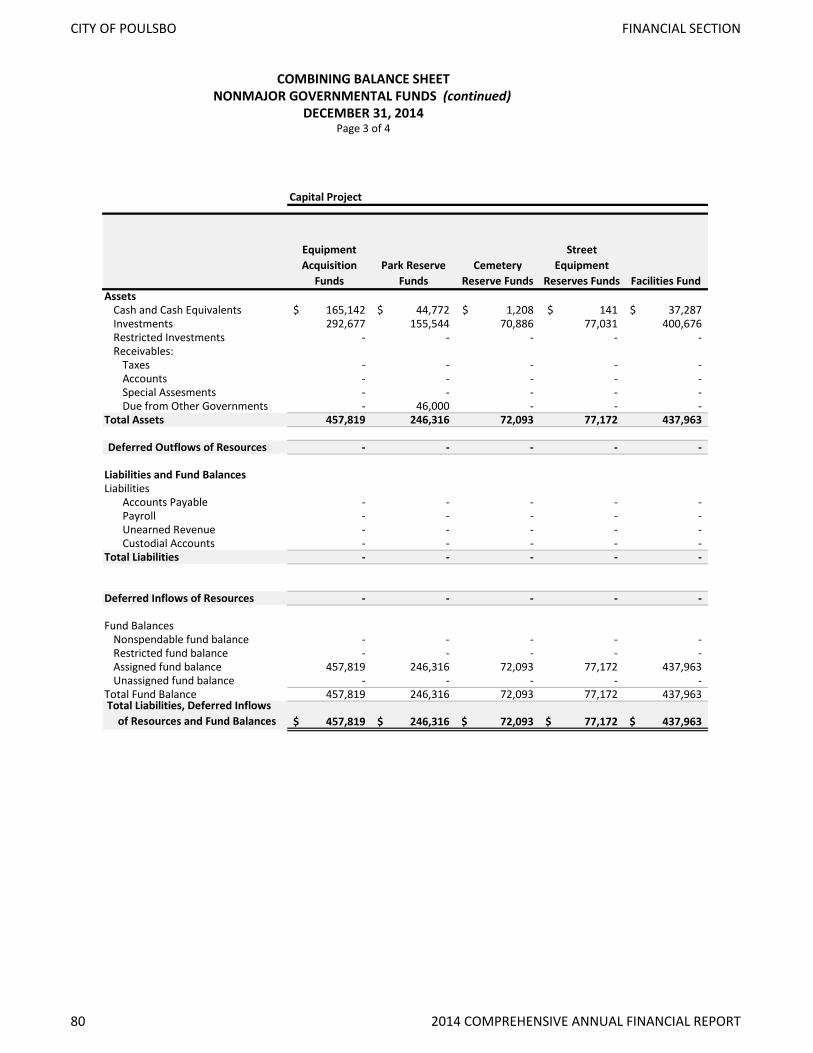
Equipment Acquisition
FundsPark Reserve
FundsCemetery
Reserve Funds
Street Equipment
Reserves Funds Facilities FundAssets
Cash and Cash Equivalents 165,142$ 44,772$ 1,208$ 141$ 37,287$ Investments 292,677 155,544 70,886 77,031 400,676 Restricted Investments - - - - - Receivables:
Taxes - - - - - Accounts - - - - - Special Assesments - - - - - Due from Other Governments - 46,000 - - -
Total Assets 457,819 246,316 72,093 77,172 437,963
Deferred Outflows of Resources - - - - -
Liabilities and Fund BalancesLiabilities
Accounts Payable - - - - - Payroll - - - - - Unearned Revenue - - - - - Custodial Accounts - - - - -
Total Liabilities - - - - -
Deferred Inflows of Resources - - - - -
Fund BalancesNonspendable fund balance - - - - - Restricted fund balance - - - - - Assigned fund balance 457,819 246,316 72,093 77,172 437,963 Unassigned fund balance - - - - -
Total Fund Balance 457,819 246,316 72,093 77,172 437,963 Total Liabilities, Deferred Inflows of Resources and Fund Balances 457,819$ 246,316$ 72,093$ 77,172$ 437,963$
Capital Project
COMBINING BALANCE SHEETNONMAJOR GOVERNMENTAL FUNDS (continued)
DECEMBER 31, 2014Page 3 of 4
80 2014 COMPREHENSIVE ANNUAL FINANCIAL REPORT
CITY OF POULSBO FINANCIAL SECTION
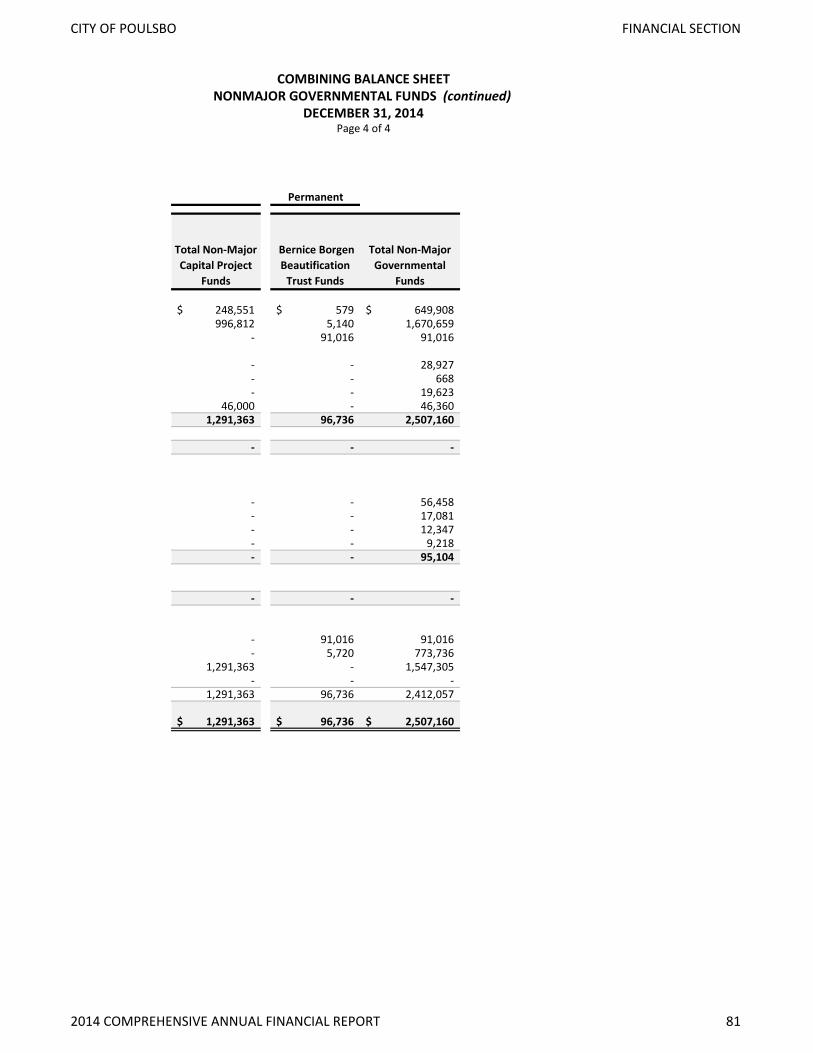
Permanent
Total Non-Major Capital Project
Funds
Bernice Borgen Beautification
Trust Funds
Total Non-Major Governmental
Funds
248,551$ 579$ 649,908$ 996,812 5,140 1,670,659
- 91,016 91,016
- - 28,927 - - 668 - - 19,623
46,000 - 46,360 1,291,363 96,736 2,507,160
- - -
- - 56,458 - - 17,081 - - 12,347 - - 9,218 - - 95,104
- - -
- 91,016 91,016 - 5,720 773,736
1,291,363 - 1,547,305 - - -
1,291,363 96,736 2,412,057
1,291,363$ 96,736$ 2,507,160$
COMBINING BALANCE SHEETNONMAJOR GOVERNMENTAL FUNDS (continued)
DECEMBER 31, 2014Page 4 of 4
2014 COMPREHENSIVE ANNUAL FINANCIAL REPORT 81
CITY OF POULSBO FINANCIAL SECTION

City Street Funds
Capital Improvements
Funds
Transportation Development
Funds
Park Development
Funds
Historic Downtown Poulsbo Association
FundsRevenues
Taxes -$ 474,906$ -$ -$ -$ Licenses and Permits 16,680 - - - - Intergovernmental 322,281 - - - - Charges for Services - - 139,827 15,670 - Fines and Forfeitures - - - - - Interest and Other Earnings 128 394 35 64 395 Miscellaneous - - - - 53,039
Total Revenues 339,089 475,300 139,862 15,734 53,434
ExpendituresCurrent: Security of Persons & Property - - - - -
Transportation 1,024,174 - - - - Economic Environment - - - - - Culture and Recreation - - - - 57,584 Debt Service: Principal - - - - - Interest & Fiscal Charges - - - - - Capital Outlay - - - - -
Total Expenditures 1,024,174 - - - 57,584
Excess of Revenues over Expenditures (685,086) 475,300 139,862 15,734 (4,150)
Other Financing Sources (Uses)Transfers In 752,470 - - - - Transfers Out (190,656) (440,000) (239,828) (25,236) - Compensation for Impairment of Capital Assets - - - - -
Total Other Financing Sources and Uses 561,813 (440,000) (239,828) (25,236) -
Net Change in Fund Balances (123,272) 35,300 (99,966) (9,502) (4,150)
Fund Balances - Beginning 368,292 439,495 99,966 123,374 81,863 Prior Year Adjustment (3,750) (92,565) - - - Fund Balances - Ending 241,270$ 382,229$ (0)$ 113,871$ 77,712$
COMBINING STATEMENT OF REVENUES, EXPENDITURES AND CHANGES IN FUND BALANCESNONMAJOR GOVERNMENTAL FUNDSFOR YEAR ENDED DECEMBER 31, 2014
Page 1 of 4
Special Revenue
82 2014 COMPREHENSIVE ANNUAL FINANCIAL REPORT
CITY OF POULSBO FINANCIAL SECTION
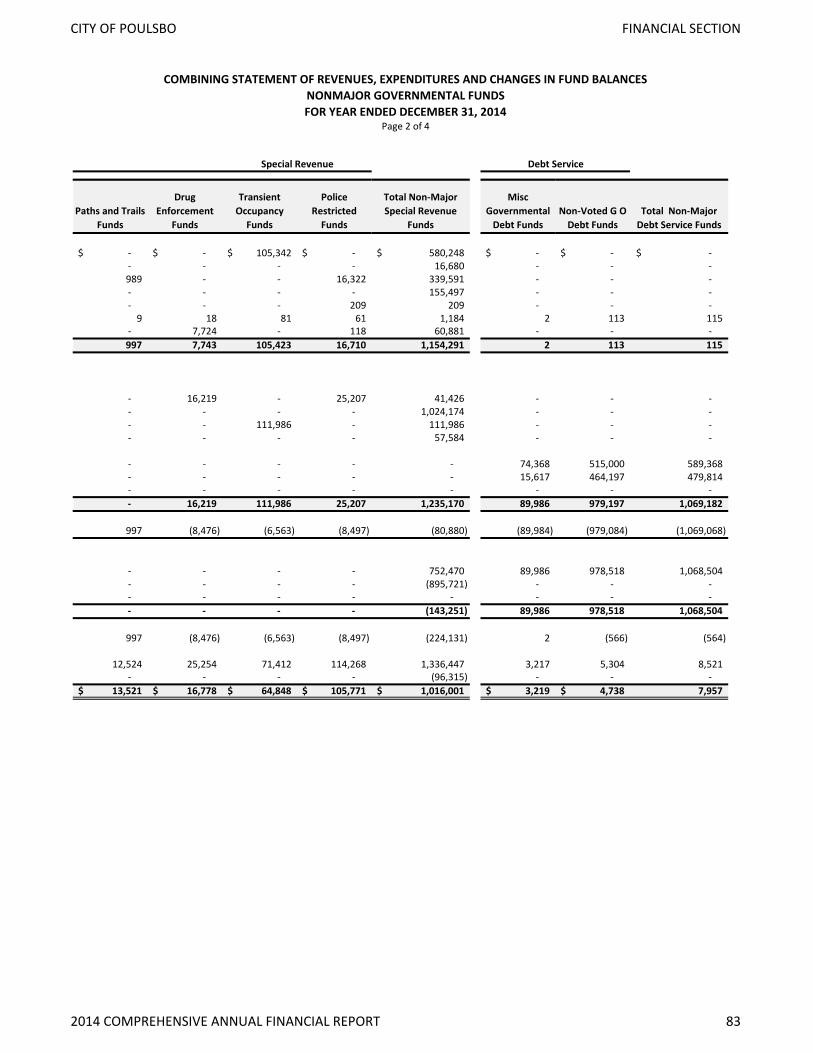
Paths and Trails Funds
Drug Enforcement
Funds
Transient Occupancy
Funds
Police Restricted
Funds
Total Non-Major Special Revenue
Funds
Misc Governmental
Debt FundsNon-Voted G O
Debt FundsTotal Non-Major
Debt Service Funds
-$ -$ 105,342$ -$ 580,248$ -$ -$ -$ - - - - 16,680 - - - 989 - - 16,322 339,591 - - - - - - - 155,497 - - - - - - 209 209 - - -
9 18 81 61 1,184 2 113 115 - 7,724 - 118 60,881 - - - 997 7,743 105,423 16,710 1,154,291 2 113 115
- 16,219 - 25,207 41,426 - - - - - - - 1,024,174 - - - - - 111,986 - 111,986 - - - - - - - 57,584 - - -
- - - - - 74,368 515,000 589,368 - - - - - 15,617 464,197 479,814 - - - - - - - - - 16,219 111,986 25,207 1,235,170 89,986 979,197 1,069,182
997 (8,476) (6,563) (8,497) (80,880) (89,984) (979,084) (1,069,068)
- - - - 752,470 89,986 978,518 1,068,504 - - - - (895,721) - - - - - - - - - - - - - - - (143,251) 89,986 978,518 1,068,504
997 (8,476) (6,563) (8,497) (224,131) 2 (566) (564)
12,524 25,254 71,412 114,268 1,336,447 3,217 5,304 8,521 - - - - (96,315) - - -
13,521$ 16,778$ 64,848$ 105,771$ 1,016,001$ 3,219$ 4,738$ 7,957
Special Revenue Debt Service
COMBINING STATEMENT OF REVENUES, EXPENDITURES AND CHANGES IN FUND BALANCESNONMAJOR GOVERNMENTAL FUNDSFOR YEAR ENDED DECEMBER 31, 2014
Page 2 of 4
2014 COMPREHENSIVE ANNUAL FINANCIAL REPORT 83
CITY OF POULSBO FINANCIAL SECTION
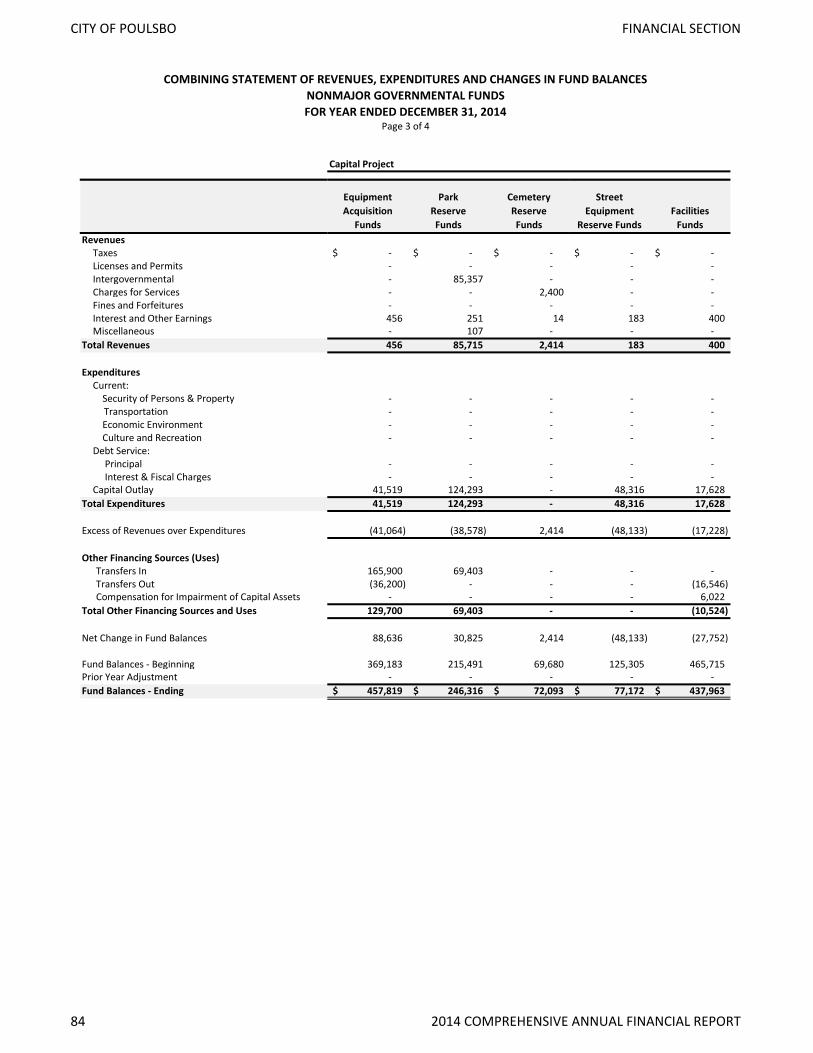
Equipment Acquisition
Funds
Park Reserve Funds
Cemetery Reserve Funds
Street Equipment
Reserve FundsFacilities
FundsRevenues
Taxes -$ -$ -$ -$ -$ Licenses and Permits - - - - - Intergovernmental - 85,357 - - - Charges for Services - - 2,400 - - Fines and Forfeitures - - - - - Interest and Other Earnings 456 251 14 183 400 Miscellaneous - 107 - - -
Total Revenues 456 85,715 2,414 183 400
ExpendituresCurrent: Security of Persons & Property - - - - -
Transportation - - - - - Economic Environment - - - - - Culture and Recreation - - - - - Debt Service: Principal - - - - - Interest & Fiscal Charges - - - - - Capital Outlay 41,519 124,293 - 48,316 17,628
Total Expenditures 41,519 124,293 - 48,316 17,628
Excess of Revenues over Expenditures (41,064) (38,578) 2,414 (48,133) (17,228)
Other Financing Sources (Uses)Transfers In 165,900 69,403 - - - Transfers Out (36,200) - - - (16,546) Compensation for Impairment of Capital Assets - - - - 6,022
Total Other Financing Sources and Uses 129,700 69,403 - - (10,524)
Net Change in Fund Balances 88,636 30,825 2,414 (48,133) (27,752)
Fund Balances - Beginning 369,183 215,491 69,680 125,305 465,715 Prior Year Adjustment - - - - - Fund Balances - Ending 457,819$ 246,316$ 72,093$ 77,172$ 437,963$
Capital Project
COMBINING STATEMENT OF REVENUES, EXPENDITURES AND CHANGES IN FUND BALANCESNONMAJOR GOVERNMENTAL FUNDSFOR YEAR ENDED DECEMBER 31, 2014
Page 3 of 4
84 2014 COMPREHENSIVE ANNUAL FINANCIAL REPORT
CITY OF POULSBO FINANCIAL SECTION
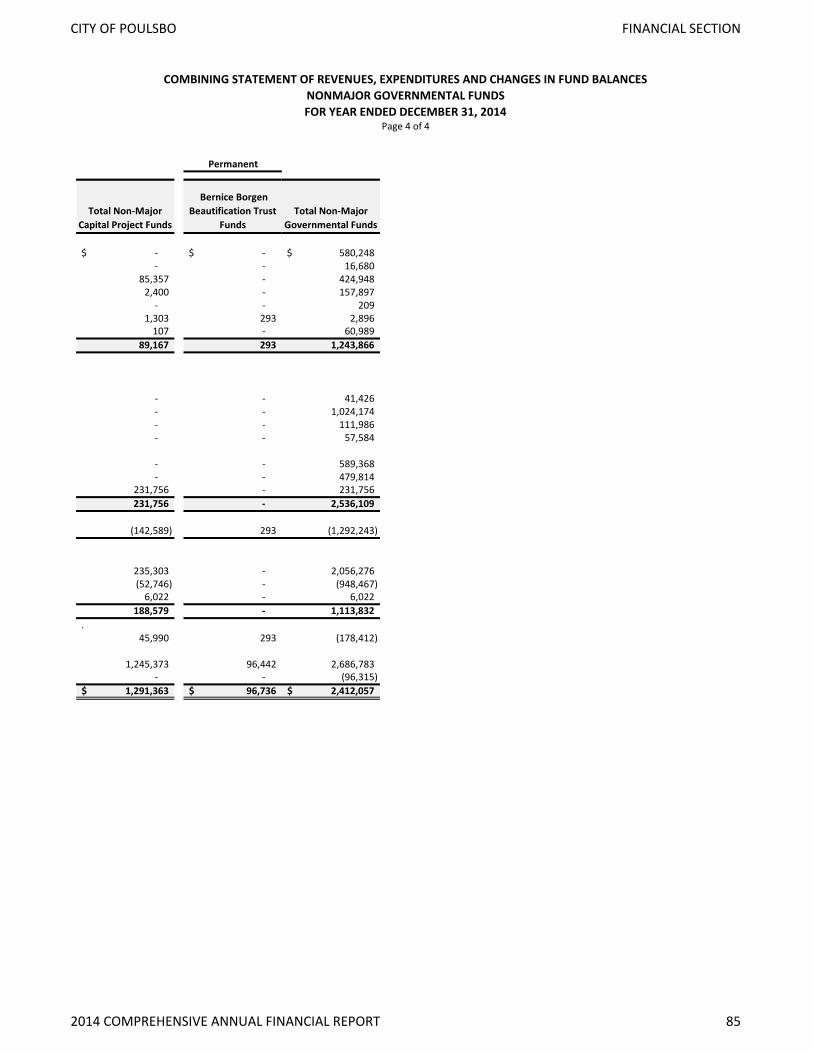
Permanent
Total Non-Major Capital Project Funds
Bernice Borgen Beautification Trust
Funds Total Non-Major
Governmental Funds
-$ -$ 580,248$ - - 16,680
85,357 - 424,948 2,400 - 157,897
- - 209 1,303 293 2,896
107 - 60,989 89,167 293 1,243,866
- - 41,426 - - 1,024,174 - - 111,986 - - 57,584
- - 589,368 - - 479,814
231,756 - 231,756 231,756 - 2,536,109
(142,589) 293 (1,292,243)
235,303 - 2,056,276 (52,746) - (948,467)
6,022 - 6,022 188,579 - 1,113,832
.45,990 293 (178,412)
1,245,373 96,442 2,686,783 - - (96,315)
1,291,363$ 96,736$ 2,412,057$
COMBINING STATEMENT OF REVENUES, EXPENDITURES AND CHANGES IN FUND BALANCESNONMAJOR GOVERNMENTAL FUNDSFOR YEAR ENDED DECEMBER 31, 2014
Page 4 of 4
2014 COMPREHENSIVE ANNUAL FINANCIAL REPORT 85
CITY OF POULSBO FINANCIAL SECTION
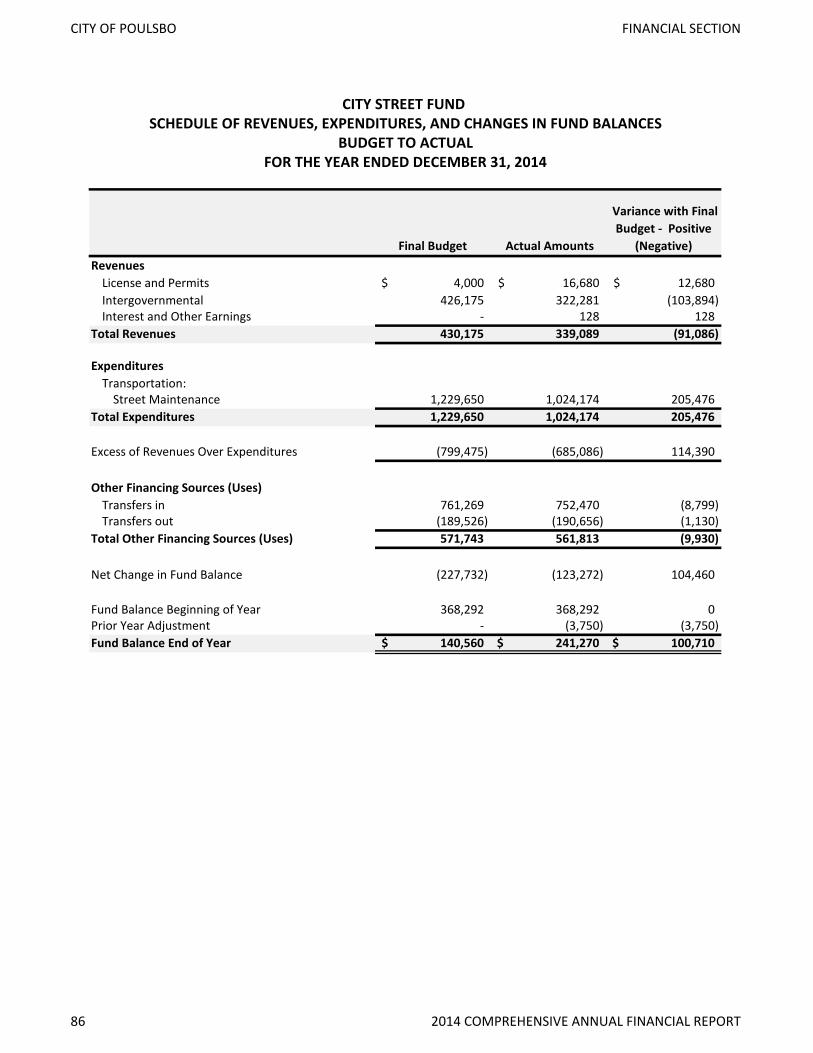
Final Budget Actual Amounts
Variance with Final Budget - Positive
(Negative) Revenues
License and Permits 4,000$ 16,680$ 12,680$ Intergovernmental 426,175 322,281 (103,894) Interest and Other Earnings - 128 128
Total Revenues 430,175 339,089 (91,086) Expenditures
Transportation:Street Maintenance 1,229,650 1,024,174 205,476
Total Expenditures 1,229,650 1,024,174 205,476
Excess of Revenues Over Expenditures (799,475) (685,086) 114,390
Other Financing Sources (Uses)Transfers in 761,269 752,470 (8,799) Transfers out (189,526) (190,656) (1,130)
Total Other Financing Sources (Uses) 571,743 561,813 (9,930)
Net Change in Fund Balance (227,732) (123,272) 104,460
Fund Balance Beginning of Year 368,292 368,292 0 Prior Year Adjustment - (3,750) (3,750) Fund Balance End of Year 140,560$ 241,270$ 100,710$
CITY STREET FUND SCHEDULE OF REVENUES, EXPENDITURES, AND CHANGES IN FUND BALANCES
BUDGET TO ACTUALFOR THE YEAR ENDED DECEMBER 31, 2014
86 2014 COMPREHENSIVE ANNUAL FINANCIAL REPORT
CITY OF POULSBO FINANCIAL SECTION
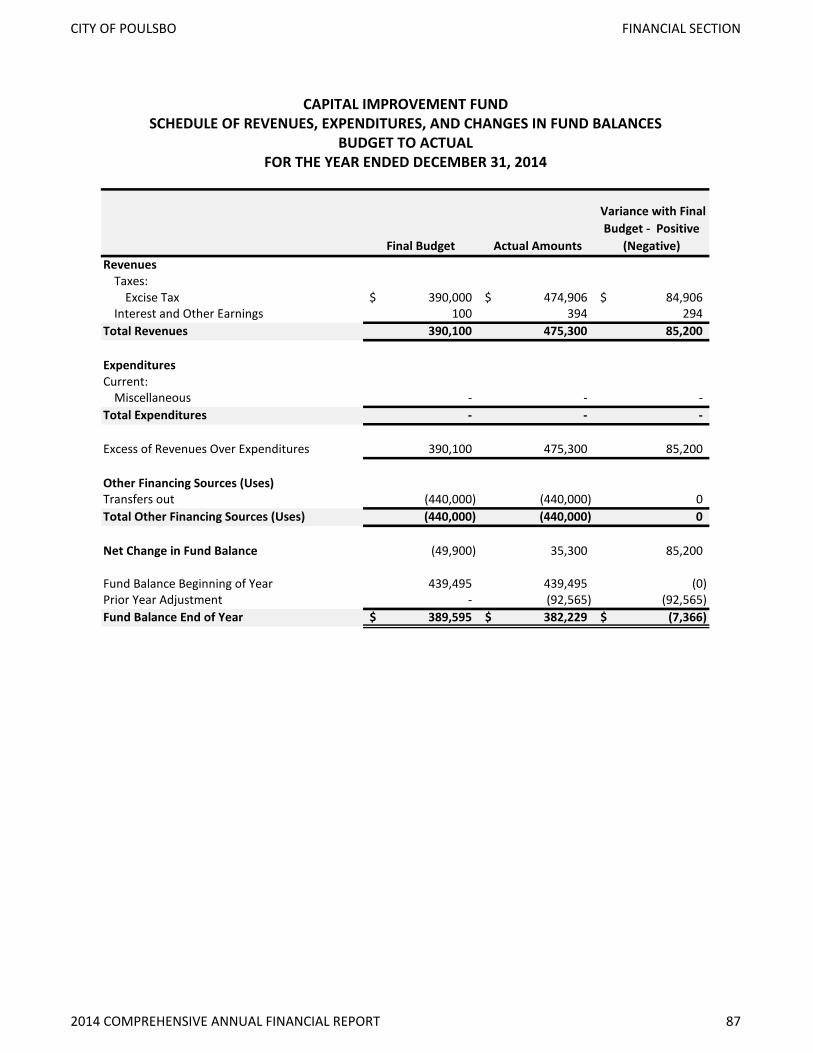
Final Budget Actual Amounts
Variance with Final Budget - Positive
(Negative) Revenues
Taxes:Excise Tax 390,000$ 474,906$ 84,906$
Interest and Other Earnings 100 394 294 Total Revenues 390,100 475,300 85,200 ExpendituresCurrent:
Miscellaneous - - - Total Expenditures - - -
Excess of Revenues Over Expenditures 390,100 475,300 85,200
Other Financing Sources (Uses)Transfers out (440,000) (440,000) 0 Total Other Financing Sources (Uses) (440,000) (440,000) 0
Net Change in Fund Balance (49,900) 35,300 85,200
Fund Balance Beginning of Year 439,495 439,495 (0) Prior Year Adjustment - (92,565) (92,565) Fund Balance End of Year 389,595$ 382,229$ (7,366)$
CAPITAL IMPROVEMENT FUNDSCHEDULE OF REVENUES, EXPENDITURES, AND CHANGES IN FUND BALANCES
FOR THE YEAR ENDED DECEMBER 31, 2014BUDGET TO ACTUAL
2014 COMPREHENSIVE ANNUAL FINANCIAL REPORT 87
CITY OF POULSBO FINANCIAL SECTION

Final Budget Actual Amounts
Variance with Final Budget - Positive
(Negative) Revenues
Transportation Impact Fees 191,000$ 139,827$ (51,173)$ Interest and Other Earnings - 35 35
Total Revenues 191,000 139,862 (51,138) Expenditures
Current:Miscellaneous - - -
Total Expenditures - - -
Excess of Revenues Over Expenditures 191,000 139,862 (51,138)
Other Financing Sources (Uses)Transfers in - - - Transfers out (286,785) (239,828) 46,957
Total Other Financing Sources (Uses) (286,785) (239,828) 46,957
Net Change in Fund Balance (95,785) (99,966) (4,181)
Fund Balance Beginning of Year 99,966 99,966 0 Fund Balance End of Year 4,181$ -$ (4,181)$
TRANSPORTATION DEVELOPMENT FUNDSCHEDULE OF REVENUES, EXPENDITURES, AND CHANGES IN FUND BALANCES
FOR THE YEAR ENDED DECEMBER 31, 2014BUDGET TO ACTUAL
88 2014 COMPREHENSIVE ANNUAL FINANCIAL REPORT
CITY OF POULSBO FINANCIAL SECTION
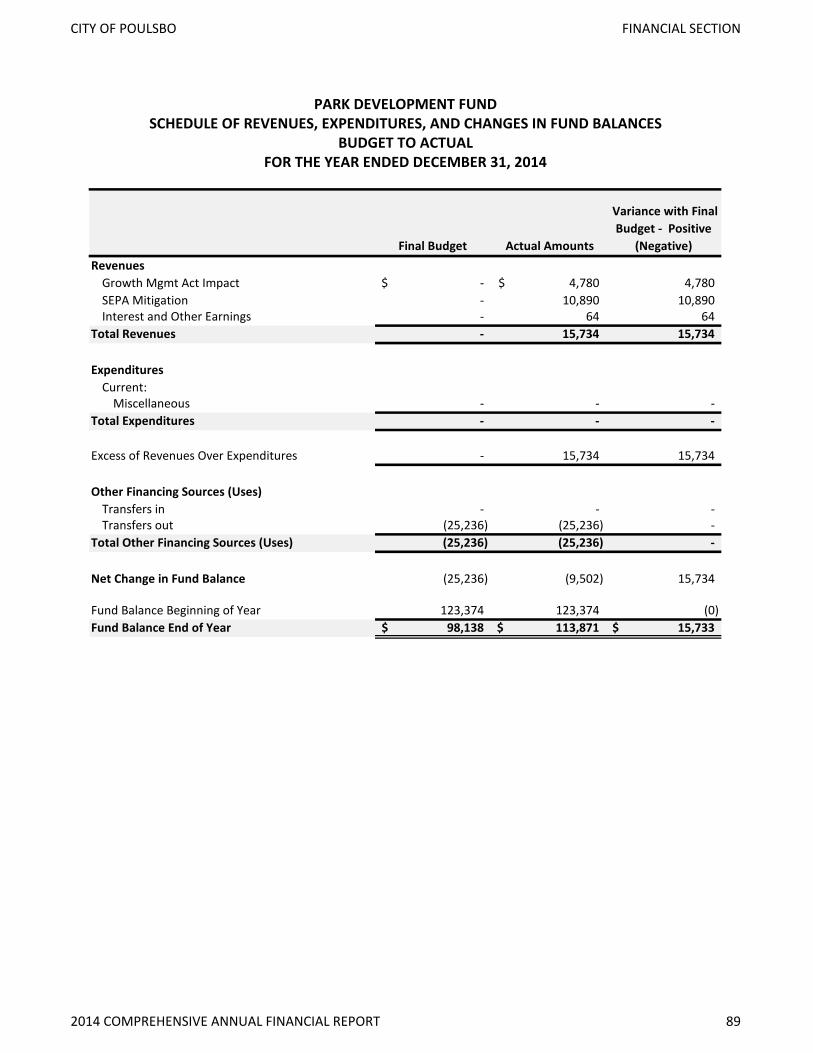
Final Budget Actual Amounts
Variance with Final Budget - Positive
(Negative) Revenues
Growth Mgmt Act Impact -$ 4,780$ 4,780 SEPA Mitigation - 10,890 10,890 Interest and Other Earnings - 64 64
Total Revenues - 15,734 15,734 Expenditures
Current:Miscellaneous - - -
Total Expenditures - - -
Excess of Revenues Over Expenditures - 15,734 15,734
Other Financing Sources (Uses)Transfers in - - - Transfers out (25,236) (25,236) -
Total Other Financing Sources (Uses) (25,236) (25,236) -
Net Change in Fund Balance (25,236) (9,502) 15,734
Fund Balance Beginning of Year 123,374 123,374 (0) Fund Balance End of Year 98,138$ 113,871$ 15,733$
PARK DEVELOPMENT FUNDSCHEDULE OF REVENUES, EXPENDITURES, AND CHANGES IN FUND BALANCES
FOR THE YEAR ENDED DECEMBER 31, 2014BUDGET TO ACTUAL
2014 COMPREHENSIVE ANNUAL FINANCIAL REPORT 89
CITY OF POULSBO FINANCIAL SECTION
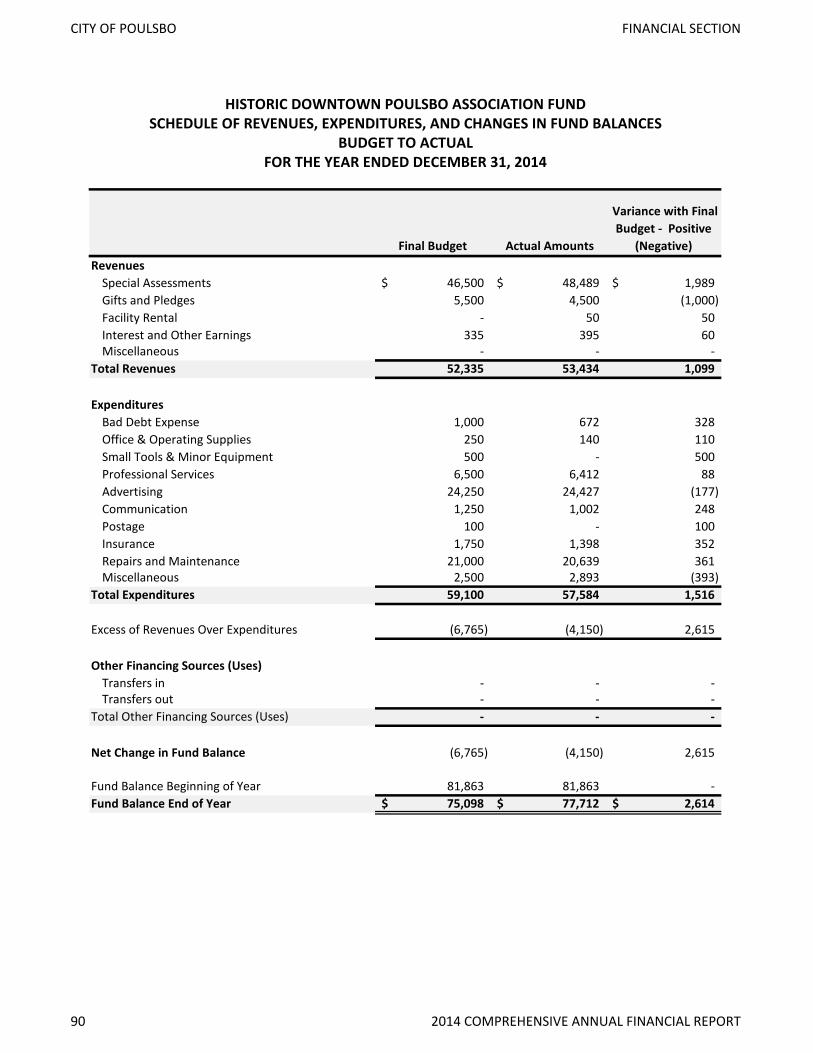
Final Budget Actual Amounts
Variance with Final Budget - Positive
(Negative) Revenues
Special Assessments 46,500$ 48,489$ 1,989$ Gifts and Pledges 5,500 4,500 (1,000) Facility Rental - 50 50 Interest and Other Earnings 335 395 60 Miscellaneous - - -
Total Revenues 52,335 53,434 1,099 Expenditures
Bad Debt Expense 1,000 672 328 Office & Operating Supplies 250 140 110 Small Tools & Minor Equipment 500 - 500 Professional Services 6,500 6,412 88 Advertising 24,250 24,427 (177) Communication 1,250 1,002 248 Postage 100 - 100 Insurance 1,750 1,398 352 Repairs and Maintenance 21,000 20,639 361 Miscellaneous 2,500 2,893 (393)
Total Expenditures 59,100 57,584 1,516
Excess of Revenues Over Expenditures (6,765) (4,150) 2,615
Other Financing Sources (Uses)Transfers in - - - Transfers out - - -
Total Other Financing Sources (Uses) - - -
Net Change in Fund Balance (6,765) (4,150) 2,615
Fund Balance Beginning of Year 81,863 81,863 - Fund Balance End of Year 75,098$ 77,712$ 2,614$
HISTORIC DOWNTOWN POULSBO ASSOCIATION FUNDSCHEDULE OF REVENUES, EXPENDITURES, AND CHANGES IN FUND BALANCES
FOR THE YEAR ENDED DECEMBER 31, 2014BUDGET TO ACTUAL
90 2014 COMPREHENSIVE ANNUAL FINANCIAL REPORT
CITY OF POULSBO FINANCIAL SECTION
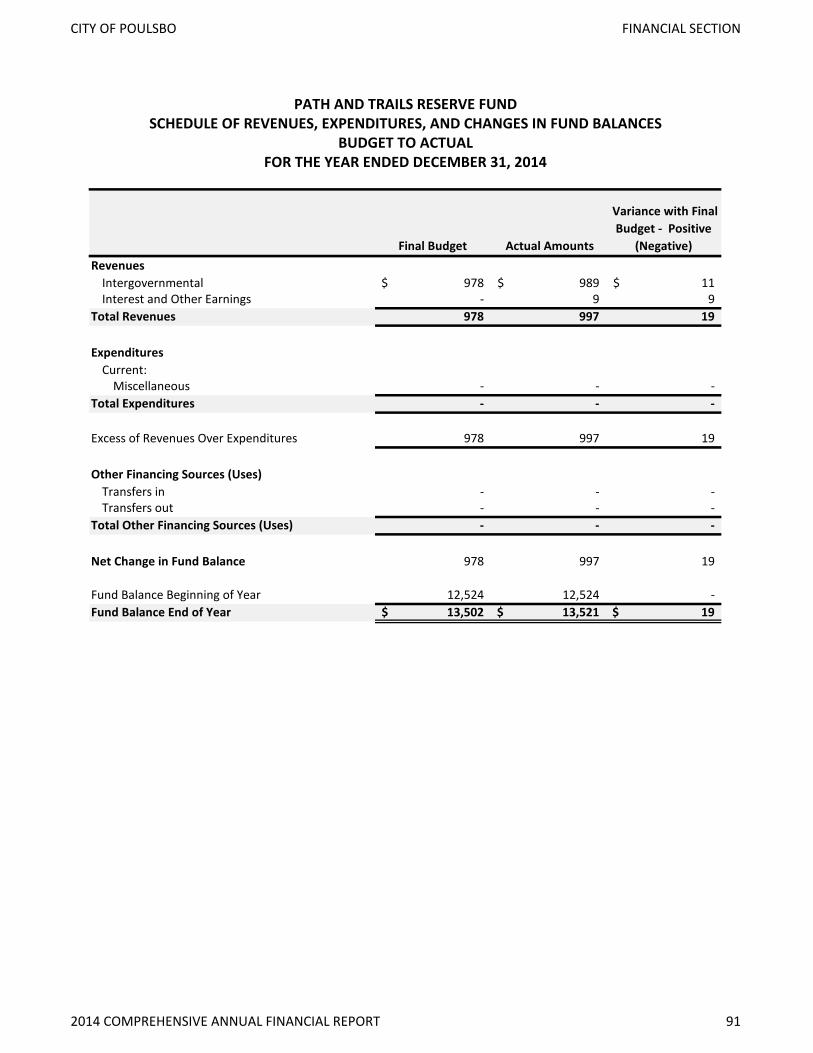
Final Budget Actual Amounts
Variance with Final Budget - Positive
(Negative) Revenues
Intergovernmental 978$ 989$ 11$ Interest and Other Earnings - 9 9
Total Revenues 978 997 19 Expenditures
Current:Miscellaneous - - -
Total Expenditures - - -
Excess of Revenues Over Expenditures 978 997 19
Other Financing Sources (Uses)Transfers in - - - Transfers out - - -
Total Other Financing Sources (Uses) - - -
Net Change in Fund Balance 978 997 19
Fund Balance Beginning of Year 12,524 12,524 - Fund Balance End of Year 13,502$ 13,521$ 19$
PATH AND TRAILS RESERVE FUNDSCHEDULE OF REVENUES, EXPENDITURES, AND CHANGES IN FUND BALANCES
FOR THE YEAR ENDED DECEMBER 31, 2014BUDGET TO ACTUAL
2014 COMPREHENSIVE ANNUAL FINANCIAL REPORT 91
CITY OF POULSBO FINANCIAL SECTION
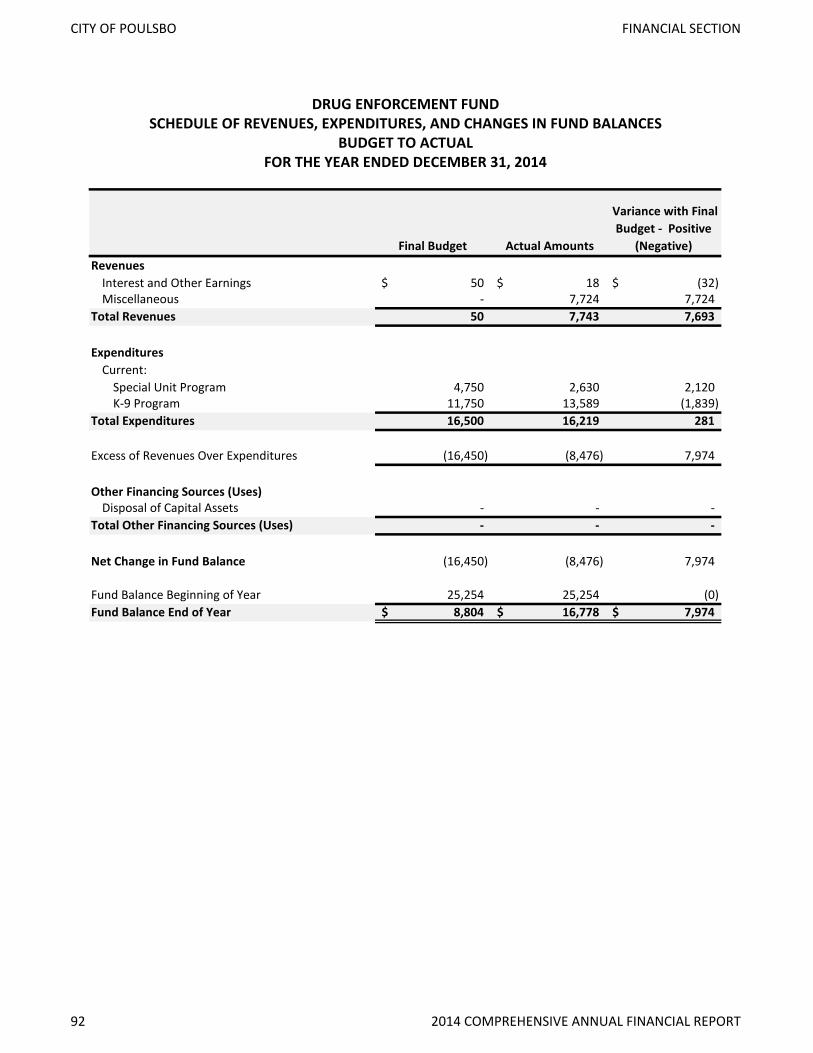
Final Budget Actual Amounts
Variance with Final Budget - Positive
(Negative) Revenues
Interest and Other Earnings 50$ 18$ (32)$ Miscellaneous - 7,724 7,724
Total Revenues 50 7,743 7,693 Expenditures
Current:Special Unit Program 4,750 2,630 2,120 K-9 Program 11,750 13,589 (1,839)
Total Expenditures 16,500 16,219 281
Excess of Revenues Over Expenditures (16,450) (8,476) 7,974
Other Financing Sources (Uses)Disposal of Capital Assets - - -
Total Other Financing Sources (Uses) - - -
Net Change in Fund Balance (16,450) (8,476) 7,974
Fund Balance Beginning of Year 25,254 25,254 (0) Fund Balance End of Year 8,804$ 16,778$ 7,974$
DRUG ENFORCEMENT FUNDSCHEDULE OF REVENUES, EXPENDITURES, AND CHANGES IN FUND BALANCES
FOR THE YEAR ENDED DECEMBER 31, 2014BUDGET TO ACTUAL
92 2014 COMPREHENSIVE ANNUAL FINANCIAL REPORT
CITY OF POULSBO FINANCIAL SECTION

Final Budget Actual Amounts
Variance with Final Budget - Positive
(Negative) Revenues
Hotel/Motel Tax 90,000$ 52,671$ (37,329)$ Additional 2% Hotel/Motel Tax - 52,671 52,671 Interest and Other Earnings - 81 81
Total Revenues 90,000 105,423 15,423 Expenditures
Economic Environment: Spectator and Community Events:
Administration 13,500 13,606 (106) Miscellaneous 100,500 98,380 2,120
Total Expenditures 114,000 111,986 2,014
Excess of Revenues Over Expenditures (24,000) (6,563) 17,437
Other Financing Sources (Uses)Transfers in - - - Transfers out - - -
Total Other Financing Sources (Uses) - - -
Net Change in Fund Balance (24,000) (6,563) 17,437
Fund Balance Beginning of Year 71,412 71,412 - Fund Balance End of Year 47,412$ 64,848$ 17,436$
TRANSIENT OCCUPANCY TAX FUNDSCHEDULE OF REVENUES, EXPENDITURES, AND CHANGES IN FUND BALANCES
FOR THE YEAR ENDED DECEMBER 31, 2014BUDGET TO ACTUAL
2014 COMPREHENSIVE ANNUAL FINANCIAL REPORT 93
CITY OF POULSBO FINANCIAL SECTION

Final Budget Actual Amounts
Variance with Final Budget - Positive
(Negative) Revenues
Vessel Registration 6,500$ 7,190$ 690$ Criminal Justice 8,339 9,132 793 Fines & Forfeitures - 209 209 Interest and Other Earnings 300 61 (239) Miscellaneous 2,000 118 (1,882)
Total Revenues 17,139 16,710 (429) Expenditures
Marine Safety 11,100 13,810 (2,710) Criminal Justice 9,872 8,756 1,116 Miscellaneous 6,000 2,641 3,359
Total Expenditures 26,972 25,207 1,765
Excess of Revenues Over Expenditures (9,833) (8,497) 1,336
Other Financing Sources (Uses)Transfers in - - - Transfers out - - -
Total Other Financing Sources (Uses) - - -
Net Change in Fund Balance (9,833) (8,497) 1,336
Fund Balance Beginning of Year 114,268 114,268 (0) Fund Balance End of Year 104,435$ 105,771$ 1,336$
POLICE RESTRICTED FUNDSCHEDULE OF REVENUES, EXPENDITURES, AND CHANGES IN FUND BALANCES
BUDGET TO ACTUALFOR THE YEAR ENDED DECEMBER 31, 2014
94 2014 COMPREHENSIVE ANNUAL FINANCIAL REPORT
CITY OF POULSBO FINANCIAL SECTION
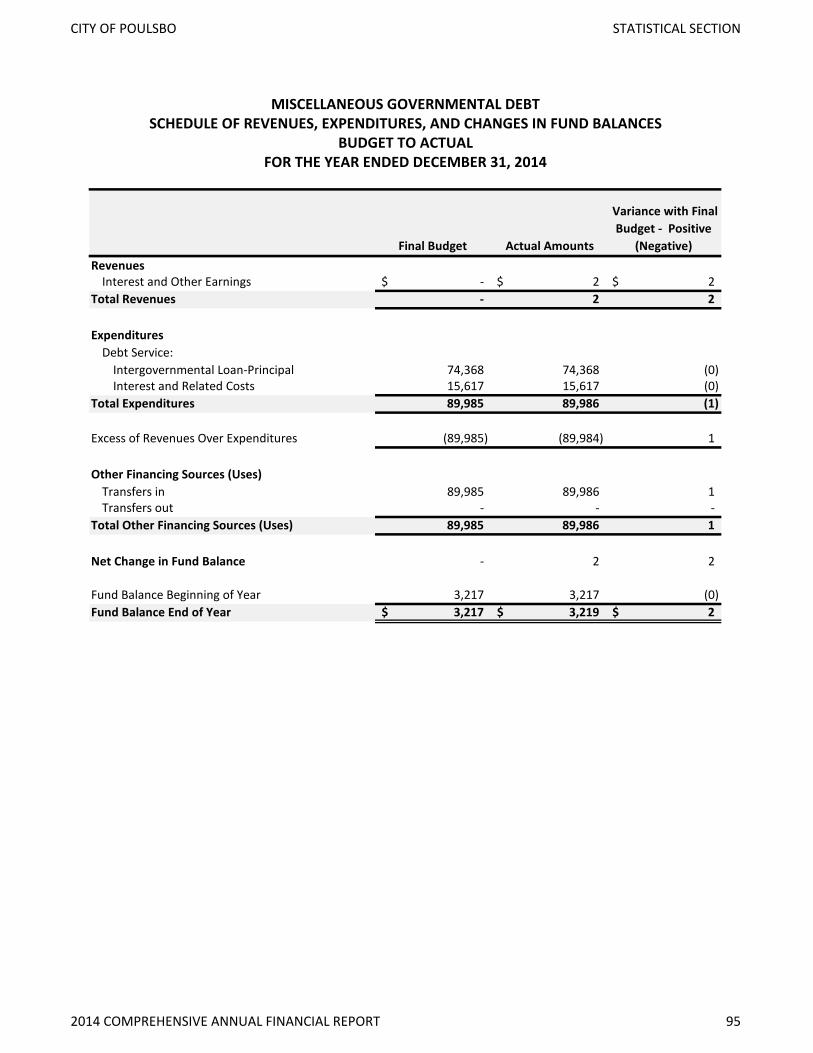
Final Budget Actual Amounts
Variance with Final Budget - Positive
(Negative) Revenues
Interest and Other Earnings -$ 2$ 2$ Total Revenues - 2 2 Expenditures
Debt Service:Intergovernmental Loan-Principal 74,368 74,368 (0) Interest and Related Costs 15,617 15,617 (0)
Total Expenditures 89,985 89,986 (1)
Excess of Revenues Over Expenditures (89,985) (89,984) 1
Other Financing Sources (Uses)Transfers in 89,985 89,986 1 Transfers out - - -
Total Other Financing Sources (Uses) 89,985 89,986 1
Net Change in Fund Balance - 2 2
Fund Balance Beginning of Year 3,217 3,217 (0) Fund Balance End of Year 3,217$ 3,219$ 2$
MISCELLANEOUS GOVERNMENTAL DEBTSCHEDULE OF REVENUES, EXPENDITURES, AND CHANGES IN FUND BALANCES
BUDGET TO ACTUALFOR THE YEAR ENDED DECEMBER 31, 2014
2014 COMPREHENSIVE ANNUAL FINANCIAL REPORT 95
CITY OF POULSBO STATISTICAL SECTION

Final Budget Actual Amounts
Variance with Final Budget - Positive
(Negative) Revenues
Interest and Other Earnings -$ 113$ 113$ Total Revenues - 113 113 Expenditures
Debt Service:General Obligation Bond-Principal 515,000 515,000 - Interest and Related Costs 464,515 464,197 318
Total Expenditures 979,515 979,197 318
Excess of Revenues Over Expenditures (979,515) (979,084) 431
Other Financing Sources (Uses)Transfers in 978,518 978,518 - Transfers out - - -
Total Other Financing Sources (Uses) 978,518 978,518 -
Net Change in Fund Balance (997) (566) 431
Fund Balance Beginning of Year 5,304 5,304 - Fund Balance End of Year 4,307$ 4,738$ 431$
NON-VOTED GENERAL OBLIGATION DEBT FUNDSCHEDULE OF REVENUES, EXPENDITURES, AND CHANGES IN FUND BALANCES
FOR THE YEAR ENDED DECEMBER 31, 2014BUDGET TO ACTUAL
96 2014 COMPREHENSIVE ANNUAL FINANCIAL REPORT
CITY OF POULSBO STATISTICAL SECTION
Final Budget Actual Amounts
Variance with Final Budget - Positive
(Negative) Revenues
Interest and Other Earnings -$ 456$ 456$ Total Revenues - 456 456 Expenditures
Capital Outlay 226,418 41,519 184,899 Total Expenditures 226,418 41,519 184,899
Excess of Revenues Over Expenditures (226,418) (41,064) 185,354
Other Financing Sources (Uses)Transfers in 165,900 165,900 - Transfers out (36,200) (36,200) 0
Total Other Financing Sources (Uses) 129,700 129,700 (0)
Net Change in Fund Balance (96,718) 88,636 185,354
Fund Balance Beginning of Year 368,664 369,183 519 Fund Balance End of Year 271,946$ 457,819$ 185,873$
EQUIPMENT ACQUISITION FUNDSCHEDULE OF REVENUES, EXPENDITURES, AND CHANGES IN FUND BALANCES
FOR THE YEAR ENDED DECEMBER 31, 2014BUDGET TO ACTUAL
2014 COMPREHENSIVE ANNUAL FINANCIAL REPORT 97
CITY OF POULSBO STATISTICAL SECTION
Final Budget Actual Amounts
Variance with Final Budget - Positive
(Negative) Revenues
Intergovernmental:RCO - (IAC) ALEA Grant 182,369$ 85,357$ (97,012)$
Gifts and Pledges - 107 107 Interest and Other Earnings - 251 251
Total Revenues 182,369 85,715 (96,654) Expenditures
Current:Capital Outlay:
Fish Park 247,322 114,186 133,136 Lions Park Fencing 9,000 - 9,000 M.I. Williams Pavilion Improvements 25,431 1,250 24,181 Morrow Manor Park Planning 15,000 9,352 5,648 Net Shed Park - (3,114) 3,114 Trail Easements Planning 110,000 2,619 107,381
Total Expenditures 406,753 124,293 282,460
Excess of Revenues Over Expenditures (224,384) (38,578) 185,806
Other Financing Sources (Uses)Transfers in 70,059 69,403 (656) Transfers out - - -
Total Other Financing Sources (Uses) 70,059 69,403 (656)
Net Change in Fund Balance (154,325) 30,825 185,150
Fund Balance Beginning of Year 215,491 215,491 0 Fund Balance End of Year 61,166$ 246,316$ 185,150$
PARK RESERVE FUNDSCHEDULE OF REVENUES, EXPENDITURES, AND CHANGES IN FUND BALANCES
BUDGET TO ACTUALFOR THE YEAR ENDED DECEMBER 31, 2014
98 2014 COMPREHENSIVE ANNUAL FINANCIAL REPORT
CITY OF POULSBO STATISTICAL SECTION

Final Budget Actual Amounts
Variance with Final Budget - Positive
(Negative) Revenues
Intergovernmental 3,769,765$ 2,752,065$ (1,017,700)$ Interest and Other Earnings - 129 129$
Total Revenues 3,769,765 2,752,194 (1,017,571) Expenditures
Capital Outlay 4,492,437 2,964,835 1,527,602 Total Expenditures 4,492,437 2,964,835 1,527,602
Excess of Revenues Over Expenditures (722,672) (212,641) 510,031
Other Financing Sources (Uses)Transfers in 1,607,083 812,465 (794,618) Transfers out (1,024,535) (278,535) 746,000
Total Other Financing Sources (Uses) 582,548 533,930 (48,618)
Net Change in Fund Balance (140,124) 321,290 461,414
Fund Balance Beginning of Year 296,830 296,830 - Fund Balance End of Year 156,706$ 618,120$ 461,414$
STREET RESERVE FUNDSCHEDULE OF REVENUES, EXPENDITURES, AND CHANGES IN FUND BALANCES
BUDGET TO ACTUALFOR THE YEAR ENDED DECEMBER 31, 2014
2014 COMPREHENSIVE ANNUAL FINANCIAL REPORT 99
CITY OF POULSBO STATISTICAL SECTION
Final Budget Actual Amounts
Variance with Final Budget - Positive
(Negative) Revenues
Gravesites 3,200$ 2,400$ (800)$ Interest and Other Earnings - 14 14
Total Revenues 3,200 2,414 (786) Expenditures
Current:General Government - - -
Total Expenditures - - -
Excess of Revenues Over Expenditures 3,200 2,414 (786)
Other Financing Sources (Uses)Transfers in - - - Transfers out - - -
Total Other Financing Sources (Uses) - - -
Net Change in Fund Balance 3,200 2,414 (786)
Fund Balance Beginning of Year 69,680 69,680 - Fund Balance End of Year 72,880$ 72,093$ (787)$
CEMETERY RESERVE FUNDSCHEDULE OF REVENUES, EXPENDITURES, AND CHANGES IN FUND BALANCES
BUDGET TO ACTUALFOR THE YEAR ENDED DECEMBER 31, 2014
100 2014 COMPREHENSIVE ANNUAL FINANCIAL REPORT
CITY OF POULSBO STATISTICAL SECTION
Final Budget Actual Amounts
Variance with Final Budget - Positive
(Negative) RevenuesInterest and Other Earnings -$ 183$ 183$ Miscellaneous - - - Total Revenues - 183 183 ExpendituresCapital Outlay 92,500 48,316 44,185 Total Expenditures 92,500 48,316 44,185
Excess of Revenues Over Expenditures (92,500) (48,133) 44,367
Other Financing Sources (Uses)Transfers in - - - Transfers out - - - Total Other Financing Sources (Uses) - - -
Net Change in Fund Balance (92,500) (48,133) 44,367
Fund Balance Beginning of Year 125,305 125,305 - Fund Balance End of Year 32,805$ 77,172$ 44,367$
CITY STREET EQUIPMENT RESERVE FUNDSCHEDULE OF REVENUES, EXPENDITURES, AND CHANGES IN FUND BALANCES
BUDGET TO ACTUALFOR THE YEAR ENDED DECEMBER 31, 2014
2014 COMPREHENSIVE ANNUAL FINANCIAL REPORT 101
CITY OF POULSBO STATISTICAL SECTION
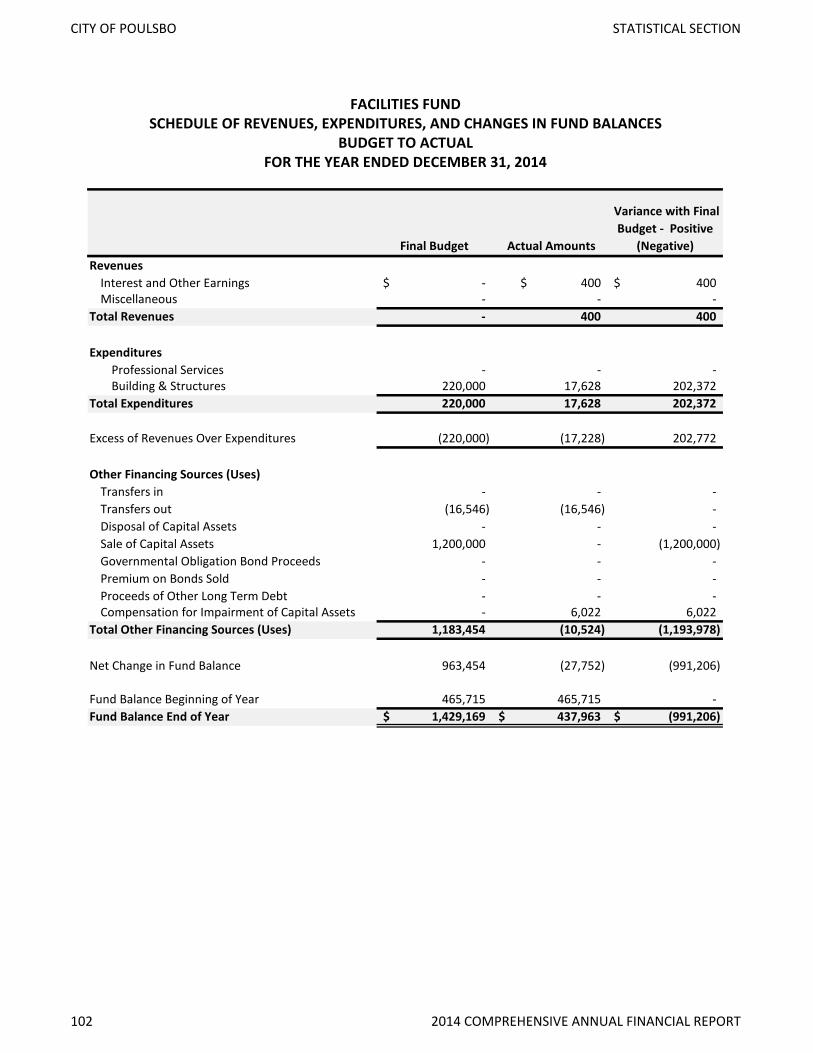
Final Budget Actual Amounts
Variance with Final Budget - Positive
(Negative) Revenues
Interest and Other Earnings -$ 400$ 400$ Miscellaneous - - -
Total Revenues - 400 400 Expenditures
Professional Services - - - Building & Structures 220,000 17,628 202,372
Total Expenditures 220,000 17,628 202,372
Excess of Revenues Over Expenditures (220,000) (17,228) 202,772
Other Financing Sources (Uses)Transfers in - - - Transfers out (16,546) (16,546) - Disposal of Capital Assets - - - Sale of Capital Assets 1,200,000 - (1,200,000) Governmental Obligation Bond Proceeds - - - Premium on Bonds Sold - - - Proceeds of Other Long Term Debt - - - Compensation for Impairment of Capital Assets - 6,022 6,022
Total Other Financing Sources (Uses) 1,183,454 (10,524) (1,193,978)
Net Change in Fund Balance 963,454 (27,752) (991,206)
Fund Balance Beginning of Year 465,715 465,715 - Fund Balance End of Year 1,429,169$ 437,963$ (991,206)$
FACILITIES FUNDSCHEDULE OF REVENUES, EXPENDITURES, AND CHANGES IN FUND BALANCES
BUDGET TO ACTUALFOR THE YEAR ENDED DECEMBER 31, 2014
102 2014 COMPREHENSIVE ANNUAL FINANCIAL REPORT
CITY OF POULSBO STATISTICAL SECTION
STATISTICAL SECTION
This part of the City of Poulsbo’s comprehensive annual financial report presents detailed information as a context for understanding what the information in the financial statements, note disclosures and required supplementary information say about the government’s overall financial health. This information is unaudited.
Contents
Financial Trends These schedules contain trend information to help the reader understand how the government’s financial performance and well-being have changed over time.
Revenue Capacity These schedules contain information to help the reader assess the government’s most significant local revenue sources, property tax and sales tax.
Debt Capacity These schedules present information to help the reader assess the affordability of the government’s current levels of outstanding debt and the government’s ability to issue additional debt in the future.
Demographic and Economic Information These schedules offer demographic and economic indicators to help the reader understand the environment within which the government’s financial activities take place.
Operating Information These schedules contain service and infrastructure data to help the reader understand how the information in the government’s financial report relates to the services the government provides and the activities it performs.
Data Sources: Unless otherwise noted, the information in these schedules is derived from the comprehensive annual financial reports for the relevant year.
2014 COMPREHENSIVE ANNUAL FINANCIAL REPORT 103
CITY OF POULSBO STATISTICAL SECTION

.
104 2014 COMPREHENSIVE ANNUAL FINANCIAL REPORT
CITY OF POULSBO STATISTICAL SECTION
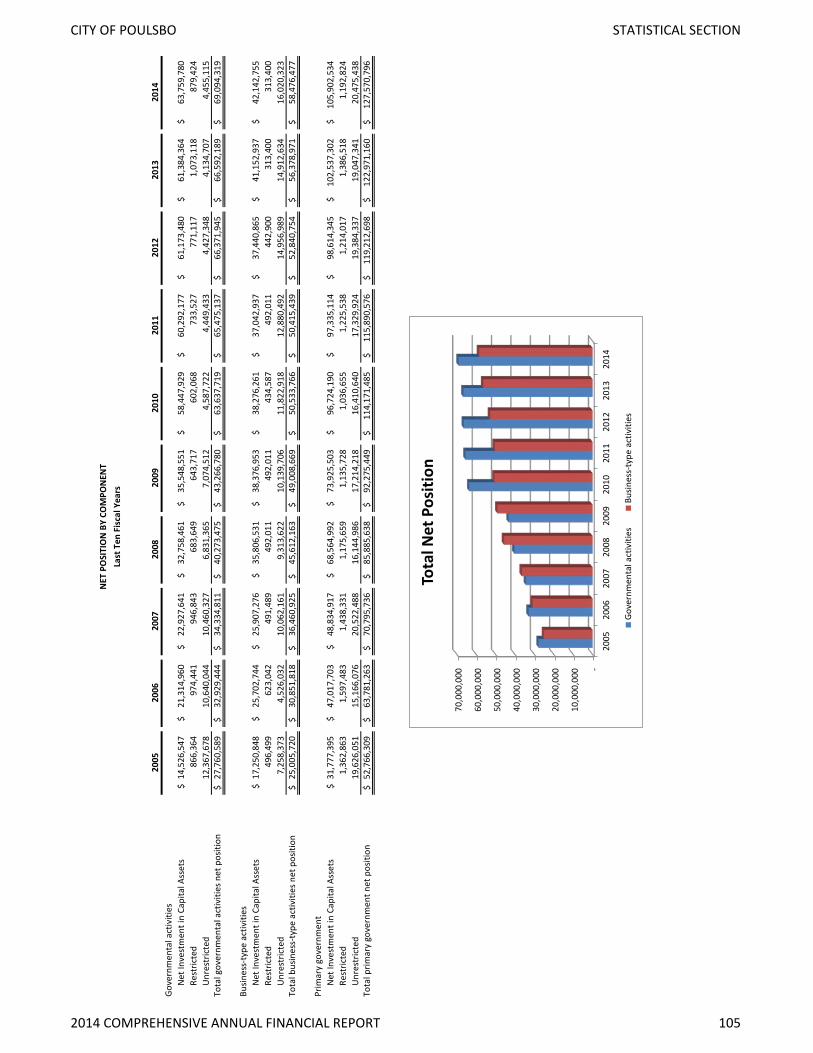
2005
2006
2007
2008
2009
2010
2011
2012
2013
2014
Gov
ernm
enta
l act
iviti
esN
et In
vest
men
t in
Capi
tal A
sset
s14
,526
,547
$
21,3
14,9
60$
22,9
27,6
41$
32,7
58,4
61$
35,5
48,5
51$
58,4
47,9
29$
60
,292
,177
$
61,1
73,4
80$
61
,384
,364
$
63,7
59,7
80$
Re
stric
ted
866,
364
974,
441
94
6,84
3
683,
649
64
3,71
7
602,
068
733,
527
771,
117
1,07
3,11
8
879,
424
Unr
estr
icte
d12
,367
,678
10,6
40,0
44
10,4
60,3
27
6,83
1,36
5
7,
074,
512
4,58
7,72
2
4,44
9,43
3
4,42
7,34
8
4,13
4,70
7
4,45
5,11
5
Tota
l gov
ernm
enta
l act
iviti
es n
et p
ositi
on27
,760
,589
$
32,9
29,4
44$
34,3
34,8
11$
40,2
73,4
75$
43,2
66,7
80$
63,6
37,7
19$
65
,475
,137
$
66,3
71,9
45$
66
,592
,189
$
69,0
94,3
19$
Busin
ess-
type
act
iviti
esN
et In
vest
men
t in
Capi
tal A
sset
s17
,250
,848
$
25,7
02,7
44$
25,9
07,2
76$
35,8
06,5
31$
38,3
76,9
53$
38,2
76,2
61$
37
,042
,937
$
37,4
40,8
65$
41
,152
,937
$
42,1
42,7
55$
Re
stric
ted
496,
499
623,
042
49
1,48
9
492,
011
49
2,01
1
434,
587
492,
011
442,
900
313,
400
313,
400
Unr
estr
icte
d7,
258,
373
4,
526,
032
10,0
62,1
61
9,31
3,62
2
10
,139
,706
11
,822
,918
12,8
80,4
92
14
,956
,989
14,9
12,6
34
16
,020
,323
Tota
l bus
ines
s-ty
pe a
ctiv
ities
net
pos
ition
25,0
05,7
20$
30
,851
,818
$
36
,460
,925
$
45
,612
,163
$
49
,008
,669
$
50
,533
,766
$
50,4
15,4
39$
52
,840
,754
$
56,3
78,9
71$
58
,476
,477
$
Prim
ary
gove
rnm
ent
Net
Inve
stm
ent i
n Ca
pita
l Ass
ets
31,7
77,3
95$
47
,017
,703
$
48
,834
,917
$
68
,564
,992
$
73
,925
,503
$
96
,724
,190
$
97,3
35,1
14$
98
,614
,345
$
102,
537,
302
$
10
5,90
2,53
4$
Rest
ricte
d1,
362,
863
1,
597,
483
1,43
8,33
1
1,
175,
659
1,13
5,72
8
1,
036,
655
1,
225,
538
1,
214,
017
1,
386,
518
1,
192,
824
U
nres
tric
ted
19,6
26,0
51
15
,166
,076
20
,522
,488
16
,144
,986
17
,214
,218
16
,410
,640
17,3
29,9
24
19
,384
,337
19,0
47,3
41
20
,475
,438
Tota
l prim
ary
gove
rnm
ent n
et p
ositi
on52
,766
,309
$
63,7
81,2
63$
70,7
95,7
36$
85,8
85,6
38$
92,2
75,4
49$
114,
171,
485
$
11
5,89
0,57
6$
119,
212,
698
$
12
2,97
1,16
0$
127,
570,
796
$
NET
PO
SITI
ON
BY
COM
PON
ENT
Last
Ten
Fis
cal Y
ears
-
10,
000,
000
20,
000,
000
30,
000,
000
40,
000,
000
50,
000,
000
60,
000,
000
70,
000,
000
2005
20
06
2007
20
08
2009
20
10
2011
20
12
2013
20
14
Tota
l Net
Pos
ition
Gove
rnm
enta
l act
iviti
es
Busin
ess-
type
act
iviti
es
2014 COMPREHENSIVE ANNUAL FINANCIAL REPORT 105
CITY OF POULSBO STATISTICAL SECTION

2005
2006
2007
2008
2009
2010
2011
2012
2013
2014
Expe
nses
Gov
ernm
enta
l Act
iviti
es:
Gen
eral
gov
ernm
ent
1,35
6,94
3$
1,63
9,40
1$
1,72
9,87
0$
1,75
2,35
8$
1,67
3,19
7$
1,73
1,19
3$
1,75
8,68
8$
2,14
8,29
1$
1,64
0,53
5$
1,57
2,17
3$
Judi
cial
257,
550
272,
248
303,
106
338,
206
363,
204
372,
227
347,
030
374,
672
355,
656
357,
993
Secu
rity
of P
erso
ns &
Pro
pert
y2,
112,
042
2,
194,
372
2,
432,
958
2,
485,
650
2,
735,
396
2,
733,
363
2,
631,
619
2,
651,
809
2,
826,
033
3,
009,
996
U
tiliti
es &
Env
ironm
ent
436,
786
502,
929
579,
460
605,
326
495,
083
478,
035
494,
668
463,
211
500,
646
456,
860
Tran
spor
tatio
n1,
069,
701
1,
105,
132
3,
303,
834
3,
473,
777
1,
590,
515
1,
731,
695
1,
685,
655
1,
852,
794
2,
716,
499
2,
820,
286
Ec
onom
ic E
nviro
nmen
t65
0,39
1
75
1,94
7
84
6,13
1
89
4,50
7
84
8,00
2
86
1,53
8
63
3,78
2
66
5,02
7
77
9,31
7
89
0,45
9
M
enta
l & P
hysic
al H
ealth
12,4
89
12,8
38
13,4
89
13,6
94
14,2
13
14,4
81
14,5
73
14,7
05
13,9
78
14,3
56
Cultu
re &
Rec
reat
ion
1,27
3,80
9
1,38
1,97
8
1,82
0,16
5
2,06
7,10
9
1,50
1,57
1
1,50
9,16
4
1,46
8,72
0
1,42
7,91
0
1,33
6,33
9
1,33
8,81
4
Inte
rest
on
Long
-Ter
m D
ebt
150,
670
332,
355
323,
951
303,
190
517,
679
561,
569
553,
206
556,
341
536,
673
518,
677
Tota
l Gov
ernm
enta
l Act
iviti
es E
xpen
ses
7,32
0,38
1
8,19
3,19
9
11,3
52,9
64
11
,933
,818
9,73
8,86
0
9,99
3,26
6
9,58
7,94
0
10,1
54,7
59
10
,705
,677
10,9
79,6
13
Bu
sines
s-Ty
pe A
ctiv
ities
: W
ater
12,
195,
301
87
0,95
9
1,
017,
582
92
8,15
3
1,
109,
257
1,
094,
734
1,
199,
529
1,
282,
886
1,
356,
314
1,
484,
034
Se
wer
-
1,
368,
353
1,
518,
045
1,
520,
839
1,
716,
646
1,
844,
726
2,
052,
589
2,
109,
868
2,
240,
098
2,
236,
003
So
lid W
aste
807,
384
945,
221
1,15
8,97
6
961,
512
999,
853
999,
164
1,16
1,44
5
1,24
7,12
1
1,29
8,01
5
1,32
0,15
0
Stor
m D
rain
323,
217
417,
209
559,
800
675,
448
881,
451
931,
723
935,
763
1,01
1,61
9
972,
205
1,08
8,00
6
Tota
l Bus
ines
s-Ty
pe A
ctiv
ities
3,32
5,90
2
3,60
1,74
2
4,25
4,40
2
4,08
5,95
2
4,70
7,20
6
4,87
0,34
7
5,34
9,32
6
5,65
1,49
4
5,86
6,63
1
6,12
8,19
2
Tota
l Prim
ary
Gov
ernm
ent E
xpen
ses
10,6
46,2
83$
11
,794
,941
$
15,6
07,3
66$
16
,019
,770
$
14,4
46,0
66$
14
,863
,613
$
14,9
37,2
66$
15
,806
,253
$
16,5
72,3
08$
17
,107
,805
$
Prog
ram
Rev
enue
sG
over
nmen
tal A
ctiv
ities
:Ch
arge
s for
serv
ices
Gen
eral
Gov
ernm
ent
224,
133
$
230,
890
$
259,
258
$
268,
307
$
269,
871
$
266,
497
$
540,
342
$
345,
044
$
327,
650
$
345,
370
$
Judi
cial
109,
137
123,
309
123,
489
106,
268
100,
989
111,
022
106,
027
112,
308
108,
500
112,
624
Secu
rity
of P
erso
ns &
Pro
pert
y73
,172
10
8,07
6
18
0,96
7
14
2,85
5
14
9,76
1
17
5,35
8
16
9,02
9
16
8,58
0
14
8,34
2
12
0,68
7
U
tiliti
es &
Env
ironm
ent
144,
532
186,
395
147,
659
58,1
43
41,5
45
43,7
03
51,1
62
53,1
93
11,2
27
5,44
4
Tr
ansp
orta
tion
7,77
6
7,
315
6,62
5
7,
096
8,42
8
9,
239
9,22
5
12
, 100
67
,595
11
2,09
5
Ec
onom
ic E
nviro
nmen
t58
0,13
7
66
7,55
0
1,
111,
693
50
8,80
5
52
9,05
4
33
2,33
3
28
1,72
2
50
5,17
7
55
8,99
6
47
1,53
9
Cu
lture
& R
ecre
atio
n52
9,93
8
52
4,91
3
48
5,59
0
48
8,53
2
44
6,62
6
50
4,93
5
49
3,15
6
53
8,42
4
53
0,63
7
52
5,94
6
O
pera
ting
gran
ts a
nd c
ontr
ibut
ions
453,
211
421,
073
697,
301
403,
541
462,
488
477,
260
425,
702
468,
960
479,
485
496,
338
Capi
tal g
rant
s and
con
trib
utio
ns1,
330,
358
3,
353,
002
3,
958,
650
8,
170,
785
2,
616,
738
1,
539,
559
1,
547,
093
1,
758,
099
1,
493,
376
3,
673,
904
To
tal G
over
nmen
tal A
ctiv
ities
Pro
gram
Reve
nues
3,45
2,39
6
5,62
2,52
2
6,97
1,23
2
10,1
54,3
33
4,
625,
500
3,
459,
906
3,
623,
457
3,
961,
884
3,
725,
807
5,
863,
947
CHAN
GES
IN N
ET P
OSI
TIO
NLa
st T
en F
isca
l Yea
rs
106 2014 COMPREHENSIVE ANNUAL FINANCIAL REPORT
CITY OF POULSBO STATISTICAL SECTION
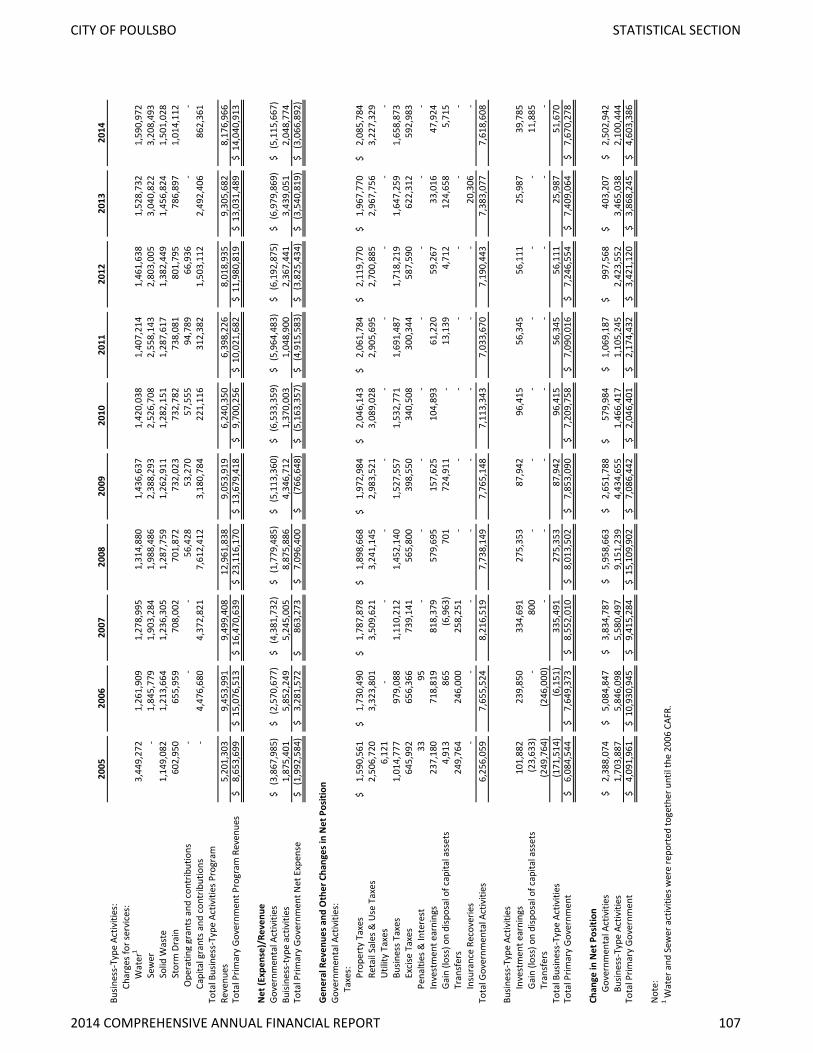
2005
2006
2007
2008
2009
2010
2011
2012
2013
2014
Busin
ess-
Type
Act
iviti
es:
Char
ges f
or se
rvic
es:
Wat
er1
3,44
9,27
2
1,26
1,90
9
1,27
8,99
5
1,31
4,88
0
1,43
6,63
7
1,42
0,03
8
1,40
7,21
4
1,46
1,63
8
1,52
8,73
2
1,59
0,97
2
Sew
er-
1,84
5,77
9
1,90
3,28
4
1,98
8,48
6
2,38
8,29
3
2,52
6,70
8
2,55
8,14
3
2,80
3,00
5
3,04
0,82
2
3,20
8,49
3
Solid
Was
te1,
149,
082
1,
213,
664
1,
236,
305
1,
287,
759
1,
262,
911
1,
282,
151
1,
287,
617
1,
382,
449
1,
456,
824
1,
501,
028
St
orm
Dra
in60
2,95
0
65
5,95
9
70
8,00
2
70
1,87
2
73
2,02
3
73
2,78
2
73
8,08
1
80
1,79
5
78
6,89
7
1,
014,
112
O
pera
ting
gran
ts a
nd c
ontr
ibut
ions
-
-
-
56
,428
53
,270
57
,555
94
,789
66
,936
-
-
Ca
pita
l gra
nts a
nd c
ontr
ibut
ions
-
4,
476,
680
4,
372,
821
7,
612,
412
3,
180,
784
22
1,11
6
31
2,38
2
1,
503,
112
2,
492,
406
86
2,36
1
To
tal B
usin
ess-
Type
Act
iviti
es P
rogr
amRe
venu
es5,
201,
303
9,
453,
991
9,
499,
408
12
,961
,838
9,05
3,91
9
6,24
0,35
0
6,39
8,22
6
8,01
8,93
5
9,30
5,68
2
8,17
6,96
6
Tota
l Prim
ary
Gov
ernm
ent P
rogr
am R
even
ues
8,65
3,69
9$
15,0
76,5
13$
16
,470
,639
$
23,1
16,1
70$
13
,679
,418
$
9,70
0,25
6$
10,0
21,6
82$
11
,980
,819
$
13,0
31,4
89$
14
,040
,913
$
Net
(Exp
ense
)/Re
venu
eG
over
nmen
tal A
ctiv
ities
(3,8
67,9
85)
$
(2,5
70,6
77)
$
(4,3
81,7
32)
$
(1,7
79,4
85)
$
(5,1
13,3
60)
$
(6,5
33,3
59)
$
(5,9
64,4
83)
$
(6,1
92,8
75)
$
(6,9
79,8
69)
$
(5,1
15,6
67)
$
Buisi
ness
-typ
e ac
tiviti
es1,
875,
401
5,
852,
249
5,
245,
005
8,
875,
886
4,
346,
712
1,
370,
003
1,
048,
900
2,
367,
441
3,
439,
051
2,
048,
774
To
tal P
rimar
y G
over
nmen
t Net
Exp
ense
(1,9
92,5
84)
$
3,28
1,57
2$
863,
273
$
7,09
6,40
0$
(766
,648
)$
(5,1
63,3
57)
$
(4,9
15,5
83)
$
(3,8
25,4
34)
$
(3,5
40,8
19)
$
(3,0
66,8
92)
$
Gen
eral
Rev
enue
s and
Oth
er C
hang
es in
Net
Pos
ition
Gov
ernm
enta
l Act
iviti
es:
Taxe
s:
Prop
erty
Tax
es1,
590,
561
$
1,
730,
490
$
1,
787,
878
$
1,
898,
668
$
1,
972,
984
$
2,
046,
143
$
2,
061,
784
$
2,
119,
770
$
1,
967,
770
$
2,
085,
784
$
Re
tail
Sale
s & U
se T
axes
2,50
6,72
03,
323,
801
3,
509,
621
3,24
1,14
52,
983,
521
3,08
9,02
82,
905,
695
2,70
0,88
52,
967,
756
3,22
7,32
9U
tility
Tax
es6,
121
-
-
-
-
-
-
-
-
-
Busin
ess T
axes
1,01
4,77
797
9,08
8
1,
110,
212
1,45
2,14
01,
527,
557
1,53
2,77
11,
691,
487
1,71
8,21
91,
647,
259
1,65
8,87
3Ex
cise
Tax
es64
5,99
265
6,36
6
73
9,14
156
5,80
039
8,55
034
0,50
830
0,34
458
7,59
062
2,31
259
2,98
3Pe
nalti
es &
Inte
rest
33
95
-
-
-
-
-
-
-
-
Inve
stm
ent e
arni
ngs
237,
180
718,
819
818,
379
579,
695
157,
625
104,
893
61,2
2059
,267
33,0
1647
,924
Gai
n (lo
ss) o
n di
spos
al o
f cap
ital a
sset
s4,
913
865
(6,9
63)
701
724,
911
-
13
,139
4,
712
124,
658
5,71
5
Tr
ansf
ers
249,
764
246,
000
258,
251
-
-
-
-
-
-
-
In
sura
nce
Reco
verie
s-
-
-
-
-
-
-
-
20
,306
-
Tota
l Gov
ernm
enta
l Act
iviti
es6,
256,
059
7,
655,
524
8,
216,
519
7,
738,
149
7,
765,
148
7,
113,
343
7,
033,
670
7,
190,
443
7,
383,
077
7,
618,
608
Busin
ess-
Type
Act
iviti
esIn
vest
men
t ear
ning
s10
1,88
2
23
9,85
0
33
4,69
1
27
5,35
3
87
,942
96
,415
56
,345
56
,111
25
,987
39
,785
G
ain
(loss
) on
disp
osal
of c
apita
l ass
ets
(23,
633)
-
80
0
-
-
-
-
-
-
11,8
85
Tran
sfer
s(2
49,7
64)
(246
,000
)
-
-
-
-
-
-
-
-
To
tal B
usin
ess-
Type
Act
iviti
es(1
71,5
14)
(6,1
51)
33
5,49
1
27
5,35
3
87
,942
96
,415
56
,345
56
,111
25
,987
51
,670
To
tal P
rimar
y G
over
nmen
t6,
084,
544
$
7,
649,
373
$
8,
552,
010
$
8,
013,
502
$
7,
853,
090
$
7,
209,
758
$
7,
090,
016
$
7,
246,
554
$
7,
409,
064
$
7,
670,
278
$
Chan
ge in
Net
Pos
ition
Gov
ernm
enta
l Act
iviti
es2,
388,
074
$
5,
084,
847
$
3,
834,
787
$
5,
958,
663
$
2,
651,
788
$
57
9,98
4$
1,
069,
187
$
99
7,56
8$
40
3,20
7$
2,
502,
942
$
Bu
sines
s-Ty
pe A
ctiv
ities
1,70
3,88
75,
846,
098
5,58
0,49
79,
151,
239
4,43
4,65
51,
466,
417
1,10
5,24
52,
423,
552
3,46
5,03
82,
100,
444
Tota
l Prim
ary
Gov
ernm
ent
4,09
1,96
1$
10,9
30,9
45$
9,
415,
284
$
15
,109
,902
$
7,08
6,44
2$
2,04
6,40
1$
2,17
4,43
2$
3,42
1,12
0$
3,86
8,24
5$
4,60
3,38
6$
Not
e:
1 Wat
er a
nd S
ewer
act
iviti
es w
ere
repo
rted
toge
ther
unt
il th
e 20
06 C
AFR.
2014 COMPREHENSIVE ANNUAL FINANCIAL REPORT 107
CITY OF POULSBO STATISTICAL SECTION
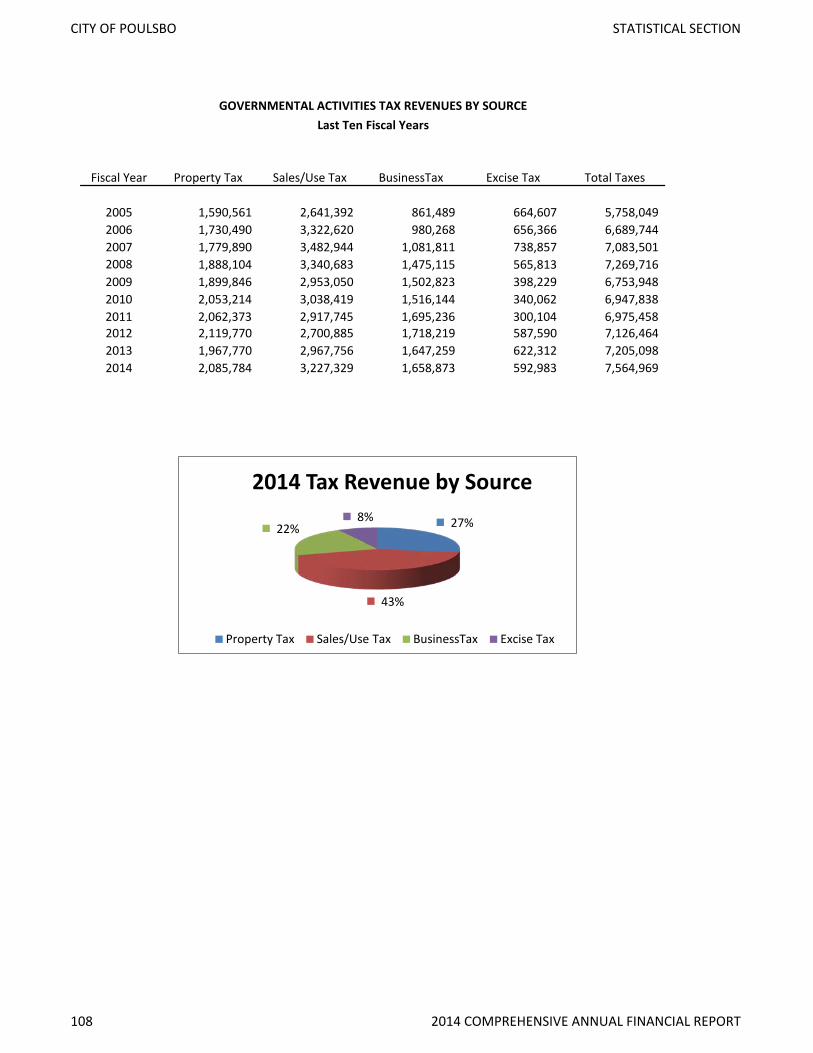
Fiscal Year Property Tax Sales/Use Tax BusinessTax Excise Tax Total Taxes
2005 1,590,561 2,641,392 861,489 664,607 5,758,049 2006 1,730,490 3,322,620 980,268 656,366 6,689,744 2007 1,779,890 3,482,944 1,081,811 738,857 7,083,501 2008 1,888,104 3,340,683 1,475,115 565,813 7,269,716 2009 1,899,846 2,953,050 1,502,823 398,229 6,753,948 2010 2,053,214 3,038,419 1,516,144 340,062 6,947,838 2011 2,062,373 2,917,745 1,695,236 300,104 6,975,458 2012 2,119,770 2,700,885 1,718,219 587,590 7,126,464 2013 1,967,770 2,967,756 1,647,259 622,312 7,205,098 2014 2,085,784 3,227,329 1,658,873 592,983 7,564,969
GOVERNMENTAL ACTIVITIES TAX REVENUES BY SOURCELast Ten Fiscal Years
27%
43%
22% 8%
2014 Tax Revenue by Source
Property Tax Sales/Use Tax BusinessTax Excise Tax
108 2014 COMPREHENSIVE ANNUAL FINANCIAL REPORT
CITY OF POULSBO STATISTICAL SECTION
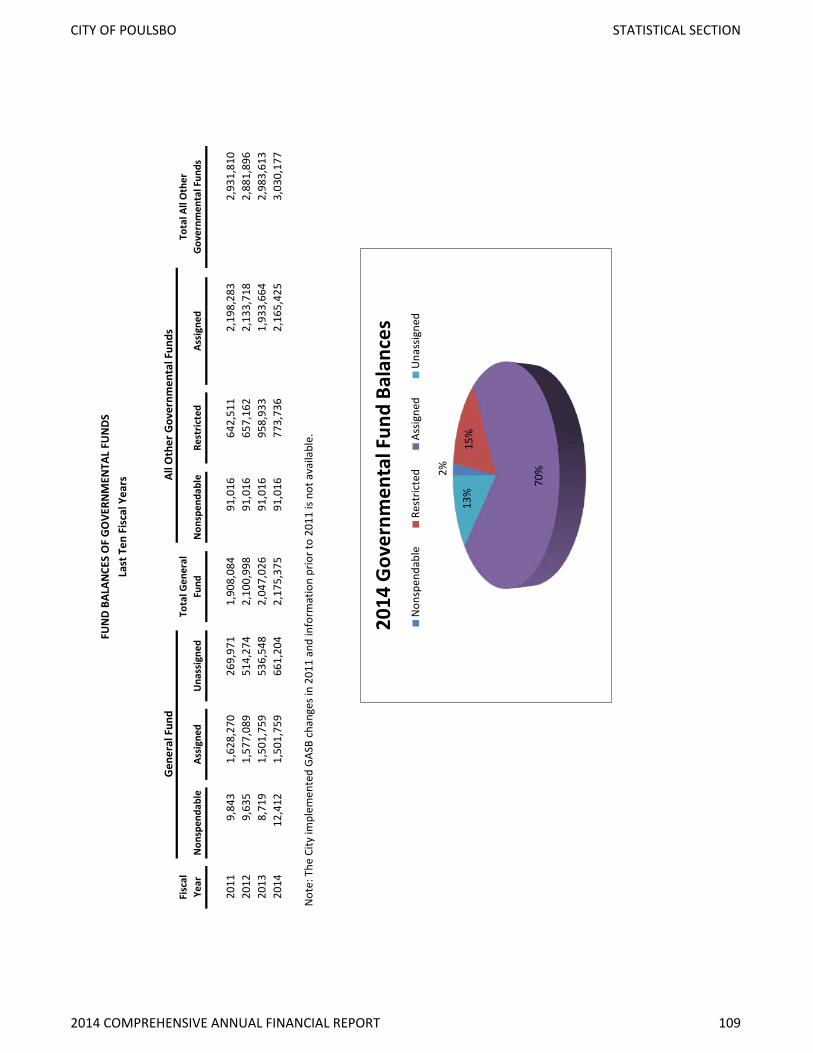
Fisc
al
Year
Non
spen
dabl
eAs
sign
edU
nass
igne
dTo
tal G
ener
al
Fund
Non
spen
dabl
eRe
stric
ted
Assi
gned
Tota
l All
Oth
er
Gove
rnm
enta
l Fun
ds
2011
9,84
3
1,
628,
270
269,
971
1,
908,
084
91,0
16
64
2,51
1
2,19
8,28
3
2,
931,
810
2012
9,63
5
1,
577,
089
514,
274
2,
100,
998
91,0
16
65
7,16
2
2,13
3,71
8
2,
881,
896
2013
8,71
9
1,
501,
759
536,
548
2,
047,
026
91,0
16
95
8,93
3
1,93
3,66
4
2,
983,
613
2014
12,4
12
1,
501,
759
661,
204
2,
175,
375
91,0
16
77
3,73
6
2,16
5,42
5
3,
030,
177
Not
e: T
he C
ity im
plem
ente
d GA
SB c
hang
es in
201
1 an
d in
form
atio
n pr
ior t
o 20
11 is
not
ava
ilabl
e.
Gen
eral
Fun
dAl
l Oth
er G
over
nmen
tal F
unds
FUN
D BA
LAN
CES
OF
GO
VERN
MEN
TAL
FUN
DSLa
st T
en F
isca
l Yea
rs
2%
15%
70%
13%
2014
Gov
ernm
enta
l Fun
d Ba
lanc
es
Non
spen
dabl
e Re
stric
ted
Assig
ned
Una
ssig
ned
2014 COMPREHENSIVE ANNUAL FINANCIAL REPORT 109
CITY OF POULSBO STATISTICAL SECTION

2005
2006
2007
2008
2009
2010
2011
2012
2013
2014
Reve
nues
Taxe
s5,
876,
048
$
6,
828,
714
$
7,
381,
362
$
7,
269,
716
$
6,
757,
754
$
6,94
7,83
8$
6,97
5,38
3$
7 ,19
4,17
1$
7,
155,
680
$
7,50
9,66
9$
Li
cens
es a
nd P
erm
its61
4,39
1
51
7,09
5
86
0,17
8
38
6,25
1
460,
321
39
7,51
3
351,
107
604,
450
622,
819
55
8,11
3
Inte
rgov
ernm
enta
l Rev
enue
s43
2,12
0
2,
155,
192
3,
014,
360
2,
117,
665
2,
893,
320
1,89
7,88
1
1,68
2,57
1
1,47
1,00
2
646,
175
3,
384,
699
Char
ges f
or S
ervi
ces
2,45
2,61
1
1,63
6,49
7
1,80
5,10
1
1,61
1,66
2
1,61
1,44
9
1,
501,
119
1,
710,
343
1,
656,
123
2,
190,
358
2,22
8,94
1
Fi
nes a
nd F
orte
iture
s97
,108
10
8,78
1
10
6,70
4
10
3,21
0
89,3
82
87
,184
85
,063
79
,049
76,7
29
83
,238
Inte
rest
& O
ther
Ear
ning
s23
1,41
5
71
0,24
8
81
1,65
4
57
6,96
7
156,
803
10
4,68
8
61,2
20
63,2
85
37
,631
52,3
55
M
iscel
lane
ous
226,
861
124,
439
213,
682
65,5
17
143,
996
12
2,60
0
138,
250
202,
158
203,
606
15
6,55
7
Tota
l Rev
enue
s9,
930,
555
12
,080
,967
14,1
93,0
41
12
,130
,988
12
,113
,024
11,0
58,8
23
11,0
03,9
36
11
,270
,239
10,9
32,9
98
13,9
73,5
73
Expe
nditu
res
Gene
ral G
over
nmen
t 1,
880,
437
2,
222,
182
2,
401,
891
2,
510,
110
2,
557,
344
2,62
3,12
9
2,60
9,57
5
2,76
5,46
3
2,70
1,16
7
2,
704,
029
Secu
rity
of P
erso
ns a
nd P
rope
rty
2,01
0,46
3
2,11
6,77
0
2,37
7,81
8
2,28
9,65
5
2,54
4,11
5
2,
648,
619
2,
516,
324
2,
557,
190
2,
764,
164
2,84
7,12
8
U
tiliti
es a
nd E
nviro
nmen
t42
5,83
9
49
7,43
7
56
6,15
6
58
5,59
1
474,
649
46
0,41
7
479,
286
455,
458
512,
596
44
3,94
0
Tran
spor
tatio
n61
2,29
6
67
5,21
7
2,
756,
203
2,
657,
624
83
7,42
7
819,
169
74
0,21
4
74
4,42
4
1,
533,
295
1,55
9,69
4
Ec
onom
ic E
nviro
men
t63
4,26
3
73
8,91
7
83
9,26
9
89
1,60
8
845,
073
85
7,60
4
630,
374
660,
244
785,
598
88
6,38
7
Men
tal a
nd P
hysic
al H
ealth
12,4
89
12,8
38
13,4
89
13,6
94
14,2
13
14
,481
14
,573
14
,705
13,9
78
14
,356
Cultu
re a
nd R
ecre
atio
n1,
201,
711
1,
290,
717
1,
553,
747
1,
779,
008
1,
218,
559
1,20
9,30
5
1,12
5,45
9
1,17
3,37
9
1,08
0,95
1
1,
097,
577
Capi
tal O
utla
y1,
687,
441
4,
703,
590
2,
572,
498
3,
624,
733
7,
788,
933
8,90
7,25
9
2,66
2,20
4
1,52
2,99
0
856,
046
3,
196,
591
Debt
Ser
vice
Prin
cipa
l38
4,32
3
57
9,32
3
57
4,32
3
1,
199,
323
70
4,32
3
604,
368
63
4,36
8
3,
114,
368
57
9,36
8
589,
368
In
tere
st &
Fisc
al C
harg
es15
0,67
0
33
2,35
5
32
3,95
1
30
3,19
0
430,
172
50
6,69
2
493,
171
513,
038
495,
456
47
9,81
4
Tota
l Exp
endi
ture
s8,
999,
932
13
,169
,345
13,9
79,3
45
15
,854
,538
17
,414
,810
18,6
51,0
45
11,9
05,5
48
13
,521
,260
11,3
22,6
19
13,8
18,8
85
Exce
ss o
f rev
enue
s ov
er (u
nder
) exp
endi
ture
s93
0,62
3
(1
,088
,379
)
213,
696
(3,7
23,5
50)
(5
,301
,785
)
(7
,592
,223
)
(901
,612
)
(2
,251
,020
)
(3
89,6
20)
15
4,68
8
Oth
er fi
nanc
ing
sour
ces (
uses
)Pr
ocee
ds o
f Lon
g Te
rm D
ebt
5,18
5,00
0
-
-
-
6,
096,
515
1,51
0,00
0
625,
000
2,45
5,00
0
-
-
Prem
ium
on
Bond
s Sol
d-
-
-
-
-
1,04
4
-
69,6
30
-
-
Di
spos
al o
f Cap
ital A
sset
s4,
913
865
-
2,18
0
2,
800,
000
20,0
00
16,9
70
4,71
2
272,
103
5,
715
Co
mp
for I
mpa
irmen
t of C
ap A
sset
s-
-
-
-
-
-
273,
639
-
20
,306
7,52
8
Insu
ranc
e Re
cove
ries
-
-
-
-
-
-
-
-
-
613
Net
Tra
nsfe
rs In
(Out
)15
,260
51
,985
67
,350
-
-
98,8
00
-
-
-
-
Inte
rgov
ernm
enta
l Pay
men
t-
-
-
(1
5,00
0)
-
-
-
-
-
-
Is
suan
ce D
iscou
nt o
n Lo
ng-T
erm
Deb
t(8
2,45
1)
-
-
-
(54,
071)
(6,4
73)
-
(3
4,56
1)
-
-
To
tal o
ther
fina
ncin
g so
urce
s (us
es)
5,12
2,72
2
52,8
50
67,3
50
(12,
820)
8,
842,
445
1,62
3,37
1
915,
609
2,49
4,78
1
292,
408
13
,856
Net
cha
nge
in fu
nd b
alan
ces
6,05
3,34
5$
(1,0
35,5
29)
$
28
1,04
6$
(3
,736
,370
)$
3,54
0,65
9$
(5
,968
,852
)$
13,9
97$
243,
760
$
(97,
212)
$
16
8,54
4$
Debt
serv
ice
as a
per
cent
age
of
nonc
apita
l exp
endi
ture
s7.
32%
10.7
7%7.
87%
12.2
9%11
.79%
11.4
0%12
.20%
30.2
3%10
.27%
10.0
7%
CHAN
GES
IN F
UN
D BA
LAN
CES
OF
GO
VERN
MEN
TAL
FUN
DSLa
st T
en F
isca
l Yea
rs
110 2014 COMPREHENSIVE ANNUAL FINANCIAL REPORT
CITY OF POULSBO STATISTICAL SECTION

Fisc
al
Year
Taxe
s
Lice
nses
an
d Pe
rmits
Inte
r-go
v Ch
arge
sCh
arge
s for
Se
rvic
esFi
nes a
nd
Forf
eits
Mis
c.To
tal
Reve
nues
Capi
tal
Rela
ted
Debt
Is
sues
Insu
ranc
e Re
cove
ry
Sale
of
Capi
tal
Asse
tsN
et T
rans
fers
in
(out
)
Fina
ncin
g So
urce
s (U
ses)
Tota
l Re
venu
es a
nd
Oth
er S
ourc
es
2004
5,25
5,33
3
38
2,28
5
1,
151,
526
1,36
4,58
1
10
4,85
9
39
6,13
4
8,65
4,71
8
42,9
44
-
1,87
8
58,0
79
102,
901
8,75
7,61
9
2005
5,87
6,04
8
61
4,39
1
43
2,12
0
2,45
2,61
1
97
,108
22
6,86
1
9,69
9,13
9
5,10
2,54
9
-
4,91
3
15,2
60
5,12
2,72
2
14
,821
,861
2006
6,82
8,71
4
51
7,09
5
2,
155,
192
1,63
6,49
7
10
8,78
1
83
4,68
7
12,0
80,9
67
-
-
86
5
51
,985
52
,850
12,1
33,8
17
20
077,
381,
362
860,
178
3,01
4,36
0
1,
805,
101
106,
704
1,02
5,33
6
14
,193
,041
-
-
-
67
,350
67
,350
14,2
60,3
91
20
087,
269,
716
386,
251
2,11
7,66
5
1,
611,
662
103,
210
642,
483
12
,130
,988
(15,
000)
-
2,
180
-
(12,
820)
12,1
18,1
68
20
096,
757,
754
460,
321
2,89
3,32
0
1,
611,
449
89,3
82
300,
799
12
,113
,024
6,04
2,44
5
-
2,80
0,00
0
-
8,84
2,44
5
20
,955
,469
2010
6,94
7,83
8
39
7,51
3
1,
897,
881
1,50
1,11
9
87
,184
22
7,28
8
11,0
58,8
23
31
1,04
4
-
1,
213,
527
98,8
00
1,62
3,37
1
12
,682
,193
2011
6,97
5,38
335
1,10
71,
682,
571
1,71
0,34
385
,063
199,
470
11,0
03,9
36
27
3,63
9
-
64
1,97
0
-
91
5,60
9
11
,919
,545
2012
7,19
4,17
160
4,45
01,
471,
002
1,65
6,12
379
,049
265,
444
11,2
70,2
39
2,
490,
069
-
4,
712
-
2,49
4,78
1
13
,765
,020
2013
7,15
5,68
062
2,81
964
6,17
52,
190,
358
76,7
2924
1,23
710
,932
,998
-
2,
297
29
0,11
2
-
29
2,40
8
11
,225
,407
2014
7,50
9,66
955
8,11
3
3,
384,
699
2,22
8,94
1
83
,238
20
8,91
213
,973
,573
-
613
13,2
43
-
13
,856
13,9
87,4
29
REVE
NU
ESO
THER
FIN
ANCI
NG
SO
URC
ES (U
SES)
GEN
ERAL
GO
VERN
MEN
TAL
REVE
NU
ES B
Y SO
URC
ELa
st T
en F
isca
l Yea
rs
Taxe
s 54
%
Lice
nses
and
Per
mits
4%
Inte
rgov
ernm
enta
l
24%
Char
ges f
or S
ervi
ces
16%
Fine
s and
For
feits
1%
Misc
ella
neou
s 1%
Insu
ranc
e Re
cove
ries
0% 20
14 G
ener
al G
over
nmen
tal R
even
ue
2014 COMPREHENSIVE ANNUAL FINANCIAL REPORT 111
CITY OF POULSBO STATISTICAL SECTION
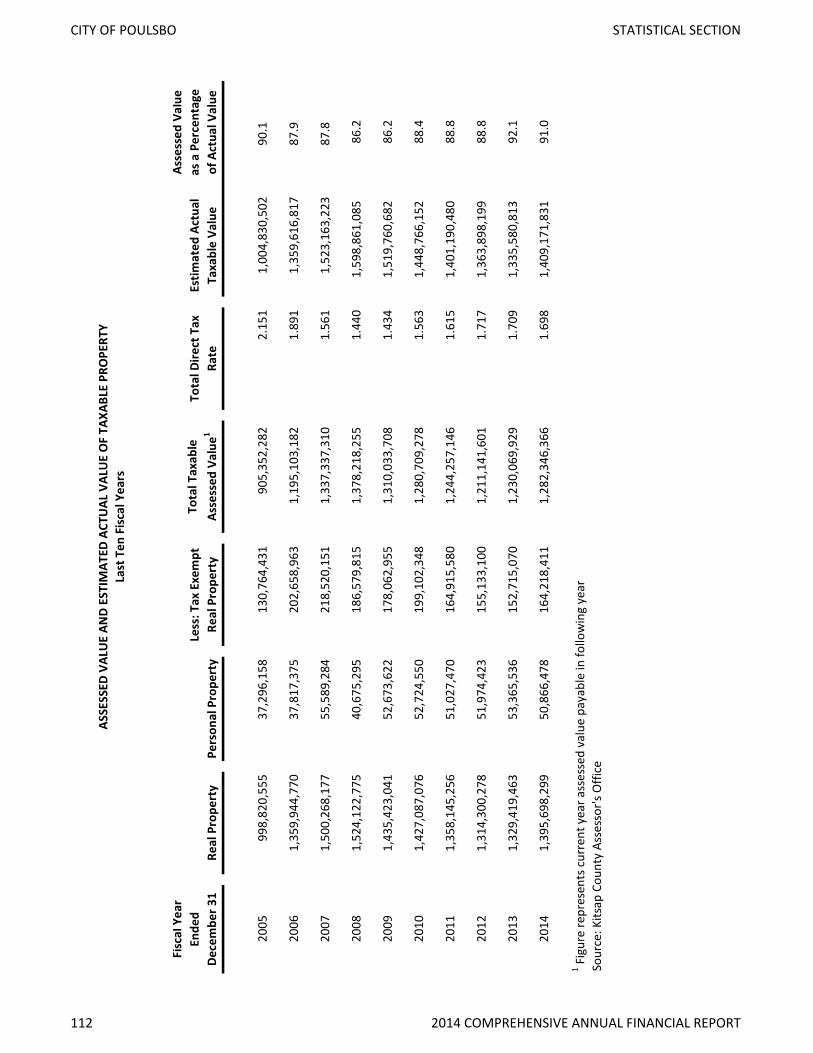
Fisc
al Y
ear
Ende
d De
cem
ber 3
1Re
al P
rope
rty
Pers
onal
Pro
pert
yLe
ss: T
ax E
xem
pt
Real
Pro
pert
yTo
tal T
axab
le
Asse
ssed
Val
ue1
Tota
l Dire
ct T
ax
Rate
Estim
ated
Act
ual
Taxa
ble
Valu
e
Asse
ssed
Val
ue
as a
Per
cent
age
of A
ctua
l Val
ue
2005
998,
820,
555
37,2
96,1
5813
0,76
4,43
190
5,35
2,28
2
2.
151
1,00
4,83
0,50
290
.1
2006
1,35
9,94
4,77
037
,817
,375
202,
658,
963
1,19
5,10
3,18
2
1.89
11,
359,
616,
817
87.9
2007
1,50
0,26
8,17
755
,589
,284
218,
520,
151
1,33
7,33
7,31
0
1.56
11,
523,
163,
223
87.8
2008
1,52
4,12
2,77
540
,675
,295
186,
579,
815
1,37
8,21
8,25
5
1.44
01,
598,
861,
085
86.2
2009
1,43
5,42
3,04
152
,673
,622
178,
062,
955
1,31
0,03
3,70
8
1.43
41,
519,
760,
682
86.2
2010
1,42
7,08
7,07
652
,724
,550
199,
102,
348
1,28
0,70
9,27
8
1.56
31,
448,
766,
152
88.4
2011
1,35
8,14
5,25
651
,027
,470
164,
915,
580
1,24
4,25
7,14
6
1.61
51,
401,
190,
480
88.8
2012
1,31
4,30
0,27
851
,974
,423
155,
133,
100
1,21
1,14
1,60
1
1.71
71,
363,
898,
199
88.8
2013
1,32
9,41
9,46
353
,365
,536
152,
715,
070
1,23
0,06
9,92
9
1.70
91,
335,
580,
813
92.1
2014
1,39
5,69
8,29
950
,866
,478
164,
218,
411
1,28
2,34
6,36
6
1.69
81,
409,
171,
831
91.0
1 Fig
ure
repr
esen
ts c
urre
nt y
ear a
sses
sed
valu
e pa
yabl
e in
follo
win
g ye
arSo
urce
: Kits
ap C
ount
y As
sess
or's
Offi
ce
ASSE
SSED
VAL
UE
AND
ESTI
MAT
ED A
CTU
AL V
ALU
E O
F TA
XABL
E PR
OPE
RTY
Last
Ten
Fis
cal Y
ears
112 2014 COMPREHENSIVE ANNUAL FINANCIAL REPORT
CITY OF POULSBO STATISTICAL SECTION
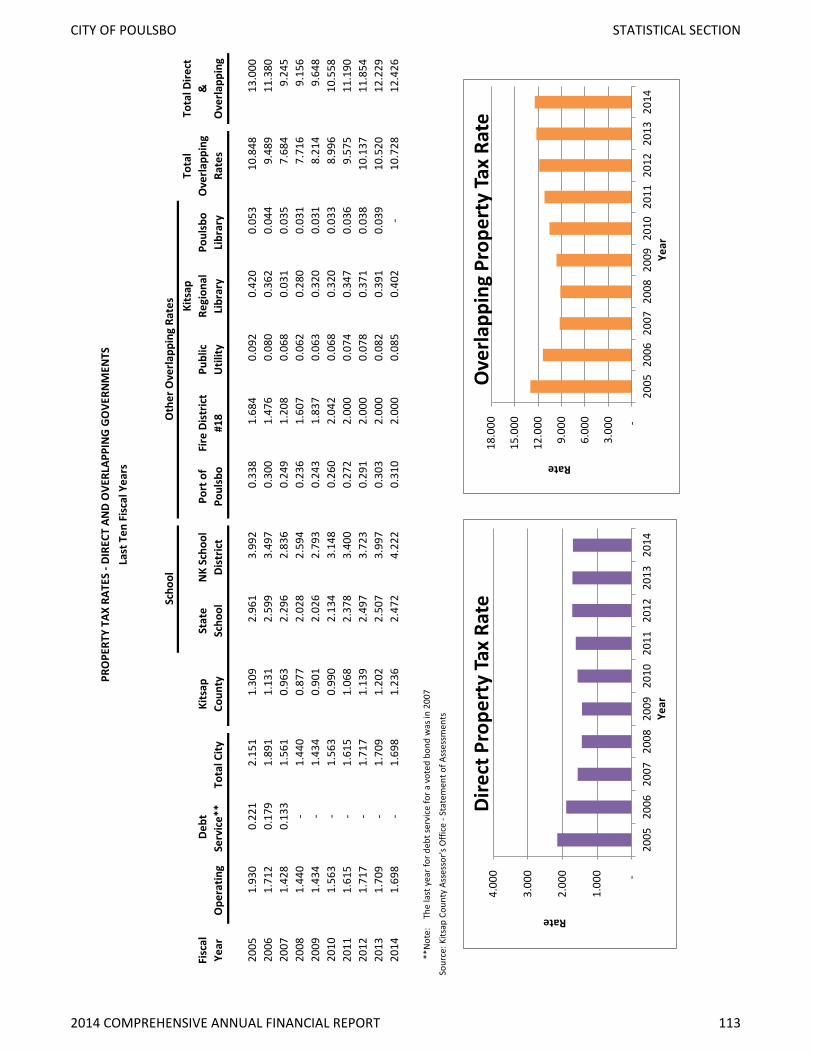
Fisc
al
Year
Ope
ratin
g
Deb
t Se
rvic
e**
Tota
l City
Kits
ap
Coun
tySt
ate
Scho
olN
K Sc
hool
Di
stric
tPo
rt o
f Po
ulsb
oFi
re D
istr
ict
#18
Publ
ic
Util
ity
Kits
ap
Regi
onal
Li
brar
yPo
ulsb
o Li
brar
y
Tota
l O
verla
ppin
g Ra
tes
Tota
l Dire
ct
&
Ove
rlapp
ing
2005
1.93
0
0.
221
2.15
1
1.
309
2.96
1
3.
992
0.33
8
1.
684
0.09
2
0.
420
0.05
3
10
.848
13.0
00
20
061.
712
0.17
9
1.
891
1.13
1
2.
599
3.49
7
0.
300
1.47
6
0.
080
0.36
2
0.
044
9.48
9
11
.380
2007
1.42
8
0.
133
1.56
1
0.
963
2.29
6
2.
836
0.24
9
1.
208
0.06
8
0.
031
0.03
5
7.
684
9.24
5
20
081.
440
-
1.44
0
0.
877
2.02
8
2.
594
0.23
6
1.
607
0.06
2
0.
280
0.03
1
7.
716
9.15
6
20
091.
434
-
1.43
4
0.
901
2.02
6
2.
793
0.24
3
1.
837
0.06
3
0.
320
0.03
1
8.
214
9.64
8
20
101.
563
-
1.56
3
0.
990
2.13
4
3.
148
0.26
0
2.
042
0.06
8
0.
320
0.03
3
8.
996
10.5
58
20
111.
615
-
1.61
5
1.
068
2.37
8
3.
400
0.27
2
2.
000
0.07
4
0.
347
0.03
6
9.
575
11.1
90
20
121.
717
-
1.71
7
1.
139
2.49
7
3.
723
0.29
1
2.
000
0.07
8
0.
371
0.03
8
10
.137
11.8
54
20
131.
709
-
1.70
9
1.
202
2.50
7
3.
997
0.30
3
2.
000
0.08
2
0.
391
0.03
9
10
.520
12.2
29
20
141.
698
-
1.69
8
1.
236
2.47
2
4.
222
0.31
0
2.
000
0.08
5
0.
402
-
10.7
28
12
.426
**N
ote:
Th
e la
st y
ear f
or d
ebt s
ervi
ce fo
r a v
oted
bon
d w
as in
200
7
Sour
ce: K
itsap
Cou
nty
Asse
ssor
's O
ffice
- St
atem
ent o
f Ass
essm
ents
PRO
PERT
Y TA
X RA
TES
- DIR
ECT
AND
OVE
RLAP
PIN
G G
OVE
RNM
ENTS
Last
Ten
Fis
cal Y
ears
Scho
olO
ther
Ove
rlapp
ing
Rate
s
-
1.0
00
2.0
00
3.0
00
4.0
00
2005
20
06
2007
20
08
2009
20
10
2011
20
12
2013
20
14
Rate
Year
Dire
ct P
rope
rty
Tax
Rate
-
3.0
00
6.0
00
9.0
00
12.
000
15.
000
18.
000
2005
200
6 20
07 2
008
2009
201
0 20
11 2
012
2013
201
4
Rate
Year
Ove
rlapp
ing
Prop
erty
Tax
Rat
e
2014 COMPREHENSIVE ANNUAL FINANCIAL REPORT 113
CITY OF POULSBO STATISTICAL SECTION
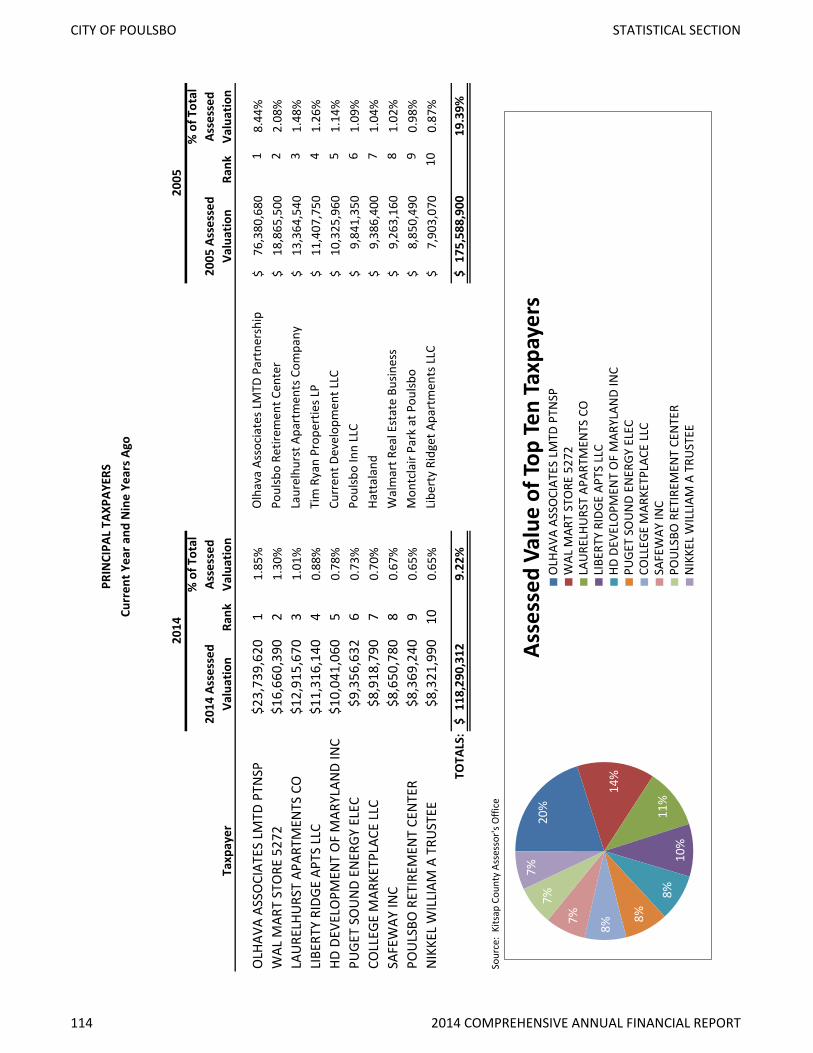
OLH
AVA
ASSO
CIAT
ES L
MTD
PTN
SP$2
3,73
9,62
01
1.85
%O
lhav
a As
soci
ates
LM
TD P
artn
ersh
ip76
,380
,680
$
1
8.44
%W
AL M
ART
STO
RE 5
272
$16,
660,
390
21.
30%
Poul
sbo
Retir
emen
t Cen
ter
18,8
65,5
00$
22.
08%
LAU
RELH
URS
T AP
ARTM
ENTS
CO
$12,
915,
670
31.
01%
Laur
elhu
rst A
part
men
ts C
ompa
ny13
,364
,540
$
3
1.48
%LI
BERT
Y RI
DGE
APTS
LLC
$11,
316,
140
40.
88%
Tim
Rya
n Pr
oper
ties L
P11
,407
,750
$
4
1.26
%HD
DEV
ELO
PMEN
T O
F M
ARYL
AND
INC
$10,
041,
060
50.
78%
Curr
ent D
evel
opm
ent L
LC10
,325
,960
$
5
1.14
%PU
GET
SOU
ND
ENER
GY E
LEC
$9,3
56,6
326
0.73
%Po
ulsb
o In
n LL
C9,
841,
350
$
61.
09%
COLL
EGE
MAR
KETP
LACE
LLC
$8,9
18,7
907
0.70
%Ha
ttal
and
9,38
6,40
0$
7
1.04
%SA
FEW
AY IN
C$8
,650
,780
80.
67%
Wal
mar
t Rea
l Est
ate
Busin
ess
9,26
3,16
0$
8
1.02
%PO
ULS
BO R
ETIR
EMEN
T CE
NTE
R$8
,369
,240
90.
65%
Mon
tcla
ir Pa
rk a
t Pou
lsbo
8,85
0,49
0$
9
0.98
%N
IKKE
L W
ILLI
AM A
TRU
STEE
$8,3
21,9
9010
0.65
%Li
bert
y Ri
dget
Apa
rtm
ents
LLC
7,90
3,07
0$
10
0.87
%
TOTA
LS:
118,
290,
312
$
9.22
%17
5,58
8,90
0$
19
.39%
Sour
ce:
Kits
ap C
ount
y As
sess
or's
Offi
ce
% o
f Tot
al
Asse
ssed
Va
luat
ion
Taxp
ayer
2014
2005
PRIN
CIPA
L TA
XPAY
ERS
Curr
ent Y
ear a
nd N
ine
Year
s Ago
Rank
Rank
2014
Ass
esse
d Va
luat
ion
% o
f Tot
al
Asse
ssed
Va
luat
ion
2005
Ass
esse
d Va
luat
ion
20%
14%
11%
10
%
8%
8%
8% 7%
7%
7%
Asse
ssed
Val
ue o
f Top
Ten
Taxp
ayer
s O
LHAV
A AS
SOCI
ATES
LM
TD P
TNSP
W
AL M
ART
STO
RE 5
272
LA
URE
LHU
RST
APAR
TMEN
TS C
O
LIBE
RTY
RIDG
E AP
TS L
LC
HD D
EVEL
OPM
ENT
OF
MAR
YLAN
D IN
C PU
GET
SOU
ND
ENER
GY E
LEC
COLL
EGE
MAR
KETP
LACE
LLC
SA
FEW
AY IN
C PO
ULS
BO R
ETIR
EMEN
T CE
NTE
R N
IKKE
L W
ILLI
AM A
TRU
STEE
114 2014 COMPREHENSIVE ANNUAL FINANCIAL REPORT
CITY OF POULSBO STATISTICAL SECTION

Fiscal Year
Total Tax Levy Amount % of Levy
Delinquent Tax
Collected Amount % of Levy
Outstanding Delinquent Taxes (ODT)
ODT As % of Current
Levy
2005 1,589,053 1,550,699 97.59% 35,446 1,586,145 99.82% 2,908 0.18%2006 1,710,873 1,685,921 98.54% 21,896 1,707,817 99.82% 3,056 0.18%2007 1,864,277 1,820,831 97.67% 41,358 1,862,189 99.89% 2,088 0.11%2008 1,925,724 1,873,649 97.30% 49,490 1,923,139 99.87% 2,585 0.13%2009 1,976,950 1,900,928 96.15% 73,293 1,974,221 99.86% 2,729 0.14%2010 2,047,191 1,981,228 96.78% 62,958 2,044,186 99.85% 3,005 0.15%2011 2,067,936 1,995,773 96.51% 64,486 2,060,259 99.63% 7,677 0.37%2012 2,136,431 2,083,452 97.52% 36,030 2,119,482 99.21% 16,949 0.79%2013 2,069,802 1,994,508 96.36% 4,018 1,998,526 96.56% 71,276 3.44%2014 2,088,707 2,030,020 97.19% (298) 2,029,722 97.18% 58,985 2.82%
Source: Kitsap County Treasurer and Assessor's Office
PROPERTY TAX LEVIES AND COLLECTIONS
Collected within the Fiscal Year of the Levy Total Collections to Date
2005 - 2014
-
500,000
1,000,000
1,500,000
2,000,000
2,500,000
2005 2006 2007 2008 2009 2010 2011 2012 2013 2014
Total Collected To Date
Total Collected To Date
2014 COMPREHENSIVE ANNUAL FINANCIAL REPORT 115
CITY OF POULSBO STATISTICAL SECTION

2005 2006 2007 2008 2009 2010 2011 2012 2013 2014 (a)
Basic Sales Tax RatesCity of Poulsbo 1.0% 1.0% 1.0% 1.0% 1.0% 1.0% 1.0% 1.0% 1.0% 1.0%Washington State 6.5% 6.5% 6.5% 6.5% 6.5% 6.5% 6.5% 6.5% 6.5% 6.5%Kitsap Transit 0.8% 0.8% 0.8% 0.8% 0.8% 0.8% 0.8% 0.8% 0.8% 0.8%Criminal Justice 0.1% 0.1% 0.1% 0.1% 0.1% 0.1% 0.1% 0.1% 0.1% 0.1%County Jail Expansion 0.1% 0.1% 0.1% 0.1% 0.1% 0.1% 0.1% 0.1% 0.1% 0.1%Emergency Communication 0.1% 0.1% 0.1% 0.1% 0.1% 0.1% 0.1% 0.1% 0.1% 0.1%Chemical Dependency/Mental Health Services 0.0% 0.0% 0.0% 0.0% 0.0% 0.0% 0.0% 0.0% 0.0% 0.1%
Total Basic Combined Sales Tax Rate 8.6% 8.6% 8.6% 8.6% 8.6% 8.6% 8.6% 8.6% 8.6% 8.7%
Special Sales Tax Rates
Hotel/Motel (b) 2.0% 2.0% 2.0% 2.0% 2.0% 2.0% 2.0% 2.0% 2.0% 2.0%
(a) Effective 2014, Kitsap County increased the rate one tenth of one percent (.1%) for chemical dependency or mental health treatment services
(a) In effect since 1998, this 2% Hotel/Motel Tax was approved by Ordinance 98-03 in accordance with RCW 82.08
Source: Washington State Department of Revenue Local Sales and Use Tax Rates
SALES TAX RATE DIRECT AND OVERLAPPING GOVERNMENTSLast Ten Fiscal Years
12%
75%
9% 1%
1% 1%
1%
Sales Tax Distribution - 2014
City of Poulsbo
Washington State
Kitsap Transit
Criminal Justice
County Jail Expansion
Emergency Communication
Chemical Dependency/Mental Health Services
116 2014 COMPREHENSIVE ANNUAL FINANCIAL REPORT
CITY OF POULSBO STATISTICAL SECTION

2005
2006
2007
2008
2009
2010
2011
2012
2013
2014
Maj
or In
dust
ry S
ecto
rU
nkno
wn
8,04
4
13,3
73
15,1
40
8,52
9
4,72
1
22,1
44
41,1
21
36,4
48
37,2
66
13,9
03
Agric
ultu
re, F
ores
try
Fish
ing
232
567
459
526
665
620
593
800
886
662
Min
ing
298
334
150
96
252
556
384
427
464
636
Util
ities
1,01
8
1,53
8
1,69
4
2,86
6
2,61
8
1,87
6
2,08
1
2,74
4
3,51
2
3,03
9
Cons
truc
tion
427,
005
467,
266
454,
627
420,
541
273,
295
318,
387
316,
718
142,
181
294,
260
318,
024
Man
ufac
turin
g21
,837
27
,855
38
,137
34
,999
30
,774
34
,968
40
,558
34
,385
27
,948
49
,122
W
hole
sale
Tra
de14
4,85
1
13
5,92
9
15
0,27
3
14
4,84
9
91
,669
86
,317
89
,855
90
,710
98
,657
11
0,34
1
Re
tail
Trad
e1,
232,
464
1,
815,
464
1,
888,
749
1,
780,
157
1,
712,
476
1,
747,
160
1,
692,
686
1,
657,
265
1,
703,
931
1,
863,
729
Tr
ansp
orta
tion
and
War
ehou
sing
2,17
2
2,09
4
1,59
3
1,09
3
1,18
8
1,56
6
1,92
1
2,70
7
1,91
4
2,26
2
Info
rmat
ion
101,
994
108,
898
78,9
40
103,
749
101,
511
104,
216
88,2
26
84,8
23
91,5
04
102,
047
Fina
nce
and
Insu
ranc
e11
,817
19
,385
18
,841
15
,116
7,
962
7,
174
9,
228
8,
760
11
,653
11
,033
Re
al E
stat
e, R
enta
l, Le
asin
g64
,113
68
,775
66
,251
59
,476
75
,948
55
,022
41
,234
52
,455
54
,208
61
,165
Pr
of S
ci, T
echn
ical
Svc
s34
,326
33
,269
38
,658
42
,981
43
,304
31
,335
29
,699
27
,102
33
,033
43
,310
Co
mpa
ny M
anag
emen
t20
8
21
4
17
5
89
37
17
6
-
-
-
Adm
in, S
upp,
Rem
ed S
vcs
32,0
93
38,4
46
37,4
46
39,0
76
32,0
01
31,3
10
36,7
95
36,4
87
43,2
61
46,0
06
Educ
atio
nal S
ervi
ces
4,61
5
4,05
8
7,01
7
6,38
0
5,98
8
6,39
3
6,52
1
5,09
6
5,80
4
4,62
5
Hea
lth C
are
Soci
al A
ssis
tanc
e6,
210
6,
927
13
,924
10
,820
13
,310
8,
280
8,
885
19
,078
17
,443
13
,022
Ar
ts, E
nter
tain
, Rec
reat
ion
6,48
4
11,6
50
12,9
97
13,7
49
6,97
1
10,2
45
12,6
99
9,23
9
9,23
3
13,0
43
Acco
mm
odat
ion
and
Food
Svc
s.23
6,11
9
24
1,04
4
23
7,13
4
24
9,80
1
27
3,30
8
28
2,39
4
28
6,24
4
29
2,74
9
29
1,62
3
33
3,33
6
O
ther
Ser
vice
s79
,433
86
,062
90
,581
88
,906
80
,180
83
,445
76
,553
72
,163
75
,236
84
,693
Pu
blic
Adm
inis
trat
ion
567
12
21
245
18,3
65
16,8
06
18,0
65
18,0
32
23,1
96
28,6
95
Tota
l Ret
ail S
ales
Tax
Rev
enue
s*$2
,415
,900
$3,0
83,1
60$3
,152
,807
$3,0
24,0
44$2
,776
,543
$2,8
50,2
32$2
,800
,072
$2,5
93,6
51$2
,825
,032
$3,1
02,6
93
*The
reve
nues
refle
cted
her
e ar
e ba
sed
on ti
me
of re
port
ing
so d
o no
t rep
rese
nt th
e sa
me
amou
nt a
s rep
orte
d in
fina
ncia
ls
Sour
ces:
City
of P
ouls
bo F
inan
ce D
epar
tmen
t and
Was
hing
ton
Stat
e De
part
men
t of R
even
ue
RETA
IL S
ALES
TAX
REV
ENU
E BY
SEC
TOR
La
st T
en F
isca
l Yea
rs
2014 COMPREHENSIVE ANNUAL FINANCIAL REPORT 117
CITY OF POULSBO STATISTICAL SECTION

Fisc
al
Year
Gen
eral
O
blig
atio
n Bo
nds
PWTF
Loa
nsW
ater
Bon
dsSe
wer
Bon
dsPW
TF L
oans
Tota
l Prim
ary
Gov
ernm
ent
Perc
enta
ge o
f Pe
rson
al
Inco
me1
Per C
apita
1
2005
7,46
5,00
0
1,
155,
344
974,
380
3,
729,
620
457,
477
13
,781
,821
5.11
%1,
850
2006
7,41
5,00
0
1,
071,
021
933,
900
3,
451,
100
412,
630
13
,283
,651
4.59
%1,
774
2007
6,92
5,00
0
98
6,69
8
893,
200
3,
166,
800
366,
782
12
,338
,480
4.04
%1,
632
2008
5,81
0,00
0
90
2,37
5
818,
180
2,
900,
820
320,
934
10
,752
,309
3.28
%1,
371
2009
11,2
05,0
00
818,
051
74
0,74
0
2,62
6,26
0
27
5,08
6
15,6
65,1
37
4.
19%
1,76
9
20
1010
,985
,000
74
3,68
3
659,
340
2,
337,
660
229,
239
14
,954
,922
4.07
%1,
677
2011
10,4
25,0
00
669,
315
57
5,08
0
2,03
8,92
0
18
3,39
1
13,8
91,7
06
3.
52%
1,50
3
20
1211
,665
,000
59
4,94
6
487,
960
1,
730,
040
137,
543
14
,615
,489
3.50
%1,
561
2013
11,1
60,0
00
520,
578
39
6,88
0
1,40
7,12
0
91
,696
13
,576
,274
3.11
%1,
416
2014
10,6
45,0
00
446,
210
30
2,50
0
1,07
2,50
0
45
,848
12
,512
,058
0%1,
305
Not
e: D
etai
ls re
gard
ing
the
city
's ou
tsta
ndin
g de
bt c
an b
e fo
und
in th
e no
tes t
o th
e fin
anci
al st
atem
ents
.1 S
ee th
e Sc
hedu
le o
f Dem
ogra
phic
and
Eco
nom
ic S
tatis
tics f
or p
erso
nal i
ncom
e an
d po
pula
tion
data
. *P
erce
ntag
e of
Per
sona
l Inc
ome
data
onl
y av
aila
ble
thro
ugh
2013
.
RATI
OS
OF
OU
TSTA
NDI
NG
DEB
T BY
TYP
E
Gov
ernm
enta
l Act
iviti
esBu
sine
ss-T
ype
Activ
ities
Last
Ten
Fis
cal Y
ears
-
3,0
00,0
00
6,0
00,0
00
9,0
00,0
00
12,
000,
000
15,
000,
000
18,
000,
000
2005
20
06
2007
20
08
2009
20
10
2011
20
12
2013
20
14
Prim
ary
Gov
ernm
ent
Deb
t
118 2014 COMPREHENSIVE ANNUAL FINANCIAL REPORT
CITY OF POULSBO STATISTICAL SECTION

Fiscal YearGeneral Obligation
Bonds
Less: Amounts Available in Debt
Service Fund Total
% of Estimated Actual Taxable
Value1 of PropertyPer
Capita2
2005 7,910,000 395,506 7,514,494 0.55% 1,003 2006 7,415,000 483,345 6,931,655 0.46% 917 2007 6,925,000 463,990 6,461,010 0.40% 824 2008 5,810,000 254,032 5,555,968 0.37% 627 2009 11,205,000 99,362 11,105,638 0.77% 1,245 2010 10,985,000 72,582 10,912,418 0.78% 1,180 2011 10,425,000 3,177 10,421,823 0.74% 1,127 2012 11,665,000 3,967 11,661,033 0.85% 1,246 2013 11,160,000 3,217 11,156,783 0.79% 1,164 2014 10,645,000 4,738 10,640,262 0.76% 1,089
Note: Details regarding the city's outstanding debt can be found in the Notes to the Financial Statements.
1 See the Schedule of Assessed Value and Estimated Actual Value of Taxable Property for property value data.2 Population data can be found in the Schedule of Demographic and Economic Statistics.
RATIOS OF GENERAL BONDED DEBT OUTSTANDINGLast Ten Fiscal Years
-
2,000,000
4,000,000
6,000,000
8,000,000
10,000,000
12,000,000
14,000,000
2005 2006 2007 2008 2009 2010 2011 2012 2013 2014
Total General Bonded Debt
2014 COMPREHENSIVE ANNUAL FINANCIAL REPORT 119
CITY OF POULSBO STATISTICAL SECTION

Governmental UnitDebt
OutstandingEstimated % Applicable1
Estimated Share of Overlapping Debt
Kitsap County 96,198,914$ 4.72% 4,541,953$ North Kitsap School District #400 29,505,794 21.86% 6,451,061$ North Kitsap Fire District #18 2,176,145 40.46% 880,524$ Public Utility District No. 1 5,570,000 4.72% 262,983$ Subtotal, Overlapping Debt 12,136,521
City of Poulsbo Direct Debt 10,645,000 100% 10,645,000
Total Direct and Overlapping Debt 22,781,521$
Note: Overlapping governments are those that coincide, at least in part, with the geographic boundaries of the city. This schedule estimates the portion of the outstanding debt of those overlapping governments that is borne by the residents and businesses of the City of Poulsbo. This process recognizes that, when considering the government's ability to issue and repay long-term debt, the entire debt burden borne by the residents and businesses should be taken into account. However, this does not imply that every taxpayer is a resident, and therefore responsible for repaying the debt of each overlapping government.
1 The percentage of overlapping debt applicable is estimated using taxable assessed property vales. Applicable percentages were estimated by determining the portion of the unit's taxable assessed value that is within the city's boundaries and dividing it by the units total taxable assessed value.
DIRECT AND OVERLAPPING GOVERNMENTAL ACTIVITIES DEBTAs of December 31, 2014
Sources: Assessed value data used to estimate applicable percentages provided by the Kitsap County Assessor's Office. Debt outstanding data provided by the Kitsap County Treasurer's Office.
Kitsap County North Kitsap School District #400
North Kitsap Fire District #18
Public Utility District No. 1
City of Poulsbo Direct Debt
Direct and Overlapping Debt Kitsap County
North Kitsap School District #400 North Kitsap Fire District #18 Public Utility District No. 1 City of Poulsbo Direct Debt
120 2014 COMPREHENSIVE ANNUAL FINANCIAL REPORT
CITY OF POULSBO STATISTICAL SECTION
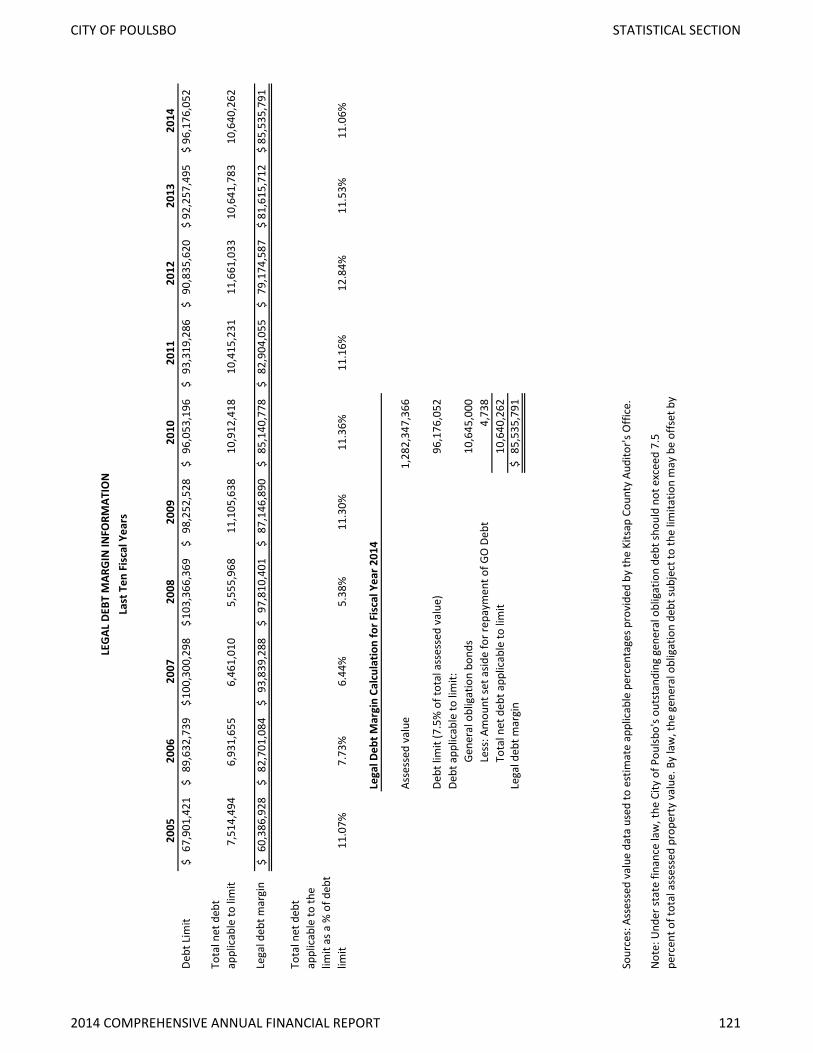
2005
2006
2007
2008
2009
2010
2011
2012
2013
2014
Debt
Lim
it67
,901
,421
$
89,6
32,7
39$
10
0,30
0,29
8$
103,
366,
369
$ 98
,252
,528
$
96,0
53,1
96$
93
,319
,286
$
90,8
35,6
20$
92
,257
,495
$
96,1
76,0
52$
Tota
l net
deb
t ap
plic
able
to li
mit
7,51
4,49
4
6,93
1,65
5
6,46
1,01
0
5,55
5,96
8
11,1
05,6
38
10
,912
,418
10,4
15,2
31
11
,661
,033
10,6
41,7
83
10
,640
,262
Lega
l deb
t mar
gin
60,3
86,9
28$
82
,701
,084
$
93,8
39,2
88$
97
,810
,401
$
87,1
46,8
90$
85
,140
,778
$
82,9
04,0
55$
79
,174
,587
$
81,6
15,7
12$
85
,535
,791
$
Tota
l net
deb
t ap
plic
able
to th
e lim
it as
a %
of d
ebt
limit
11.0
7%7.
73%
6.44
%5.
38%
11.3
0%11
.36%
11.1
6%12
.84%
11.5
3%11
.06%
Lega
l Deb
t Mar
gin
Calc
ulat
ion
for F
isca
l Yea
r 201
4
Asse
ssed
val
ue
Debt
lim
it (7
.5%
of t
otal
ass
esse
d va
lue)
96,1
76,0
52
De
bt a
pplic
able
to li
mit:
Ge
nera
l obl
igat
ion
bond
s10
,645
,000
Less
: Am
ount
set a
side
for r
epay
men
t of G
O D
ebt
4,73
8
To
tal n
et d
ebt a
pplic
able
to li
mit
10,6
40,2
62
Le
gal d
ebt m
argi
n85
,535
,791
$
Not
e: U
nder
stat
e fin
ance
law
, the
City
of P
oulsb
o's o
utst
andi
ng g
ener
al o
blig
atio
n de
bt sh
ould
not
exc
eed
7.5
perc
ent o
f tot
al a
sses
sed
prop
erty
val
ue. B
y la
w, t
he g
ener
al o
blig
atio
n de
bt su
bjec
t to
the
limita
tion
may
be
offs
et b
y
1,28
2,34
7,36
6
Sour
ces:
Ass
esse
d va
lue
data
use
d to
est
imat
e ap
plic
able
per
cent
ages
pro
vide
d by
the
Kits
ap C
ount
y Au
dito
r's O
ffice
.
LEG
AL D
EBT
MAR
GIN
INFO
RMAT
ION
Last
Ten
Fis
cal Y
ears
2014 COMPREHENSIVE ANNUAL FINANCIAL REPORT 121
CITY OF POULSBO STATISTICAL SECTION
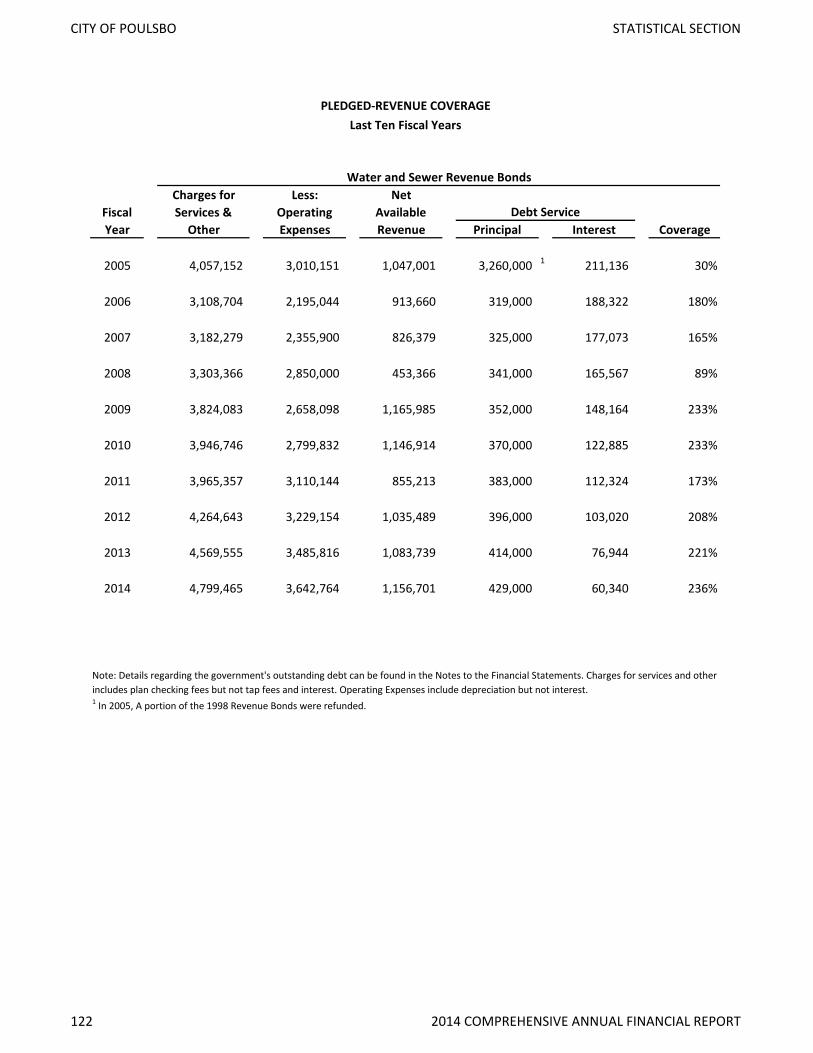
Charges for Less: NetFiscal Services & Operating AvailableYear Other Expenses Revenue Principal Interest Coverage
2005 4,057,152 3,010,151 1,047,001 3,260,000 1 211,136 30%
2006 3,108,704 2,195,044 913,660 319,000 188,322 180%
2007 3,182,279 2,355,900 826,379 325,000 177,073 165%
2008 3,303,366 2,850,000 453,366 341,000 165,567 89%
2009 3,824,083 2,658,098 1,165,985 352,000 148,164 233%
2010 3,946,746 2,799,832 1,146,914 370,000 122,885 233%
2011 3,965,357 3,110,144 855,213 383,000 112,324 173%
2012 4,264,643 3,229,154 1,035,489 396,000 103,020 208%
2013 4,569,555 3,485,816 1,083,739 414,000 76,944 221%
2014 4,799,465 3,642,764 1,156,701 429,000 60,340 236%
1 In 2005, A portion of the 1998 Revenue Bonds were refunded.
Water and Sewer Revenue Bonds
Debt Service
Note: Details regarding the government's outstanding debt can be found in the Notes to the Financial Statements. Charges for services and other includes plan checking fees but not tap fees and interest. Operating Expenses include depreciation but not interest.
PLEDGED-REVENUE COVERAGELast Ten Fiscal Years
122 2014 COMPREHENSIVE ANNUAL FINANCIAL REPORT
CITY OF POULSBO STATISTICAL SECTION

FISCAL COUNTY KC PERSONAL PERSONAL PER CAPITA UNEMPLOYMENT SCHOOL
YEAR POPULATION POPULATION INCOME* 1 INCOME 1 INCOME* RATE** ENROLLMENT ² ***
2005 7,450 240,400 8,706,269 269,807 37,769 5.1% 3,367
2006 7,490 243,400 9,398,583 289,217 39,777 4.8% 3,524
2007 7,560 244,800 9,888,582 305,383 42,163 4.4% 3,330
2008 7,840 246,800 10,312,169 327,583 43,851 5.4% 3,013
2009 8,855 247,600 10,454,459 373,886 43,404 7.6% 3,060
2010 8,920 251,133 10,355,171 367,806 41,135 7.3% 3,124
2011 9,245 253,900 10,842,161 394,784 42,580 7.9% 2,992
2012 9,360 254,500 11,359,138 417,766 44,547 7.4% 2,901
2013 9,585 254,000 11,563,863 436,376 45,533 7.1% 2,892
2014 9,775 255,900 0 0 0 6.2% 3,088
1 Thousands of Dollars and information only available through 20132 2005-2014 are totals for only schools in city limits
* Source: US Bureau of Economic Analysis-Kitsap County based on population of City only available through 2013** Source: Washington State Department of Employment Security-Kitsap County*** Source: North Kitsap School District & Office of Superintendent of Public Instruction WA State
DEMOGRAPHIC AND ECONOMIC STATISTICSLast Ten Fiscal Years
2014 COMPREHENSIVE ANNUAL FINANCIAL REPORT 123
CITY OF POULSBO STATISTICAL SECTION

Taxp
ayer
Type
of B
usin
ess
Nor
th K
itsap
Sch
ool D
istric
tPu
blic
Edu
catio
n84
41
10.7
9%95
61
13.0
7%M
arth
a &
Mar
y Lu
ther
an S
ervi
ces
Soci
al S
ervi
ces
373
24.
77%
397
35.
43%
Wal
mar
tRe
tail
Trad
e35
03
4.48
%Ce
ntra
l Mar
ket
Reta
il Tr
ade
241
43.
08%
362
44.
95%
Rayt
heon
Sys
tem
sGo
vern
men
t Con
trac
ting
167
52.
14%
0.00
%Ho
me
Depo
tRe
tail
Trad
e12
06
1.53
%Sa
few
ayRe
tail
Trad
e11
47
1.46
%Li
bert
y Sh
ores
/ Ha
rbor
Hou
seHe
alth
care
105
81.
34%
959
1.30
%Ga
tew
ay F
ello
wsh
ipEd
ucat
ion/
Relig
ious
103
91.
32%
76Ci
ty o
f Pou
lsbo
Mun
icip
al G
over
nmen
t83
101.
06%
8410
1.15
%Po
wde
r Hill
Gro
up 2
Tech
nica
l Ser
vice
s10
87
1.48
%Ge
nera
l Con
stru
ctio
n2Co
nstr
uctio
n40
02
5.47
%Se
attle
Sys
tem
s219
95
2.72
%eA
ccel
erat
ion
Tech
nica
l Ser
vice
s19
06
2.60
%El
ectr
onic
Dat
asys
tem
s2Go
vern
men
t Con
trac
ting
100
81.
37%
Subt
otal
of T
en L
arge
st E
mpl
oyer
s25
0031
.97%
2967
40.5
7%
All O
ther
Em
ploy
ers
5320
68.0
3%43
4659
.43%
Tota
l Pou
lsbo
Em
ploy
men
t 378
2010
0.00
%73
1310
0.00
%
1 F
ull a
nd p
art-
time
empl
oyee
s are
trac
ked.
2
Offi
ce c
lose
d or
mov
ed o
ut o
f City
3 Tot
al Po
ulsb
o Em
ploy
men
t num
bers
from
ESD
as o
f Q1
2014
& Q
1 20
04
Sour
ce:
WA
St E
mpl
oym
ent S
ecur
ity D
epar
tmen
t, Ci
ty o
f Pou
lsbo
Fina
nce
Depa
rtm
ent
Curr
ent Y
ear a
nd T
en Y
ears
Ago
PR
INCI
PAL
EMPL
OYE
RS 2014
2004
TOTA
L EM
PLO
YEES
1Ra
nk%
of T
otal
City
Em
ploy
men
tTO
TAL
EMPL
OYE
ES 1
Rank
% o
f Tot
al C
ity
Empl
oym
ent
124 2014 COMPREHENSIVE ANNUAL FINANCIAL REPORT
CITY OF POULSBO STATISTICAL SECTION
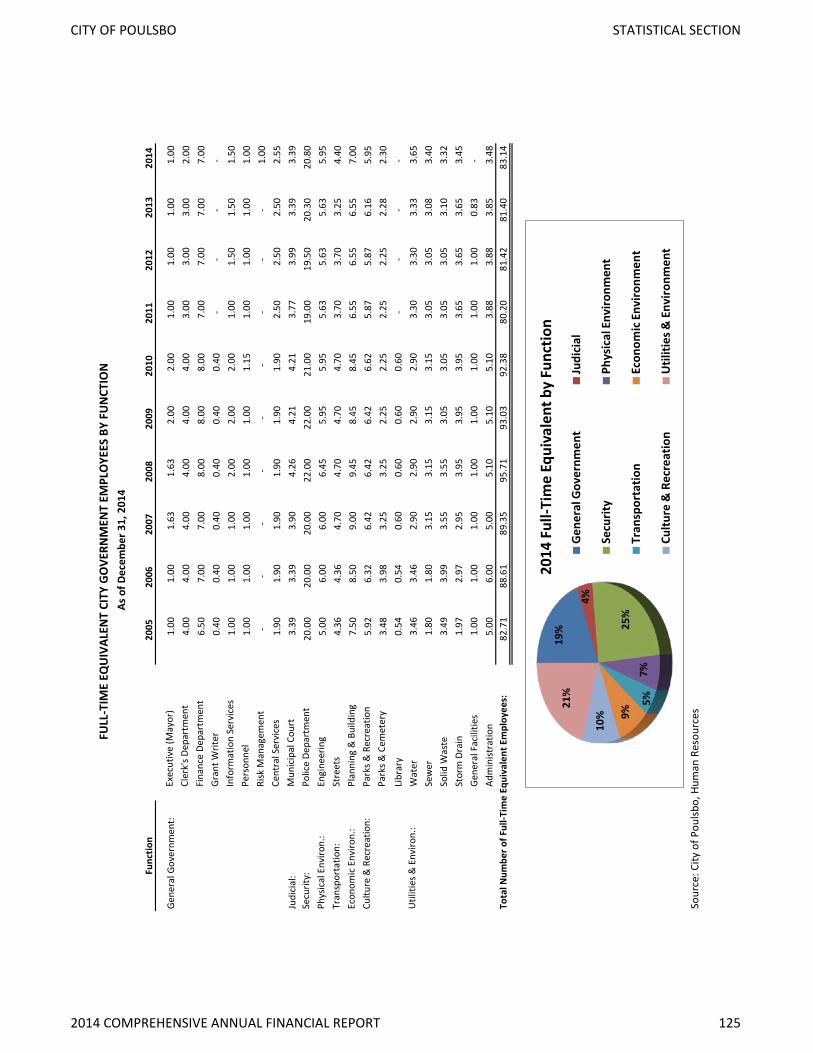
Func
tion
2005
2006
2007
2008
2009
2010
2011
2012
2013
2014
Gene
ral G
over
nmen
t:
Exe
cutiv
e (M
ayor
)1.
00
1.
00
1.
63
1.
63
2.
00
2.
00
1.
00
1.
00
1.
00
1.00
C
lerk
's De
part
men
t4.
00
4.
00
4.
00
4.
00
4.
00
4.
00
3.
00
3.
00
3.
00
2.00
F
inan
ce D
epar
tmen
t6.
50
7.
00
7.
00
8.
00
8.
00
8.
00
7.
00
7.
00
7.
00
7.00
G
rant
Writ
er0.
40
0.
40
0.
40
0.
40
0.
40
0.
40
-
-
-
-
Inf
orm
atio
n Se
rvic
es1.
00
1.
00
1.
00
2.
00
2.
00
2.
00
1.
00
1.
50
1.
50
1.50
P
erso
nnel
1.00
1.00
1.00
1.00
1.00
1.15
1.00
1.00
1.00
1.
00
Risk
Man
agem
ent
-
-
-
-
-
-
-
-
-
1.
00
Cen
tral
Ser
vice
s1.
90
1.
90
1.
90
1.
90
1.
90
1.
90
2.
50
2.
50
2.
50
2.55
Judi
cial
:
Mun
icip
al C
ourt
3.39
3.39
3.90
4.26
4.21
4.21
3.77
3.99
3.39
3.
39Se
curit
y:
Pol
ice
Depa
rtm
ent
20.0
0
20.0
0
20.0
0
22.0
0
22.0
0
21.0
0
19.0
0
19.5
0
20.3
0
20.8
0Ph
ysic
al E
nviro
n.:
E
ngin
eerin
g5.
00
6.
00
6.
00
6.
45
5.
95
5.
95
5.
63
5.
63
5.
63
5.95
Tran
spor
tatio
n:
Str
eets
4.36
4.36
4.70
4.70
4.70
4.70
3.70
3.70
3.25
4.
40Ec
onom
ic E
nviro
n.:
P
lann
ing
& B
uild
ing
7.50
8.50
9.00
9.45
8.45
8.45
6.55
6.55
6.55
7.
00Cu
lture
& R
ecre
atio
n:
Par
ks &
Rec
reat
ion
5.92
6.32
6.42
6.42
6.42
6.62
5.87
5.87
6.16
5.
95
Par
ks &
Cem
eter
y3.
48
3.
98
3.
25
3.
25
2.
25
2.
25
2.
25
2.
25
2.
28
2.30
L
ibra
ry0.
54
0.
54
0.
60
0.
60
0.
60
0.
60
-
-
-
-
U
tiliti
es &
Env
iron.
:
Wat
er3.
46
3.
46
2.
90
2.
90
2.
90
2.
90
3.
30
3.
30
3.
33
3.65
S
ewer
1.80
1.80
3.15
3.15
3.15
3.15
3.05
3.05
3.08
3.
40
Sol
id W
aste
3.49
3.99
3.55
3.55
3.05
3.05
3.05
3.05
3.10
3.
32
Sto
rm D
rain
1.97
2.97
2.95
3.95
3.95
3.95
3.65
3.65
3.65
3.
45
Gen
eral
Fac
ilitie
s1.
00
1.
00
1.
00
1.
00
1.
00
1.
00
1.
00
1.
00
0.
83
-
Adm
inist
ratio
n5.
00
6.
00
5.
00
5.
10
5.
10
5.
10
3.
88
3.
88
3.
85
3.48
Tota
l Num
ber o
f Ful
l-Tim
e Eq
uiva
lent
Em
ploy
ees:
82.7
1
88.6
1
89.3
5
95.7
1
93.0
3
92.3
8
80.2
0
81.4
2
81.4
0
83.1
4
Sour
ce: C
ity o
f Pou
lsbo,
Hum
an R
esou
rces
FULL
-TIM
E EQ
UIV
ALEN
T CI
TY G
OVE
RNM
ENT
EMPL
OYE
ES B
Y FU
NCT
ION
As o
f Dec
embe
r 31,
201
4
19%
4%
25%
7%
5%
9%
10%
21%
2014
Ful
l-Tim
e Eq
uiva
lent
by
Func
tion
Gen
eral
Gov
ernm
ent
Judi
cial
Secu
rity
Phys
ical
Env
ironm
ent
Tran
spor
tatio
n Ec
onom
ic E
nviro
nmen
t
Cultu
re &
Rec
reat
ion
Util
ities
& E
nviro
nmen
t
2014 COMPREHENSIVE ANNUAL FINANCIAL REPORT 125
CITY OF POULSBO STATISTICAL SECTION

2005
2006
2007
2008
2009
2010
2011
2012
2013
2014
Gov
ernm
enta
l Fun
ctio
ns
Gen
eral
Gov
ernm
ent O
ther
Num
ber o
f Uni
ons R
epre
sent
ed2
2
2
2
2
2
2
2
2
2
Num
ber o
f City
Cou
ncil
mee
tings
38
42
40
44
43
39
42
39
37
39
Num
ber o
f pub
lic re
cord
s req
uest
s pro
cess
ed57
44
73
79
87
88
75
83
11
9
165
Num
ber o
f pag
es o
f Ord
inan
ces c
odifi
ed*
**
**
**
*38
2
145
Num
ber o
f pas
spor
ts p
roce
ssed
806
1,
119
1,02
4
1,
018
1,01
5
61
7
805
78
3
723
81
4N
umbe
r of B
usin
ess L
icen
ses I
ssue
d91
4
1,37
5
1,
575
1,35
1
1,
563
1,40
4
1,
463
1,63
9
1,
629
1,72
9Pu
blic
Saf
ety
Num
ber o
f cas
e re
port
s file
d1,
586
1,99
8
2,
090
1,78
3
1
,698
1,74
6
1,
552
1,59
51,
391
1,35
4N
umbe
r of c
itatio
ns is
sued
2,16
2
2,
167
2,32
5
98
5
1,2
231,
250
1,15
5
1,
031
1,41
5
1,
503
Num
ber o
f cal
ls fo
r ser
vice
11
,229
13
,374
12
,942
12
,234
1
2,84
213
,744
13
,591
12
,139
11,6
53
12,4
73N
umbe
r of r
espo
nses
to m
otor
veh
icle
acc
iden
ts21
1
175
27
1
235
3
0234
7
205
18
218
1
370
Num
ber o
f driv
ing
impa
ired
cita
tions
issu
ed58
110
72
71
1
0384
77
50
28
23
Num
ber o
f vac
atio
n ho
use
chec
ks90
9
1,03
4
1,
049
847
8
471,
114
677
39
859
0
150
Num
ber o
f par
king
cita
tions
issu
ed17
7
231
63
230
1
1456
8
802
63
632
7
374
Tran
spor
tatio
nM
iles o
f str
eets
mai
ntai
ned
37
39
45
45
45
47
48
48
48
48
Mile
s of s
idew
alks
mai
ntai
ned
42
44
47
48
49
50
50
50
50
50
Num
ber o
f hou
rs sp
ent s
tree
t sw
eepi
ng49
0
546
55
0
468
46
8
323
22
5
312
31
2
312
Num
ber o
f str
eet s
igns
mai
ntai
ned
1,80
5
1,
875
2,17
4
2,
174
2,20
4
2,
204
2,21
5
2,
255
2,28
0
2,
290
Cultu
re a
nd R
ecre
atio
nN
umbe
r of p
arks
mai
ntai
ned
16
16
16
17
17
17
17
17
17
17
Tota
l acr
eage
of p
arks
/ope
n sp
ace
mai
ntai
ned
61
64
64
65
67
67
67
67
67
67
Econ
omic
Env
ironm
ent
Num
ber o
f new
sing
le fa
mily
bui
ldin
g pe
rmits
issu
ed
75
93
197
95
58
20
35
96
109
75
Num
ber o
f new
com
mer
cial
bui
ldin
g pe
rmits
issu
ed40
10
6
2
2
7
4
3
2
2
Num
ber o
f exi
stin
g sin
gle
fam
ily b
uild
ing
perm
its is
sued
**76
69
59
47
57
52
50
61
69
Num
ber o
f exi
stin
g co
mm
erci
al b
uild
ing
perm
its is
sued
**97
8
81
66
119
77
47
60
56
71
Num
ber o
f all
othe
r bui
ldin
g pe
rmits
**14
2
116
74
61
74
64
53
49
73
OPE
RATI
NG
INDI
CATO
RS B
Y FU
NCT
ION
Las
t Ten
Fis
cal Y
ears
126 2014 COMPREHENSIVE ANNUAL FINANCIAL REPORT
CITY OF POULSBO STATISTICAL SECTION
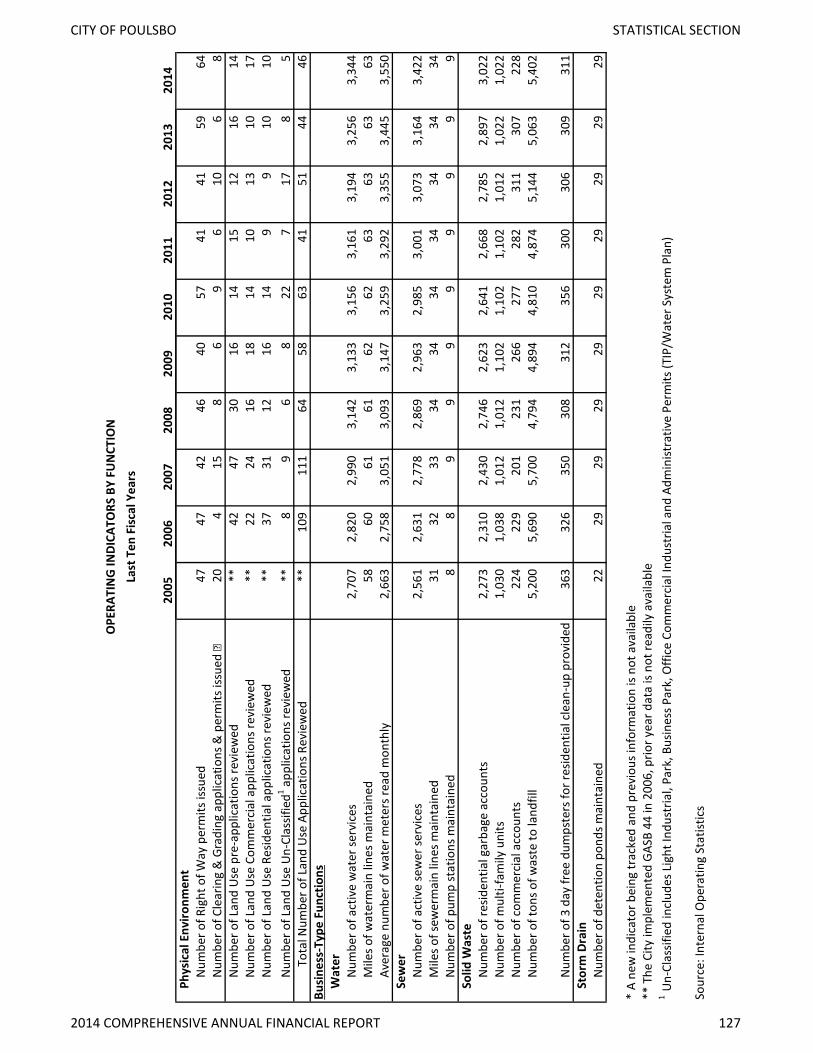
2005
2006
2007
2008
2009
2010
2011
2012
2013
2014
OPE
RATI
NG
INDI
CATO
RS B
Y FU
NCT
ION
Las
t Ten
Fis
cal Y
ears
Phys
ical
Env
ironm
ent
Num
ber o
f Rig
ht o
f Way
per
mits
issu
ed47
47
42
46
40
57
41
41
59
64N
umbe
r of C
lear
ing
& G
radi
ng a
pplic
atio
ns &
per
mits
issu
ed
20
4
15
8
6
9
6
10
6
8N
umbe
r of L
and
Use
pre
-app
licat
ions
revi
ewed
**42
47
30
16
14
15
12
16
14
Num
ber o
f Lan
d U
se C
omm
erci
al a
pplic
atio
ns re
view
ed
**22
24
16
18
14
10
13
10
17
Num
ber o
f Lan
d U
se R
esid
entia
l app
licat
ions
revi
ewed
**
37
31
12
16
14
9
9
10
10N
umbe
r of L
and
Use
Un-
Clas
sifie
d1 app
licat
ions
revi
ewed
**8
9
6
8
22
7
17
8
5
Tota
l Num
ber o
f Lan
d U
se A
pplic
atio
ns R
evie
wed
**10
9
111
64
58
63
41
51
44
46
Busi
ness
-Typ
e Fu
nctio
nsW
ater
Num
ber o
f act
ive
wat
er se
rvic
es2,
707
2,82
0
2,
990
3,14
2
3,
133
3,15
6
3,
161
3,19
4
3,
256
3,34
4M
iles o
f wat
erm
ain
lines
mai
ntai
ned
58
60
61
61
62
62
63
63
63
63
Aver
age
num
ber o
f wat
er m
eter
s rea
d m
onth
ly2,
663
2,75
8
3,
051
3,09
3
3,
147
3,25
9
3,
292
3,35
5
3,
445
3,55
0Se
wer
Num
ber o
f act
ive
sew
er se
rvic
es2,
561
2,63
1
2,
778
2,86
9
2,
963
2,98
5
3,
001
3,07
3
3,
164
3,42
2M
iles o
f sew
erm
ain
lines
mai
ntai
ned
31
32
33
34
34
34
34
34
34
34
Num
ber o
f pum
p st
atio
ns m
aint
aine
d8
8
9
9
9
9
9
9
9
9
Solid
Was
teN
umbe
r of r
esid
entia
l gar
bage
acc
ount
s2,
273
2,31
0
2,
430
2,74
6
2,
623
2,64
1
2,
668
2,78
5
2,
897
3,02
2N
umbe
r of m
ulti-
fam
ily u
nits
1,03
0
1,
038
1,01
2
1,
012
1,10
2
1,
102
1,10
2
1,
012
1,02
2
1,
022
Num
ber o
f com
mer
cial
acc
ount
s22
4
229
20
1
231
26
6
277
28
2
311
30
7
228
Num
ber o
f ton
s of w
aste
to la
ndfil
l5,
200
5,69
0
5,
700
4,79
4
4,
894
4,81
0
4,
874
5,14
4
5,
063
5,40
2
Num
ber o
f 3 d
ay fr
ee d
umps
ters
for r
esid
entia
l cle
an-u
p pr
ovid
ed
363
32
6
350
30
8
312
35
6
300
30
6
309
31
1St
orm
Dra
inN
umbe
r of d
eten
tion
pond
s mai
ntai
ned
22
29
29
29
29
29
29
29
29
29
* A
new
indi
cato
r bei
ng tr
acke
d an
d pr
evio
us in
form
atio
n is
not a
vaila
ble
** T
he C
ity im
plem
ente
d GA
SB 4
4 in
200
6, p
rior y
ear d
ata
is no
t rea
dily
ava
ilabl
e1
Un-
Clas
sifie
d in
clud
es L
ight
Indu
stria
l, Pa
rk, B
usin
ess P
ark,
Offi
ce C
omm
erci
al In
dust
rial a
nd A
dmin
istra
tive
Perm
its (T
IP/W
ater
Sys
tem
Pla
n)
Sour
ce: I
nter
nal O
pera
ting
Stat
istic
s
2014 COMPREHENSIVE ANNUAL FINANCIAL REPORT 127
CITY OF POULSBO STATISTICAL SECTION

2005
2006
2007
2008
2009
2010
2011
2012
2013
2014
Gov
ernm
enta
l Fun
ctio
ns
Gen
eral
Gov
ernm
ent
Num
ber o
f City
Veh
icle
s (no
t list
ed b
elow
)*
15
5
6
6
7
13
13
13
12
Gene
rato
rs*
1
1
1
1
1
1
1
1
1
Pu
blic
Saf
ety
Num
ber o
f pol
ice
vehi
cles
*24
23
22
22
20
20
20
21
21
N
umbe
r of p
olic
e bo
ats
1
1
1
1
1
1
1
1
1
1
Tr
ansp
orta
tion
Num
ber o
f Veh
icle
s (no
t spe
cifie
d be
low
)6
11
6
7
7
7
7
6
N
umbe
r of S
tree
t Sw
eepe
rs1
1
1
1
1
1
1
1
2
2
Num
ber o
f Dum
p Tr
ucks
8
8
4
4
4
4
4
4
4
4
Co
nstr
uctio
n Eq
uipm
ent
7
7
8
8
8
8
8
8
9
M
iles o
f str
eets
37
39
39
45
47
48
48
48
48
48
Num
ber o
f Tra
ffic
Sign
als
8
8
9
8
8
8
8
8
8
9
N
umbe
r of b
ridge
s1
1
1
1
1
1
1
1
1
1
Cultu
re a
nd R
ecre
atio
nN
umbe
r of v
ehic
les
1
1
1
1
1
1
1
1
1
1
N
eigh
borh
ood
park
s3
3
3
8
10
10
10
10
10
11
Com
mun
ity p
arks
13
13
13
8
5
5
5
5
5
5
Mai
nten
ance
Equ
ipm
ent
5
5
5
5
5
5
5
5
6
6
In
door
recr
eatio
nal f
acili
ties
1
1
1
1
1
1
1
1
1
1
Ec
onom
ic E
nviro
nmen
tN
umbe
r of B
uild
ing
vehi
cles
1
1
1
1
1
1
1
1
1
1
Ph
ysic
al E
nviro
nmen
t
Num
ber o
f Eng
inee
ring
vehi
cles
3
4
4
4
4
4
1
1
1
1
CAPI
TAL
ASSE
TS S
TATI
STIC
S BY
FU
CTIO
NLa
st T
en F
isca
l Yea
rs
128 2014 COMPREHENSIVE ANNUAL FINANCIAL REPORT
CITY OF POULSBO STATISTICAL SECTION
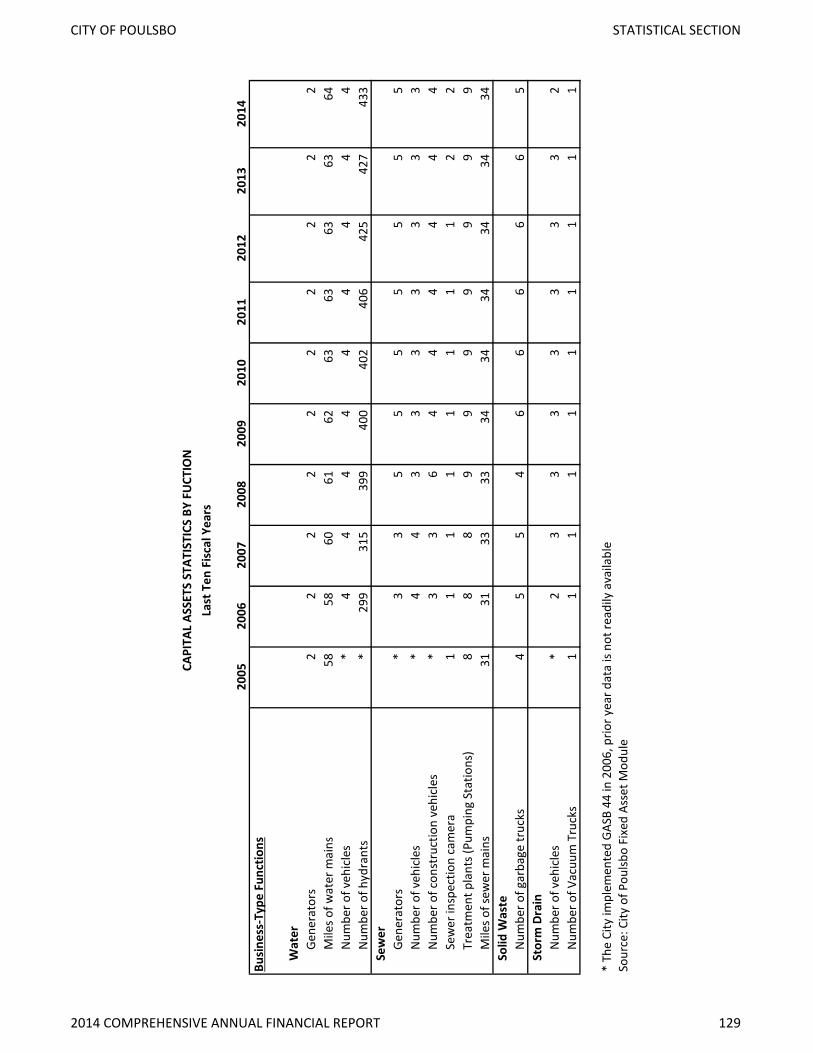
CAPI
TAL
ASSE
TS S
TATI
STIC
S BY
FU
CTIO
NLa
st T
en F
isca
l Yea
rs
2005
2006
2007
2008
2009
2010
2011
2012
2013
2014
Busi
ness
-Typ
e Fu
nctio
ns
Wat
erGe
nera
tors
2
2
2
2
2
2
2
2
2
2
M
iles o
f wat
er m
ains
58
58
60
61
62
63
63
63
63
64
N
umbe
r of v
ehic
les
*4
4
4
4
4
4
4
4
4
Num
ber o
f hyd
rant
s*
299
315
399
400
402
406
425
427
433
Sew
erGe
nera
tors
*3
3
5
5
5
5
5
5
5
Num
ber o
f veh
icle
s*
4
4
3
3
3
3
3
3
3
N
umbe
r of c
onst
ruct
ion
vehi
cles
*3
3
6
4
4
4
4
4
4
Sew
er in
spec
tion
cam
era
1
1
1
1
1
1
1
1
2
2
Tr
eatm
ent p
lant
s (Pu
mpi
ng S
tatio
ns)
8
8
8
9
9
9
9
9
9
9
M
iles o
f sew
er m
ains
31
31
33
33
34
34
34
34
34
34
So
lid W
aste
Num
ber o
f gar
bage
truc
ks4
5
5
4
6
6
6
6
6
5
Stor
m D
rain
Num
ber o
f veh
icle
s*
2
3
3
3
3
3
3
3
2
N
umbe
r of V
acuu
m T
ruck
s1
1
1
1
1
1
1
1
1
1
* Th
e Ci
ty im
plem
ente
d GA
SB 4
4 in
200
6, p
rior y
ear d
ata
is no
t rea
dily
ava
ilabl
eSo
urce
: City
of P
oulsb
o Fi
xed
Asse
t Mod
ule
2014 COMPREHENSIVE ANNUAL FINANCIAL REPORT 129
CITY OF POULSBO STATISTICAL SECTION
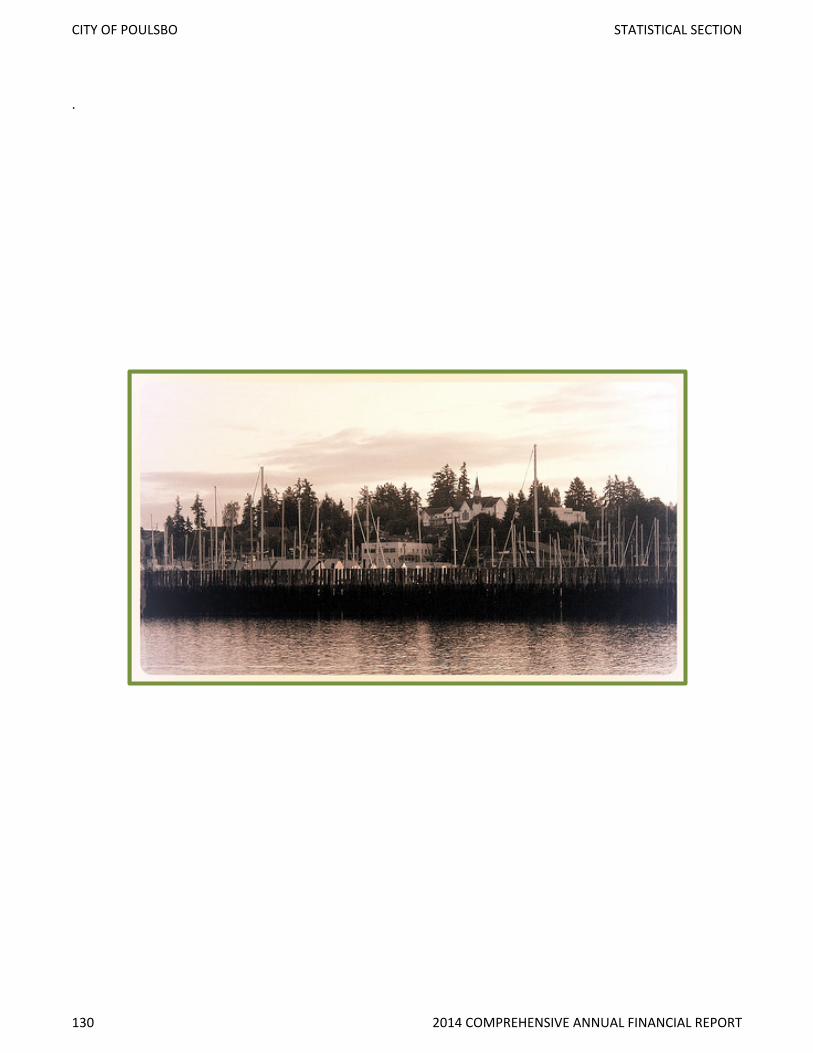
.
130 2014 COMPREHENSIVE ANNUAL FINANCIAL REPORT
CITY OF POULSBO STATISTICAL SECTION
Top Related