


Languages
Pages
Legal


Complementary Courses in Statistics, St. Teresa’s College (Autonomous),Ernakulam
1 Curriculum and Syllabus, 2014 Admissions
Scheme of Complementary Courses In Statistics
The following table shows the structure of the courses which indicates title of the courses,
instructional hours and credits.
1. Statistics for B.Sc. Mathematics and Physics
2. Statistics for B.A. Sociology
Semester
Title of the paper
Course Code Number
of hours
per week
Total
Credits
Total
hours/
semester
End Semester
Assessment
duration (hrs)
III
Basic Statistics STA3BS
6
4
108
3
IV Statistical Tools STA4ST
6
4
108
3
Semester
Title of the paper
Course Code
Number
of hours
per week
Total
Credits
Total
hours/
semester
End
Semester
Assessment
duration
(hrs)
I Basic Statistics
STA1BS
4 3 72 3
II Theory of Random
Variables
STA2TRV
4 3 72 3
III Probability
Distributions
STA3PD 5 4 90 3
IV
Statistical Inference
STA4SI
5
4
90
3

Complementary Courses in Statistics, St. Teresa’s College (Autonomous),Ernakulam
2 Curriculum and Syllabus, 2014 Admissions
Examinations:
The evaluation of each course shall contain two parts such as or Sessional Assessment and Final
Assessment. The ratio between internal and external examinations shall be 1:4(20%: 80%)
Assessment Pattern:
Item Percentage
Sessional
Assessment 20
Final
Assessment 80
In-Semester Assessment (IA):
Sessional Assessment is to be done by continuous assessments on the following
components. The Components of the Sessional Assessment for theory papers are as below.
Theory:
Component Marks
Attendance 5
Assignment/Seminar 5
Average of two test papers 10
Attendance:
% of Attendance Marks
>90% 5
Between 85 and 90 4
Between 80 and 85 3
Between 75 and 80 2
75 % 1
< 75 0

Complementary Courses in Statistics, St. Teresa’s College (Autonomous),Ernakulam
3 Curriculum and Syllabus, 2014 Admissions
Assignments:
There will be one assignment per course in each of the first four Semesters.
Sessional Assessment :
The evaluation of all components is to be published and is to be acknowledged by the candidate.
The responsibility of evaluating the internal assessment is vested on the teacher(s) who teach the
course.
Final Assessment :
The Final examination of all courses shall be conducted by the College on the close of each
semester. For reappearance/ improvement, students can appear along with the next batch.
Pattern of Question Paper :
A question paper shall be a judicious mix of short answer type, short essay type/ problem
solving type and long essay type questions.
For each course the Final Assessment is of 3 hours duration. The question paper has 4 parts.
Part A is compulsory which contains 10 objective type questions each of 1 mark .Part B contains 12
short answer questions of which 8 are to be answered and each has 2 marks. Part C has 9 short
essay questions of which 6 are to be answered and each has 4 marks. Part D has 4 long essay
questions of which 2 are to be answered and each has 15 marks.
Part No. of Questions No. of questions to be
answered Marks
A
(Objective type) 10 10 10x1 = 10
B
(Short Answer) 12 8 8x2 = 16
C
(Short Essay) 9 6 6x4 = 24
D
(Long Essay) 4 2 2x15 = 30
Note: A separate minimum of 30% marks each for sessional and final and aggregate minimum of
40% are required for a pass for a course.
Syllabus of Courses:
The detailed syllabus of the complementary courses is appended.

Complementary Courses in Statistics, St. Teresa’s College (Autonomous),Ernakulam
4 Curriculum and Syllabus, 2014 Admissions
Complementary Course to Mathematics, Physics
I Semester – Complementary – Statistics - Course I
STA1BS - Basic Statistics Hours per week – 4
Module I
Introduction to Statistics, Population and Sample, Collection of Data, Various methods of data
collection, Census and Sampling Methods of Sampling – Simple Random Sampling (with and
without replacement) – stratified sampling – systematic sampling (Method only), Types of data –
quantitative, qualitative, Classification and Tabulation, Diagrammatic representation – Bar diagram,
pie diagram; pictogram and cartogram, Graphical representation – histogram; frequency polygon;
frequency curve; ogives and stem and leaf chart.
Module II
Measures of Central Tendency – Mean; Median; Mode; Geometric Mean; Harmonic Mean and Properties,
Absolute and Relative measures of Dispersion – Range, Quartile Deviation, Percentiles, Deciles, Box Plot,
Mean Deviation, Standard Deviation, Coefficient of Variation.
Module III
Idea of Permutations and Combinations, Probability Concepts – Random Experiment, Sample
Space, Events, Probability Measure, Approaches to Probability – Classical, Statistical and
Axiomatic, Addition Theorem (upto 3 evens) Conditional Probability, Independence of events,
Multiplication theorem (upto 3 events), Total Probability Law, Baye’s Theorem and its
applications.
Module IV
Index Numbers – definition, Simple Index Numbers; Weighted Index Numbers – Laspeyer’s Paasche’s and
Fisher’s Index Numbers, Test of Index Numbers, Construction of Index Numbers, Cost of Living Index
Numbers – Family Budget Method, Aggregate Expenditure Method.
Core Reference
1. S.P. Gupta: Statistical Methods (Sultan Chand & Sons Delhi).
2. S.C. Gupta and V.K. Kapoor: Fundamentals of Mathematical Statistics, Sultan Chand and Sons.
3. B.L. Agarwal: Basic Statistics, New Age International (p) Ltd.
Additional References
1. Parimal Mukhopadhya: Mathematical Statistics, New Central Book Agency (p) Ltd, Calcutta
2. Murthy M.N.: Sampling theory and Methods, Statistical Publishing Society, Calcutta.

Complementary Courses in Statistics, St. Teresa’s College (Autonomous),Ernakulam
5 Curriculum and Syllabus, 2014 Admissions
Blueprint
Title of the Course: BASIC STATISTICS
Course Code: STA1BS
Module 1Mark
10/10
2Marks
8/12
4 Marks
6/9
15 Marks
2/4
I 3 2 2 0
II 3 4 3 2
III 2 3 2 1
IV 2 3 2 1
MODEL QUESTION PAPER
B.Sc. DEGREE (C.B.C.S.S.) EXAMINATION
First Semester
Complementary Course (Statistics)
STA1BS - BASIC STATISTICS
(Common for MATHEMATICS, PHYSICS and COMPUTER APPLICATIONS)
Time: 3 hours Max.: 80 marks
Use of Scientific calculators and Statistical tables are permitted.
Part A (Short Answer Questions)
Answer all questions.
Each question carries 1 mark.
1. Distinguish between population and sample
2. What is Tabulation?
3. Name the statistical measures that can be found out using ogives
4. Define Geometric mean
5. Give the empirical relation between mean, median and mode
6. What is coefficient of variation?
7. Give classical definition of probability

Complementary Courses in Statistics, St. Teresa’s College (Autonomous),Ernakulam
6 Curriculum and Syllabus, 2014 Admissions
8. What is the Sample space when three coins are tossed?
9. What is Commodity reversal test?
10. Name the different methods of finding the Cost of living Index number
(10x1=10 marks)
Part B (Brief Answer Questions)
Answer any eight questions.
Each question carries 2 marks.
11. Distinguish between Primary and Secondary data
12. What are the bases of Classification?
13. Prove that the sum of deviations of a set of observations from their mean is zero.
14. Calculate Median and Mode of 8 6, 3,2,1,5,7
15. Find the Standard deviation of 2,3,5,7,8
16. Define any three measures of Central tendency
17. Show that A and B are Independent if and only if P(B/A) = P(B/Ac).
18. Distinguish between Pair-wise Independence and Mutual Independence in the case of three
events
19. What is the Probability of getting 53 Sundays in a leap year?
20. Why is Fisher’s Index number known as Fisher’s Ideal Index number?
21. Construct Cost of living Index number from the following data.
Group A B C D
Index 100 150 125 200
Weight 6 4 2 3
22. Give any four Limitations of an Index number.
(8x2 = 16 marks)
Part C (Short Essay Questions)
Answer any six questions.
Each question carries 4 marks.
23. Explain the Construction of a frequency distribution table
24. What are the desirable properties of a good measure of dispersion? Examine Standard
deviation in the light of your answer.
25. Find mean deviation of the following data.
X: 4 8 12 16 20 24
F: 2 7 15 11 9 6

Complementary Courses in Statistics, St. Teresa’s College (Autonomous),Ernakulam
7 Curriculum and Syllabus, 2014 Admissions
26. Represent the following data by a Box plot
74,75,75,76,79,82,83,85,87,90
27. Find Median and Mode for the following data
C.I: 0-10 10-20 20-30 30-40 40-50
F: 3 13 18 12 5
28. State and prove addition theorem for two events.
29. The Chance of two Athletes to win in a competition are 1 2 and 1 3 respectively. If they
participate in the same competition, what is the probability that at least one will win? What
is the probability that at least one will win if they participate in different competitions?
30. Explain the various steps involved in the construction of an Index number
31. From the following data using A.M and G.M method regarding price relatives find Index
numbers.
Commodity A B C D E
Base Year price 25 20 30 12 90
Current year price 30 22 33 15 99
(6x4 = 24 marks)
Part D (Essay Questions)
Answer any two questions.
Each question carries 15 marks.
32. (a) Distinguish between absolute and relative measures of dispersion
(b) Find co-efficient of Quartile deviation from the following data
C.I 0-10 10-20 20-30 30-40 40-50 50-60 60-70 70-80
F 8 7 15 18 22 14 10 6
33. An analysis of monthly wages paid to workers in two firms A and B, belonging to
the same industry gave the following results.
Firm A Firm B
No. of wage earners 550 650
Average monthly wages 50 45
Variance of wages 90 120
(a) Which firm pays out larger amount as monthly wages
(b) Which firm shows greater variability?
Complementary Courses in Statistics, St. Teresa’s College (Autonomous),Ernakulam
8 Curriculum and Syllabus, 2014 Admissions
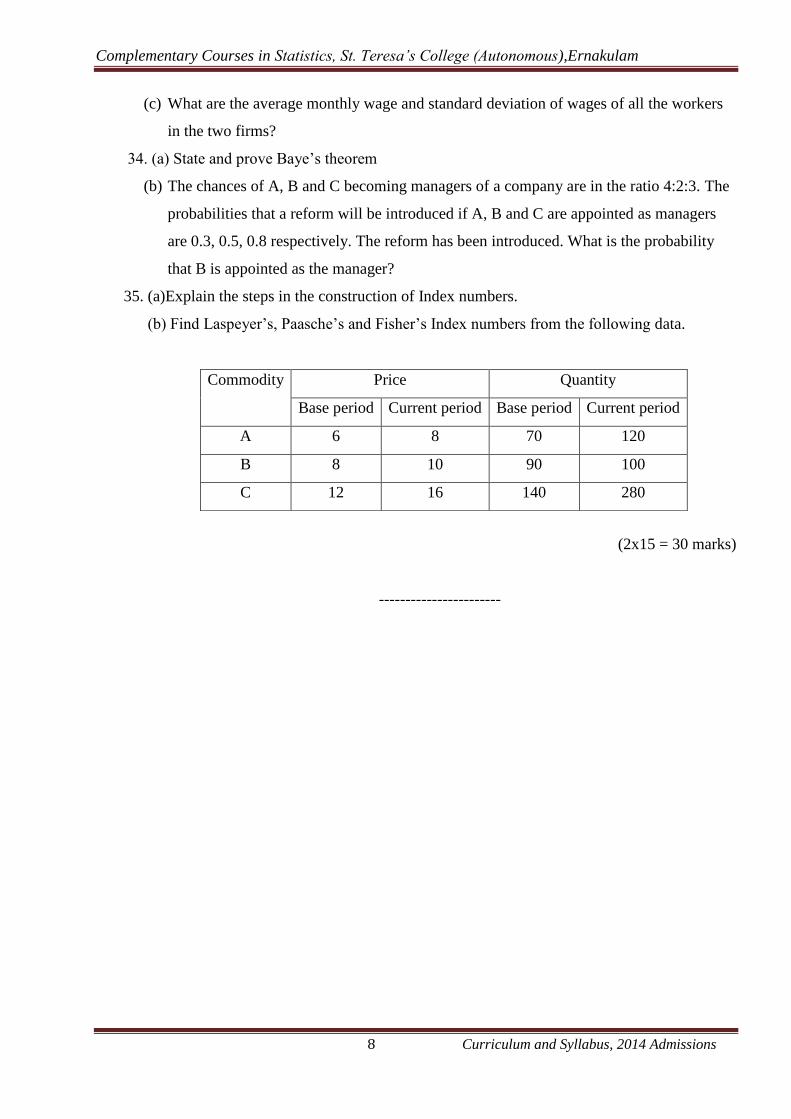
(c) What are the average monthly wage and standard deviation of wages of all the workers
in the two firms?
34. (a) State and prove Baye’s theorem
(b) The chances of A, B and C becoming managers of a company are in the ratio 4:2:3. The
probabilities that a reform will be introduced if A, B and C are appointed as managers
are 0.3, 0.5, 0.8 respectively. The reform has been introduced. What is the probability
that B is appointed as the manager?
35. (a)Explain the steps in the construction of Index numbers.
(b) Find Laspeyer’s, Paasche’s and Fisher’s Index numbers from the following data.
(2x15 = 30 marks)
-----------------------
Commodity Price Quantity
Base period Current period Base period Current period
A 6 8 70 120
B 8 10 90 100
C 12 16 140 280

Complementary Courses in Statistics, St. Teresa’s College (Autonomous),Ernakulam
9 Curriculum and Syllabus, 2014 Admissions
Complementary Course to Mathematics, Physics
II Semester – Complementary – Statistics - Course II
STA2TRV – Theory of Random Variables
Hours per week – 4
Module I Random Variables – Discrete and Continuous, Probability Distributions – Probability Mass Function;
Probability Density Function and Cumulative (distribution) function and their properties, change of
variables (Univariate only), Bivariate random variables – Definition – Discrete and Continuous, Joint
Probability Density Functions, Marginal and Conditional Distributions, Independence of Random Variables.
Module II Mathematical Expectations – Expectation of a Random Variable, Moments in terms of Expectations,
Moment Generating Functions (m.g.f.) and its properties. Characteristic Functions and its Simple Properties,
Conditional Expectation
Module III Raw Moments, Central Moments, Absolute Moments, Inter Relationships (First Four Moments), Skewness –
Measures – Pearson, Bowley and Moment Measure Kurtosis- Measures of Kurtosis – Moment Measure,
Measure based on partition values.
Module IV Introduction to bivariate data – Method of Least Squares – Curve Fitting – Fitting of Straight Lines, Second
Degree Equation, Exponential Curve, Power Curve, Linear Correlation – Methods of Correlation – Scatter
Diagram, Covariance Method, Rank Correlation (equal ranks). Linear Regression – Regression Equations –
Fitting and identification, properties.
Core Reference 1. John E. Freund: Mathematical Statistics, Prentice Hall of India
2. S.C. Gupta and V.K. Kapoor: Fundamentals of Mathematical Statistics, Sultan Chand and Sons
3. S.P. Gupta: Statistical Methods, , Sultan Chand and Sons, New Delhi
Additional References
1. V.K. Rohatgi: An Introduction to Probability Theory and Mathematical Statistics, Wiley Eastern.
2. Mood A.M., Graybill F.A. and Boes D.C. Introduction to Theory of Statistics, McGraw Hill.
3. B.R. Bhat, Modern Probability Theory, New Age International (p) Ltd.

Complementary Courses in Statistics, St. Teresa’s College (Autonomous),Ernakulam
10 Curriculum and Syllabus, 2014 Admissions
Blueprint
Title of the Course: THEORY OF RANDOM VARIABLES
Course Code: STA2TRV
Module 1Mark
10/10
2Marks
8/12
4 Marks
6/9
15 Marks
2/4
I 3 3 2 1
II 3 3 3
III 1 2 1 1
IV 3 4 3 2
MODEL QUESTION PAPER
B.Sc. DEGREE (C.B.C.S.S.) EXAMINATION
Second Semester
Complementary Course (Statistics)
STA2TRV – THEORY OF RANDOM VARIABLES
(Common for MATHEMATICS, PHYSICS and COMPUTER APPLICATIONS)
Time: 3 hours Max.: 80 marks
Use of Scientific calculators and Statistical tables are permitted.
Part A (Short Answer Questions)
Answer all questions.
Each question carries 1 mark.
1. A random variable is a function from the sample space of a random experiment into
_______.
2. The p.d.f. of a random variable X is f(x)=k, when 0<x<2, then what is the value of k?
3. Define distribution function of a random variable.
4. Define moment generating function of a random variable.
5. State the addition theorem on Expectation for two random variables X and Y.
6. If f(x) = 1
2, -1 < x < 1 is the p.d.f. of a random variable X, find 𝜑𝑋(t).
7. Give the formula for Pearson’s co-efficient of skewness.

Complementary Courses in Statistics, St. Teresa’s College (Autonomous),Ernakulam
11 Curriculum and Syllabus, 2014 Admissions
8. Give the relation between the correlation co-efficient and regression co-efficients in case of
a bi-variate distribution.
9. What is a Scatter diagram?
10. If the two regression lines of a bivariate data are perpendicular to each other, what should be
the value of the correlation co-efficient?
(10x1=10 marks)
Part B (Brief Answer Questions)
Answer any eight questions.
Each question carries 2 marks.
11. Can the function f(x)=3x3; 0<x<1, be a p.d.f. ? Why?
12. If F(x) = 0 ; x < 0
x ; 0 ≤ x ≤ 1
1 ; x > 1 is the distribution function of a random variable X, then find P[2X+3≤3.6]
13. If X is a random variable with distribution function F(x), then find the p.d.f. of Y=F(x).
14. For any two independent random variables X and Y, show that E (XY) = E(X) E(Y).
15. Define characteristic function of a random variable and state its important properties.
16. The joint p.d.f. of a bivariate random variable (X, Y) is f(x , y) = x + y; 0 < x < 1, 0 < y < 1,
obtain the marginal p.d.f. of Y.
17. What is Sheppard’s correction? Write down the Sheppard’s correction for the first four
moments.
18. The first three raw moments of a distribution are 1, 3 and 5 respectively. Find 1.
19. If one of the regression co-efficients is greater than 1, show that the other regression co-
efficient should be less than 1.
20. Write down the normal equations to fit a curve of the form y = abx to a given bivariate data.
21. The regression equations of a bivariate data are 3x + 11y – 7 = 0 and 8x + 3y + 16 = 0. Find
the values of x and y .
22. Find Karl Pearson’s co-efficient of correlation for the following data
x: 7 8 9 6 5
y: 8 6 7 9 10
(8x2 = 16 marks)

Complementary Courses in Statistics, St. Teresa’s College (Autonomous),Ernakulam
12 Curriculum and Syllabus, 2014 Admissions
Part C (Short Essay Questions)
Answer any six questions.
Each question carries 4 marks.
23. An unbiased die is tossed till an odd number appears. Obtain the probability distribution of
the number of tosses.
24. A random variable X has p.d.f. f(x) = Ax2 ; 0 ≤ x ≤ 10. Find A and P[2 < X < 5].
25. State and prove the Cauchy-Schwartz inequality.
26. If X and Y are any two random variables, show that E[E(X/Y)] = E(X).
27. If X and Y are two random variables and a & b are any two constants, find
V(aX – bY).
28. For a distribution mean =3, variance = 4, 1 = +1 and 2 = 2. Obtain the first four
moments about zero.
29. Derive the expression to find the acute angle between the regression lines.
30. Show that Karl Pearson’s co-efficient of correlation is independent of change of origin and
scale.
31. Derive the formula for finding rank correlation co-efficient.
(6x4 = 24 marks)
Part D (Essay Questions)
Answer any two questions.
Each question carries 15 marks.
32. Define conditional expectation and conditional variance. If f(x,y) = x + y; 0<x<1 0<y<1
find correlation between X and Y and conditional variance of Y given X.
33. Examine the nature of skewness and kurtosis for the data given below using 1 and 2
Variable Frequency
2.5-7.5 4
7.5-12.5 38
12.5-17.5 65
17.5-22.5 90
22.5-27.5 70
27.5-32.5 42
32.5-37.5 6

Complementary Courses in Statistics, St. Teresa’s College (Autonomous),Ernakulam
13 Curriculum and Syllabus, 2014 Admissions
34. (a) Find the Karl Pearson’s co-efficient of correlation from the following data
X: 115 109 112 87 98 120 98 100 98 118
Y: 75 73 85 70 76 82 65 73 68 80
(b) Find the Spearman’s rank correlation co-efficient for the above data.
35. Given the following observations on two variables x and y , find the most probable value of
x when y = 72 and also the most probable value of y when x = 61
x: 59 65 45 52 60 62 70 55 45 49
y: 75 70 55 65 60 69 80 65 59 61
(2x15 = 30 marks)

Complementary Courses in Statistics, St. Teresa’s College (Autonomous),Ernakulam
14 Curriculum and Syllabus, 2014 Admissions
Complementary Course to Mathematics, Physics
III Semester – Complementary – Statistics - Course III
STA3PD – Probability Distributions Hours per week : 5
Module I
Discrete Distributions : Uniform; Geometric; Bernoulli; Binomial; Poisson; Fitting of Distributions
(Binomial and Poisson). Properties : Mean, Variance, m.g.f., Additive property; recurrence relation
for moments (binomial and Poisson) Memory lessness property of Geometric distribution.
Module II
Continuous distributions : Uniform; Exponential; Gamma; Beta (type I and II); Normal; Standard
Normal - definitions, Mean, Variance, m.g.f., Additive property, Memorylessness property of
exponential distribution Fitting of Normal, Use of Standard Normal Tables for Computation of
Various Probabilities.
Module III
Law of large Numbers, Tchebycheff’s Inequality, Weak Law of Large Numbers, Bernoulli’s Law
of Large Numbers, Central Limit Theorem (Lindberg-Levy form) without proof.
Module IV
Sampling Distributions - definition, Statistic, Parameter, Standard Error, Sampling Distributions of
Mean and Variance, 2, t and F (without derivation), properties, Inter relationships.
Core Reference
1. S.C. Gupta and V.K. Kapoor: Fundamentals of Mathematical Statistics, Sultan Chand and
Sons
2. Hogg, R.V. and Craig A.T. (1970). Introduction to Mathematical Statistics, Amerind
Publishing Co, Pvt. Ltd.
Additional References
1. V.K. Rohatgi: An Introduction to Probability Theory and Mathematical Statistics, Wiley
Eastern.
2. Mood A.M., Graybill F.A. and Boes D.C. Introduction to Theory of Statistics, McGraw
Hill.
3. Johnson, N.L, Kotz, S. and Balakrishnan N. (1994). Continuous Univariate Distribution,
John Wiley, New York.
4. Johnson, N.L, Kotz, S. and Kemp, A.W. : Univariate Discrete Distributions, John Wiley,
New York.

Complementary Courses in Statistics, St. Teresa’s College (Autonomous),Ernakulam
15 Curriculum and Syllabus, 2014 Admissions
Blueprint
Title of the Course: PROBABILITY DISTRIBUTIONS
Course Code: STA3PD
Module 1Mark
10/10
2Marks
8/12
4 Marks
6/9
15 Marks
2/4
I 4 4 2 1
II 3 4 3 1
III 1 2 2 1
IV 2 2 2 1
MODEL QUESTION PAPER
B.Sc. DEGREE (C.B.C.S.S.) EXAMINATION
Third Semester
Complementary Course (Statistics)
STA3PD – PROBABILITY DISTRIBUTIONS
(Common for MATHEMATICS, PHYSICS and COMPUTER APPLICATIONS)
Time: 3 hours Max.: 80 marks
Use of Scientific calculators and Statistical tables are permitted.
Part A (Short Answer Questions)
Answer all questions.
Each question carries 1 mark.
1. Which is the distribution for which mean = variance?
2. Give the moment generating function of Bernoulli distribution with parameter p.
3. If for a binomial distribution, p = ½, Then what will be the skewness of the distribution?
4. If X follows Uniform distribution over [0,1], then state the distribution of Y = - 2 log X.
5. State the Tchebychev’s inequality.
6. If X ~ N(0,1), then what is the distribution of X2 ?
7. What is the distribution of the ratio of two 2 variates?
8. Name the continous distribution that satisfies lack of memory property.
9. If X follows Geometric distribution with p = ½, then what is the value of E(X) ?

Complementary Courses in Statistics, St. Teresa’s College (Autonomous),Ernakulam
16 Curriculum and Syllabus, 2014 Admissions
10. Define Beta distribution of the first type.
(10 x1 =10)
Part B (Brief Answer Questions)
Answer any eight questions.
Each question carries 2 marks.
11. State the relation between exponential and gamma distributions.
12. Define Statistic and Parameter with an example each.
13. If X ~ B(n, p), find cov [ n
x ,
n
xn ]
14. Find the m.g.f. of Uniform distribution over (a, b).
15. Compute the mode of B(7, ¼).
16. Find the characteristic function of the geometric distribution.
17. If X ~ N(30, 5), find P[26 < X < 40].
18. If 2% of the items made by a factory are defective, find the probability that there are 3
defective items in a sample of 100 items.
19. Two unbiased dice are tossed. If X is the sum of the numbers obtained, show that
P[|X – 7|≥ 3] ≤ 54
35.
20. Find mode of N(µ, σ).
21. What are the assumptions in Lindberg-Levy form of Central Limit Theorem?
22. Define F statistic and give an example.
(8 x 2 = 16)
Part C (Short Essay Questions)
Answer any six questions.
Each question carries 4 marks.
23. State and prove Weak Law of Large Numbers.
24. Obtain the points of inflexion of N(µ, σ).
25. Find the moment generating function of n
2 and hence prove its additive property.
26. Derive the recurrence relation for raw moments of B(n, p).
27. Find the mean and variance of Beta distribution of the first type.
28. Obtain Poisson distribution as a limiting form of Binomial distribution.
29. Obtain the moment generating function of U(a,b) and hence find its mean and variance.
Complementary Courses in Statistics, St. Teresa’s College (Autonomous),Ernakulam
17 Curriculum and Syllabus, 2014 Admissions
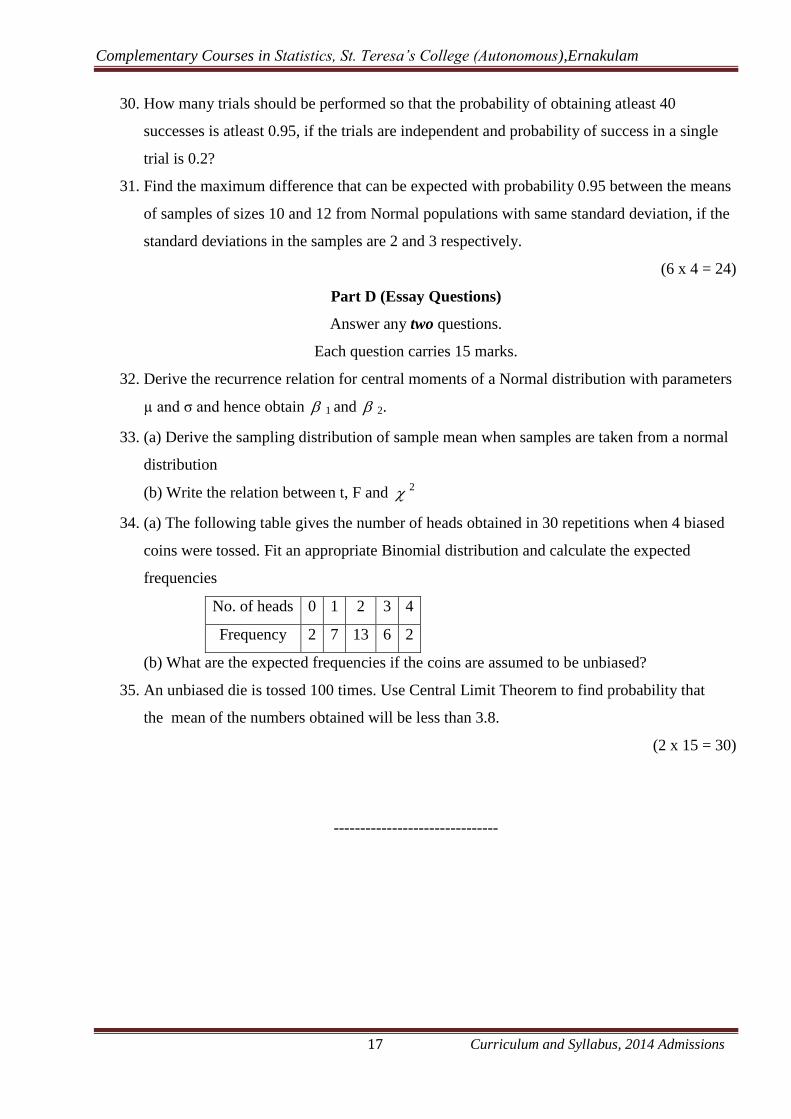
30. How many trials should be performed so that the probability of obtaining atleast 40
successes is atleast 0.95, if the trials are independent and probability of success in a single
trial is 0.2?
31. Find the maximum difference that can be expected with probability 0.95 between the means
of samples of sizes 10 and 12 from Normal populations with same standard deviation, if the
standard deviations in the samples are 2 and 3 respectively.
(6 x 4 = 24)
Part D (Essay Questions)
Answer any two questions.
Each question carries 15 marks.
32. Derive the recurrence relation for central moments of a Normal distribution with parameters
µ and σ and hence obtain 1 and 2.
33. (a) Derive the sampling distribution of sample mean when samples are taken from a normal
distribution
(b) Write the relation between t, F and 2
34. (a) The following table gives the number of heads obtained in 30 repetitions when 4 biased
coins were tossed. Fit an appropriate Binomial distribution and calculate the expected
frequencies
No. of heads 0 1 2 3 4
Frequency 2 7 13 6 2
(b) What are the expected frequencies if the coins are assumed to be unbiased?
35. An unbiased die is tossed 100 times. Use Central Limit Theorem to find probability that
the mean of the numbers obtained will be less than 3.8.
(2 x 15 = 30)
-------------------------------

Complementary Courses in Statistics, St. Teresa’s College (Autonomous),Ernakulam
18 Curriculum and Syllabus, 2014 Admissions
Complementary Course to Mathematics, Physics
IV Semester – Complementary – Statistics - Course IV
STA4SI – Statistical Inference
Hours per week : 5
Module I
Concepts of Estimation, Types of Estimation Point Estimation; Interval Estimation, Properties of
Estimation Unbiasedness, Efficiency; Consistency; Sufficiency.
Module II
Methods of Estimation MLE, Methods of Moments, Method of Minimum Variance, Cramer Rao
Inequality (without proof), Interval Estimation for Mean, Variance and Proportion.
Module III
Testing of hypothesis- Statistical hypothesis, Simple and composite hypothesis Null and Alternate
hypothesis, Type I and Type II errors, Critical Region, Size of the test, P value, Power, Neyman
Pearson approach , Large Sample test Z test, Chi-Square test-goodness of fit, test of independence.
Module IV
Small sample tests Normal, t test, Chi-square test, F test, analysis of Variance (one way
classification).
Core Reference 1. S.C. Gupta and V.K. Kapoor: Fundamentals of Mathematical Statistics, Sultan Chand and
Sons
2. Richard Johnson (2006): Probability and Statistics for Engineers (Miller and Freund). Prentice
Hall.
Additional References
1. S.C Gupta : Fundamentals of Mathematical Statistics, Sultan Chand and Sons.
2. V.K. Rohatgi: An Introduction to Probability Theory and Mathematical Statistics, Wiley
Eastern.
3. Mood A.M., Graybill F.A. and Boes D.C. Introduction to Theory of Statistics, McGraw
Hill.

Complementary Courses in Statistics, St. Teresa’s College (Autonomous),Ernakulam
19 Curriculum and Syllabus, 2014 Admissions
Blueprint
Title of the Course: STATISTICAL INFERENCE
Course Code: STA4SI
Module 1Mark
10/10
2Marks
8/12
4 Marks
6/9
15 Marks
2/4
I 4 3 1 1
II 2 3 3
III 3 4 2 2
IV 1 2 3 1
MODEL QUESTION PAPER
B.Sc. DEGREE (C.B.C.S.S.) EXAMINATION
Fourth Semester
Complementary Course (Statistics)
STA4SI – STATISTICAL INFERENCE
(Common for MATHEMATICS, PHYSICS and COMPUTER APPLICATIONS)
Time: 3 hours Max.: 80 marks
Use of Scientific calculators and Statistical tables are permitted.
Part A (Short Answer Questions)
Answer all questions.
Each question carries 1 mark.
1. Differentiate between point estimation and internal estimation.
2. Define a sufficient statistic.
3. Give an example of an estimator which is consistent but not unbiased.
4. An unbiased estimator whose variance tends to zero is said to be ...........
5. What is the method of moments?
6. What is meant by confidence coefficient?
7. Define the size of the test.
8. Explain the two types of errors?
9. Define the power of a test.

Complementary Courses in Statistics, St. Teresa’s College (Autonomous),Ernakulam
20 Curriculum and Syllabus, 2014 Admissions
10. What is the test statistic used for testing the equality of variance of two normal populations for
small samples?
(10 x1 =10 marks)
Part B (Brief Answer Questions)
Answer any eight questions.
Each question carries 2 marks.
11. Define unbiasedness of an estimator. If T is an unbiased estimator of θ, is T2 an unbiased
estimation of θ2 ?
12. What is Neyman’s condition for sufficiency of an estimate?
13. Distinguish between parameter and statistic.
14. Write any four properties of maximum likelihood estimates.
15. Obtain the m.l.e. of θ in f(x, θ) = 1
𝜃 where 0 < x < θ.
16. Obtain the interval estimate of mean of a normal distribution when the standard deviation is
known.
17. State Neyman- Pearson lemma.
18. What is meant by degree of freedom?
19. How will you test the equality of proportions of two normal populations using large samples?
20. Define simple hypothesis and alternative hypothesis.
21. Write the test statistic for testing the equality of means of two normal populations in the case of
unknown standard deviations using small samples.
22. Write the mathematical model for one way classifications.
(8 x 2 = 16 marks)
Part C (Short Essay Questions)
Answer any six questions.
Each question carries 4 marks.
23. Let X1, X2 .....Xn be a random sample from N(μ, σ2)where σ2 is known show that
Y= (X1+ X2)/2 is an unbaised estimator of μ. Find the efficiency of Y.
24. Find the Cramer- Rao lower bound for the variance of any unbiased estimator of λ where λ is
parameter of a Poisson population.
25. Let P be the proportion of tea drinkers in Kerala. If a random sample of 1234 Keralites yielded
789 tea drinkers find 95% 0f confidence internal of P.
26. Show by an example that m.l.e. need not be unbiased.

Complementary Courses in Statistics, St. Teresa’s College (Autonomous),Ernakulam
21 Curriculum and Syllabus, 2014 Admissions
27. Obtain the best region of size α for testing H0 : µ = µ0 against the alternative H1 : µ = µ1 in a
normal population N(µ,1).
28. Explain the chi -square test of goodness of fit.
29. A sample from a population is 7,4,6,11,20,8,10,6,13,11 and 9. Can it regarded as from a
normal population with S.D 3.
30. Explain a paired t- test.
31. Explain the procedure to carry out ANOVA.
(6 x 4 = 24 marks)
Part D (Essay Questions)
Answer any two questions.
Each question carries 15 marks.
32. (a) Show that 𝑥 is a sufficient estimate for µ if σ2 is known where 𝑥 is the mean of a
sample taken from N(µ,σ)
(b) A sample of 100 voters were assigned to vote in a gallop poll. 55% of them voted in favour
of candidate. Find 95% and 99% confidence intervals for proportion of voters who are in
favour of the candidate.
33. Fit a binomial population for the following data and test for goodness of fit.
x 0 1 2 3 4 5 6
f 105 80 43 30 26 9 7
34. Examine whether the following two samples are from populations with same variance
Sample A : 11, 26, 18, 31, 23, 15, 9, 0, 13, 19.
Sample B : 67, 53, 61, 88, 73, 56, 49.
35. (a) Derive the expression of 𝜒2 -test of independence in a 2×2 contingency table.
( b) Examine whether there is an influence of sex in the consumption of coffee.
Male female
Like coffee 42 33
Don’t like coffee 18 17
(2 x 15 = 30 marks)
-------------------
Complementary Courses in Statistics, St. Teresa’s College (Autonomous),Ernakulam
22 Curriculum and Syllabus, 2014 Admissions
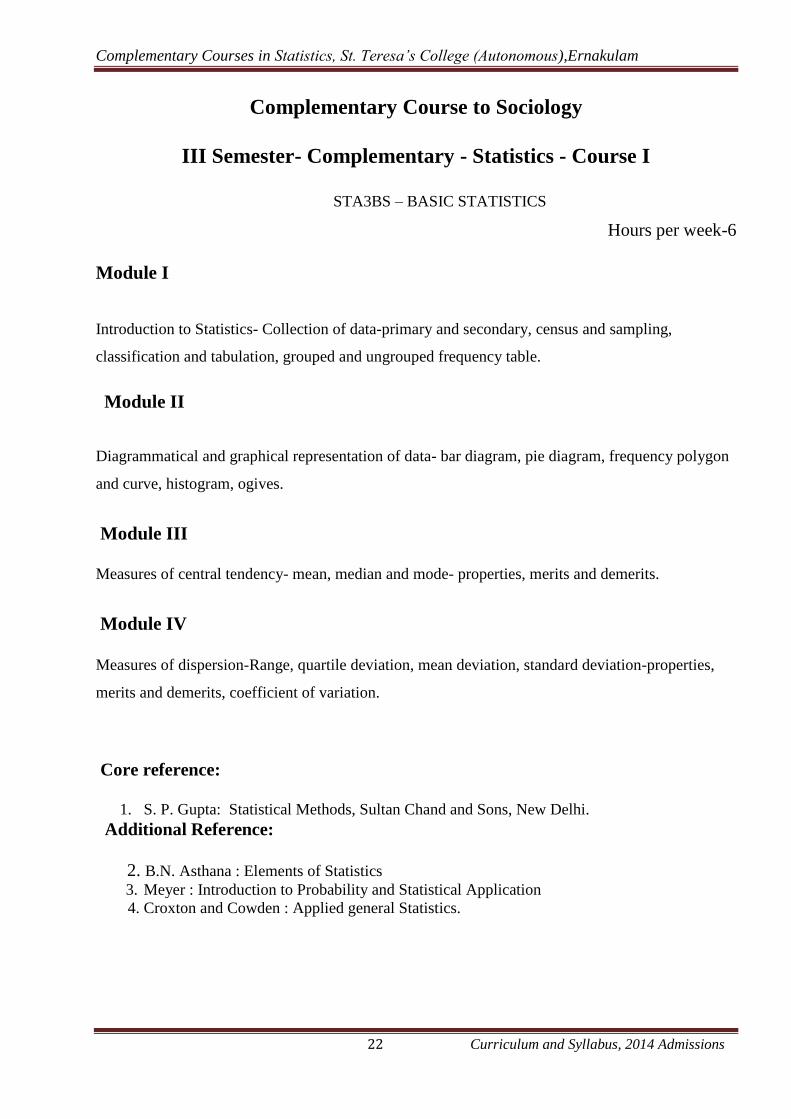
Complementary Course to Sociology
III Semester- Complementary - Statistics - Course I
STA3BS – BASIC STATISTICS
Hours per week-6
Module I
Introduction to Statistics- Collection of data-primary and secondary, census and sampling,
classification and tabulation, grouped and ungrouped frequency table.
Module II
Diagrammatical and graphical representation of data- bar diagram, pie diagram, frequency polygon
and curve, histogram, ogives.
Module III
Measures of central tendency- mean, median and mode- properties, merits and demerits.
Module IV
Measures of dispersion-Range, quartile deviation, mean deviation, standard deviation-properties,
merits and demerits, coefficient of variation.
Core reference:
1. S. P. Gupta: Statistical Methods, Sultan Chand and Sons, New Delhi.
Additional Reference:
2. B.N. Asthana : Elements of Statistics
3. Meyer : Introduction to Probability and Statistical Application
4. Croxton and Cowden : Applied general Statistics.
Complementary Courses in Statistics, St. Teresa’s College (Autonomous),Ernakulam
23 Curriculum and Syllabus, 2014 Admissions
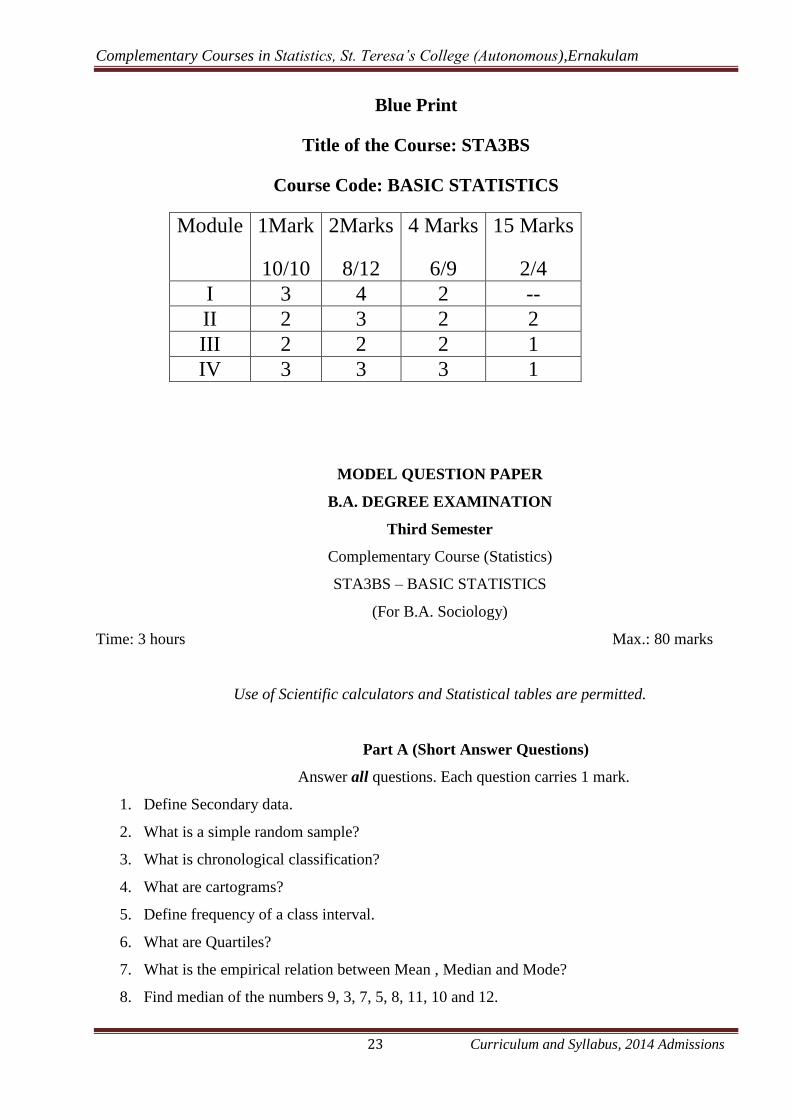
Blue Print
Title of the Course: STA3BS
Course Code: BASIC STATISTICS
Module 1Mark
10/10
2Marks
8/12
4 Marks
6/9
15 Marks
2/4
I 3 4 2 --
II 2 3 2 2
III 2 2 2 1
IV 3 3 3 1
MODEL QUESTION PAPER
B.A. DEGREE EXAMINATION
Third Semester
Complementary Course (Statistics)
STA3BS – BASIC STATISTICS
(For B.A. Sociology)
Time: 3 hours Max.: 80 marks
Use of Scientific calculators and Statistical tables are permitted.
Part A (Short Answer Questions)
Answer all questions. Each question carries 1 mark.
1. Define Secondary data.
2. What is a simple random sample?
3. What is chronological classification?
4. What are cartograms?
5. Define frequency of a class interval.
6. What are Quartiles?
7. What is the empirical relation between Mean , Median and Mode?
8. Find median of the numbers 9, 3, 7, 5, 8, 11, 10 and 12.

Complementary Courses in Statistics, St. Teresa’s College (Autonomous),Ernakulam
24 Curriculum and Syllabus, 2014 Admissions
9. The Standard Deviation of a set of observations is 2. If each observation is multiplied by 4,
what is the Standard deviation of the new set of observations?
10. If mean is 10 and standard deviation is 5, find the co-efficient of variation.
(10 x1 =10)
Part B (Brief Answer Questions)
Answer any eight questions. Each question carries 2 marks.
11. Explain the construction of a frequency polygon.
12. Give the characteristics of a good questionnaire.
13. Find the quartile deviation of the observations 21, 30, 27, 36, 12, 41, 15, 97, 84, 25, 32, and
62.
14. What is meant by a measure of dispersion?
15. Define discrete and continuous variables.
16. Name any three two-dimensional diagrams.
17. There are three groups of observations having 40, 50 and 60 items with means 20, 26 and15
respectively. Find the mean of the combined group.
18. Team A has mean score 7 and variance 25. Team B has mean score 6 and variance 9. Which
team shows more consistency?
19. Write the merits of arithmetic mean.
20. Distinguish between bar diagram and histogram.
21. What are the objectives of classification?
22. Distinguish between questionnaire and schedule.
(8 x 2 = 16)
Part C (Short Essay Questions)
Answer any six questions. Each question carries 4 marks.
23. Form an appropriate grouped frequency table for the following data
32, 47, 41, 51, 41, 30, 39, 18, 48, 53, 54, 32, 31, 36, 15, 37, 32, 56, 42, 48.
24. Draw a histogram for the following frequency distribution
Classes 10-14 15-19 20-29 30-49
Frequency 5 10 30 20
25. Distinguish between absolute and relative measures of dispersion.
26. Explain Pie diagram.

Complementary Courses in Statistics, St. Teresa’s College (Autonomous),Ernakulam
25 Curriculum and Syllabus, 2014 Admissions
27. Find mean, median and mode of the following observations.
14,11,11,10,12,13,10,14,11,11,10,12,12,13,13,11,14,12,12,12,13,12,12,13,12.
28. Find Mean deviation from median
Classes 0-10 10-20 20-30 30-40 40-50
Frequency 10 12 18 14 6
29. Explain the various methods of collecting Primary data.
30. The expenditure of 1000 families is as follows
Expenditure (Rs.) 40-60 60-80 80-100 100-120 120-140
No. Of families 50 - 500 - 50
The median of the distribution is Rs.87.50. Find the missing families.
31. Calculate the Quartile deviation of the following data.
Wages Rs. 12 14 17 21 27 30 36 Total
No. Of workers 4 6 8 7 12 10 4 51
(6 x 4 = 24)
Part D (Essay Questions)
Answer any two questions. Each question carries 15 marks.
32. Distinguish between sub-divided and percentage bar diagrams. Draw a percentage bar
diagram to represent the following data
Number of students of a college
Year Stream of study→
↓
Arts Science Commerce
1995-96 800 700 500
1996-97 820 710 520
1997-98 850 725 525
33. Explain the different measures of central tendency. Why is arithmetic mean considered to be
the best measure of central tendency?
34. Calculate the Mean Deviation from median of the following data.
Class 0-20 20-40 40-60 60-80 Total
Frequency 4 6 8 7 25

Complementary Courses in Statistics, St. Teresa’s College (Autonomous),Ernakulam
26 Curriculum and Syllabus, 2014 Admissions
35. The expenditure on food per family in two localities are as follows
Expenditure/ family /
week
150-300 300-450 450-600 600-750 750-900 900-1050
No. of
families
locality A 50 325 428 216 60 21
locality B 75 310 472 193 97 53
Compare the variations in expenditure in the two localities.
(2 x 15 = 30)
-----------------------

Complementary Courses in Statistics, St. Teresa’s College (Autonomous),Ernakulam
27 Curriculum and Syllabus, 2014 Admissions
Complementary Course to Sociology
IV Semester- Complementary – Statistics –Course II
STA4ST - Statistical Tools Hours per week-6
Module I
Random Experiment- sample space, event, -Algebra of events- classical and Statistical definition
of probability- simple problems-Addition theorem of two events-statement only-conditional
probability- Independence of events-elementary applications- random variables-probability density
function- Binomial and normal distributions.
Module II
Testing of hypothesis-Null and alternate hypothesis, significance level, power of the test, Z tests for means
and proportion (one sample and two sample).
Module III
Scatter diagram, principle of least squares, fitting of straight lines, Regression lines, correlation
between two variables- rank correlation.
Module IV
Index numbers- definition, uses, problems in construction of index numbers, weighted index
numbers- Laspeyer’s , Paasche ’s and Fisher’s index numbers, tests for good index numbers, Fixed
base and chain base index numbers -conversion.
Core reference:
1. S. P. Gupta: Statistical Methods, Sultan Chand and Sons, New Delhi.
Additional Reference:
1. S.C. Gupta and V.K. Kapoor : Fundamentals of Mathematical Statistics, Sultan Chand and Sons.
2. Fundamentals of Statistics: DN Elhance, Kitab Mahal , Allahabad.

Complementary Courses in Statistics, St. Teresa’s College (Autonomous),Ernakulam
28 Curriculum and Syllabus, 2014 Admissions
Blue Print
Title of the Course: STA4ST
Course Code: STATISTICAL TOOLS
Module 1Mark
10/10
2Marks
8/12
4 Marks
6/9
15 Marks
2/4
I 4 3 3 1
II 2 3 1 1
III 2 3 3 1
IV 2 3 2 1
MODEL QUESTION PAPER
B.A. DEGREE EXAMINATION
Fourth Semester
Complementary Course (Statistics)
STA4ST – STATISTICAL TOOLS
(For B.A. Sociology)
Time: 3 hours Max.: 80 marks
Use of Scientific calculators and Statistical tables are permitted.
Part A (Short Answer Questions)
Answer all questions. Each question carries 1 mark.
1. Define a random experiment. Give an example.
2. When are two events said to be mutually exclusive?
3. Find the probability of getting a sum of 5 when two dice are tossed.
4. The mean and variance of a Binomial distribution are 6 and 4 respectively. Find the
parameters of the distribution.
5. Define significance level of a test.
6. Define a Null hypothesis.
7. What is the range in which correlation co-efficient of a bivariate data can lie?
8. What is the point of intersection of the two regression lines of a bivariate data?

Complementary Courses in Statistics, St. Teresa’s College (Autonomous),Ernakulam
29 Curriculum and Syllabus, 2014 Admissions
9. Define Index numbers.
10. If Laspeyer’s Index number is 324 and Paasche’s Index number is 144, then find Fisher’s
Index number.
(10 x1 =10 marks)
Part B (Brief Answer Questions)
Answer any eight questions. Each question carries 2 marks.
11. Define Conditional probability.
12. A box contains 4 white, 2 blue and 3 red balls. A ball is drawn out at random. What is the
probability that it is a red or a white ball?
13. State the addition theorem on probability for two events.
14. Define a statistical hypothesis.
15. Distinguish between Type I and Type II errors.
16. Give the test statistic for testing equality of proportions of two Normal populations.
17. What is a Scatter diagram?
18. Mention the properties of regression co-efficients of a bivariate data.
19. If r = - 0.8 and bxy = - 0.79, what is the value of byx?
20. What is Factor reversal test for Index numbers?
21. Distinguish between simple and weighted Index numbers.
22. If Σp0q0 = 47, Σp0qk = 51, Σpkq0 = 67 and Σpkqk = 84, find Fisher’s Index number.
(8 x 2 = 16 marks)
Part C (Short Essay Questions)
Answer any six questions. Each question carries 4 marks.
23. The contents of two bags are as follows.
Bag 1 : 2 white and 3 black balls, Bag 2 : 3 white and 2 black balls. A ball is transferred
from bag 1 to bag 2 and then a ball is drawn from bag 2. Find the probability that it is a
white ball.
24. The mean and variance of a binomial random variable X are 2 and 1 respectively. Find
P[X ≤ 1].
25. If A and B are independent events, show that (a) A and Bc are independent,
(b) Ac and B
c are independent.
26. The mean weight of a sample of 100 students is 50 kgs with a standard deviation of 3 kgs.
Can it be claimed that the mean height of all the students is 52 kgs?
27. Distinguish between correlation and regression.

Complementary Courses in Statistics, St. Teresa’s College (Autonomous),Ernakulam
30 Curriculum and Syllabus, 2014 Admissions
28. Find correlation between X and Y
X 3 5 9 10 12
Y 11 19 35 39 47
29. Find the co-efficient of correlation r, if the regression lines of a bivariate data are
x + 2y – 5 = 0 and 2x + 3y – 8 = 0.
30. Examine whether Laspeyer’s Index number and Paasche’s Index number satisfies factor
reversal test.
31. From the Chain base Index numbers given below, construct Fixed base Index numbers.
Year 2004 2005 2006 2007 2008
Chain base IN 90 105 102 95 92
(6 x 4 = 24 marks)
Part D (Essay Questions)
Answer any two questions. Each question carries 15 marks.
32. A bag contains 5 white and 8 red balls. Two drawings of 3 balls each are made such that (a)
the balls are replaced before the second trial, (b) the balls are not replaced before the second
trial. Find the probability that the first drawing will give 3 white and the second 3 red balls
in each case.
33. Explain the procedure for testing equality of Proportions of two Normal populations.
34. Given the following data, estimate blood pressure when age is 45.
Age 56 42 72 36 63 47 55 49 38 42 68 60
Blood pressure 147 125 160 118 149 128 150 145 115 140 152 155

Complementary Courses in Statistics, St. Teresa’s College (Autonomous),Ernakulam
31 Curriculum and Syllabus, 2014 Admissions
35. Find Laspeyer’s, Paasche’s and Fisher’s Index numbers from the following data.
(2 x 15 = 30 marks)
Commodity Base period Current period
Price Quantity Price Quantity
A 42 8 60 7
B 16 12 20 10
C 30 8 40 6
D 100 3 120 2
E 81 5 110 4
Top Related