


Languages
Pages
Legal


Competition from hubs in the Gulf and Turkey
Overview of academic and applied research Dr Guillaume Burghouwt [email protected] Director Airneth Head of section aviation economics, SEO www.airneth.nl 17 October 2012

Outline
• The Gulf and Turkish hub models • Gulf carrier competition & pricing • Answers from incumbent carriers • Some further points for discussion

The vertically integrated strategy of “Dubai Inc.”
• Dubai has prepared master plan to prepare for the post-oil era to establish Dubai as leading tourism, IT and financial destination
• Emirates Airlines essential instrument to achieve this goal
• Emirates part of Emirates Group: state-owned, globally active travel and tourism conglomerate, providing all kinds of aviation related services
• Emirates Group itself is part of a larger bundle of aviation-related activities, under responsibility of Sjeikh Ahmed bin Saeed Al Maktoum, including: – Dubai World Central Consortium (building of Jebel Ali airport city) – Dubai’s Department of Civil Aviation: regulator, operator of DXB,Dubai Duty
Free and Dubai Cargo Village
The vertically integrated strategy of “Dubai Inc.” (cont.)
• Sjeikh acts as an entrepreneur • Royal family involved in all parts of economy and public
administration: Difficult to distinguish between private and public property, between political leadership and commercial management. Result: – signicant financial resources and the ability of the state to
allocate and control developments that would be impossible in market-led economies
– Allignment of all stakeholders on the same goal: to increase the wealth of the emirate, its population and its rulers
– Quick decision making

Comparing cost structure Emirates to BA Eurocents/ATK Emirates British Airways EK vs BA (%)
Fuel/ATK 8.12 11.40 -29 Young fleet, proximity to oil production+facilities
Labour/ATK 4.36 12.01 -64 Two-tier tax free salary system; cheap labour
Landing and Nav/ATK 1.45 2.93 -51 Joint airline-airport ownership; cross subsidation charges from duty-free
Handling/ATK 1.69 5.42 -69 Low labour costs; scale advantages in monopoly
Maintenance/ATK 0.50 2.50 -80 New generation aircraft
Depreciation/ATK 1.34 3.84 -65 New generation aircraft
Distribution and sales/ATK
2.80 1.99 +41 Travel commissions, sales in countries with low Internet penetration rate; aggressive branding
Operating leases/ATK 2.83 0.38 +645 80% aircraft financed through operating leases
Total cost/ATK 26.56 43.69 -39
Total revenu/ATK 28.78 48.55 -41
Source: O’Connell (2011). The rise of the Arabian carriers. JATM 17(6), 339-346

0
50
100
150
200
250
0%
10%
20%
30%
40%
50%
60%
70%
80%
90%
Num
ber o
f des
tinat
ions
Shar
e of
long
-hau
l des
tinat
ions
>2500km
<2500km
% long-haul
The network model of Gulf carriers: long-haul to long-haul. Turkish exception
Source: OAG, 3rd week 2012

Long-haul specialization partly driven by geography
Facebook network within a 2500km range

Focus on primary and secondary cities
• Gulf carriers do not only serve primary, but also secondary cities
Important feeder markets for European network carriers Newcomers from the Gulf do not have to compete against non-stop direct
travel options (=better quality) Entry easier for Gulf carriers than for European network carriers in relation
to slot times and charges Creates substantial competitive advantage in terms of travel time in certain
markets • E.g. HAM-DXB-SYD with Emirates instead of HAM-FRA-BKK-SYD with
Star
• Because Turkish can operate to Europe with a narrow-body fleet, it also feeders its hub from tertiary European cities

Turkish also serves many tertiary European cities. Its service tends to be relatively better to
lower ranked airports
0
10.000
20.000
30.000
40.000
50.000
60.000
LON
PA
R FR
A M
AD
BCN
M
UC
FCO
AM
S M
OS
PMI
MIL
O
SL
CPH
VIE
DUS
TXL
ARN
ZR
H DU
B M
AN
BRU
HA
M
AGP
HEL
LIS
NCE
AT
H GV
A PR
G ST
R ED
I CG
N
VCE
ALC
BHX
LED
BUD
BGY
CTA
TLS
IBZ
AYT
WAW
LY
S LP
A M
RS
OTP
TL
V BG
O
VKO
FA
O
SXF
GLA
CRL
NAP
KB
P BL
Q
BRS
OPO
TF
S RI
X SV
G TR
D PS
A PM
O
HER
BIO
VL
C LP
L HA
J LC
A SK
G BO
D CI
A CA
G SV
Q
BFS
GOT
NCL
BS
L TF
N
TRN
AC
E EM
A BR
I
Num
ber o
f sea
ts p
er w
eek
airports ranked accordining to total scheduled seat capacity
Emirates Etihad Qatar Turkish
Top-10
Top-20
Top-30
Source: OAG

The network model: connecting at night
• Core of the wave-system is concentrated during night-time – Curfews and flight
restrictions at destination airports
– Meteorological conditions during daytime at the hub
Wave-system Emirates at Dubai
Europe to Asia/ Aus
Aus/Asia/ME to Europe/AFR/US
Source: O’Connell 2011
Asia/ME to Europe/ME/AFR

Remarkable similarity between the hubs. Turkish supplements night and early morning waves with intensive
hub system during the day
0%
20%
40%
60%
80%
100%
120%
0 1 2 3 4 5 6 7 8 9 10 11 12 13 14 15 16 17 18 19 20 21 22 23
Num
ber o
f dep
artu
res
per w
eek
rela
tive
to h
ighe
st
peak
-hou
r
Departure time window (UAE local time)
EY AUH QR DOH EK DXB TK IST

Hub connections offered by Turkish via Istanbul more diversified than
DXB, DOH and AUH
0%
10%
20%
30%
40%
50%
60%
70%
80%
90%
100%
DXB DOH AUH IST
Shar
e of
mar
ket i
n to
tal h
ub
conn
ectiv
ity other
AFR ZO-EUR
M-O ZO-Europa
M-O NW-EUR
M-O AZ/PAC
ZO-Europa AZ/PAC
NW-EUR AZ/PAC
Source: OAG; SEO Netscan

Building a Gulf route
• Typical build-up pattern of an Emirates destination (Lohmann et al. 2009): 1. Always enter a new destination with a daily flight 2. When demand increases, scale up aircraft capacity 3. Later, increase frequency, as this is important to attract
high-yield business passenger 4. Ultimate mid-term goal is double daily on almost every
destination

0 1 2 3 4 5 6 7 8 9 10 11 12 13 14 15 16
0
50
100
150
200
250
300
350
400
Aver
age
freq
uenc
y pe
r wee
k
Aver
age
seat
capa
city
/flig
ht
average frequency/week average seat capacity
Route build-up Emirates at Hamburg Scale up to B777
Introduction double daily
building seat capacity again
Daily operation with A340
Source: OAG

Route build-up pattern Emirates at Amsterdam
0
1
2
3
4
5
6
7
8
0
100
200
300
400
500
600
2008
01
2008
03
2008
05
2008
07
2008
09
2008
11
2009
01
2009
03
2009
05
2009
07
2009
09
2009
11
2010
01
2010
03
2010
05
2010
07
2010
09
2010
11
2011
01
2011
03
2011
05
2011
07
2011
09
2011
11
2012
01
2012
03
2012
05
2012
07
2012
09
Aver
age
freq
uenc
y pe
r wee
k
Aver
age
seat
cap
acity
/flig
ht
average frequency/week average seat capacity
Entry with daily flight B777-200LR, mixed with B777-300ER
Scale up to full B777-300ER operation
Scale up to A380
Source: OAG

Strengths and weaknesses Emirates and Dubai
Strengths • Geographical location of the hub • A380 allows for growth at slot
constrained airports • No legacy costs • Low unit costs • High labour productivity • High service-level • Strong brand (marketing) • Open Skies policy by UAE
government • Favourable political environment
(“Dubai Inc.”) – Strong vertical integration – Quick decision-making – Lack of NIMBY-culture
• Diversity of markets served
Weaknesses • Temperature and humidity constrain
middle-of-the-day operations at DXB • Limited short-haul feeder potential • No alliance membership • Related to destination
development/OD growth: • Sterility and homogeinity of the
destination (Henderson 2006) • Low level of repeat visits to Dubai • Tourism depends on large extent on
stop-over market. Average stay is short (2.5 days)

Opportunities and threats Emirates and Dubai
Opportunities • 3.5 billion people within
8 hrs flying time • Central to many
emerging, underserved economies – Clark: “Africa is ripe fruit
that only needs to be picked”
• Alliances?
Threats • World economy • Political and economic instability
in the region* • Terrorism • Lobbying by competitors, calling
for legal protection against unfair competition
• Aggressive competition from the neighbours; overcapacity?
• Dependency on expatriate professionals *Source: M. Levine (2013). Is the Gulf airline boom a
bubble? Airneth column 12 June 2013. www.airneth.nl

Turkish Airlines and Istanbul compose a somewhat different story
• Turkish Airlines partly privatized in 2004-2006 49% of shares still held by Republic of Turkey • Liberalization domestic market in 1996
Opportunities: • Benefits from domestic market of 70 million people, with a rapidly increasing propensity to fly • Geographical location in some ways better than that of Gulf hubs:
– Domestic market with over 70 million people, with a rapidly increasing propensity to fly – Short-haul fleet can cover large part of population centres in Europe, North-Africa, Middle
East and Russia • Strong Turkish diaspora in Western-Europe • Part of STAR alliance
Major bottlenecks: – fierce congestion at the Istanbul hub – But third Istanbul Airport planned for 90-150 million passengers, scheduled to be opened in
2015 – Fairly restrictive bilaterals – Landside accessibility

Outline
• The Gulf and Turkish hub models • Gulf carrier competition & pricing • Answers from incumbent carriers • Some further points for discussion

Competition for European hubs in transfer market has increased during last decade
Number of alternatives for transfer passengers to best connection where European hubs offer at least one connection, 2002-2011
Source: Copenhagen Economics/SEO 2012

Turkish larger competitor to SkyTeam at AMS than Emirates in terms of
market overlaps
0%
10%
20%
30%
40%
50%
60%
Parijs Charles de Gaulle
(CDG)
Dubai (DXB) Frankfurt (FRA) Istanbul (IST) Londen Heathrow
(LHR)
München (MUC)
% o
f mar
kets
on
whi
ch h
ub o
verla
ps w
ith
Amst
erda
m
2009
2010
2011

New Emirates services to secondary cities stimulate demand to Dubai and beyond destinations, without only limited cannibalization of demand of incumbent airlines
Source: Grimme (2011). The growth of Arabian airlines from a German perspective-A study of the impacts of new air services to Asia. Journal of Air Transport Management
EK traffic growing quickly…
..but traffic via FRA and MUC…
..and other hubs as well
Demand generation
Market between Düsseldorf and Asia
Via DXB
Via FRA/MUC
Via AMS/LON/PAR

Emirates on average 22-28% market share on directly served overlap destinations in Asia; share increases with
frequency to Dubai
Emirates has on average 28% market share on overlapping STAR destinations in Asia out of secondary city Hamburg
0% 10% 20% 30% 40% 50% 60% 70% 80% 90%
Market Share FRA/MUC Market Share DXB
Source: Grimme (2011) From Dusseldorf From Hamburg
via FRA/MUC via DXB via FRA/MUC via DXB
Top 10 overlap 20% 32% 43% 27%
Top 28 overlap 20% 34% 42% 28% Total Asia destinations 21% 28% 35% 22%
Market share Emirates of twice-daily services to Dubai on overlapping destinations in Asia 6% higher than for single daily Emirates service
EK DUS-DXB: 14x/week
EK HAM-DXB: 7x/week
Source: Grimme (2011)
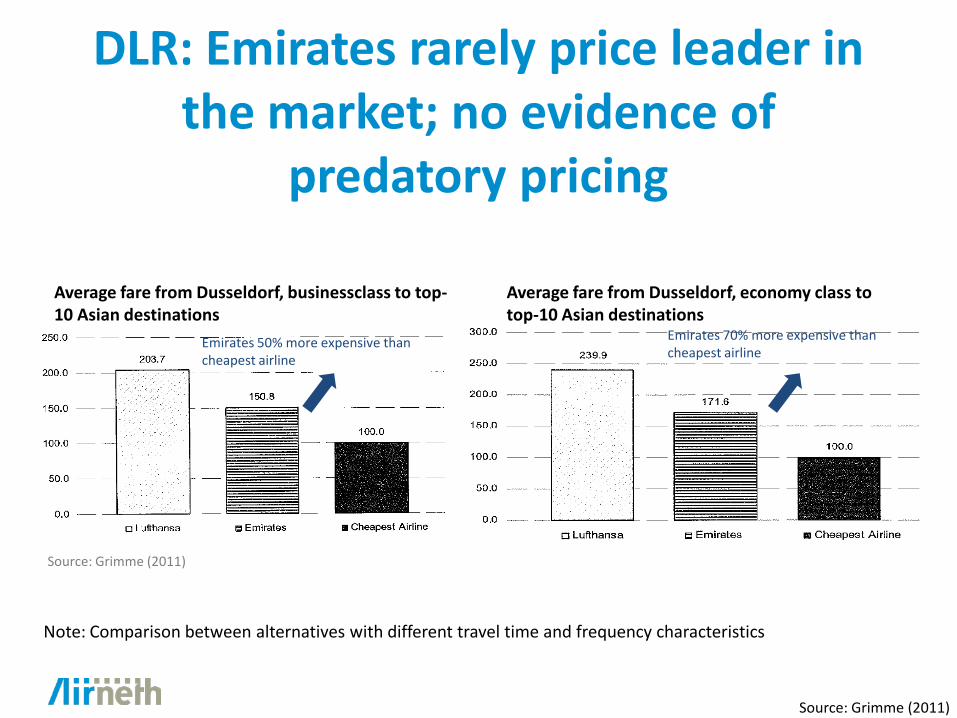
DLR: Emirates rarely price leader in the market; no evidence of
predatory pricing
Average fare from Dusseldorf, businessclass to top-10 Asian destinations
Average fare from Dusseldorf, economy class to top-10 Asian destinations
Emirates 50% more expensive than cheapest airline
Source: Grimme (2011)
Emirates 70% more expensive than cheapest airline
Note: Comparison between alternatives with different travel time and frequency characteristics
Source: Grimme (2011)

Outline
• The Gulf and Turkish hub models • Gulf carrier competition & pricing • Answers from incumbent carriers • Conclusions & research agenda

The answers from European network carriers
• Cost restructuring • Focus on markets outside reach of Gulf carriers
– Markets on which travel times via Gulf are substantially longer than via European hubs, (e.g. UK to China) or where Gulf is not an option (Transatlantic)
– Market size: move towards increasingly smaller markets • Searching for alliances and joint ventures “ If you can’t beat
them, join them” • Lobbying, limitation of traffic rights, fair competition clauses
in EC external aviation policy

Gulf carriers have entered the alliance game
• Turkish Airlines part of STAR-alliance since 2008 • Qatar Airways joining Oneworld • Participation Etihad in Air Berlin • Cooperation/codesharing Etihad with Air France-KLM • Cooperation Etihad and Garuda (changing AMS operation from DXB to AUH) • Cooperation Emirates and Qantas • But: already many codeshare agreements and interlining, EK showing U2 beyond
cnx’ • Impact of alliances and joint ventures:
– Larger indirect network for European consumers into India, Asia and Australia – More efficient schedules, larger FFP – In case of joint ventures:
• Price-coordination • Reduction of overcapacity on the Europe-Middle East market • Less competition • Better yields

Outline
• The Gulf and Turkish hub models • Gulf carrier competition & pricing • Answers from incumbent carriers • Some further points for discussion

Outline
• The Gulf and Turkish hub models • Gulf carrier competition & pricing • Answers from incumbent carriers • Further points for discussion

Remaining questions and further points for discussion
• To what extent do Gulf carriers compete with EU network carriers?
• How do Gulf carriers price their flights in comparison to EU network carriers. Predatory pricing?
• What is the impact of Gulf carrier entry on ticket prices in the market?
• What will be the impact of aircraft deliveries on market shares and profitability?
• How will Gulf carrier competition impact networks of European carriers in longer-run? What role will alliances play? Will these impact outweigh the economic benefits associated with Gulf carrier service?
Top Related