
![Overview on the efficacy and safety of gadobutrol: an MRI ......[5] Overview on the efficacy and safety of gadobutrol: an MRI contrast agent for the CNS, body and vessels The use of](https://static.fdocuments.in/doc/165x107/602a95d84b7e5b149b03bca1/overview-on-the-efficacy-and-safety-of-gadobutrol-an-mri-5-overview-on.jpg)


Languages
Pages
Legal


509Copyright © 2016 The Korean Society of Radiology
INTRODUCTION
Solid pancreatic lesions (SPLs), broadly classified as neoplastic and non-neoplastic lesions, are more frequently encountered in the course of routine radiology practice
Comparison of Multidetector CT and Gadobutrol-Enhanced MR Imaging for Evaluation of Small, Solid Pancreatic LesionsTae Won Choi, MD1, Jeong Min Lee, MD1, 2, Jung Hoon Kim, MD1, 2, Mi Hye Yu, MD3, Joon Koo Han, MD1, 2, Byung Ihn Choi, MD1, 2
1Department of Radiology and 2Institute of Radiation Medicine, Seoul National University Hospital, Seoul 03080, Korea; 3Department of Radiology, Konkuk University Medical Center, Seoul 05030, Korea
Objective: To compare multidetector computed tomography (MDCT) and MRI for lesion conspicuity, as well as the detection and characterization of small solid pancreatic lesions (SPLs).Materials and Methods: 193 patients with small SPLs (< 3 cm) and 52 patients with normal pancreas who underwent both multiphasic MDCT and gadobutrol-enhanced MRI were included in our study. Two radiologists blinded to the pathologic diagnoses independently reviewed those images, and determined the detection of “SPL per se” and “SPL in consideration of secondary features”, the lesion conspicuity, the probability of pancreatic ductal adenocarcinoma (PDAC), and the most likely specific diagnosis.Results: The sensitivity of MRI for “detection of SPL per se” was significantly higher than that of CT in both reviewers: 92.7% (179/193) and 97.9% (189/193), respectively, for reviewer 1 (p = 0.031) and 90.7% (175/193) and 99.5% (192/193), respectively, for reviewer 2 (p < 0.001). In addition, MRI provided better lesion conspicuity than MDCT for both reviewers (p < 0.001). However, CT and MRI did not show significant difference in sensitivity for “detection of SPL in consideration of secondary features”, specificity for SPL detection, and differentiation of PDAC vs. non-PDAC (p > 0.05). The accuracies of CT and MRI for making a specific diagnosis were as follows: 85.7% (210/245) vs. 86.9% (213/245), respectively, for reviewer 1 (p = 0.736), and 91.8% (225/245) vs. 93.5% (229/245), respectively, for reviewer 2 (p = 0.454).Conclusion: MRI showed better lesion conspicuity than MDCT, but did not show significantly different diagnostic performance compared with MDCT for detecting and characterizing small SPLs.Index terms: Pancreas; CT; MRI
Received August 27, 2015; accepted after revision April 7, 2016.Corresponding author: Jeong Min Lee, MD, Department of Radiology, Seoul National University Hospital, 101 Daehak-ro, Jongno-gu, Seoul 03080, Korea.• Tel: (822) 2072-3154 • Fax: (822) 743-6385• E-mail: [email protected] is an Open Access article distributed under the terms of the Creative Commons Attribution Non-Commercial License (http://creativecommons.org/licenses/by-nc/3.0) which permits unrestricted non-commercial use, distribution, and reproduction in any medium, provided the original work is properly cited.
Korean J Radiol 2016;17(4):509-521
due to the increasingly widespread use of cross-sectional imaging for the evaluation of abdominal diseases (1). Among common SPLs, pancreatic ductal adenocarcinomas (PDACs), the fourth most common cause of cancer-related death in the United States (2), remains one of the most challenging tumors to treat (3). Until now, only 15–20% of patients with PDACs have potentially curative disease using margin-negative surgical resection at the time of diagnosis (4-6). Furthermore, although accurate and timely diagnosis of pancreatic malignancies is essential as it facilitates patient triage and guides the clinical management, precise characterization of small SPL is not always easy as they frequently show atypical imaging features (7).
Multiphasic multidetector computed tomography (MDCT)
http://dx.doi.org/10.3348/kjr.2016.17.4.509pISSN 1229-6929 · eISSN 2005-8330
Original Article | Gastrointestinal ImagingOriginal Article | Experimental and Others

510
Choi et al.
Korean J Radiol 17(4), Jul/Aug 2016 kjronline.org
including arterial, pancreatic and hepatic venous phases has become a frontline technique for evaluation of a variety of pancreatic diseases, including PDAC (8), and is recommended as a primary diagnostic test by National Comprehensive Cancer Network Guidelines for staging of PDAC (9).
Although MR imaging is more vulnerable to the effect of motion and usually has lower spatial resolution than CT, its strength lies in its high-contrast resolution that is potentially useful for evaluating low-contrast SPLs (10-13). With recent advances in MRI technology, including higher field strength (3T), increasingly powerful multichannel coils, high resolution three-dimensional (3D) gradient-recalled echo (GRE) sequences and diffusion-weighted imaging (DWI), MRI may provide improved diagnostic accuracy for SPLs than before (14-16). However, to the best of our knowledge, only one previous study showed that CT was slightly better than MRI (CT = 88.4% vs. MRI = 75%, p = 0.388) without statistical significance in the diagnosis of small SPLs, but the major limitation was the small study population (17).
Therefore, the purpose of our study was to compare multiphasic MDCT and gadobutrol-enhanced MRI with regard to lesion conspicuity as well as the detection and characterization of small SPLs.
MATERIALS AND METHODS
Institutional Review Board approval was obtained, and informed patient consent was waived due to the retrospective nature of our study.
PatientsThe pathology and radiology databases of our medical
institution were searched in order to identify patients with common SPLs diagnosed between January 2006 and August 2014, and we identified the patients who were pathologically confirmed to have a PDAC, neuroendocrine tumor (NET), solid pseudopapillary tumor (SPT) or pancreatic metastasis. We also searched the medical records in order to identify patients with mass-forming, autoimmune pancreatitis (AIP), who were diagnosed either by pathology or clinically according to the Asian diagnostic criteria (18), which are based on the combination of detected autoantibodies, elevated level of serum immunoglobulin G (IgG) or IgG4, and resolution or marked improvement of a pancreatic lesion after steroid therapy. Using these criteria,
679 patients with PDACs (n = 427), NETs (n = 124), SPTs (n = 83), AIPs (n = 20) or metastases (n = 25) were identified. Among the identified patients, 486 were excluded due to the following exclusion criteria: 1) SPLs with a diameter > 3 cm in their longest dimension (n = 296), where the size of SPL was determined based on the pathologic report for the patients who underwent pancreatic surgery, or was measured on the preoperative CT or MR images for the patients who only underwent biopsy without surgical treatment (14, 15, 19), 2) patients who did not undergo both MDCT and MRI prior to surgery or treatment (n = 112), 3) CT and MRI protocols not including multiphasic dynamic imaging and DWI (n = 63), 4) patients who underwent CT examination on 4 channel-detector CT scanner (n = 3), 5) an interval between CT and MRI of longer than 60 days (n = 10), and 6) patients who had definite multiple liver or lung metastases, or diffuse peritoneal seeding as seen on CT or MRI, as these extra-pancreatic findings may suggest a diagnosis of malignancy (n = 2). Finally, 193 patients (M:F = 98:95; mean age, both 60 years) with underlying pancreatic diseases of PDACs (n = 127), NETs (n = 43), SPTs (n = 10), mass-forming AIPs (n = 7), or metastases (n = 6) comprised our study population. All 193 patients with SPL underwent histopathologic evaluation, which was based on surgically resected specimen for 185 patients (95.9%), and on needle biopsy specimen for 8 patients (4.1%, 5 PDACs and 3 mass-forming AIPs). The primary malignancies of the pancreatic metastases were as follows: renal cell carcinoma (n = 4), neuroendocrine carcinoma of the rectum (n = 1), and hepatocellular carcinoma (n = 1).
In order to evaluate the ability of CT and MRI in detecting SPLs, we searched the radiology databases and electronic medical records of our institution to identify patients with normal pancreas who underwent both MRI and CT using a pancreatobiliary protocol for non-pancreatic diseases. First, 4045 patients who underwent pancreatobiliary MRI from January 2006 to August 2014 in our institution were searched. Among these patients, 2860 patients were excluded due to the following reasons: patients without pancreatobiliary protocol CT (n = 219), abnormal finding at pancreas on CT or MRI (n = 2563), and overt liver or lung metastases, or diffuse peritoneal seeding on CT or MRI (n = 78). In addition, patients with abnormal finding at extrahepatic bile duct on CT or MRI (n = 1133) were excluded as SPL in pancreatic head portion can cause upstream bile ductal change (10, 12). As a result, 52 patients with normal pancreas (M:F = 27:25; mean age, 60 years) were included in

511
Comparison of CT and MRI for Evaluation of Small, Solid Pancreatic Lesions
Korean J Radiol 17(4), Jul/Aug 2016kjronline.org
this study. The indications for abdominal imaging in these patients were as follows: gallbladder diseases (n = 21); benign intrahepatic bile duct diseases (n = 17); workup for abdominal symptoms or laboratory parameter abnormalities (n = 10); and gastroduodenal disease (n = 4).
CT Technique Based on our pancreas protocol, contrast-enhanced CT
scans including precontrast, arterial, pancreatic, and hepatic venous phases, were obtained using one of the following multi-detector CT scanners: 64-channel scanners (Brilliance 64, Philips Medical Systems, Cleveland, OH, USA; Somatom definition, Siemens Medical Solutions, Erlangen, Germany; Discovery CT750 HD, GE Healthcare, Milwaukee, WI, USA) for 176 patients, a 16-channel scanner (Sensation 16, Siemens Medical Solutions) for 65 patients, and an 8-channel scanner (LightSpeed Ultra, GE Healthcare) for 4 patients. The general scanning parameters were as follows: detector configurations of 64 x 0.6, 16 x 0.75, and 8 x 1.25 mm for the 64-, 16-, and 8-channel multi-detector, respectively; gantry rotation times of 0.5–0.75 second; tube currents of 150–200 mAs; tube voltage of 120 kVp; slice thicknesses of 3.0 mm; reconstruction intervals of 2–3 mm; and field of views of 300–390 mm.
For dynamic imaging, a total of 1.5 mL of nonionic contrast medium (iopromide [370 mg of iodine per mL], Ultravist 370; Schering, Berlin, Germany) per kilogram of body weight was administered at a rate of 2–5 mL/s using an automatic power injector (Multilevel CT, Medrad, Pittsburgh, PA, USA), followed by a 20 mL flush of sterile saline. For arterial phase imaging, the shortest scanning delay of 5 seconds was used after reaching a triggering threshold of 100 Hounsfield unit of aortic blood using an automatic bolus tracking technique. Pancreatic phase (20) scanning was then obtained for 22–24 seconds after the trigger threshold was reached, and the hepatic venous phase scan was obtained with a 70 second scanning delay following the contrast injection (10, 20).
MRI TechniqueMRI was performed using one of the following MR units,
i.e., a 3T system (Verio, Siemens Healthcare; Ingenia, Philips Medical Systems) for 162 patients and 1.5T systems (Sonata, Siemens Healthcare; Signa Excite, GE Healthcare; Signa HDx, GE Healthcare) for 83 patients. Among these systems, the Verio and Signa Excite were the two most frequently used MR scanners and scanned 52.7% Ta
ble
1. M
R Pa
ram
eter
s
T1W
I (O
P/IP
) T2
WI
DWI
Thic
k Sl
ab M
RCP
3D M
RCP
Dyna
mic
Im
age
Scan
ner
1Sc
anne
r 2
Scan
ner
1Sc
anne
r 2
Scan
ner
1Sc
anne
r 2
Scan
ner
1Sc
anne
r 2
Scan
ner
1Sc
anne
r 2
Scan
ner
1Sc
anne
r 2
TR/T
E (m
sec)
4.0/
1.3
&
4.0/
2.3
170/
2.0
&
170/
4.2
800/
9375
2/92
4500
/52
3275
/81.
925
00/9
0940
00/9
9923
20/8
1540
00/8
753.
4/1.
25.
0/2.
2
ETL
11
256
11
125
61
691
11
FA9°
60°
130°
90°
180°
90°
130°
or
180°
90°
130°
90°
11°
12°
Thic
knes
s (m
m)
37
77
77
50 o
r 60
600.
92
34.
8
FOV
(mm
)30
0–38
026
0–38
030
0–38
030
0–38
038
038
024
026
038
025
0–32
030
0–38
030
0–38
0
Mat
rix32
0 x
285
320
x 22
438
4 x
307
320
x 25
625
6 x
205
144
x 14
432
0 x
256
384
x 25
638
4 x
366
320
x 32
038
4 x
278
320
x 22
4
Scan
ner
1 =
Verio
, Sie
men
s M
edic
al S
olut
ion;
Sca
nner
2 =
Sig
na E
xcit
e, G
E M
edic
al S
yste
m. D
WI
= di
ffus
ion-
wei
ghte
d im
ages
, ETL
= e
cho
trai
n le
ngth
, FA
= fli
p an
gle,
FOV
= f
ield
of
vie
w, I
P =
in-p
hase
, MRC
P =
mag
neti
c re
sona
nce
chol
angi
opan
crea
togr
aphy
, OP
= op
pose
d-ph
ase,
TE
= ec
ho t
ime,
TR
= re
peti
tion
tim
e, T
1WI
= T1
-wei
ghte
d im
ages
, T2W
I =
T2-
wei
ghte
d im
ages
, 3D
= th
ree-
dim
ensi
onal

512
Choi et al.
Korean J Radiol 17(4), Jul/Aug 2016 kjronline.org
(129/245) and 22.9% (56/245) of the total study subjects, respectively. All MR sequence parameters used for these two scanners were summarized in Table 1.
Prior to contrast injection, T2-weighted (T2W) Half Fourier Acquisition Single Shot Turbo Spin Echo images, T1-weighted (T1W) in-phase and out-of phase 3D GRE images, respiratory-triggered DWI, and magnetic resonance cholangiopancreatography were obtained. Dynamic, fat-saturated, T1W 3D GRE imaging was performed before
and after intravenous administration of 0.1 mmol/kg of gadobutrol (Gadovist, Gd-BT-DO3A, Schering, Berlin, Germany) per kilogram of the patient’s body weight at an injection rate of 1.5 mL/sec. Intravenous injection of contrast agent was performed using a power injector (Stellent Dual, Siemens Medical Solutions) and was followed by a flush of 20 mL of normal saline. The scanning times of each phase of the dynamic study were determined using real-time MR fluoroscopy as follows: arterial, pancreatic,
Fig. 1. 81-year-old woman with pancreatic ductal adenocarcinoma. A. Axial, post-contrast CT image obtained during hepatic venous phase shows dilatation of main pancreatic duct with abrupt narrowing (arrow) at neck portion of pancreas. However no definite focal pancreatic mass lesion obstructing main pancreatic duct is visualized on CT. Both reviewers answered that SPL per se was not detected on CT images. However, main pancreatic ductal change led both reviewers to detection of SPL in consideration of secondary features and to correct diagnosis. B. Axial, fat-suppressed, T2-weighted image demonstrates dilatation of main pancreatic duct (arrowheads) and abrupt narrowing (arrow) without definite parenchymal lesion at neck portion of pancreas. C. Axial, fat–suppressed, T1-weighted image shows approximately 1 cm sized ill-defined, subtle hypointensity lesion (arrow) in neck portion of pancreas. D. Axial, post-contrast, T1-weighted image obtained during pancreatic phase, shows no definite mass lesion in pancreas. In addition, diffusion-weighted image did not show definite focal lesion in pancreas (not shown). Both reviewers reported SPL per se as detectable on MR image with poor lesion conspicuity graded as 1, and their specific diagnosis was pancreatic ductal adenocarcinoma. SPL = solid pancreatic lesion
A
C
B
D

513
Comparison of CT and MRI for Evaluation of Small, Solid Pancreatic Lesions
Korean J Radiol 17(4), Jul/Aug 2016kjronline.org
Fig. 2. Representative figures for each conspicuity category from six different patients with pancreatic ductal adenocarcinoma. A, B, and C demonstrate axial CT images obtained during pancreatic phase and D, E, and F show axial fat-suppressed non-enhanced T1-weighted MR images. Conspicuity of lesion (arrows) is 1, poor, i.e., faint perceptibility of lesion, on A and D; 2, good, i.e., easily recognizable, on B and E; and 3, excellent, i.e., excellent lesion perceptibility, on C and F.
A
C
E
B
D
F

514
Choi et al.
Korean J Radiol 17(4), Jul/Aug 2016 kjronline.org
Fig. 3. 40-year-old woman with pancreatic neuroendocrine tumor, grade 1. A. Axial, post-contrast CT image obtained during pancreatic phase shows subtle, slightly high attenuated lesion (arrow) in tail portion of pancreas. On CT, both reviewers were not able to detect “SPL in consideration of secondary features” as well as “SPL per se”. B. Axial, fat-suppressed, T2-weighted image demonstrates approximately 1.5 cm sized hyperintense lesion (arrow) at pancreatic tail. C. On axial, fat–suppressed, non-enhanced T1-weighted image, lesion (arrow) shows marked hypointensity compared to that of pancreas parenchyma. D, E. Axial, diffusion-weighted image with b value of 800 sec/mm2 (D) and apparent diffusion constant map (E) also demonstrate hyperintense lesion (arrows) with diffusion restriction. On MRI, both reviewers were able to detect SPL per se and made correct specific diagnosis. Lesion conspicuity was excellent for reviewer 1, and good for reviewer 2. SPL = solid pancreatic lesion
A B
C D
E
515
Comparison of CT and MRI for Evaluation of Small, Solid Pancreatic Lesions
Korean J Radiol 17(4), Jul/Aug 2016kjronline.org
hepatic venous, and delayed phase images were obtained serially at 5 seconds, 25 seconds, and 55 seconds after contrast arrival to the abdominal aorta detected using an MR fluoroscopy technique (21, 22). DWI was performed using multisection single-shot, spin-echo, echo-planar imaging with a spectral presaturation attenuated inversion-recovery, and fat-suppressed pulse sequence. For 1.5T units, b values of 0, 500, and 1000 s/mm2 were used, and b values of 0, 25, 50, 75, 100, 150, 200, 500, 800, and 1000 s/mm2 were used for 3T units.
Image AnalysisAll CT and MR images were reviewed on a PACS
workstation monitor (m-view, Marotech) by two attending abdominal radiologists, who had 17 and 7 years, respectively, of clinical experience in the interpretation of body CT and MRI. Both blinded reviewers independently reviewed the CT and MR image sets with a two-week interval between the two interpretation sessions in order to minimize any learning bias. CT and MR images were randomly presented during each interpretation session to ensure that there was no predictable order between the two data sets. Both reviewers knew that each of the study patients may or may not have a SPL, although the reviewers
were blinded to the other patients’ clinical information and histopathologic results.
The detection of the SPL was determined twice in two different ways: 1) detection of SPL “per se”, and 2) detection of SPL “in consideration of secondary features”.
First, the reviewers determined the presence or absence of SPL per se. If a discernible focal mass-like lesion in the pancreas parenchyma that shows different attenuation or signal intensity compared to normal pancreatic parenchyma on at least one of the images of various phases and sequences, reviewers determined that SPL per se is present. On the basis of these results, the sensitivity, specificity, and accuracy for “detection of SPL per se” were calculated.
Thereafter, the reviewers determined the presence or absence of SPL in consideration of secondary features such as pancreatic ductal changes, parenchymal atrophy, or peripancreatic soft tissue infiltration. For example, when CT images show no discernible focal pancreatic lesions but only abrupt narrowing of the main pancreatic duct at pancreatic neck portion and upstream ductal dilatation, the reviewers scored that SPL per se was not detected, but SPL was detected in consideration of secondary features (Fig. 1). On the basis of these results, the sensitivity, specificity, and accuracy for “detection of SPL in consideration of secondary
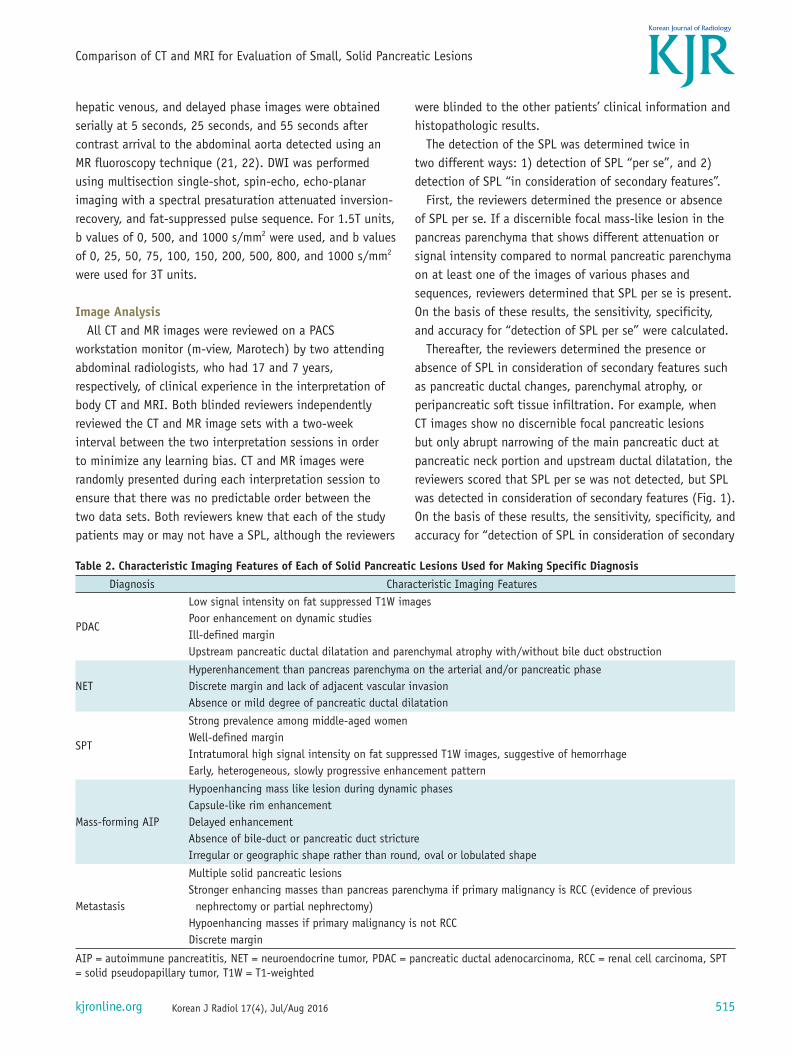
Table 2. Characteristic Imaging Features of Each of Solid Pancreatic Lesions Used for Making Specific DiagnosisDiagnosis Characteristic Imaging Features
PDAC
Low signal intensity on fat suppressed T1W imagesPoor enhancement on dynamic studiesIll-defined marginUpstream pancreatic ductal dilatation and parenchymal atrophy with/without bile duct obstruction
NETHyperenhancement than pancreas parenchyma on the arterial and/or pancreatic phaseDiscrete margin and lack of adjacent vascular invasionAbsence or mild degree of pancreatic ductal dilatation
SPT
Strong prevalence among middle-aged womenWell-defined marginIntratumoral high signal intensity on fat suppressed T1W images, suggestive of hemorrhageEarly, heterogeneous, slowly progressive enhancement pattern
Mass-forming AIP
Hypoenhancing mass like lesion during dynamic phasesCapsule-like rim enhancement Delayed enhancementAbsence of bile-duct or pancreatic duct strictureIrregular or geographic shape rather than round, oval or lobulated shape
Metastasis
Multiple solid pancreatic lesionsStronger enhancing masses than pancreas parenchyma if primary malignancy is RCC (evidence of previous nephrectomy or partial nephrectomy)Hypoenhancing masses if primary malignancy is not RCCDiscrete margin
AIP = autoimmune pancreatitis, NET = neuroendocrine tumor, PDAC = pancreatic ductal adenocarcinoma, RCC = renal cell carcinoma, SPT = solid pseudopapillary tumor, T1W = T1-weighted
516
Choi et al.
Korean J Radiol 17(4), Jul/Aug 2016 kjronline.org
features” were calculated.For the cases where SPL per se was detected, the
conspicuity of SPL was further specified using a three-point scale: 1, poor, i.e., faint perceptibility of the lesion, difficult to detect; 2, good, i.e., easily recognizable lesion, unequivocal perceptibility; and 3, excellent, i.e., excellent lesion perceptibility (Fig. 2). The lesion conspicuity was determined on most perceptible phase or sequence among all the images.
In addition, the diagnostic performance of MDCT and MRI for differentiating PDACs and non-PDACs was evaluated, considering that PDACs account for 90% of malignancies of the pancreas, requires radical pancreatectomy including regional lymphadenectomy, as well as meticulous dissection along the perivascular nerve tissue and retroperitoneum, and carry a more grave prognosis compared to those of other SPLs (2, 5). The reviewers recorded their diagnostic confidence with reference to the probability of PDAC using a 5-point scale: 5, definitely PDAC; 4, probably PDAC; 3, possibly PDAC; 2, probably other; 1, definitely other (23). The diagnosis of PDAC was based on well-known imaging features presented in the published literature including low attenuation on CT, low signal intensity on T1W images, poor enhancement on dynamic studies, ill-defined margin,
upstream pancreatic ductal dilatation, and parenchymal atrophy (1, 3, 10, 24, 25).
Finally, both reviewers were asked to suggest a most likely diagnosis based on the following six possible choices: PDAC; NET; SPT; mass-forming AIP; metastasis; and normal pancreas, based on the well-documented, characteristic imaging features summarized in Table 2 (14-16, 19, 26-32).
Histopathologic AnalysisPathology evaluation of surgically resected or biopsy
specimens served as a standard of reference for the accurate diagnosis of SPLs. All histopathologic specimens were reviewed by an attending pathologist who had more than 10 years of clinical experience in pancreatobiliary diseases.
Statistical AnalysisThe sensitivity, specificity and accuracy of CT and MRI
for detecting SPLs were calculated and compared using the McNemar test. Differences in the lesion conspicuity of the two imaging techniques for each reviewer were evaluated using the Wilcoxon signed rank test. In addition, receiver operating characteristic (ROC) analysis and pairwise comparison of ROC curves were performed to evaluate the overall performance of the two imaging techniques for
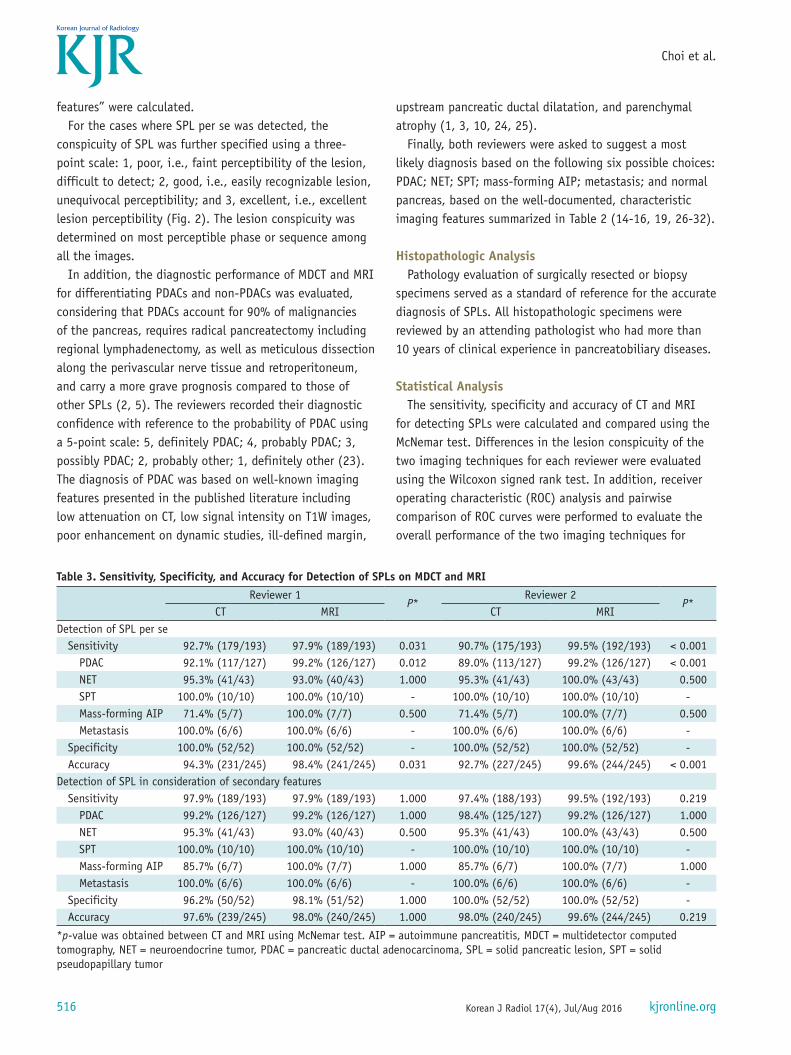
Table 3. Sensitivity, Specificity, and Accuracy for Detection of SPLs on MDCT and MRIReviewer 1
P*Reviewer 2
P*CT MRI CT MRI
Detection of SPL per seSensitivity 92.7% (179/193) 97.9% (189/193) 0.031 90.7% (175/193) 99.5% (192/193) < 0.001
PDAC 92.1% (117/127) 99.2% (126/127) 0.012 89.0% (113/127) 99.2% (126/127) < 0.001NET 95.3% (41/43) 93.0% (40/43) 1.000 95.3% (41/43) 100.0% (43/43) 0.500SPT 100.0% (10/10) 100.0% (10/10) - 100.0% (10/10) 100.0% (10/10) -Mass-forming AIP 71.4% (5/7) 100.0% (7/7) 0.500 71.4% (5/7) 100.0% (7/7) 0.500Metastasis 100.0% (6/6) 100.0% (6/6) - 100.0% (6/6) 100.0% (6/6) -
Specificity 100.0% (52/52) 100.0% (52/52) - 100.0% (52/52) 100.0% (52/52) -Accuracy 94.3% (231/245) 98.4% (241/245) 0.031 92.7% (227/245) 99.6% (244/245) < 0.001
Detection of SPL in consideration of secondary featuresSensitivity 97.9% (189/193) 97.9% (189/193) 1.000 97.4% (188/193) 99.5% (192/193) 0.219
PDAC 99.2% (126/127) 99.2% (126/127) 1.000 98.4% (125/127) 99.2% (126/127) 1.000NET 95.3% (41/43) 93.0% (40/43) 0.500 95.3% (41/43) 100.0% (43/43) 0.500SPT 100.0% (10/10) 100.0% (10/10) - 100.0% (10/10) 100.0% (10/10) -Mass-forming AIP 85.7% (6/7) 100.0% (7/7) 1.000 85.7% (6/7) 100.0% (7/7) 1.000Metastasis 100.0% (6/6) 100.0% (6/6) - 100.0% (6/6) 100.0% (6/6) -
Specificity 96.2% (50/52) 98.1% (51/52) 1.000 100.0% (52/52) 100.0% (52/52) -Accuracy 97.6% (239/245) 98.0% (240/245) 1.000 98.0% (240/245) 99.6% (244/245) 0.219
*p-value was obtained between CT and MRI using McNemar test. AIP = autoimmune pancreatitis, MDCT = multidetector computed tomography, NET = neuroendocrine tumor, PDAC = pancreatic ductal adenocarcinoma, SPL = solid pancreatic lesion, SPT = solid pseudopapillary tumor
517
Comparison of CT and MRI for Evaluation of Small, Solid Pancreatic Lesions
Korean J Radiol 17(4), Jul/Aug 2016kjronline.org
diagnosing PDAC vs. other SPLs (23). The accuracy CT and MRI for specific diagnosis was calculated and compared using the McNemar test. Interobserver agreement was analyzed for each review item using kappa statistics. Weighted kappa with linear weights was applied for ordinal data. Kappa values of less than 0.20 indicated slight agreement, 0.21–0.40 fair agreement, 0.41–0.60 moderate agreement, 0.61–0.80 substantial agreement, and more than 0.80 almost perfect agreement. For all analyses, p values ≤ 0.05 were considered as statistically significant difference. SPSS 19.0 software (SPSS Inc., Chicago, IL, USA) was used for all statistical analyses except ROC analysis and kappa statistics, which were performed using MedCalc software (MedCalc, Mariakerke, Belgium).
RESULTS
Sensitivity, Specificity, and Accuracy for Detection of SPLThe sensitivity, specificity, and accuracy for “detection
of SPL per se” and “detection of SPL in consideration of secondary features” were presented in Table 3.
The sensitivity of MRI for “detection of SPL per se” was significantly higher than that of CT in both reviewers: 92.7% (179/193) and 97.9% (189/193), respectively, for reviewer 1 (p = 0.031) and 90.7% (175/193) and 99.5% (192/193), respectively, for reviewer 2 (p < 0.001) (Fig. 3). The specificity of both CT and MRI for “detection of SPL per se” was equally 100.0% (52/52) for both reviewers.
However, the sensitivity of CT and MRI for “detection of SPL in consideration of secondary features” was not significantly different for both reviewers: 97.9% (189/193) and 97.9% (189/193), respectively, for reviewer 1 and 97.4% (188/193) and 99.5% (192/193), respectively, for reviewer 2 (p = 0.219). In addition, the specificity of CT and MRI did not differ significantly for “detection of SPL in consideration of secondary features” for both reviewers: 96.2% (50/52) and 98.1% (51/52), respectively, for reviewer 1 (p = 1.000), and both 100.0% (52/52) for reviewer 2.
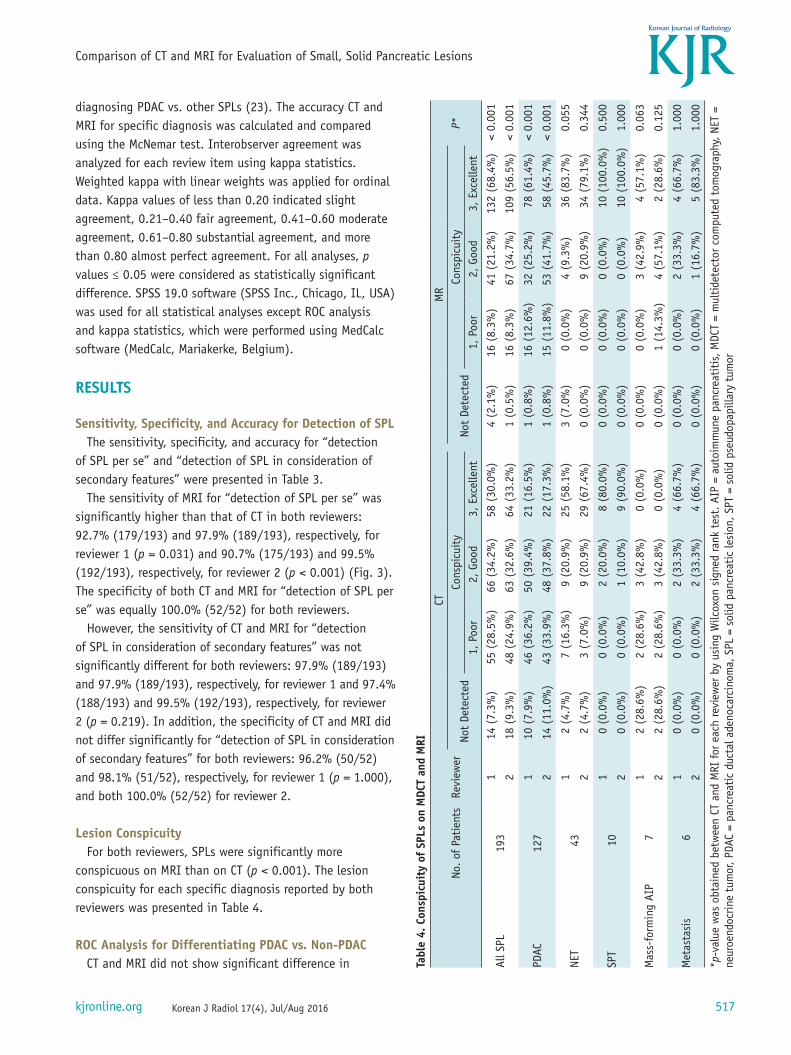
Lesion ConspicuityFor both reviewers, SPLs were significantly more
conspicuous on MRI than on CT (p < 0.001). The lesion conspicuity for each specific diagnosis reported by both reviewers was presented in Table 4.
ROC Analysis for Differentiating PDAC vs. Non-PDACCT and MRI did not show significant difference in Ta
ble
4. C
onsp
icui
ty o
f SP
Ls o
n M
DCT
and
MRI
No. o
f Pa
tien
tsRe
view
erCT
MR
P*No
t De
tect
edCo
nspi
cuit
yNo
t De
tect
edCo
nspi
cuit
y1,
Poo
r2,
Goo
d3,
Exc
elle
nt1,
Poo
r2,
Goo
d3,
Exc
elle
nt
All S
PL19
31
14 (
7.3%
)55
(28
.5%
)66
(34
.2%
)58
(30
.0%
)4
(2.1
%)
16 (
8.3%
)41
(21
.2%
)13
2 (6
8.4%
)<
0.00
1
218
(9.
3%)
48 (
24.9
%)
63 (
32.6
%)
64 (
33.2
%)
1 (0
.5%
)16
(8.
3%)
67 (
34.7
%)
109
(56.
5%)
< 0.
001
PDAC
127
110
(7.
9%)
46 (
36.2
%)
50 (
39.4
%)
21 (
16.5
%)
1 (0
.8%
)16
(12
.6%
)32
(25
.2%
)78
(61
.4%
)<
0.00
1
214
(11
.0%
)43
(33
.9%
)48
(37
.8%
)22
(17
.3%
)1
(0.8
%)
15 (
11.8
%)
53 (
41.7
%)
58 (
45.7
%)
< 0.
001
NET
431
2 (4
.7%
)7
(16.
3%)
9 (2
0.9%
)25
(58
.1%
)3
(7.0
%)
0 (0
.0%
)4
(9.3
%)
36 (
83.7
%)
0.05
5
22
(4.7
%)
3 (7
.0%
)9
(20.
9%)
29 (
67.4
%)
0 (0
.0%
)0
(0.0
%)
9 (2
0.9%
)34
(79
.1%
)0.
344
SPT
101
0 (0
.0%
)0
(0.0
%)
2 (2
0.0%
)8
(80.
0%)
0 (0
.0%
)0
(0.0
%)
0 (0
.0%
)10
(10
0.0%
)0.
500
20
(0.0
%)
0 (0
.0%
)1
(10.
0%)
9 (9
0.0%
)0
(0.0
%)
0 (0
.0%
)0
(0.0
%)
10 (
100.
0%)
1.00
0
Mas
s-fo
rmin
g AI
P7
12
(28.
6%)
2 (2
8.6%
)3
(42.
8%)
0 (0
.0%
)0
(0.0
%)
0 (0
.0%
)3
(42.
9%)
4 (5
7.1%
)0.
063
22
(28.
6%)
2 (2
8.6%
)3
(42.
8%)
0 (0
.0%
)0
(0.0
%)
1 (1
4.3%
)4
(57.
1%)
2 (2
8.6%
)0.
125
Met
asta
sis
61
0 (0
.0%
)0
(0.0
%)
2 (3
3.3%
)4
(66.
7%)
0 (0
.0%
)0
(0.0
%)
2 (3
3.3%
)4
(66.
7%)
1.00
0
20
(0.0
%)
0 (0
.0%
)2
(33.
3%)
4 (6
6.7%
)0
(0.0
%)
0 (0
.0%
)1
(16.
7%)
5 (8
3.3%
)1.
000
*p-v
alue
was
obt
aine
d be
twee
n CT
and
MRI
for ea
ch re
view
er b
y us
ing
Wilc
oxon
sig
ned
rank
tes
t. A
IP =
aut
oim
mun
e pa
ncre
atit
is, M
DCT
= m
ulti
dete
ctor
com
pute
d to
mog
raph
y, N
ET =
ne
uroe
ndoc
rine
tum
or, P
DAC
= pa
ncre
atic
duc
tal a
deno
carc
inom
a, S
PL =
sol
id p
ancr
eati
c le
sion
, SPT
= s
olid
pse
udop
apill
ary
tum
or

518
Choi et al.
Korean J Radiol 17(4), Jul/Aug 2016 kjronline.org
determining the probability of PDAC for both reviewers: the area under the curves of CT and MRI were 0.934 (95% confidence interval [CI]: 0.895–0.961) and 0.955 (95% CI: 0.921–0.977) for reviewer 1 (p = 0.173), respectively, and 0.967 (95% CI: 0.937–0.986) and 0.973 (95% CI: 0.944–0.989), respectively, for reviewer 2 (p = 0.693).
Accuracy of CT and MRI for Specific DiagnosisThe accuracy of CT and MRI for specific diagnosis was not
significantly different for both readers: 85.7% (210/245) and 86.9% (213/245), respectively, for reviewer 1 (p = 0.736) and 91.8% (225/245) and 93.5% (229/245), respectively, for reviewer 2 (p = 0.454). The numbers of correct diagnoses for each specific diagnosis for both reviewers are summarized in Table 5.
Inter-Observer AgreementThe results of inter-observer agreements showed almost
perfect agreement between the two reviewers except the probability of PDAC evaluated on MRI (k = 0.792). The kappa values on CT and MRI were 0.939 and 0.941 for detection of SPL per se; 0.965 and 0.929 for detection of SPL in consideration of secondary features; 0.894 and 0.815 for lesion conspicuity; 0.807 and 0.792 for the probability of PDAC; and 0.865 and 0.832 for specific diagnosis, respectively (Table 6).
DISCUSSION
The results of our study demonstrated that, the sensitivity for “detection of SPL per se” and lesion conspicuity are significantly higher on MRI than on CT imaging. This superiority of MRI in visualization of parenchymal lesion might be explained by the additional benefit derived from the fat-suppressed T1W sequence and DWI, as well as high-contrast resolution of MRI (33-35). Previous studies demonstrated that fat-suppressed T1W images are able to provide high contrast between pancreatic solid tumors and background pancreatic parenchyma having high signal intensity due to the presence of proteins and manganese, as compared with T2W images or postcontrast T1W images (36, 37). In addition, several reports suggested the usefulness of DWI in detecting PDAC (35, 38).
In our study, PDAC accounted for 65.8% (127/193) of all SPLs, and the difference in sensitivity of CT and MRI for detection of SPL per se was largely due to the different sensitivity for “PDAC per se” while other SPLs did not show significant difference in sensitivities between two modalities (Table 3). Several previous studies showed that a small subset of PDAC is indistinguishable from normal pancreatic parenchyma on CT, which is called “visually isoattenuating PDAC” (12, 39, 40). The result of our study corroborates previous reports as the difference in sensitivity of CT and MRI for detection of PDAC per se (7.1% for reviewer 1 and
Table 5. Accuracy of CT and MRI for Making Specific Diagnosis
Diagnosis No. of PatientsReviewer 1 Reviewer 2
CT MR P* CT MR P*PDAC 127 117 (92.1%) 117 (92.1%) 1.000 122 (96.1%) 120 (94.5%) 0.727NET 43 31 (72.1%) 29 (67.4%) 0.754 34 (79.1%) 39 (90.7%) 0.063SPT 10 7 (70.0%) 9 (90.0%) 0.500 9 (90.0%) 9 (90.0%) 1.000Mass-forming AIP 7 0 (0.0%) 3 (42.9%) 0.250 3 (42.9%) 4 (57.1%) 1.000Metastasis 6 5 (83.3%) 4 (66.7%) 1.000 5 (83.3%) 5 (83.3%) -Normal 52 50 (96.2%) 51 (98.1%) 1.000 52 (100.0%) 52 (100.0%) -Overall 245 210 (85.7%) 213 (86.9%) 0.736 225 (91.8%) 229 (93.5%) 0.454
*p-value was obtained between CT and MRI using McNemar test. AIP = autoimmune pancreatitis, NET = neuroendocrine tumor, PDAC = pancreatic ductal adenocarcinoma, SPT = solid pseudopapillary tumor
Table 6. Inter-Observer Agreement
Review ItemKappa Value (95% Confidence Interval)CT MRI
Detection of SPL per se 0.939 (0.891–0.987) 0.941 (0.890–0.992)Detection of SPL in consideration of secondary features 0.965 (0.926–1.000) 0.929 (0.872–0.985)Conspicuity of SPL 0.894 (0.858–0.931)* 0.815 (0.761–0.870)*Probability of PDAC 0.807 (0.758–0.856)* 0.792 (0.744–0.839)*Specific diagnosis 0.865 (0.811–0.919) 0.832 (0.774–0.890)
*Weighted Kappa value with linear weights was calculated. PDAC = pancreatic ductal adenocarcinoma, SPL = solid pancreatic lesion

519
Comparison of CT and MRI for Evaluation of Small, Solid Pancreatic Lesions
Korean J Radiol 17(4), Jul/Aug 2016kjronline.org
10.2% for reviewer 2) is similar to the reported prevalence (5.4–14.0%) of “visually isoattenuating PDAC” (12, 39, 40). Nevertheless, the sensitivity of CT and MRI for detection of PDAC in consideration of secondary features did not differ significantly in our study. This discrepancy between the sensitivity for detection of PDAC per se and detection of PDAC in consideration of secondary features suggest the important role of secondary findings in detection of PDAC, as emphasized in previous reports (12, 39).
In addition, the diagnostic performance of CT and MRI for determining the probability of PDAC and for making specific diagnosis did not show significant difference in our study (p > 0.05). Our results supported the results of the previous study by Rao et al. (17) in that both studies showed no significant difference in accuracy of CT and MRI for diagnosing small SPLs (CT = 88.4% vs. MRI = 75%, p = 0.388).
In our study, MRI showed better lesion conspicuity than MDCT, but did not show significantly different diagnostic accuracy for specific diagnosis compared with MDCT. This discrepancy between the lesion conspicuity and diagnostic accuracy may be explained by the following. First, common SPLs such as PDAC, NET, or SPT show quite different enhancement patterns from each other, which can be well evaluated with contrast enhanced multiphasic ultrasonography, CT or MRI, despite overlapped morphologic features on unenhanced imaging (7, 41, 42). Second, it is possible that superior soft-tissue contrast resolution of MRI, which primarily contributed to the higher lesion conspicuity, may be countered by lower spatial resolution compared with the same factors on CT imaging (43, 44).
Our study results suggest that MRI currently cannot replace CT for evaluation of small SPLs, because of its higher cost and longer acquisition time compared to those of CT. However, considering the better sensitivity for “detection of SPL per se” and better lesion conspicuity on MRI than on CT, the use of MRI can be justified if SPLs are strongly suspicious but SPLs are not visually identified on CT.
Our study has several limitations. First, due to its retrospective nature, there may have been a selection bias. Second, as our study had a relatively small number of patients with SPTs, mass-forming AIPs, and pancreatic metastases, it will be necessary to conduct further studies with a larger study population in order to validate our findings. Third, the scanners for pancreatic CT and MRI were also variable. However, we believe that this was not a major limitation to our study as only qualitative analysis of the images was performed without any quantitative
analysis. Fourth, although all study patients underwent MRI with DWI, we did not evaluate the diagnostic performance of MRI with DWI compared to that of MRI without DWI. In addition, quantitative analysis of apparent diffusion coefficient (ADC) was not performed in this study. Considering several reports indicating that ADC may help to differentiate PDAC, chronic pancreatitis, and normal pancreas (13, 35, 44-47), this quantitative analysis may possibly provide additional benefits in the detection and characterization of SPLs. Finally, when the reviewers analyze the detection of SPL per se, they were asked to determine the presence or absence of the lesion without considering secondary features that may assist in diagnosis. We acknowledge that there may be a certain degree of systematic bias because it often may not be possible to dispel these secondary features while remaining completely unbiased as to the presence or absence of SPL per se.
In conclusion, gadobutrol-enhanced MRI showed better lesion conspicuity than MDCT, but did not show significantly different diagnostic performance compared with MDCT for detecting and characterizing small SPLs.
REFERENCES
1. Low G, Panu A, Millo N, Leen E. Multimodality imaging of neoplastic and nonneoplastic solid lesions of the pancreas. Radiographics 2011;31:993-1015
2. Saif MW. Pancreatic neoplasm in 2011: an update. JOP 2011;12:316-321
3. Tamm EP, Balachandran A, Bhosale PR, Katz MH, Fleming JB, Lee JH, et al. Imaging of pancreatic adenocarcinoma: update on staging/resectability. Radiol Clin North Am 2012;50:407-428
4. Al-Hawary MM, Francis IR, Chari ST, Fishman EK, Hough DM, Lu DS, et al. Pancreatic ductal adenocarcinoma radiology reporting template: consensus statement of the Society of Abdominal Radiology and the American Pancreatic Association. Radiology 2014;270:248-260
5. Conlon KC, Klimstra DS, Brennan MF. Long-term survival after curative resection for pancreatic ductal adenocarcinoma. Clinicopathologic analysis of 5-year survivors. Ann Surg 1996;223:273-279
6. Varadhachary GR, Tamm EP, Abbruzzese JL, Xiong HQ, Crane CH, Wang H, et al. Borderline resectable pancreatic cancer: definitions, management, and role of preoperative therapy. Ann Surg Oncol 2006;13:1035-1046
7. Kim JH, Lee JM, Park JH, Kim SC, Joo I, Han JK, et al. Solid pancreatic lesions: characterization by using timing bolus dynamic contrast-enhanced MR imaging assessment--a preliminary study. Radiology 2013;266:185-196
8. Paspulati RM. Multidetector CT of the pancreas. Radiol Clin North Am 2005;43:999-1020, viii

520
Choi et al.
Korean J Radiol 17(4), Jul/Aug 2016 kjronline.org
9. Tempero MA, Arnoletti JP, Behrman SW, Ben-Josef E, Benson AB 3rd, Casper ES, et al. Pancreatic Adenocarcinoma, version 2.2012: featured updates to the NCCN Guidelines. J Natl Compr Canc Netw 2012;10:703-713
10. Yoon SH, Lee JM, Cho JY, Lee KB, Kim JE, Moon SK, et al. Small (≤ 20 mm) pancreatic adenocarcinomas: analysis of enhancement patterns and secondary signs with multiphasic multidetector CT. Radiology 2011;259:442-452
11. Blouhos K, Boulas KA, Tselios DG, Katsaouni SP, Mauroeidi B, Hatzigeorgiadis A. Surgically proved visually isoattenuating pancreatic adenocarcinoma undetected in both dynamic CT and MRI. Was blind pancreaticoduodenectomy justified? Int J Surg Case Rep 2013;4:466-469
12. Kim JH, Park SH, Yu ES, Kim MH, Kim J, Byun JH, et al. Visually isoattenuating pancreatic adenocarcinoma at dynamic-enhanced CT: frequency, clinical and pathologic characteristics, and diagnosis at imaging examinations. Radiology 2010;257:87-96
13. Kang KM, Lee JM, Yoon JH, Kiefer B, Han JK, Choi BI. Intravoxel incoherent motion diffusion-weighted MR imaging for characterization of focal pancreatic lesions. Radiology 2014;270:444-453
14. Yu MH, Lee JY, Kim MA, Kim SH, Lee JM, Han JK, et al. MR imaging features of small solid pseudopapillary tumors: retrospective differentiation from other small solid pancreatic tumors. AJR Am J Roentgenol 2010;195:1324-1332
15. Jang KM, Kim SH, Kim YK, Park MJ, Lee MH, Hwang J, et al. Imaging features of small (≤ 3 cm) pancreatic solid tumors on gadoxetic-acid-enhanced MR imaging and diffusion-weighted imaging: an initial experience. Magn Reson Imaging 2012;30:916-925
16. Hur BY, Lee JM, Lee JE, Park JY, Kim SJ, Joo I, et al. Magnetic resonance imaging findings of the mass-forming type of autoimmune pancreatitis: comparison with pancreatic adenocarcinoma. J Magn Reson Imaging 2012;36:188-197
17. Rao SX, Zeng MS, Cheng WZ, Yao XZ, Jin DY, Ji Y. Small solid tumors (< or = 2 cm) of the pancreas: relative accuracy and differentiation of CT and MR imaging. Hepatogastroenterology 2011;58:996-1001
18. Otsuki M, Chung JB, Okazaki K, Kim MH, Kamisawa T, Kawa S, et al. Asian diagnostic criteria for autoimmune pancreatitis: consensus of the Japan-Korea Symposium on Autoimmune Pancreatitis. J Gastroenterol 2008;43:403-408
19. Baek JH, Lee JM, Kim SH, Kim SJ, Kim SH, Lee JY, et al. Small (<or=3 cm) solid pseudopapillary tumors of the pancreas at multiphasic multidetector CT. Radiology 2010;257:97-106
20. Lu DS, Vedantham S, Krasny RM, Kadell B, Berger WL, Reber HA. Two-phase helical CT for pancreatic tumors: pancreatic versus hepatic phase enhancement of tumor, pancreas, and vascular structures. Radiology 1996;199:697-701
21. Haradome H, Grazioli L, Tsunoo M, Tinti R, Frittoli B, Gambarini S, et al. Can MR fluoroscopic triggering technique and slow rate injection provide appropriate arterial phase images with reducing artifacts on gadoxetic acid-DTPA (Gd-EOB-DTPA)-enhanced hepatic MR imaging? J Magn Reson
Imaging 2010;32:334-34022. Hussain HK, Londy FJ, Francis IR, Nghiem HV, Weadock WJ,
Gebremariam A, et al. Hepatic arterial phase MR imaging with automated bolus-detection three-dimensional fast gradient-recalled-echo sequence: comparison with test-bolus method. Radiology 2003;226:558-566
23. Park SH, Goo JM, Jo CH. Receiver operating characteristic (ROC) curve: practical review for radiologists. Korean J Radiol 2004;5:11-18
24. Kim SY, Park SH, Hong N, Kim JH, Hong SM. Primary solid pancreatic tumors: recent imaging findings updates with pathology correlation. Abdom Imaging 2013;38:1091-1105
25. Sahani DV, Shah ZK, Catalano OA, Boland GW, Brugge WR. Radiology of pancreatic adenocarcinoma: current status of imaging. J Gastroenterol Hepatol 2008;23:23-33
26. Rha SE, Jung SE, Lee KH, Ku YM, Byun JY, Lee JM. CT and MR imaging findings of endocrine tumor of the pancreas according to WHO classification. Eur J Radiol 2007;62:371-377
27. Ganeshan DM, Paulson E, Tamm EP, Taggart MW, Balachandran A, Bhosale P. Solid pseudo-papillary tumors of the pancreas: current update. Abdom Imaging 2013;38:1373-1382
28. Ferrozzi F, Bova D, Campodonico F, Chiara FD, Passari A, Bassi P. Pancreatic metastases: CT assessment. Eur Radiol 1997;7:241-245
29. Klein KA, Stephens DH, Welch TJ. CT characteristics of metastatic disease of the pancreas. Radiographics 1998;18:369-378
30. Ng CS, Loyer EM, Iyer RB, David CL, DuBrow RA, Charnsangavej C. Metastases to the pancreas from renal cell carcinoma: findings on three-phase contrast-enhanced helical CT. AJR Am J Roentgenol 1999;172:1555-1559
31. Palmowski M, Hacke N, Satzl S, Klauss M, Wente MN, Neukamm M, et al. Metastasis to the pancreas: characterization by morphology and contrast enhancement features on CT and MRI. Pancreatology 2008;8:199-203
32. Lee JH, Byun JH, Kim JH, Lee SS, Kim HJ, Lee MG. Solid pancreatic tumors with unilocular cyst-like appearance on CT: differentiation from unilocular cystic tumors using CT. Korean J Radiol 2014;15:704-711
33. Rosenkrantz AB, Lee L, Matza BW, Kim S. Infiltrative hepatocellular carcinoma: comparison of MRI sequences for lesion conspicuity. Clin Radiol 2012;67:e105-e111
34. Miller FH, Rini NJ, Keppke AL. MRI of adenocarcinoma of the pancreas. AJR Am J Roentgenol 2006;187:W365-W374
35. Takakura K, Sumiyama K, Munakata K, Ashida H, Arihiro S, Kakutani H, et al. Clinical usefulness of diffusion-weighted MR imaging for detection of pancreatic cancer: comparison with enhanced multidetector-row CT. Abdom Imaging 2011;36:457-462
36. Park HS, Lee JM, Choi HK, Hong SH, Han JK, Choi BI. Preoperative evaluation of pancreatic cancer: comparison of gadolinium-enhanced dynamic MRI with MR cholangiopancreatography versus MDCT. J Magn Reson Imaging 2009;30:586-595
37. Vachiranubhap B, Kim YH, Balci NC, Semelka RC. Magnetic resonance imaging of adenocarcinoma of the pancreas. Top

521
Comparison of CT and MRI for Evaluation of Small, Solid Pancreatic Lesions
Korean J Radiol 17(4), Jul/Aug 2016kjronline.org
Magn Reson Imaging 2009;20:3-938. Ichikawa T, Erturk SM, Motosugi U, Sou H, Iino H, Araki T,
et al. High-b value diffusion-weighted MRI for detecting pancreatic adenocarcinoma: preliminary results. AJR Am J Roentgenol 2007;188:409-414
39. Prokesch RW, Chow LC, Beaulieu CF, Bammer R, Jeffrey RB Jr. Isoattenuating pancreatic adenocarcinoma at multi-detector row CT: secondary signs. Radiology 2002;224:764-768
40. Ishigami K, Yoshimitsu K, Irie H, Tajima T, Asayama Y, Nishie A, et al. Diagnostic value of the delayed phase image for iso-attenuating pancreatic carcinomas in the pancreatic parenchymal phase on multidetector computed tomography. Eur J Radiol 2009;69:139-146
41. Zamboni GA, Bernardin L, Pozzi Mucelli R. Dynamic MDCT of the pancreas: is time-density curve morphology useful for the differential diagnosis of solid lesions? A preliminary report. Eur J Radiol 2012;81:e381-e385
42. Kitano M, Kudo M, Yamao K, Takagi T, Sakamoto H, Komaki T, et al. Characterization of small solid tumors in the pancreas: the value of contrast-enhanced harmonic endoscopic
ultrasonography. Am J Gastroenterol 2012;107:303-31043. Park HS, Lee JM, Choi JY, Lee MW, Kim HJ, Han JK, et al.
Preoperative evaluation of bile duct cancer: MRI combined with MR cholangiopancreatography versus MDCT with direct cholangiography. AJR Am J Roentgenol 2008;190:396-405
44. Sainani NI, Saokar A, Deshpande V, Fernández-del Castillo C, Hahn P, Sahani DV. Comparative performance of MDCT and MRI with MR cholangiopancreatography in characterizing small pancreatic cysts. AJR Am J Roentgenol 2009;193:722-731
45. Schmid-Tannwald C, Oto A, Reiser MF, Zech CJ. Diffusion-weighted MRI of the abdomen: current value in clinical routine. J Magn Reson Imaging 2013;37:35-47
46. Matsuki M, Inada Y, Nakai G, Tatsugami F, Tanikake M, Narabayashi I, et al. Diffusion-weighed MR imaging of pancreatic carcinoma. Abdom Imaging 2007;32:481-483
47. Kim H, Lee JM, Yoon JH, Jang JY, Kim SW, Ryu JK, et al. Reduced field-of-view diffusion-weighted magnetic resonance imaging of the pancreas: comparison with conventional single-shot echo-planar imaging. Korean J Radiol 2015;16:1216-1225
Top Related