


Languages
Pages
Legal


A P S T A T I S T I C S
C H A P T E R 2 5
Comparing Counts:Chi-Square Goodness-of-Fit Test
1
Most real life statistical problems have one or more nonstandard features. There are no routine statistical questions; only questionable statistical routines.
David R. Cox (1924 - )
Down and Dirty2
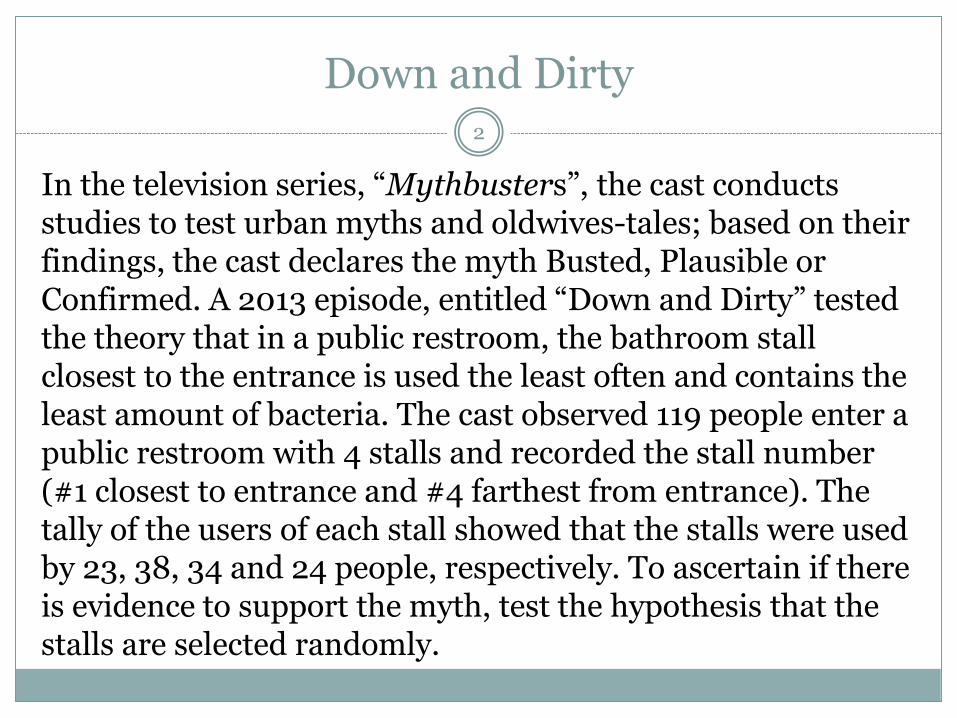
In the television series, “Mythbusters”, the cast conducts studies to test urban myths and oldwives-tales; based on their findings, the cast declares the myth Busted, Plausible or Confirmed. A 2013 episode, entitled “Down and Dirty” tested the theory that in a public restroom, the bathroom stall closest to the entrance is used the least often and contains the least amount of bacteria. The cast observed 119 people enter a public restroom with 4 stalls and recorded the stall number (#1 closest to entrance and #4 farthest from entrance). The tally of the users of each stall showed that the stalls were used by 23, 38, 34 and 24 people, respectively. To ascertain if there is evidence to support the myth, test the hypothesis that the stalls are selected randomly.
Down and Dirty3
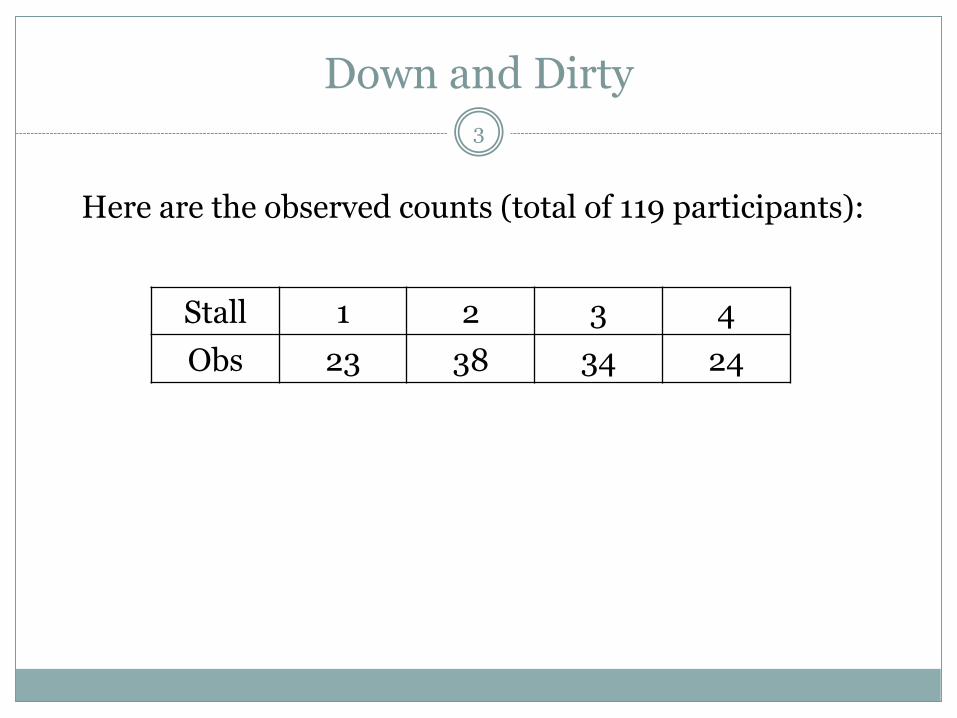
Here are the observed counts (total of 119 participants):
Stall 1 2 3 4
Obs 23 38 34 24
Chi-Square Distribution4
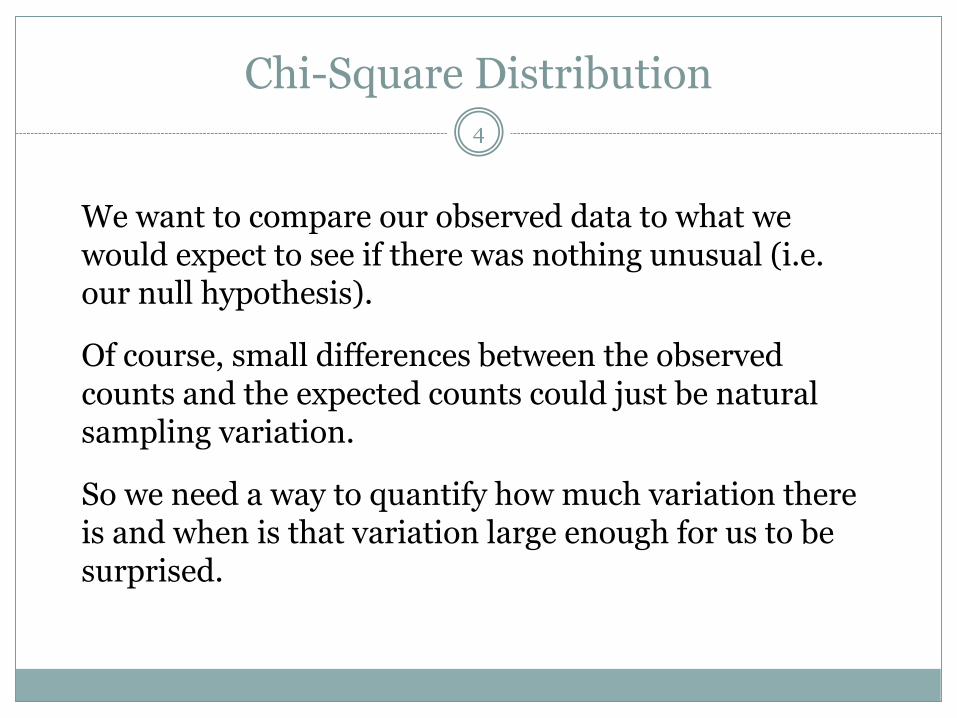
We want to compare our observed data to what we would expect to see if there was nothing unusual (i.e. our null hypothesis).
Of course, small differences between the observed counts and the expected counts could just be natural sampling variation.
So we need a way to quantify how much variation there is and when is that variation large enough for us to be surprised.
Chi-Square Distribution5
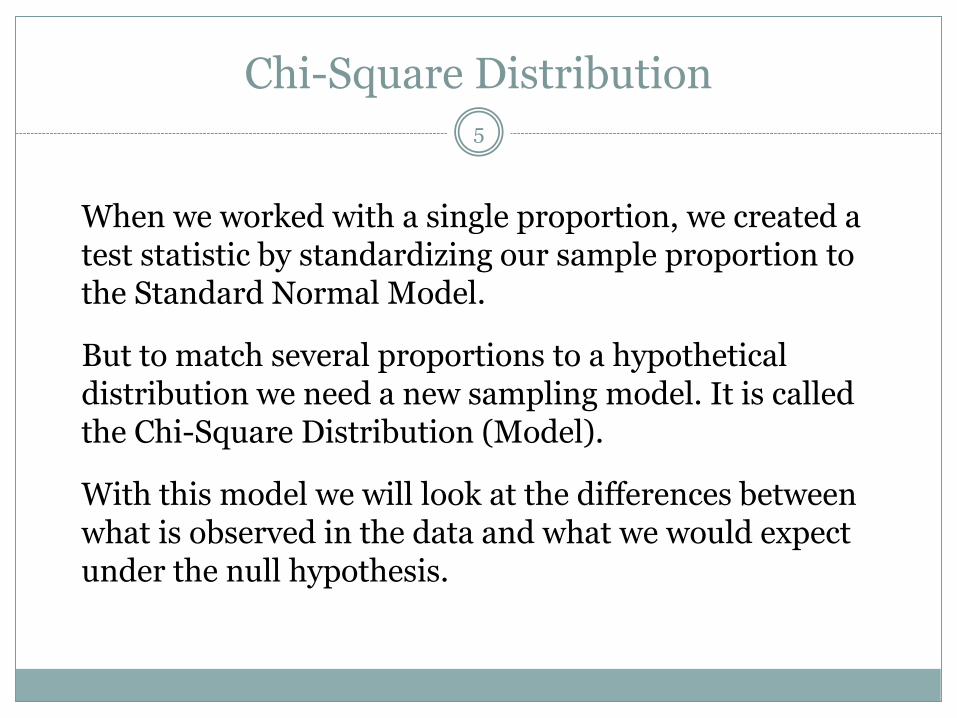
When we worked with a single proportion, we created a test statistic by standardizing our sample proportion to the Standard Normal Model.
But to match several proportions to a hypothetical distribution we need a new sampling model. It is called the Chi-Square Distribution (Model).
With this model we will look at the differences between what is observed in the data and what we would expect under the null hypothesis.

Chi-Square Distribution6
All chi-square distributions are skewed to the right and described by one number: the degrees of freedom

Chi-Square Goodness-of-Fit Test (GOF) 7
Purpose of GOF
Used to compare the distribution of a single categorical variable to a hypothesized distribution.
Model Conditions
1. Randomness2. Independence3. Sample large enough to use appropriate model
(most expected counts > 5)
Test Statistic
2
2Obs Exp
Exp
Degrees of Freedom
are # categories - 1
Chi-Square Goodness-of-Fit Test (GOF) 8
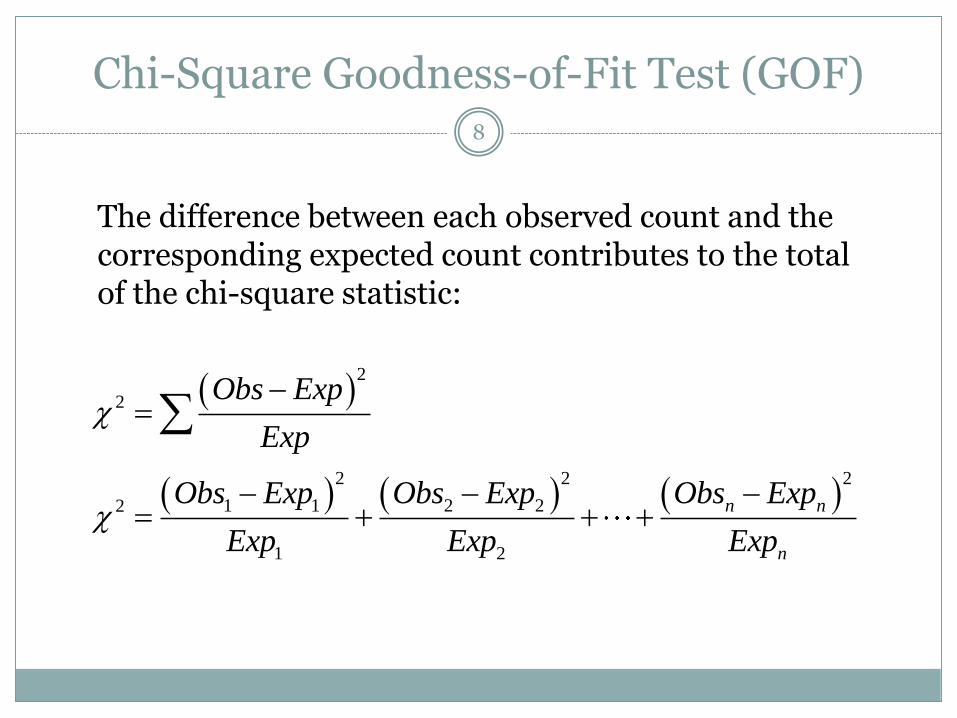
The difference between each observed count and the corresponding expected count contributes to the total of the chi-square statistic:
2
2
2 2 2
1 1 2 22
1 2
n n
n
Obs Exp
Exp
Obs Exp Obs Exp Obs Exp
Exp Exp Exp
Chi-Square Goodness-of-Fit Test (GOF) 9
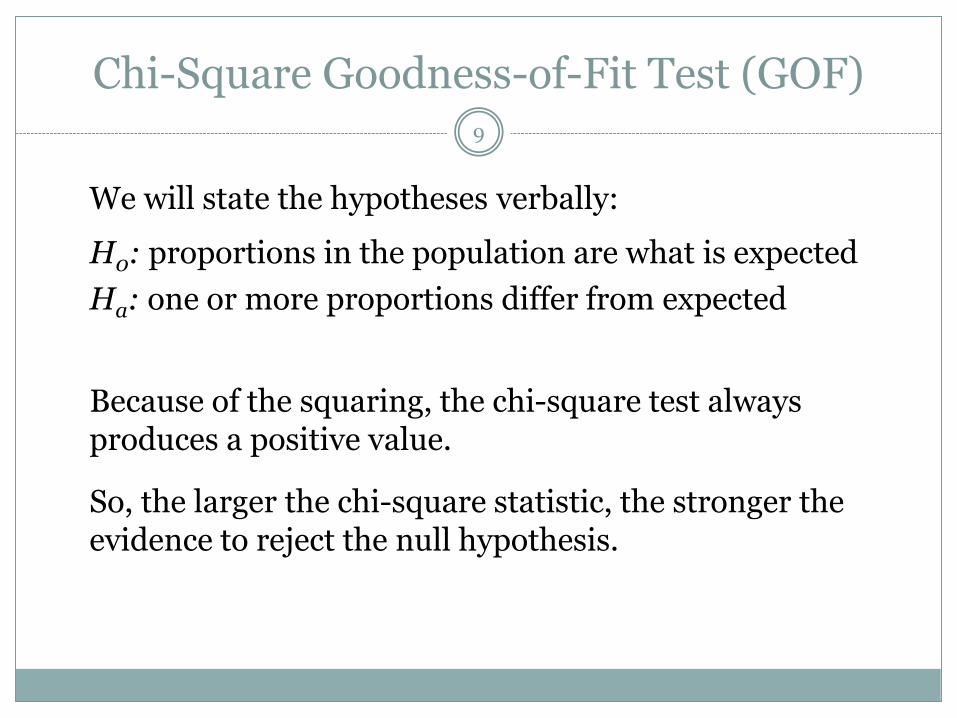
We will state the hypotheses verbally:
H0: proportions in the population are what is expected
Ha: one or more proportions differ from expected
Because of the squaring, the chi-square test always produces a positive value.
So, the larger the chi-square statistic, the stronger the evidence to reject the null hypothesis.
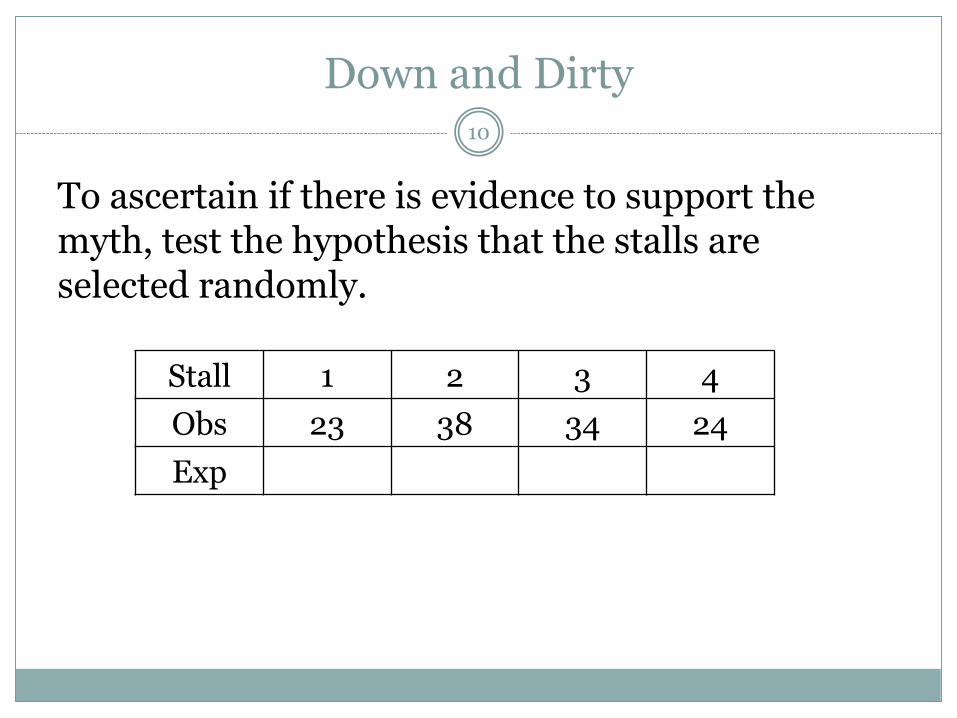
Down and Dirty10
To ascertain if there is evidence to support the myth, test the hypothesis that the stalls are selected randomly.
Stall 1 2 3 4
Obs 23 38 34 24
Exp

Down and Dirty11
Observed Expected Residuals Standardized
residuals
23 29.75 -6.75 -1.237543
38 29.75 8.25 1.5125525
34 29.75 4.25 0.77919372
24 29.75 -5.75 -1.0542033
N DF Chi-Square P-value
119 3 5.5378151 0.1364
Chi-Square goodness-of-fit
results:
Observed: Obs
Expected: Exp

The Common Core12
The vast majority of states and the District of Columbia
have adopted the Common Core State Standards
(CCSS) for math and English language arts. Do teachers
support the CCSS? In March 2003, The American
Federation of Teachers (AFT) asked AFT member
teachers “Based on what you know about the Common
Core State Standards and the expectations they set for
children, do you approve or disapprove of your state’s
decision to adopt them?”

The Common Core13
The national results were:
• Strongly approve 27%
• Somewhat approve 48%
• Somewhat disapprove 14%
• Strongly disapprove 8%
• Not sure 3%

The Common Core14
A district superintendent asked the same question to 230 teachers in her district to assess the level of teacher support for the CCSS within the district. She obtained the following results.
Response Stronglyapprove
Somewhatapprove
Somewhat disapprove
Stronglydisapprove
Not sure
Observed 55 106 28 32 9
Is there evidence that teachers in this district match the national approval distribution?
Assignment15
Read Chap 25
Chap 25 #3-13 odd
John Landers (www.landers.co.uk)
Top Related