


Languages
Pages
Legal

COMP 145 Project Presentation
Eric Baker, Mave Houston
Benjamin Lok, Adam Seeger, Andy Wilson
T hunderR econstructionE mployed inM appingB ranchedL ightningE vents
Introduction
• Overview of Project
• Motivation
• Major Problems
• Conclusion
Overview of Project
• Visualize a lightning storm in the Chapel Hill area (est. 10 mile radius)
• During a storm:– Record Thunder Sounds– Analyze Sounds
• Either real-time or at a later date:– Visualize the storm
How It Works
• Three Microphones in a calibrated array sit atop Sitterson Hall
• A computer, with an attached lightning detector, will record microphone input
• After analyzing the recorded sounds, the lightning position, orientation and structure may be determined
• Rendered in a visualization system
Motivation
• The study of the structure of lightning channels is of interest to:– meteorologists– physicists– weather enthusiasts– Dr. Lars Nyland (client)
Software Issues
• Separate the system into self-contained modules– Data Acquisition– Analyzer– Visualization– Remote User Interfaces– Allowed development in parallel
• Distributed system
Software Issues
• Analysis of Sound Files– adequate simulation and test data
• Ease of use– Start system via Web Interface– Portability
• Visualization of a 4D dataset• Multiple data sources• Module integration
Hardware Issues
• Budget– One tenth the budget of others who have built
similar systems– University red tape
• Identifying and Obtaining Hardware– Weatherproof microphones, preamps,
multiple input sound cards, cables, computers, rooms, etc.
• System Integration
Final Goal
• Final system will feature:– Remote access– VCR-style interface to recording and
analysis of storms– Real-time or replayed visualization of
storms with overlaid information– Cool gee whiz effects
• Thanks for images from: Dave “Stormguy” Crowley. http://www.stormguy.com
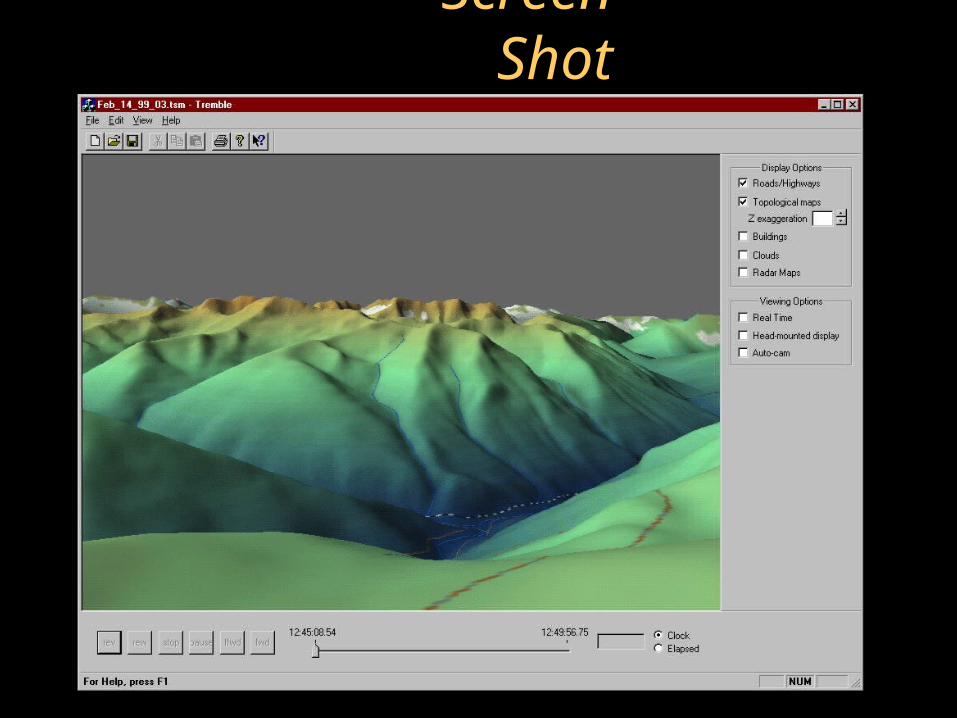
Screen Shot
Top Related