


Languages
Pages
Legal


0101Co
mm
un
ity
pr
ofi
leEl
emen
t
Co
mm
un
ity
Pr
ofi
leEl
emen
t

COMMUNITY PROFILE
Introduction
Topics discussed in each of the individual chapters of the Comprehensive Plan are interconnected. As a result, transportation conditions in the future will be affected by policy recommendations located in other chapters of the Comprehensive Plan. Of these, the Land Use Chapter will have a particularly strong impact on transportation. Through its placement of commercial centers and residential areas, the Future Land Use Map will help determine the county’s future spatial pattern, which in turn will affect things like road connectivity. Furthermore, the density of those developments will help determine the future viability of other modes of transportation, such as bus and rail.
As the designated Metropolitan Planning Organization (MPO) for the Savannah Metro area, the Coastal Region MPO (CORE MPO) has prepared an update of its Metropolitan Transportation plan (MTP). By Federal statute (23 CFR Part 450), transportation planning processes must be organized and directed by MPOs for all urbanized areas with a population of at least 50,000 as defined by the US Census Bureau. MPOs oversee the transportation planning processes for the urbanized area, as well as the area expected to become urbanized in the next 20 years.
COMMUNITY PROFILE
Introduction
Chatham County was established in 1777 as one of the original counties of Georgia. It is the most urbanized county in the 200-mile coastal area between Charleston, South Carolina and Jacksonville, Florida, and the most populous county in Georgia outside the Atlanta region. The county serves as an economic, cultural, and governmental hub for a six county, bi-state region, as well as an international focal point for trade.
Chatham County has grown considerably since the start of the 20th Century. With one exception, the county’s rate of population growth has remained above 5% in each decennial Census since 1900. This stability has insulated the area from the perils of “boom and bust” development that have adversely affected long-term planning efforts in many other communities. Chatham County has a long tradition of planning, and the community intends to maintain its historic character and natural resources while welcoming new residents, many of whom become the strongest advocates of local planning.

PLAN 204046
17 00
17 30
17 60
17 90
1777
1775
1861
AmericanCivil War
1733
Union General William Sherman occupied Savannah on his
"March to the Sea"
1865
Georgia became a royal colony
1754
British forces captured Savannah17
78
18 20
18 50
American Revolution
Declaration of Independence
1776
Eman
cipa
tion
Pr
ocla
mat
ion
1863
1758
Royal Governor Henry Ellis signs an act
dividing the colony into 8 parishes
Chatham County was formed out of Christ Church Parish and St. Phillip Parish in 1777
Treaty of Savannah, ceded land to the English by the
Creeks
1859
The "Weeping Time", the largest recorded auction of enslaved
people in U.S. history
Beach Institute Established
1867
CHATHAM COUNTY & SAVANNAH HISTORY

PLAN 2040 47Community Profile
WWI 1917
18 80
19 10
WWII
Savannah's Historic District was designated a National Historic Landmark in 1966
1966
19 40
19 70
20 00
20 30
1929
The Great Depression
1941
September11th
1920
19th Amendment
1964
2001
2020 Covid-19
Juliette Gordon Low establishes the nation's first Girl Scout troop in Savannah
1912
1886
Telfair Academy of Arts and Sciences opens
Savannah College of Art and Design founded
1978

PLAN 204048
Chatham
Bryan
Effingham
Savannah MSAChatham County is the largest county in the Savannah Metropolitan Statistical Area (MSA), which also includes Bryan and Effingham counties. The Savannah MSA, together with Bulloch, Liberty, Long, and Wayne counties, comprises the larger Savannah–Hinesville–Statesboro Combined Statistical Area (CSA). The Savannah–Hinesville–Statesboro CSA is bordered by the Hilton Head Island–Bluffton MSA to the north and the Brunswick MSA to the south.
Throughout the past 100 years, the population of the region has grown as a result of several technological advances. The invention of air conditioning and widespread mosquito control practices were precursors to expansive development in the Savannah area and across much of the Southeast. These technologies made life in the region far more comfortable, convenient, and safe. Alongside these advances that improved the quality of life in Savannah, the area’s economy has grown to serve regional, national, and international markets in a variety of sectors. Today, the Port of Savannah is the fourth busiest container port in the country, behind only Los Angeles, CA, Long Beach, CA, and New York, NY.
Historically, Chatham County and the city of Savannah have served as the region’s largest population center, commercial core, and industrial hub. While this remains true today, suburbanization has led to significant population increases in Effingham and Bryan counties over the past 50 years. A growing network of highways and relatively inexpensive land have accelerated this move away from the denser urban core, a trend that is projected to continue in the coming decades.
METROPOLITAN STATISTICAL AREA (MSA)
A metropolitan statistical area is a region consisting of a city and
surrounding communities that are linked by social and economic
factors, as established by the U.S. Office of Management and
Budget (OMB).
Figure 1.1–Savannah MSA
REGIONAL POPULATION
PLAN 2040 49Community Profile
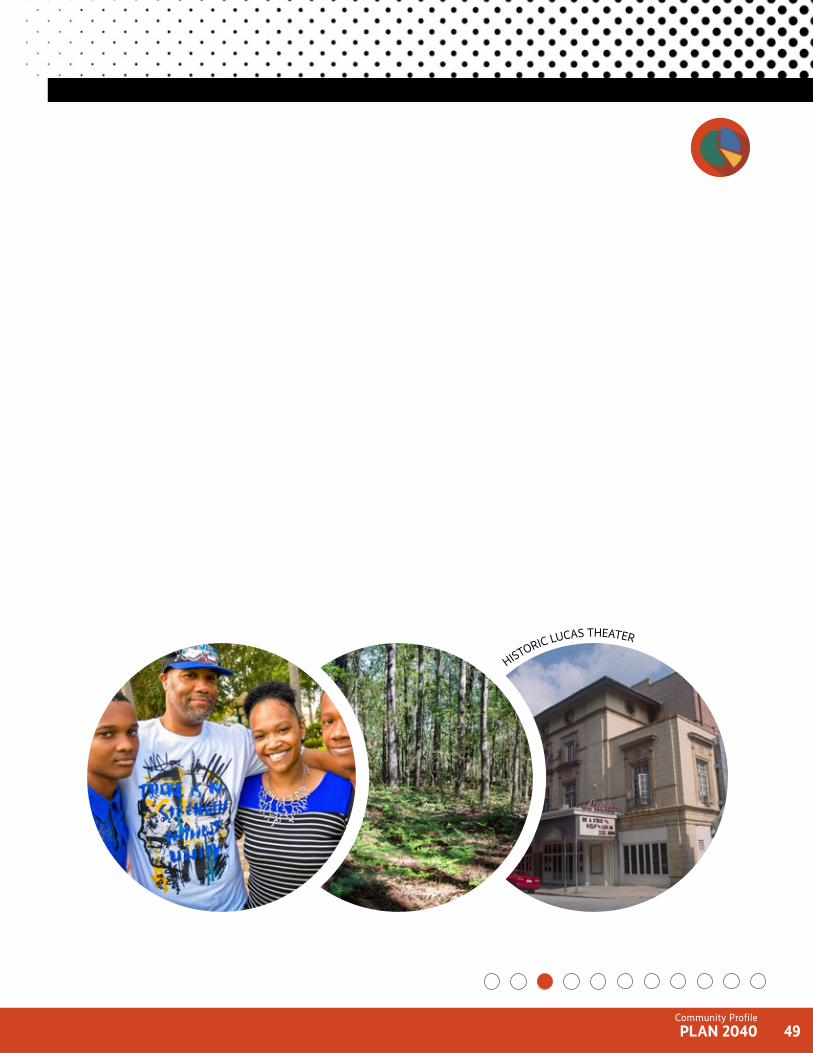
HISTORIC LUCAS THEATER

PLAN 204050
EFFINGHAM COUNTY
BRYAN COUNTY
CHATHAM COUNTY
335,211
290,550
103,498
65,869
61,80840,443
Population GrowthFigure 1.2 illustrates the historical population growth and future projections for each county in the Savannah MSA. While Chatham County is expected to retain its status as the largest population center in the metropolitan area, its neighboring counties are forecasted to experience a greater rate of growth in the coming years.
By 2040, the population of Chatham County is predicted to be approximately 335,000 residents and the population of the Savannah MSA is predicted to be approximately 500,000.
This equates to a population increase of approximately 15.5% in Chatham County over the next 20 years and an increase of approximately 27% in the Savannah MSA.
The population data presented here is from the U.S. Census Bureau’s American Community Survey (ACS) multiyear estimates covering the 2014–2018 period and was the most current publicly available ACS multiyear data at the time of reporting. Updated 2020 Census population data can be found on page 88.
These population projections were prepared by the Georgia Governor’s Office of Planning and Budget (OPB) using a standard cohort component demographic methodology. This approach models population change as a function of initial population estimates broken down by age and sex, fertility, mortality, and migration."By 2040, the population of Chatham By 2040, the population of Chatham
County is expected to grow 15.5% to County is expected to grow 15.5% to 335,000 residents335,000 residents
100K
0
50K
200K
150K
300K
250K
400K
350K
2020 2030 20401900
Figure 1.2–Savannah MSA Population Projection
Popu
lati
on
U.S. Census Bureau: 2018 American Community Survey 5-Year Estimates
Population Projection, 1900–2040
PLAN 2040 51Community Profile
The net effect of regional development on the population of Chatham County and the city of Savannah can be considered in broad categories:
THE SERVICE ECONOMY
» The manufacturing economy that drove early regional growth has been surpassed by the service economy. The service economy includes health and medical facilities, retail, hospitality, and business services such as insurance, banking, and advertising.
TRANSIENT POPULATION
» A significant share of the population within Chatham County at any given time is not included in official population counts. This transient population includes workers who live outside of Chatham County but commute in for work; second-home owners who spend only part of the year in the county; students at local universities; military personnel who are stationed in the region temporarily; and tourists visiting the area.
GEOGRAPHIC MOBILITY
» Nearly one in ten residents of Chatham County have moved here within the past year from other counties, states, and countries. Many of these individuals are retirees who have settled in unincorporated areas of the county and tend to be older and more affluent than the average county resident. This is evident when comparing the median age, income, and poverty rates between unincorporated Chatham and the city of Savannah.

PLAN 204052
The RegionChatham County encompasses eight incorporated municipalities—the cities of Bloomingdale, Garden City, Pooler, Port Wentworth, Savannah, and Tybee Island, and the towns of Thunderbolt and Vernonburg—and a large unincorporated area. The geographic focus of this section of Plan 2040 is unincorporated Chatham County and the city of Savannah.
Residential PopulationAs of 2020, unincorporated Chatham County had an estimated population of 92,034, with a population density of 281 people per square mile. U.S. Census records show population in the unincorporated area decreased from 1970–1980 but has grown significantly in the past 40 years. In fact, much of the county’s overall population increase in that time period occurred in the unincorporated areas to the east and southwest of Savannah as larger neighborhoods and subdivisions were developed. Estimates for unincorporated Chatham County were calculated by subtracting the sum of the incorporated municipalities’ values from the total value for Chatham County as a whole.
The city of Savannah had an estimated population of 147,780 in 2020, with a population density of 1,302 people per square mile. The city’s population increased rapidly from 1970–1980 but has remained fairly stable in the last 40 years.
As of 2020, the unincorporated areas and As of 2020, the unincorporated areas and the city of Savannah made up 83.1% of the the city of Savannah made up 83.1% of the total population of Chatham County.total population of Chatham County.
Tourism Impacts on PopulationBecause Chatham County is a well-known tourist destination, a substantial proportion of the population on any given day is only temporary. According to the Savannah Area Chamber of Commerce’s Savannah Economic Trends Brochure (2020), the area saw 14.5 million visitors in 2018 alone. While tourism brings many benefits to the local economy and culture, such large day-to-day population increases can also present challenges from a planning perspective, particularly those related to infrastructure. When planning for the future, it is important to consider the “worst case scenario” to ensure that the community's roads, bridges, and utility systems will remain functional.
Demographic CharacteristicsUnincorporated Chatham County and the city of Savannah are growing—between 2010 and 2020, their populations grew by 7.0% and 6.6%, respectively. Both experienced faster population growth than that of Georgia as a whole. While notable demographic differences exist between the residents of unincorporated Chatham County and Savannah today, the composition of the community's population will continue to change as new residents move into the area.
CHATHAM COUNTY & SAVANNAH

PLAN 2040 53Community Profile
Years
THUNDERBOLT
VERNONBURG
TYBEE ISLAND
BLOOMINGDALE
PORT WENTWORTH
GARDEN CITY
POOLER
UNINCORPORATED CHATHAM COUNTY
SAVANNAH
Unincorporated Chatham County
Savannah
0
30K
60K
90K
120K
140K
Popu
lati
on
1980 1990 2000 20101970
Figure 1.3–Population Comparison, 1970–2020, Unincorporated Chatham County & Savannah
2020
U.S. Census Bureau: 2018 American Community Survey 5-Year Estimates
Population Growth Comparison, 1970–2020

PLAN 204054
22%17.8%
60.2%
20.8%12.9%
66.3%
48,347
(51.9%)
44,807
(48.1%)
Males Females
76,159
(52.4%)
69,182
(47.6%)
Males Females
Sex & AgeOf the 93,155 people living in unincorporated Chatham County in 2014–2018, 51.9% were female and 48.1% were male. In Savannah, 52.4% of the 145,342 residents were female and 47.6% were male.
Overall, county residents were significantly older than those in the city—the median age in the unincorporated area was 39.6 years compared with 32.4 years in Savannah. Children under the age of 18 made up 22.0% of the population in unincorporated Chatham County, and 17.8% were 65 years or older. In Savannah, roughly one fifth of residents were under the age of 18 (20.8%) and nearly one in eight were over age 65 (12.9%).
The population in both areas has been slowly growing older over the past five years. This trend is projected to continue for at least the next 20 years and should be planned for at the local level as the aging population lives longer and more retirees move to the coast.
Sex Characteristics, 2014–2018
Unincorporated Chatham:
City of Savannah:
Figure 1.5–Age Distribution, SavannahFigure 1.4–Age Distribution, Unincorporated Chatham
Age Distribution, 2014–2018
Under 18
18-64
65 & OlderUnder 18
18-64
65 & Older
U.S. Census Bureau: 2018 American Community Survey 5-Year Estimates

PLAN 2040 55Community Profile
0 1,000 2,0000
5–9
UNDER 5
3,000
Unincorporated Chatham City of Savannah
Median Age Median Age32.439.6
4,000 5,000 6,000 7,000 8,0007,000 6,000 5,000 4,000 3,000 2,000 1,0008,000
10–14
15–19
20–24
25–29
30–34
35–39
40–44
45–49
50–54
55–59
60–64
65–69
70–74
75–79
80–84
85+
0 500 1,0000 1,500 2,000 2,500 3,000 3,500 4,0003,500 3,000 2,500 2,000 1,500 1,000 5004,000
MALE
FEMALE
5–9
UNDER 5
10–14
15–19
20–24
25–29
30–34
35–39
40–44
45–49
50–54
55–59
60–64
65–69
70–74
75–79
80–84
85+
Age
Age
Age Characteristics, 2014–2018
Figure 1.7–Population Pyramid, Savannah
Figure 1.6–Population Pyramid, Unincorporated Chatham
U.S. Census Bureau: 2018 American Community Survey 5-Year Estimates
PLAN 204056
Black or African American Alone
69.3%White Alone
54.4%
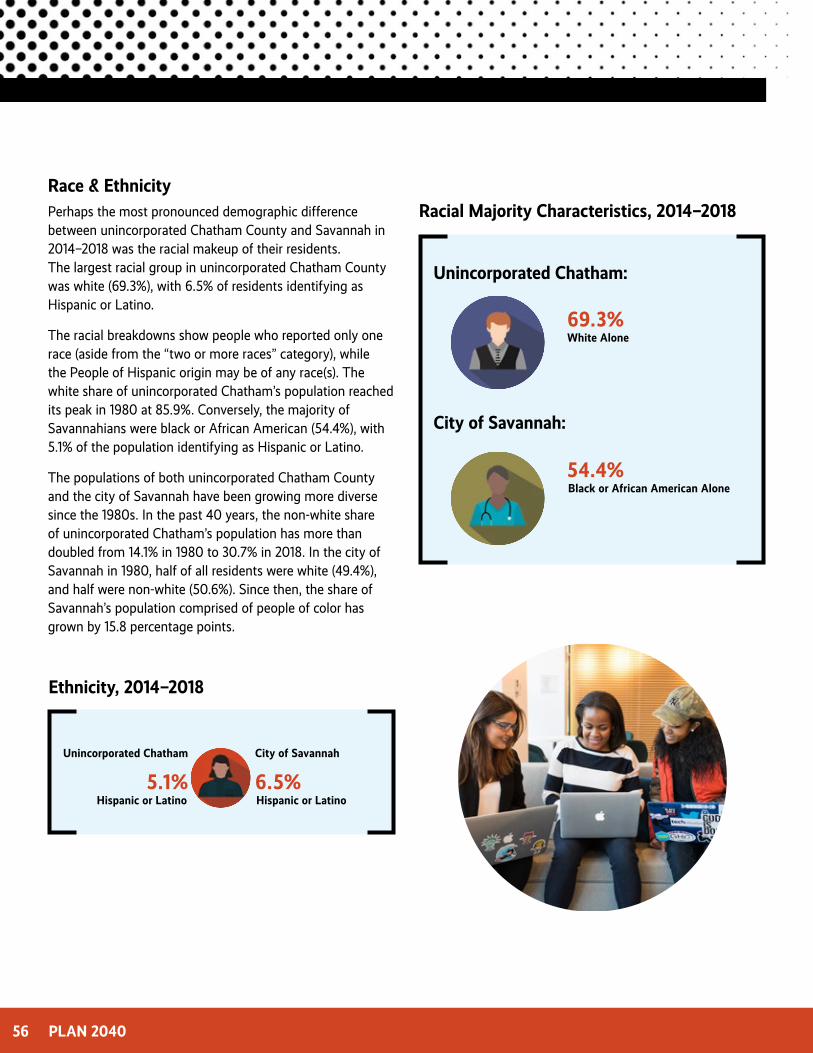
Race & EthnicityPerhaps the most pronounced demographic difference between unincorporated Chatham County and Savannah in 2014–2018 was the racial makeup of their residents. The largest racial group in unincorporated Chatham County was white (69.3%), with 6.5% of residents identifying as Hispanic or Latino.
The racial breakdowns show people who reported only one race (aside from the “two or more races” category), while the People of Hispanic origin may be of any race(s). The white share of unincorporated Chatham’s population reached its peak in 1980 at 85.9%. Conversely, the majority of Savannahians were black or African American (54.4%), with 5.1% of the population identifying as Hispanic or Latino.
The populations of both unincorporated Chatham County and the city of Savannah have been growing more diverse since the 1980s. In the past 40 years, the non-white share of unincorporated Chatham’s population has more than doubled from 14.1% in 1980 to 30.7% in 2018. In the city of Savannah in 1980, half of all residents were white (49.4%), and half were non-white (50.6%). Since then, the share of Savannah’s population comprised of people of color has grown by 15.8 percentage points.
Racial Majority Characteristics, 2014–2018
City of Savannah:
Unincorporated Chatham:
Unincorporated Chatham City of Savannah
Hispanic or Latino Hispanic or Latino6.5%5.1%
Ethnicity, 2014–2018

PLAN 2040 57Community Profile
3%
23%
69%
54%
39%
2% 3%2%
2% 3%
Population by Race, 2014–2018
Figure 1.9–Population by Race, SavannahFigure 1.8–Population by Race, Unincorporated Chatham
White Alone
Asian Alone
Some other race alone
Two or more races alone
Asian Alone
Some other race alone
Two or more races alone
Black or African American Alone
White Alone
Black or African American Alone
U.S. Census Bureau: 2018 American Community Survey 5-Year Estimates

PLAN 204058
Black White Hispanic
Household Income as Adults $24,000 $47,000 $37,000
Household Income as Adults for
Kids in Low–Income Families$22,000 $33,000 $31,000
Household Income as Adults for
Kids in Middle–Income Families$27,000 $41,000 $36,000
Household Income as Adults for
Kids in High–Income Families$32,000 $52,000 $42,000
Upward Mobility Rate
(Top 20% of Household Income)3.8% 24% 13%
Teenage Birth Rate for Women 15% 52% 40%
Incarceration Rate (Men) 44% 15% 22%
College Graduation Rate 15% 1.9% 4.2%
Hours Worked per Week 16% 44% 36%
Hourly Wage $14 $17 $18
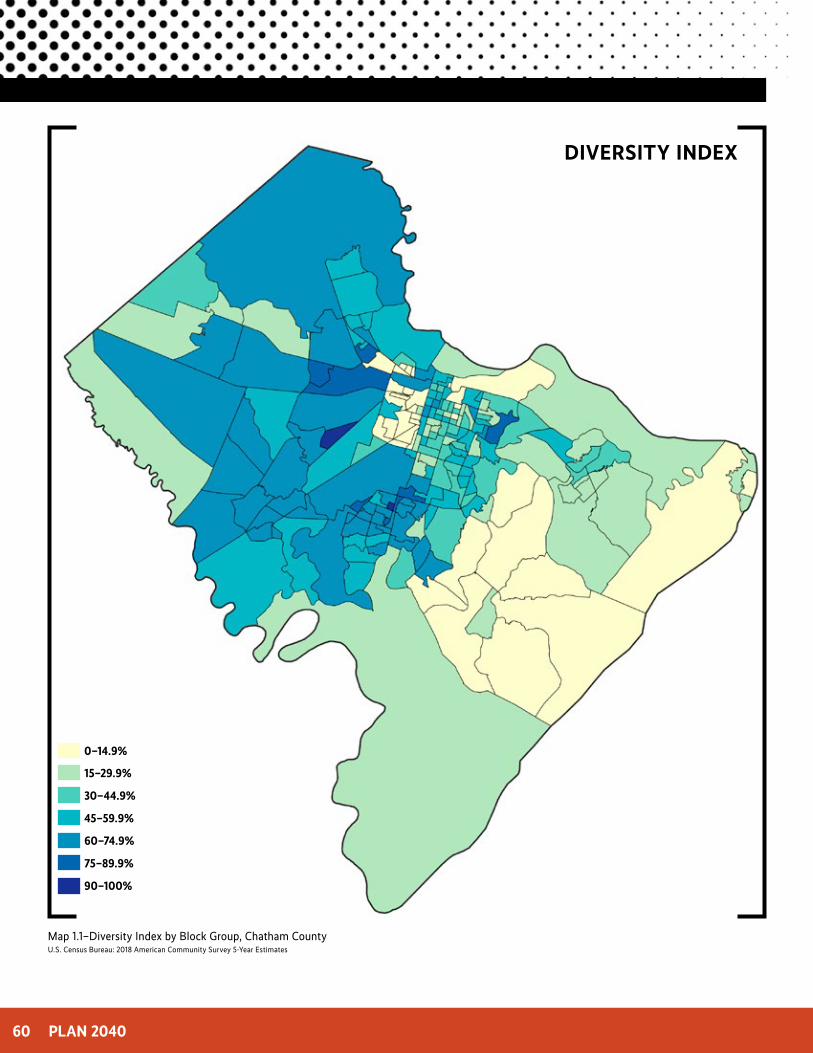
Diversity IndexThe diversity index determines the likelihood that two people chosen at random from a given area will be from different racial or ethnic groups. Higher values indicate more diversity in an area, and lower values indicate less diversity.
On Map 1.1, block groups with high racial and ethnic diversity index scores are shown in shades of blue. These calculations are based on the methodology described in “Mapping the USA’s diversity from 1960 to 2060” in USA TODAY.
Economic MobilityWhile job growth and rising median income are important indicators of a community’s economic health, they do not necessarily translate into economic success for every individual and family who live there. For example, Chatham County as a whole has experienced a higher rate of job growth recently than nearly three-quarters of counties across the country, and median household income has increased roughly $10,000 over the past decade. At the same time, the percentage of residents in poverty has decreased by only three percentage points, and approximately one in six residents still lives below the poverty line today. The recent growth has clearly not translated into economic success for all members of the community. Economic mobility—a child’s chance of moving up the income ladder relative to the household in which they grow up—can offer greater insight into the long-term economic opportunities available in a given community.
In Chatham County, kids raised in low-income households, regardless of race or gender, have only a 4.7% chance of becoming wealthy adults when they grow up. This upward mobility rate ranks among the lowest in the entire U.S. and is lower than any developed country in the world. Children raised in high-income households in the county, on the other hand, are nearly five times more likely to become high-income adults.
While upward mobility for kids raised in low-income households across Chatham County is generally poor, considerable variation exists between neighborhoods within the county as well. Indeed, research has shown that the neighborhood in which a child grows up significantly impacts their ability to climb the income ladder later in life. This means that a child who grows up on a particular block can have a vastly different economic outcome later in life than his/her friend raised in a similar household/socioeconomic circumstances just a few blocks away.
This local variation is illustrated in Map 1.2, which shows the average household income in adulthood of children who grew up in comparable low-income families in different areas across Chatham County. The neighborhoods of Cann-Jackson Park and Chatham Crescent lie on opposite sides of Bull Street in midtown Savannah, yet children raised in similar households within these neighborhoods experience vastly different economic outcomes. A kid born into a low-income family in Chatham Crescent has a 19% chance of becoming a wealthy adult, but if that child were born into a low-income family in Cann-Jackson Park that chance drops to 1.2%.
Figure 1.10–Economic Mobility by Race, Chatham County
Economic Mobility by Race, 2018
U.S. Census Bureau: 2018 American Community Survey 5-Year Estimates

PLAN 2040 59Community Profile
Figure 1.11–Economic Mobility, Chatham CountyU.S. Census Bureau: 2018 American Community Survey 5-Year Estimates
ECONOMIC MOBILITY
PLAN 204060
75–89.9%
90–100%
45–59.9%
60–74.9%
15–29.9%
30–44.9%
0–14.9%
Map 1.1–Diversity Index by Block Group, Chatham County
DIVERSITY INDEX
U.S. Census Bureau: 2018 American Community Survey 5-Year Estimates

PLAN 2040 61Community Profile
< $15,000
$20,000
$35,000
$25,000
$40,000
$30,000
$45,000
> $50,000
ECONOMIC MOBILITY
Map 1.2–Household Income at Age 35 for Children of Low Income Parents by Census Tract, Chatham CountyU.S. Census Bureau: 2018 American Community Survey 5-Year Estimates

PLAN 204062
Years
EmploymentIn 2018, in unincorporated Chatham County, 59.1% of people 16 years and older were employed in the civilian labor force and 1.3% of people were in the armed forces; 35.7% of residents over 16 were not in the labor force. An estimated 81.0% of employed people in unincorporated Chatham County were private wage and salary workers; 14.6% work in federal, state, or local government; and 4.4% were self-employed in their own (not incorporated) business.
In 2018, in the city of Savannah, 56.1% of people 16 years and older were employed in the civilian labor force and 1.3% of people were in the armed forces; 36.3% of residents over 16 were not in the labor force (2014–2018). The largest class of employed people were private wage and salary workers (80.8%); 13.8% worked in federal, state, or local government; and 5.5% were self-employed in their own (not incorporated) business. These values for both the county and the city are generally consistent with the national numbers.
The unemployment rate in Chatham County had been declining steadily from mid-2011 until March 2020, when the economic impacts of the COVID-19 pandemic were felt across the country. In April 2020, the monthly unemployment rate skyrocketed to 16.5%, higher than the rates of both Georgia (12.2%) and the United States (14.8%).
ARE YOU LOOKING FOR MORE INFORMATION?
See the Economic Development
Element for more detailed discussion
on the impacts of the COVID-19
pandemic on area employment.
17.5
1992 1994 1996 1998 2000 2002 2004 2006 2008 2010 2012 2014 2016 2018
15.0
12.5
10.0
7.5
5.0
2.5
Unemployment Rate, 1992–2019
Figure 1.12–Unemployment Rate Over Time, Chatham County
% 7.4%
5.8%
16%
11%
2020
Federal Reserve Economic Data (FRED)
U.S. RECESSIONS

PLAN 2040 63Community Profile
16%
PLAN 204064
Educational Services, Healthcare, & Social Assistance
11,093Arts, Entertainment, Recreation, & Accommodation and Food Services
8,930Retail Trade
11,953Educational Services, Healthcare, & Social Assistance
5,026Retail Trade
4,399Arts, Entertainment, Recreation, & Accommodation and Food Services
15,554
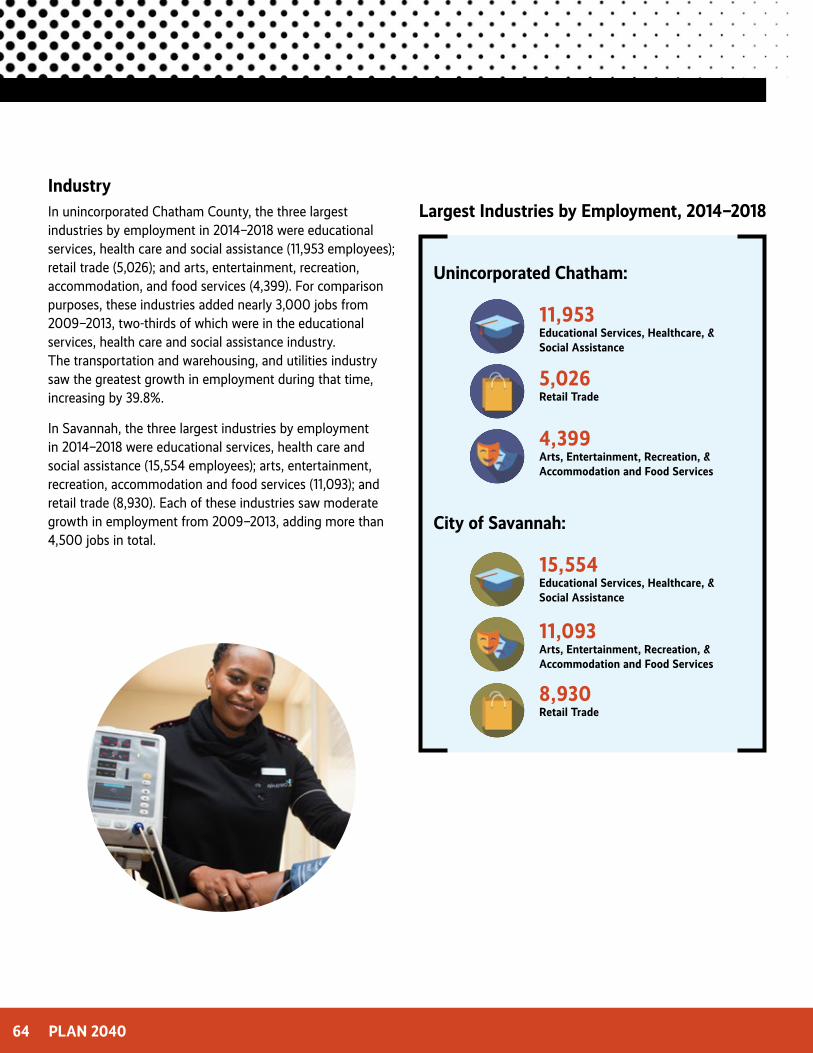
IndustryIn unincorporated Chatham County, the three largest industries by employment in 2014–2018 were educational services, health care and social assistance (11,953 employees); retail trade (5,026); and arts, entertainment, recreation, accommodation, and food services (4,399). For comparison purposes, these industries added nearly 3,000 jobs from 2009–2013, two-thirds of which were in the educational services, health care and social assistance industry. The transportation and warehousing, and utilities industry saw the greatest growth in employment during that time, increasing by 39.8%.
In Savannah, the three largest industries by employment in 2014–2018 were educational services, health care and social assistance (15,554 employees); arts, entertainment, recreation, accommodation and food services (11,093); and retail trade (8,930). Each of these industries saw moderate growth in employment from 2009–2013, adding more than 4,500 jobs in total.
Largest Industries by Employment, 2014–2018
City of Savannah:
Unincorporated Chatham:

PLAN 2040 65Community Profile
0.5 1.0 1.5 2.0
1.48
1.25
1.16
1.02
1.00
1.00
.94
.91
.83
.82
.78
.31
.90
1.73
1.19
1.02
.98
.88
.17
1.19
.92
.72
.64
.62
.58
Indu
stry
Sec
tors
0.5 1.0 1.5 2.0
.92
Location quotient (LQ) is a measurement of how concentrated a particular industry is in an area relative to the nation as a whole. It compares the industry’s share of local employment to the U.S. average. An LQ of 1 indicates an industry is providing the same share of jobs locally as it is nationally, an LQ above 1 indicates a higher-than-average concentration locally, and an LQ below 1 indicates jobs in that industry are less concentrated locally than the national average. The LQs for industries in unincorporated Chatham County and Savannah are shown below.
In unincorporated Chatham County, the transportation and warehousing, and utilities industry was about 1.5 times more concentrated than the national average in 2014–2018. The 3,417 jobs in this sector made up 7.7% of the area’s workforce. The same year, Savannah’s most concentrated industry was arts, entertainment, recreation, accommodation, and food services, which accounted for nearly twice the share of employment in the city as it did nationally. The 11,093 jobs in this sector made up 16.8% of the city’s workforce.
Transportation & Warehousing
Public Administration
Educational Services
Arts & Entertainment
Retail Trade
Wholesale Trade
Information
Manufacturing
Other Services
Construction
Finance & Insurance
Professional
Ag.
Arts & Entertainment
Retail Trade
Transportation & Warehousing
Educational Services
Public Admin
Professional
Other Services
Construction
Manufacturing
Finance & Ins.
Information
Wholesale Trade
Ag.
Figure 1.14–Industry Location Quotient, SavannahFigure 1.13–Industry Location Quotient, Unincorporated Chatham
Industry Concentration, 2014–2018
U.S. Census Bureau: 2018 American Community Survey 5-Year Estimates

PLAN 204066
8.6%Poverty Level
$67,404Median Household Income
8.6%Poverty Level
$41,093
22.9%Poverty Level
Median Household Income
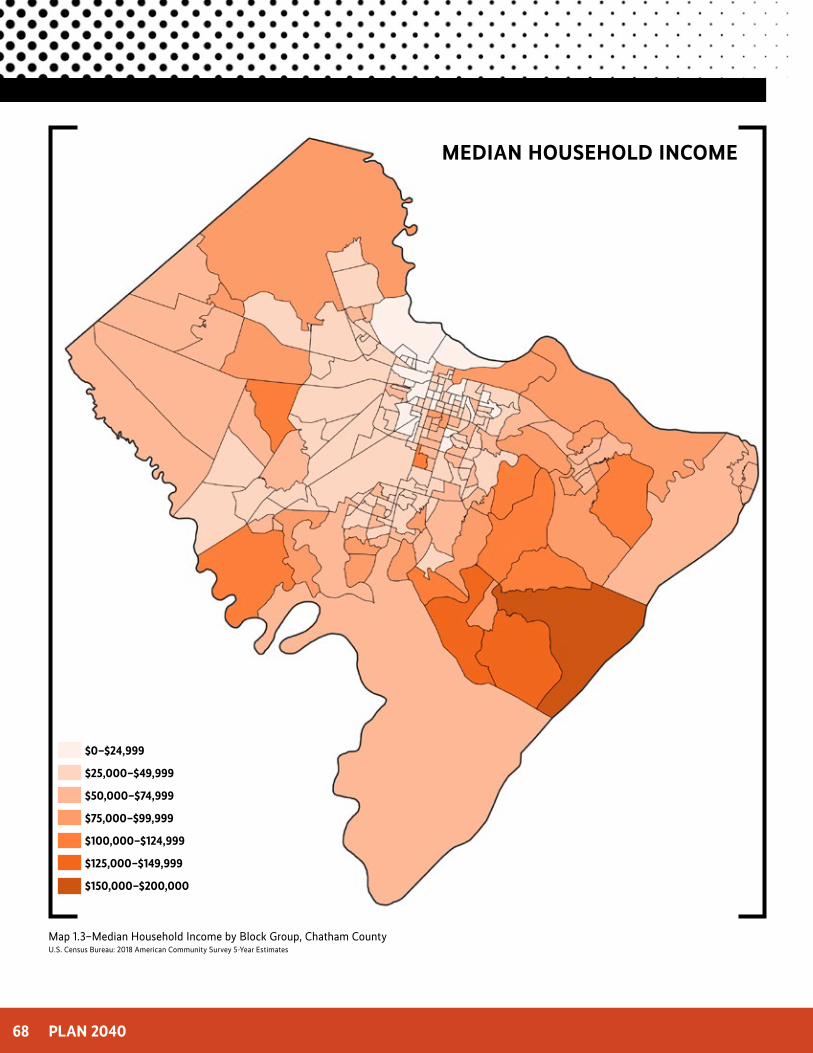
Income & PovertyIn 2014–2018, the median household income in unincorporated Chatham County was $67,404; in Savannah it was $41,093. The distribution of household incomes in the county and city provides a more comprehensive understanding of the income differences between residents of the two areas. In unincorporated Chatham, nearly one in three households (31.3%) had an annual income of $100,000 or more; in Savannah, the same percentage of households (31.2%) had an income of less than $25,000 a year.
An estimated 8.6% of people in unincorporated Chatham County lived below the poverty level in 2014–2018 compared with 22.9% in Savannah. Children under 18 were the most likely age group to be in poverty in both places: in the county, roughly one in eight children lived in poverty (12.6%) versus nearly one in three in Savannah (32.8%). Likewise, females were overrepresented in the population living below poverty level in both the unincorporated areas of the county and the city. In unincorporated Chatham, 7.3% of households received Supplemental Nutrition Assistance Program (SNAP) benefits in the past 12 months compared with 19.7% in the city of Savannah.
Poverty & Income Characteristics, 2014–2018
Unincorporated Chatham:
City of Savannah:

PLAN 2040 67Community Profile
Median Household Income, 2014–2018
UNINCORPORATED CHATHAM
CITY OF SAVANNAH
8.5%
4.1%
22.0%
32.8%
11.4%
12.6%
Poverty Status by Age, 2014–2018
Figure 1.16–Poverty Status by Age, SavannahFigure 1.15–Poverty Status by Age, Unincorporated Chatham
5K
$0—$24.9k
$25k—$49.9k
$50k—$74.9k
$75k—$99.9k
$100k—$124.9k
$125k—$149.9k
$150k—$199.9k
$200k or more
Figure 1.17–Median Household Income in the Past 12 Months (2018 Inflation-Adjusted)
65 &
Old
er18
-64
20% 40% 60% 80% 100%0% 20% 40% 60% 80% 100%0%
Und
er 1
8
65 &
Old
er18
-64
Und
er 1
8
U.S. Census Bureau: 2018 American Community Survey 5-Year Estimates
10K
15K
U.S. Census Bureau: 2018 American Community Survey 5-Year Estimates
PLAN 204068
$125,000–$149,999
$150,000–$200,000
$75,000–$99,999
$100,000–$124,999
$25,000–$49,999
$50,000–$74,999
$0–$24,999
Map 1.3–Median Household Income by Block Group, Chatham County
MEDIAN HOUSEHOLD INCOME
U.S. Census Bureau: 2018 American Community Survey 5-Year Estimates

PLAN 2040 69Community Profile
70–80%
60–69.9%
50–59.9%
40–49.9%
30–39.9%
20–29.9%
10–19.9%
0–9.9%
Map 1.4–Percent of People in Poverty by Tract, Chatham County
POVERTY
U.S. Census Bureau: 2018 American Community Survey 5-Year Estimates

PLAN 204070
Population by Household Type 2014–2018
62% 18% 16%
24%30%39% 7%
4%
53,187Total Households
36,394Total Households
IN FEMALE HOUSEHOLDER (NO SPOUSE)
IN NONFAMILY HOUSEHOLDS
IN MARRIED-COUPLE FAMILY
IN MALE HOUSEHOLDER (NO SPOUSE)
IN FEMALE HOUSEHOLDER (NO SPOUSE)
IN NONFAMILY HOUSEHOLDS
IN MARRIED-COUPLE FAMILY
IN MALE HOUSEHOLDER (NO SPOUSE)
Households & FamiliesFrom 2000–2010, the average household size in Chatham County shrunk slightly from 2.49 to 2.45 people. This is in line with national trends throughout the 20th Century that saw a long-term decline in household size as families had fewer and fewer children over time. Since 2010, however, average household size in both the county and the country as a whole has increased. In 2014–2018, the average household size in Chatham County was 2.54 people. This rise is likely driven by changes in household composition in recent years; although families are postponing childbearing and having fewer children overall, the share of young adults living with their parents has increased at a greater pace, as has the share of multigenerational households.
In 2014–2018, there were an estimated 36,394 households in unincorporated Chatham County and 53,187 in the city of Savannah. In unincorporated Chatham, families made up 67.6% of households, while 32.4% were people living alone or with other non-family members. Savannah had a lower percentage of family households (56.6%), and one-third of households (33.6%) were made up of people living alone.
Figure 1.18–Population by Household Type, Unincorporated Chatham & Savannah
Unincorporated Chatham
City of Savannah
Household Characteristics, 2014–2018
City of Savannah:
Unincorporated Chatham:
U.S. Census Bureau: 2018 American Community Survey 5-Year Estimates

PLAN 2040 71Community Profile
12%
27%
55%
6%
13%
47%
34%
6%
2.54Household Size
Figure 1.20–Marital Status, SavannahFigure 1.19–Marital Status, Unincorporated Chatham
Household Size, 2014–2018
Chatham County:
Marital Status, 2014–2018
Divorced
Now Married
Never Married
Widowed
Divorced
Now Married
Never Married
Widowed
U.S. Census Bureau: 2018 American Community Survey 5-Year Estimates

PLAN 204072
Total Housing Units
40,159Total Housing Units
62,236
UNINCORPORATED CHATHAM
CITY OF SAVANNAH
24,87123,346
11,52329,841
9,0493,765
Housing Units, Ownership, & TenureThere were an estimated 40,159 housing units in unincorporated Chatham County in 2014–2018. Over 90% of units were occupied, primarily by homeowners (68.3%), with renters inhabiting one out of every three occupied housing units. The estimated rental vacancy rate, or amount of rental stock that is vacant for rent, was 7.5% while the homeowner vacancy rate was just 1.9%. For comparison, the national rental and homeowner vacancy rates for the same year were 6.0% and 1.7%, respectively.
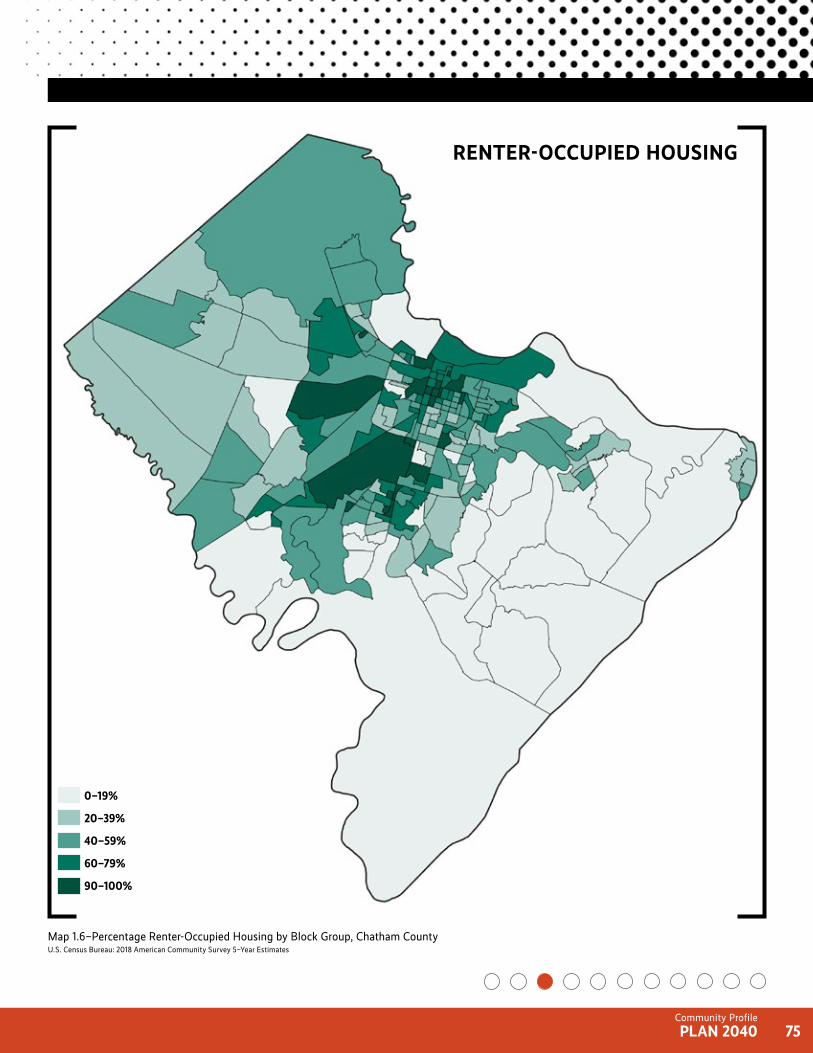
In the city of Savannah, there were 62,236 total housing units in 2014–2018, most of which were single-family houses (62.4%) including both detached and attached residences (i.e., townhouses). Approximately 85.5% of housing units were occupied, with renters making up the majority of occupied housing units (56.1%) compared with homeowners (43.9%). While the rental vacancy rate in Savannah (7.2%) is slightly lower than that of unincorporated Chatham County, the homeowner vacancy rate is much higher at 3.2%.
Ow
ner
Occ
upie
dR
ente
r O
ccup
ied
Vac
ant
Housing Tenure & Vacancy, 2014–2018
Housing Units, 2014–2018
City of Savannah:
Unincorporated Chatham:
Figure 1.21–Housing Tenure & VacancyU.S. Census Bureau: 2018 American Community Survey 5-Year Estimates
PLAN 2040 73Community Profile
6%
14%
72%
4%
4%
2%
29%
57%
6%
7%
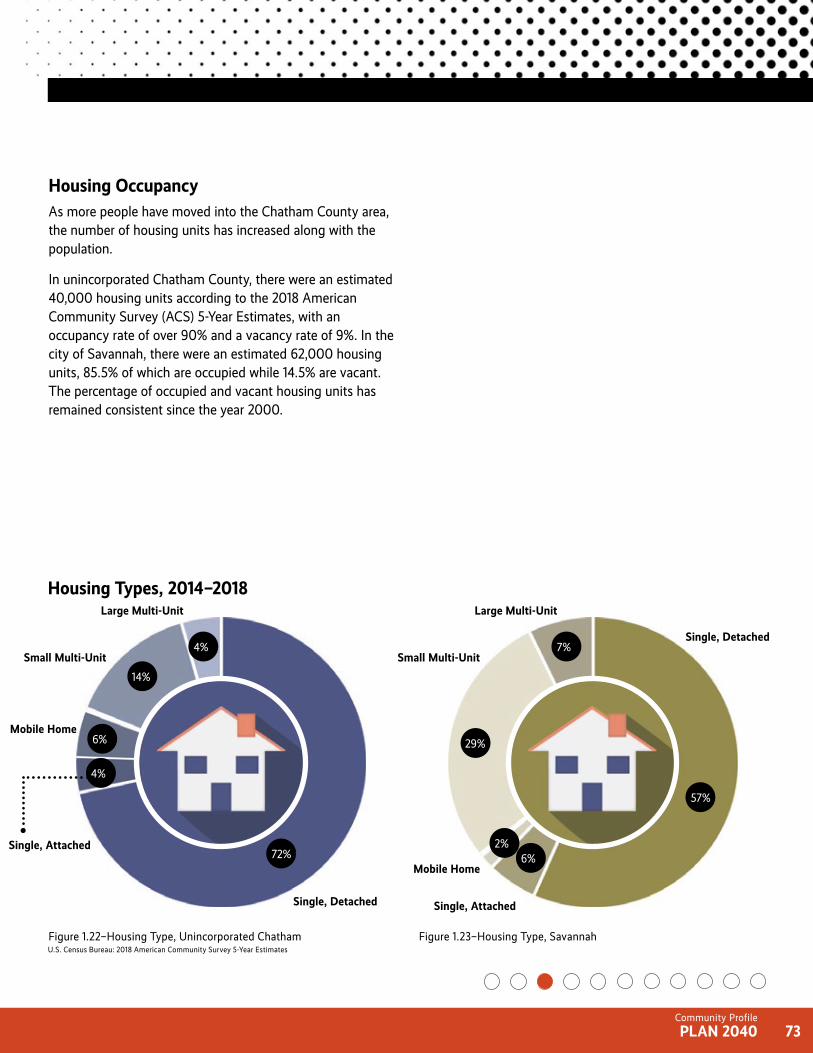
Housing OccupancyAs more people have moved into the Chatham County area, the number of housing units has increased along with the population.
In unincorporated Chatham County, there were an estimated 40,000 housing units according to the 2018 American Community Survey (ACS) 5-Year Estimates, with an occupancy rate of over 90% and a vacancy rate of 9%. In the city of Savannah, there were an estimated 62,000 housing units, 85.5% of which are occupied while 14.5% are vacant. The percentage of occupied and vacant housing units has remained consistent since the year 2000.
Figure 1.22–Housing Type, Unincorporated Chatham Figure 1.23–Housing Type, Savannah
Housing Types, 2014–2018
Single, Detached
Single, Attached
Mobile Home
Small Multi-Unit
Large Multi-Unit
Single, Detached
Single, Attached
Mobile Home
Small Multi-Unit
Large Multi-Unit
U.S. Census Bureau: 2018 American Community Survey 5-Year Estimates

PLAN 204074
60–79%
80–100%
20–39%
40–59%
0–19%
Map 1.5–Percentage Owner-Occupied Housing by Block Group, Chatham County
OWNER-OCCUPIED HOUSING
U.S. Census Bureau: 2018 American Community Survey 5–Year Estimates
PLAN 2040 75Community Profile
60–79%
90–100%
20–39%
40–59%
0–19%
Map 1.6–Percentage Renter-Occupied Housing by Block Group, Chatham County
RENTER-OCCUPIED HOUSING
U.S. Census Bureau: 2018 American Community Survey 5–Year Estimates

PLAN 204076
City of Savannah:
Median Housing Value
$221,446
Unincorporated Chatham:
Median Housing Value
$1,170Median Gross Rent
$977Median Gross Rent
$151,000
Housing Value & CostsIn 2014–2018, the median property value of owner-occupied residences in unincorporated Chatham County was $221,446; in the city of Savannah it was $151,000. In unincorporated Chatham, the two-thirds of owner-occupied units that had a mortgage spent roughly $1,596 per month on housing costs, while those without a mortgage spent $658 per month. Of households with a mortgage, 27.3% were considered cost-burdened, paying at least 30% of their monthly income toward housing expenses. According to the U.S. Department of Housing and Urban Development, cost-burdened households “may have difficulty affording [other] necessities such as food, clothing, transportation, and medical care.” This is a sizeable decrease from 2009–2013, when 36.6% of households with a mortgage were cost burdened.
For renters in unincorporated Chatham County, the median gross rent was $1,170 in 2014–2018, and 42.8% of rental households were cost-burdened, down 7.6 percentage points from the share of cost-burdened renters in 2009–2013. In Savannah, the 64.5% of owner-occupied households that had a mortgage typically spent about $1,312 per month on housing costs compared with $448 for households without a mortgage. One in three owner-occupied households (33.5%) was considered cost-burdened, down from 42.8% in 2009–2013. The median rent in 2014–2018 was $977, and more than half of all rental households in the city were cost-burdened (55.4%), down from 60.4% in 2009–2013.
The proportion of cost-burdened homeowners and renters in Savannah is an indication that local wages are not keeping pace with rising housing costs (and likely cost of living) in the area, and that housing affordability is an issue for renters in particular.
Housing Characteristics, 2014–2018

PLAN 2040 77Community Profile
750,000–$874,999
875,000–$1,000,000
500,000–$624,999
625,000–$749,999
250,000–$374,999
375,000–$499,999
125,000–$249,999
0–$124,999
Map 1.7–Median Home Value by Block Group, Chatham County
MEDIAN HOME VALUE
U.S. Census Bureau: 2018 American Community Survey 5-Year Estimates

PLAN 204078
2,208 2,195
2,668
1,235 1,285 1,337
UNINCORPORATED CHATHAM
CITY OF SAVANNAH
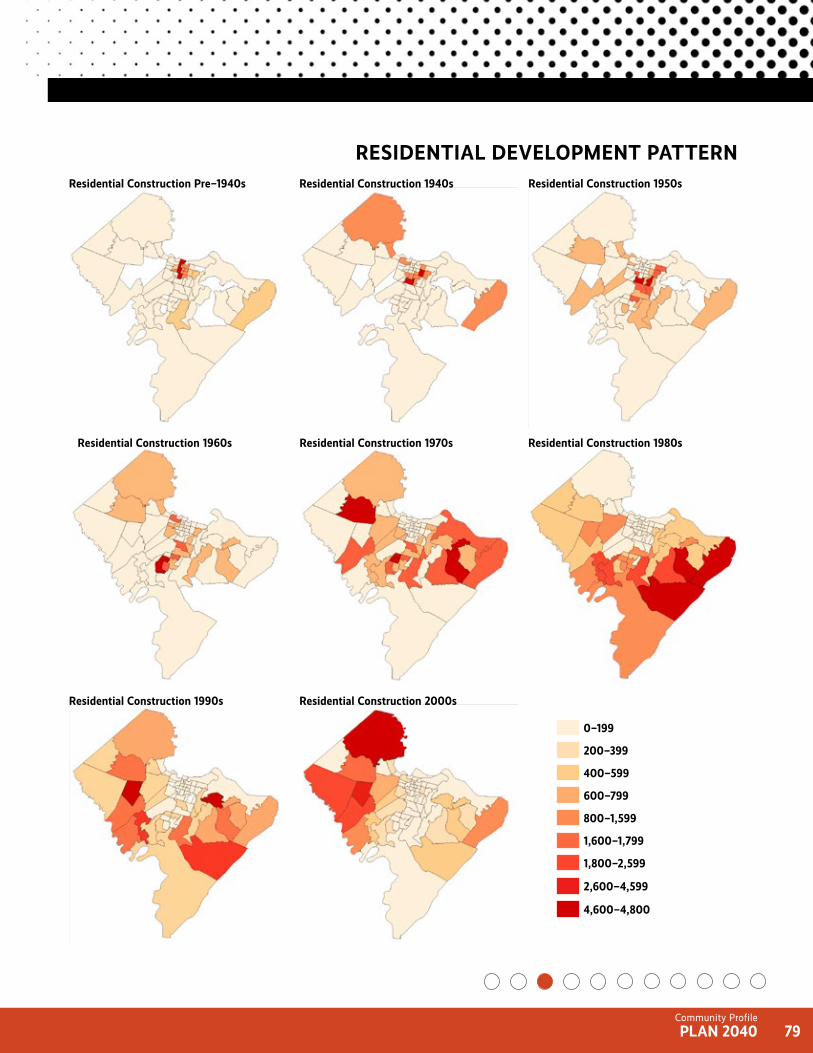
Residential Construction The construction of residential buildings is generally a good indicator of a community’s growth. There has been a steady pace of building in both Chatham County and the city of Savannah in recent years, with the majority of new construction being single family detached homes.
Figure 1.24 shows the recent residential construction trends in unincorporated Chatham County and Savannah. Estimating the population based on the number of building permits is useful in planning for roads, parks and other amenities, schools, infrastructure, utilities, and services.
1,000
1,500
2,000
2,500
500
Figure 1.24–Residential Construction Permits, Unincorporated Chatham & Savannah
0
Residential Construction Permit Trends, 2018–2020
20192018 2020
Chatham County Building Safety & Regulatory Services
PLAN 2040 79Community Profile
Residential Construction Pre–1940s Residential Construction 1940s Residential Construction 1950s
Residential Construction 1960s Residential Construction 1970s Residential Construction 1980s
Residential Construction 1990s Residential Construction 2000s
RESIDENTIAL DEVELOPMENT PATTERN
1,800–2,599
2,600–4,599
800–1,599
1,600–1,799
400–599
600–799
200–399
0–199
4,600–4,800

PLAN 204080
City of Savannah:
At Least a High School Diploma
93%
Unincorporated Chatham:
At Least a High School Diploma
41.7%Bachelor's Degree or Higher
93%
41.7%Bachelor's Degree or Higher
Educational AttainmentPeople over age 25 in unincorporated Chatham County had a higher level of educational attainment than the average U.S. resident in 2014–2018. Ninety-three percent (93.0%) of residents had at least a high school diploma or high school equivalency, and 41.7% held a bachelor’s degree or higher. This is about the same proportion as in 2009–2013, when 92.8% of residents had a high school diploma and 39.3% had a bachelor’s degree or higher.
In the city of Savannah, most people over age 25 were high school graduates (87.0%), while 28.1% of residents held a bachelor’s degree or higher. Figure 1.25 & 1.26 illustrates the breakdown of educational attainment in unincorporated Chatham and the city of Savannah. These percentages are roughly the same as in 2009–2013, when 85.6% of residents were high school graduates and 26.1% had a bachelor’s degree or higher.
Educational Characteristics, 2014–2018
17%
11%
27%
32%
13%
25%
17%
20%
31%
7%
Figure 1.26–Educational Attainment, SavannahFigure 1.25–Educational Attainment, Unincorporated Chatham
Educational Attainment, 2014–2018
Bachelor's
Post-Graduate No Degree
High School
Some College
Bachelor's
Post-Graduate No Degree
High School
Some College
U.S. Census Bureau: 2018 American Community Survey 5-Year Estimates

PLAN 2040 81Community Profile
40–59%
60–80%
0–19%
20–39%
Map 1.8–Percentage Bachelors Degree or Higher by Block Group, Chatham County
BACHELORS DEGREE OR HIGHER
U.S. Census Bureau: 2018 American Community Survey 5-Year Estimates
PLAN 204082
6%
89%
5%
UNINCORPORATED CHATHAM
CITY OF SAVANNAH
30.2%32.9%
37.8%41.6%
17.1%14.2%
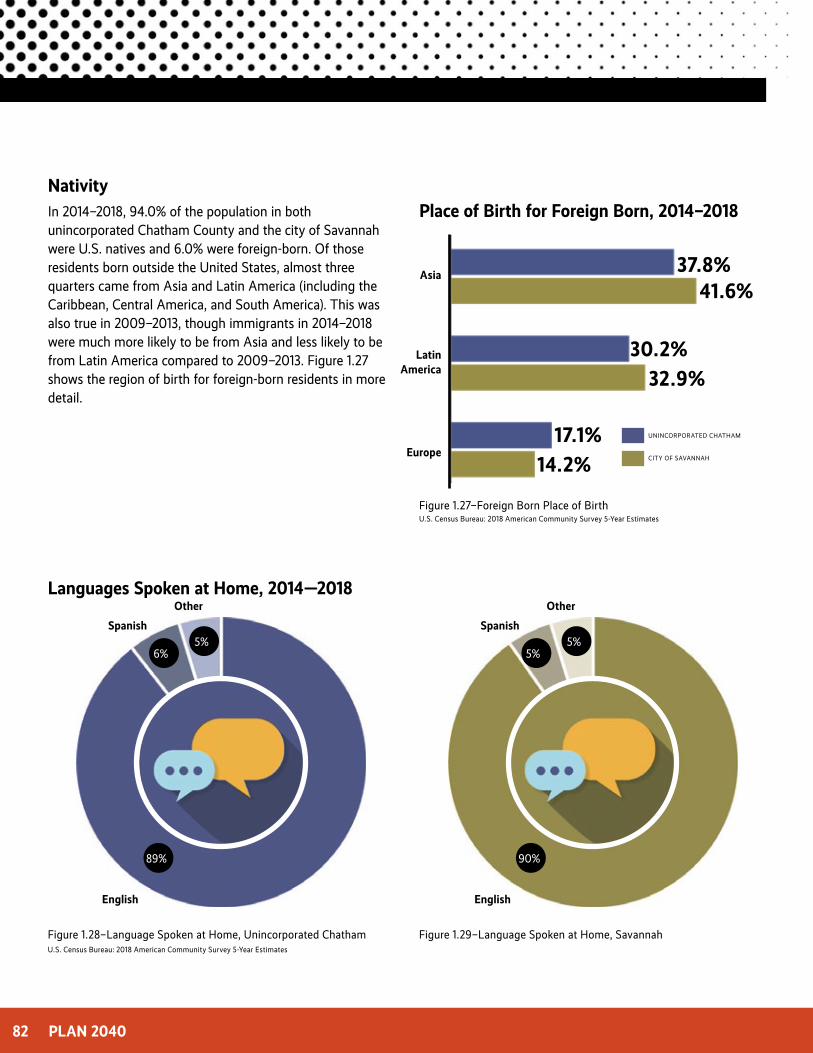
NativityIn 2014–2018, 94.0% of the population in both unincorporated Chatham County and the city of Savannah were U.S. natives and 6.0% were foreign-born. Of those residents born outside the United States, almost three quarters came from Asia and Latin America (including the Caribbean, Central America, and South America). This was also true in 2009–2013, though immigrants in 2014–2018 were much more likely to be from Asia and less likely to be from Latin America compared to 2009–2013. Figure 1.27 shows the region of birth for foreign-born residents in more detail.
Latin America
Place of Birth for Foreign Born, 2014–2018
Asia
Europe
Figure 1.27–Foreign Born Place of Birth
Languages Spoken at Home, 2014—2018
5%
90%
5%Spanish
Other
English
Figure 1.28–Language Spoken at Home, Unincorporated Chatham Figure 1.29–Language Spoken at Home, Savannah
Spanish
Other
English
U.S. Census Bureau: 2018 American Community Survey 5-Year Estimates
U.S. Census Bureau: 2018 American Community Survey 5-Year Estimates
PLAN 2040 83Community Profile
31.730.5
27.9
26.4
9.2
13.2
33.1
27.2
5.9
4.4
7.5
5.8
0.80.5
3.2
4.6
0.10.0
Total Veteran Population
22,982Total Veteran Population
9,916
UNINCORPORATED CHATHAM
CITY OF SAVANNAH
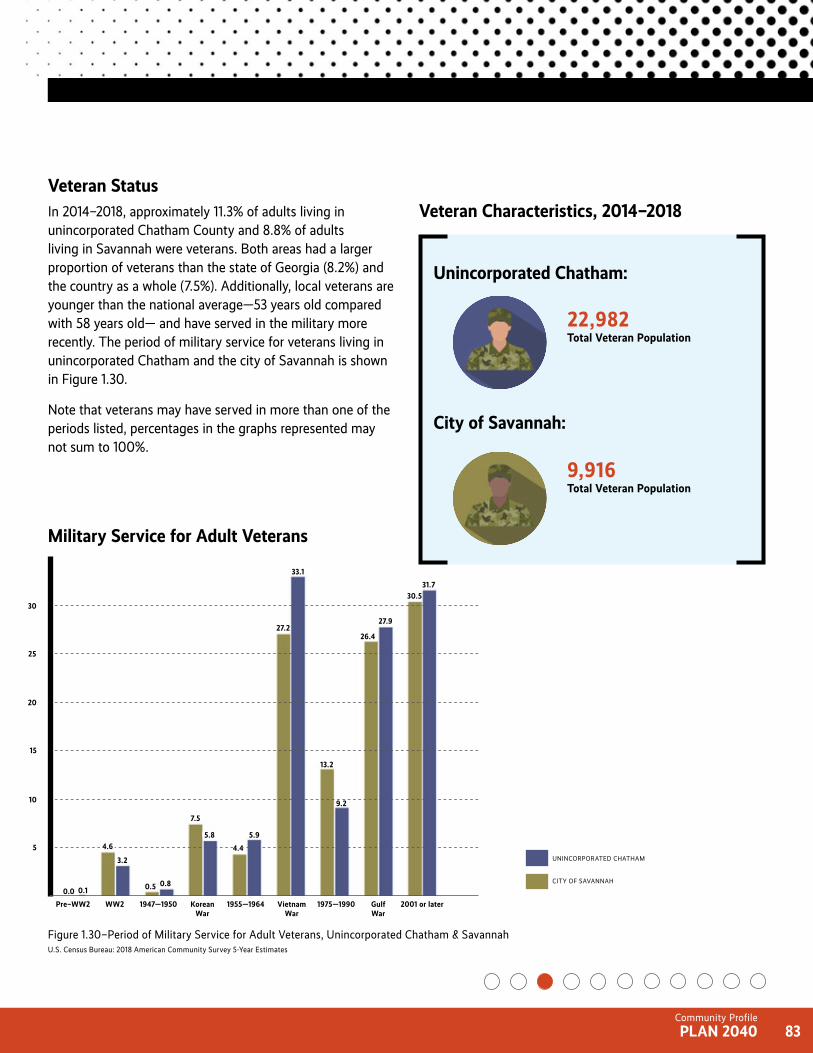
Veteran StatusIn 2014–2018, approximately 11.3% of adults living in unincorporated Chatham County and 8.8% of adults living in Savannah were veterans. Both areas had a larger proportion of veterans than the state of Georgia (8.2%) and the country as a whole (7.5%). Additionally, local veterans are younger than the national average—53 years old compared with 58 years old— and have served in the military more recently. The period of military service for veterans living in unincorporated Chatham and the city of Savannah is shown in Figure 1.30.
Note that veterans may have served in more than one of the periods listed, percentages in the graphs represented may not sum to 100%.
Veteran Characteristics, 2014–2018
City of Savannah:
Unincorporated Chatham:
5
10
15
2001 or laterGulf War
1975—1990Vietnam War
1955—1964Korean War
1947—1950WW2Pre–WW2
Figure 1.30–Period of Military Service for Adult Veterans, Unincorporated Chatham & Savannah
20
25
30
Military Service for Adult Veterans
U.S. Census Bureau: 2018 American Community Survey 5-Year Estimates

PLAN 204084
The city of Savannah was created around a system of wards, which were part of a larger integrated regional land system. Each ward included a central square surrounded by building lots for residences and trust lots reserved for public buildings. The result was a dense urban pattern that was centered around walkability.
The introduction of the streetcar in the late 1800s had an enormous impact on the growth of the city, resulting in new development patterns that shaped the city's "first ring" suburbs. Lot sizes doubled, the public realm shrank, and the ward structure changed to one composed of rectangular blocks.
10,769
1790
1870
41,279
pop.
pop.
1790—Oglethorpe's Grid 1870—The First Ring SuburbPlanned Town Era Streetcar Era
CHATHAM COUNTY & SAVANNAH GROWTH

PLAN 2040 85Community Profile
By the 1950s, automobile dependence was in full effect. People relied on their automobile to travel to work and for accessing goods and services. This post-war era gave rise to the Baby Boom, which spurred a great economic and development expansion. This fueled the suburbs rapidly, reaching out farther and farther from the original core.
While automobiles were introduced late in the nineteenth century, their impact on development patterns in the region was not felt until the 1920s. As the automobile stimulated a “Second Ring” suburb, greater mobility offered developers far more opportunities to develop beyond the urban fringe.
A new era of reduced automobile dependence and increasing mobility options is slowly emerging and producing
alternative forms of development, including neo-traditional development, conservation subdivisions, high-amenity
communities, and town centers. Combinations and reformulations of these types of development will likely
create new land use patterns distinctly different from earlier suburban patterns.
1940
1950
100,032
151,481
2018
289,430
pop.
pop.
pop.
2018—Quality of Life
1940—Post-War Expansion
1950—Automobile Dependence
Amenity Community Era
Early Automobile Era
Modern Automobile Era

PLAN 204086
COVID-19 PandemicCOVID-19 has touched nearly every aspect of the community and residents' lives in the past year. Chatham County, like every county in the country, suffered the economic, social, educational, and health consequences of the pandemic that, at the time of this writing, has killed over 569,000 Americans. As of April 5, 2021, Chatham County had a total of 19,608 confirmed COVID-19 cases, 394 confirmed deaths, and 1,561 hospitalizations due to COVID-19. At the time these data were acquired, there were an additional 24 probable deaths due to COVID-19 in Chatham County.
As of February 2021, the employment rate in the county had decreased 5.8% compared with January 2020. These job losses have been concentrated primarily in low and middle wage jobs; in fact, the employment rate among workers in the top wage quartile has been above January 2020 levels since statewide “stay at home” orders were lifted on April 30, 2020. Workers in the bottom wage quartile, however, have remained hardest hit; between mid-March and mid-April 2020, the employment rate for low wage jobs dropped nearly 45%.
Unemployment claims in the county reached their peak the first full week of April 2020, when roughly 14,500 people filed an initial claim for unemployment benefits. This corresponds to a rate of 10.4 claims per 100 people in the labor force. The number of unemployment claims has generally been decreasing since then. As of the week ending October 31, 2020, there were 0.88 unemployment claims per 100 people in the county’s labor force.
Small businesses have also been negatively impacted by the COVID-19 pandemic. As of February 2021, 33% fewer small businesses were open in Chatham County compared with January 2020, and total small business revenue had decreased by 38.5%. By mid-March 2021, however, total consumer spending in Chatham County had nearly rebounded back to pre-pandemic levels.
Overall, Chatham County residents spent 5% less time away from home in April 2021 compared with the start of last year when the pandemic began. When people did leave their residence during this time, the average amount of time spent elsewhere varied significantly depending on their destination, with the most dramatic increase seen in outdoor activity.
– The total time spent at grocery stores increased 2.9%
– Total time spent in parks increased 64.7%
– Total time spent at retail and restaurant locations increased 1.6%
– Total time spent at transit locations decreased 24%
– Total time spent in the workplace decreased 29.6%

PLAN 2040 87Community Profile
+60%
+40%
+20%
0%
-20%
-40%
+10%
0%
-10%
-20%
-30%
-40%
April 1 June 1 August 1 October 1 December 1 February 12021
April 6
Time Spent Outside Home
First U.S. COVID-19 CaseJanuary 20
Figure 1.32–Percent Change in Time Spent Outside Home, Chatham County
April 1 June 1 August 1 October 1 December 1 February 12021
April 6
Percent Change in Employment
First U.S. COVID-19 CaseJanuary 20
Figure 1.31–Percent Change in Employment, Chatham County
-5%Total Time
Outside Home
+5.2%High Wage (>$60K)
-14.4%Low Wage (<$27K)
-5.2%Middle Wage ($27K–$60K)
2020
2020
Georgia Issues Stay at Home OrderApril 1
Georgia Issues Stay at Home OrderApril 1
Opportunity Insights Economic Tracker; Google: COVID-19 Community Mobility Reports
Opportunity Insights Economic Tracker; Earnin; Intuit; Kronos; Paychex

PLAN 204088
Data & CalculationsAll data presented in the Community Profile are for unincorporated Chatham County and the city of Savannah unless otherwise noted. Most of these data are from the U.S. Census Bureau’s American Community Survey (ACS) multiyear estimates covering the 2014–2018 period (the most current publicly available ACS multiyear data at the time of access). ACS 5-year estimates represent data collected over a period of 60 months, and describe the general social, economic, housing, and demographic characteristics of a geographic area over that entire period of time. These multiyear estimates offer the additional benefit of having smaller margins of error and being more statistically reliable than the single-year estimates also published by the ACS. The 2018 ACS 5-year estimates in the Plan 2040 Community Profile are based on municipal boundaries as of January 1, 2018. To better understand trends within the county, it is important to only use non-overlapping periods of the ACS multiyear estimates. Therefore, the 2013 5-year ACS data covering the years 2009–2013 is used throughout the chapter to compare data over time.
The Census Bureau publishes ACS 5-year data for multiple different geographies, including counties, cities/towns, census tracts, and block groups (among many others). While ACS data for the city of Savannah were obtained directly from the Census Bureau, estimates for Unincorporated Chatham County—a non-standard geographic area for which ACS data are not explicitly published—had to be derived separately. Typically, this is done by aggregating data for smaller geographic units such as tracts up to the desired geographic level. In Chatham County, however, this method was not suitable because municipal boundaries do not line up with the boundaries of any smaller geographic units.
In general, most of the statistics for unincorporated Chatham County were calculated using the following steps:
1. Data was downloaded for each of the eight municipalities in Chatham County as well as for Chatham County as a whole
2. The data was summed across all of the municipalities
3. The sum for the municipalities was subtracted from the value for Chatham County as a whole
Additional statistical calculations were completed to obtain margins of error for all derived estimates. For more information about this process, or any other calculations in the Community Profile, please contact the Advance Planning Department of the Chatham County—Savannah Metropolitan Planning Commission.
Other key data sources include: U.S. Census Bureau (Decennial Censuses, Longitudinal Employer-Household Dynamics, Population Estimates Program), U.S. Bureau of Economic Analysis, Opportunity Insights, as well as several departments and offices of the state of Georgia.

PLAN 2040 89Community Profile
(Page Intentionally Left Blank)
Top Related