


Languages
Pages
Legal


A joint project of the
Lycoming County
United Way, STEP,
Inc. and Lycoming
College’s Center for
the Study of
Community and the
Economy (CSCE)
Community Needs Assessment:
Continuity and Change in the Needs
of Lycoming County, 2015
Jonathan Williamson, Ph.D. Director, CSCE Chair, Department of Political Science [email protected]
Bonita Kolb, Ph.D. Co-Director, CSCE Associate Professor of Business [email protected]
Center for the Study of Community and the Economy (CSCE) Lycoming College Williamsport, PA 17701
Rachelle Abbott, AICP Chief Planning Officer [email protected]
STEP, Inc. 2138 Lincoln Street Williamsport, PA 17701

1 | P a g e
Table of Contents
Table of Contents ................................................................................................................................................................................ …1
Executive Summary................................................................................................................................................................................ 2
Methodology ......................................................................................................................................................................................... 3 Objective Data Community Survey Partner Survey Customer Survey Focus Groups
Understanding & Using this CNA Report ............................................................................................................................................... 5
Critical Needs Ranking ........................................................................................................................................................................... 6
Key Need Categories with Summary Themes ...................................................................................................................................... 10
Children and Youth .............................................................................................................................................................................. 10 Child Abuse Child Care
Delinquency Family Issues
Education and Employment ................................................................................................................................................................. 20 Early Childcare Education Lack of Employment Skills Parents as Educators
Emergency Services for Families in Crisis ............................................................................................................................................. 28 Domestic Violence
Financial and Service Needs Parenting Classes Teen Pregnancy
Health and Nutrition ............................................................................................................................................................................ 37 Access and Affordability of Health Care
Care of Aging Population Hunger & Food-Security
Housing and Homelessness ................................................................................................................................................................. 44 Lack of Space Landlords
More than Just Housing Specialized Populations
Senior and Persons with Disabilities Support Services ......................................................................................................................... 54 Housing Affordability
Inadequate Information Sense of Entitlement Service Needs Socialization
Substance Abuse .................................................................................................................................................................................. 62 Behavioral Issues
Drug Use Housing Situations Health Care Professionals
Demographics ...................................................................................................................................................................................... 62

2 | P a g e
Executive Summary
In anticipation of the 2015 Community Needs Assessment (CNA), Lycoming-Clinton Counties Commission for
Community Action (STEP), Inc. partnered with the Lycoming County United Way (LCUW) in 2012 to develop
a mutually beneficial process for creating an overarching, comprehensive CNA. As is the case with community
action agencies, United Ways are required to produce a CNA on a three-year time frame. Prior to this
collaboration both agencies were developing CNAs separately, yet the results were relatively the same. The key
to the partnership is to maximize resources while eliminating duplication. Lycoming College’s Center for the
Study of Community and the Economy (CSCE) provided technical assistance and guidance in the process. They
collected qualitative data through telephone surveys and conducted data analysis and interpretation. The CNA
combined objective and subjective data sets for both counties that include demographic data, community
surveys, customer surveys, partner surveys, and focus groups. The information presented in this document is the
comprehensive analysis of the information gathered.
Since the LCUW and the CSCE have worked on the CNA over the last ten years, longitudinal data exists to
illustrate the identified priority needs. This data plays a key role in understanding both past and current needs.
The Critical Needs section of the report provides a broad view of the community and partner perception of
needs in Lycoming County. From 2012 to 2015, there has been a transition of the most critical need from
Jobs/Economy to Drug/Alcohol Abuse. The partner survey results categorize the top problems as drug/alcohol
related, followed by housing issues and early childhood education. Early Childhood Education was mentioned
throughout the focus groups as a real barrier to self-sufficiency. The continued CNA partnership between STEP,
LCUW, and CSCE will allow for longitudinal data that illustrates how we as a community are tackling
community needs and being true catalysts of change.
The multiplier effect of poverty and how barriers often work together to create a ripple effect that keeps a
family from moving towards self-sufficiency were highlighted in focus group discussions as well as in
respondents’ comments. Given this, a holistic approach to breaking down barriers is necessary to address many
existing community needs. Coordination of services between agencies and emphasis on the importance of more
effective communication within partnerships should be focal points.
STEP and the LCUW intend the CNA report to serve as a community resource and asset. The multitude of
stakeholders in the community including funding agencies, government officials, nonprofits, businesses, and
institutions are encouraged to use the information within. The CNA's value and utility will be realized only if it
is embraced and used within strategic and comprehensive planning, grant writing, program development, and
partnerships. Within the document analysis of the data is illustrated in various ways, but by no means is it all-
inclusive as the data provided can and should be further examined to be most useful to the reader.
While the CNA provides more analysis and data than previous assessments, it should be understood that there is
limitations to the data. Additional questions still are left unanswered, most specifically, what the community
does now. The easy answer is focus on the needs identified, but the key is that each sector, nonprofit, private,
and public, have a role and it is through their individual missions and programs incremental change can occur.
Through a concentrated effort of collaboration that focuses financial resources, human capital, and innovative
outcome-based programming on the identified community needs, we will make Lycoming County a better place
to live, work, and play.

3 | P a g e
Methodology The community needs assessment for Lycoming County was completed using four connected methodologies:
analysis of objective secondary data, a survey of the adult population of Lycoming County, a survey of partner
agencies working in the county, a survey of customers of those agencies, and a series of focus groups to delve
further into the topics identified in prior surveys. This section will address the methodology used for each.
Objective Data Objective secondary data was assembled using the CAAP Community Needs Assessment (CNA), a
comprehensive tool that provides Pennsylvania's Community Action Agencies with the means to capture
information about their community, analyze the data, and identify the needs to be met within the community.
This online tool provides background information for the state and counties from over 20 data sources,
including federal and state departments.
The tool was developed in partnership with the Missouri Association for Community Action and the University
of Missouri, under the guidance of a CAAP workgroup consisting of staff from local PA Community Action
Agencies. The PA Department of Community & Economic Development funded the acquisition and
development. CAAs fund the annual maintenance as part of a project by The Pennsylvania Community Action
Needs Assessment Workgroup, made up of staff from various community action agencies and the Community
Action Association of Pennsylvania in conjunction with the Missouri Association for Community Action
(MACA), University of Missouri Center for Applied Research and Environmental Systems (CARES), and the
Pennsylvania State Data Center (PSDC) to create the PA Community Needs Assessment Tool. The tool allows
Pennsylvania Community Action agencies to gather the demographic data needed to perform their CNA in a
consistent and automated manner.
Community Survey The Community Survey contacted by telephone 464 respondents who were randomly selected from registered
voters in Lycoming County. The margin of error for the survey is +/– 4.6%. It should be noted that the margin
of error for subgroups can be significantly larger depending on each group’s share of the total population. The
methodology used here largely replicates that used in each survey since 2005, also referenced here.
Registered voters were selected with the purpose of providing a broad cross-section of residents in the county,
and because the accompanying data that comes with a registration-based sample provided useful information for
reporting purposes. The primary drawback of using a registered voter-based sample is that those residents who
are not registered are likely to have different characteristics and hold different opinions than those who are
registered. That the unregistered are likely to be among those more likely to need and use the services designed
to address the needs identified in this report should be taken into account when interpreting the results.
Registered voters are older, more financially secure, less mobile, and better educated on average than their
unregistered counterparts.
In addition, when comparing our sample with the universe of registered voters, we found that respondents were
older than the population of registered voters, were more likely to be female, and in some townships in the
county were overrepresented, while others were underrepresented. Therefore, the data was statistically
weighted so that the results reflect the universe of registered voters on those three factors.
Demographic questions on income and education levels were included in the community survey. The results
are provided in the demographics section of this report for the purpose of comparison between the survey
respondents and the broader county population.

4 | P a g e
Partner Survey The partner survey was distributed to staff members of approximately 150 social service agencies in Lycoming
County via Survey Monkey. One hundred seventy-nine responses were received. While there was no means to
control whether staff members from certain agencies were more likely to respond than those from other
agencies, the high number of responses compared with prior years is likely adequate to accurately gauge the
perceptions of those engaged with the needs being assessed. While there is no reason to believe the responding
agencies expressed substantially different views than nonresponding agencies, the possibility cannot be
discounted.
Customer Survey
As a means to fill gaps in assessing county needs that might remain from community and partner perceptions,
costumers of social service agencies in Lycoming County were also asked about their needs and their
perceptions of needs in Lycoming County though a paper survey distributed by the agencies. Five hundred
eighty-eight responded to the Customer Survey. It is notable that the number of responses received from
customers of the various agencies varied significantly. While some agencies were quite systematic in ensuring
that their customers completed a survey, others were not. As a result, interpretation of the results should take
into account that there is no way of knowing how representative the responses are when compared with the
opinions of the population of social service agency customers as a whole.
Several demographic questions were included in the customer survey. The results are provided in the
demographics section of this report for the purpose of comparison between the survey respondents and the
broader county population.
In addition to the customer surveys, customer satisfaction surveys were analyzed as part of the process.
Focus Groups Six focus groups were conducted to delve further into the community needs identified through the surveys. The
topic of each focus group centered on one area of identified concern: Education & Employment, Services for
Persons with Disabilities & Seniors, Substance Abuse, Children & Youth, Families in Crisis, and Housing &
Homelessness. Participants in focus groups were selected by the Lycoming County United Way and STEP, Inc.
as representatives of partner agencies, the public sector, and the private sector, and have extensive experience in
the respective focus group topics. Each focus group included 8 to 12 participants.

5 | P a g e
Understanding & Using this CNA Report In order to have the CNA be a resource and tool for the greater community, below provides a breakdown of the
document into three key sections and a summary of each.
Purpose of CNA
Meet United Way & STEP
Requirements
Analyze Comprehensive
Community Needs
Provide CNA Tool to
Community
CNA Organizational
Structure
Critical Need Rankings
Key Need Categories with
Summary Themes
Supporting Data
Using the CNA Strategic Planning
Program Development
Grant Writing & Resource
Development
Internal & External
Assessment
Lycoming-Clinton Counties Commission for Community Action
(STEP), Inc. and Clinton County United Way (CCUW) are required to
produce a CNA on a three-year time frame.
The CNA analyzes comprehensive community needs through objective
and subjective data sets including demographic data, community
surveys, customer surveys, partner surveys, and focus groups.
The CNA report can be used by the community stakeholders for
strategic planning, grant writing, program development, and
partnerships.
Critical need rankings provide relative importance of identified needs
of Clinton County.
In each key need category section, category themes summarize
findings.
Supporting data includes objective data, community and customer
survey data, and focus group findings.
Use findings and data to plan short- and long-range goals.
Tie findings and data to support new program development and
enhancement.
Collaborate with community partners to maximize community
outcomes efficiently and effectively.
Justify funding requests with CNA content within and across need
categories.
Utilize CNA as a foundation for developing and implementing
assessment tools.
Measure effectiveness to achieve program effectiveness.
6 | P a g e
Critical Needs Ranking The critical needs of Lycoming County and perceptions of their relative importance were assessed through
asking community survey respondents to identify the most important problem facing the County and by asking
partner agency respondents to rate a series of potential county issues on both their importance and the adequacy
of the current response to those issues. By comparing the results of this needs assessment to those of prior
years, it is possible to identify not only the emergence of new issues but also whether respondents feel that
progress has been made on other issues identified in the past.
In the community survey, the most commonly cited problems were drugs and alcohol, followed by crime and
gangs. Both categories grew significantly in the minds of respondents and now account for over 60 percent of
all responses. They emerged to displace the economy and jobs, as well as natural gas-related issues and
housing-related issues, which had been more prominent in the public’s mind in the last assessment. Taxes,
education, and transportation-related concerns rounded out the problems identified by a significant share of
respondents. It should be noted that some issues identified as problems in the County (taxes, for example) fall
outside the scope of the missions of the organizations sponsoring this needs assessment and their partners. The
needs assessment focuses attention on those issues that mesh with the missions of CNA sponsors and their
partner organizations.
Similarly, a growth in the concern about issues of substance abuse surfaced in the partner survey. The top three
concerns are related to drugs and alcohol, each ranking higher in partners’ minds than they had in the prior
assessment. Also receiving significantly higher ratings in terms of issue importance were access to mental
health services, illiteracy, adult job training, affordable housing for seniors, and affordable child care. While
housing dropped from the top spot, it remains in the first tier of concerns. Rounding out the top ten issues were
child abuse and neglect, access to affordable health care insurance, and the quality of early childhood education.
Consistent with the perceptions expressed in the community survey, partner survey respondents placed less
attention in this assessment on economic issues. Unemployment and underemployment both saw significant
drops amongst the issues ranked. Homelessness also fell despite the continued concern over affordable
housing. Also seeing significantly lower rankings were access to dental care, hunger, the availability of
counseling services, and teenage pregnancy.
When asked if adequate attention was being devoted to each of the issues, partners were more negative than
they had been about the attention being paid to substance abuse issues, access to mental health, domestic abuse,
and access to counseling services. They revealed more optimism with regard to the attention being paid to
access to affordable health insurance, affordable housing for seniors, access to affordable child care, access to
health care, access to dental care, and teenage pregnancy. Overall, a majority responded that inadequate
attention was being paid to 25 of the issues surveyed. The rankings from the community survey as well as the
partner survey are listed below.

7 | P a g e
Community Survey What do you feel is the most important problem facing Lycoming County today? (Telephone Survey)
2015
(Percentage) 2012
(Percentage) 2009
(Percentage) 2005
(Percentage)
Drugs/Alcohol 48.5 4.6 13.3 11.0
Crime / Gangs 15.1 9.2 20.6 17.0
Economy/Jobs 14.8 30.2 42.2 23.8
Natural gas industry related issues
4.8 17.4 * *
Housing-related issues, including homelessness
3.8 9.9 0.2 0.8
Taxes 2.8 5.4 3.2 14.3
Education 2.8 3.7 1.1 1.5
Roads, Trucks and Traffic 2.6 4.7 1.2 3
Various Other 4.8 14.9 18.2 28.6
*Respondents did not provide this response in this survey.
Partner Survey What are the most important issues facing Lycoming County?
Note: The table is sorted based on the ranking the issues in 2015 survey.
2015 2012 2009 2005
Rank Mean Rank Mean Rank Mean Rank Mean
Abuse of alcohol and/or drugs by youth 1 4.73 5 4.25 1 4.62 2 4.38
Abuse of alcohol and/or drugs by adults
2 4.60 T7 4.12 4 4.41 T6 4.13
Access to substance abuse services 3 4.53 T15 3.98 T12 4.23 ***
Affordable housing 4 4.49 1 4.46 T12 4.23 15 3.93
Access to mental health services 5 4.39 T21 3.90 29 3.84 T4 4.18
Child abuse and neglect 6 4.20 9 4.10 5 4.37 3 4.24
Access to affordable health insurance 7 4.18 6 4.22 3 4.46 1 4.54
Quality of early childhood education 8 4.15 *** *** ***
Illiteracy 9 4.12 20 3.91 27 3.92 T12 3.97
Adult job training T10 4.11 19 3.92 T24 3.96 14 3.95
Affordable housing for seniors T10 4.11 23 3.89 20 4.05 21 3.74
Access to early childhood education 12 4.10 *** *** ***
Availability of affordable child care 13 4.09 24 3.86 17 4.14 9 4.05
Access to affordable prescription medications
14 4.08 T10 4.08 T9 4.28 ***
Household budgeting 15 4.06 *** *** ***
Domestic abuse 16 4.05 T10 4.08 8 4.30 T4 4.18
Unemployment T17 4.02 2 4.35 2 4.52 T6 4.13
Homelessness T17 4.02 3 4.28 T9 4.28 22 3.73

8 | P a g e
Health care for senior citizens 19 4.01 18 3.95 15 4.21 17 3.87
Youth job training 20 4.00 *** *** ***
Access to job skill training 21 3.99 *** *** ***
Juvenile delinquency 22 3.98 T15 3.98 T22 3.99 16 3.92
Access to health care T23 3.96 T7 4.12 6 4.33 8 4.08
Access to nutritious meals for seniors T23 3.96 *** *** ***
Access to dental care 25 3.95 12 4.04 14 4.22 24 3.71
Underemployment T26 3.94 4 4.27 7 4.31 T10 4.03
Heating, electricity, & water assistance T26 3.94 *** *** ***
Services for the needs of senior citizens
28 3.92 26 3.71 18 4.09 23 3.72
Availability of after school activities 29 3.90 27 3.65 T22 3.99 T10 4.03
Hunger 30 3.86 T13 4.00 11 4.25 19 3.76
Availability of counseling services T31 3.84 T21 3.90 19 4.08 T12 3.97
Services for disabled children T31 3.84 T28 3.54 T24 3.96 18 3.81
Availability of summer activities 33 3.83 *** *** ***
Teenage pregnancy 34 3.75 T13 4.00 26 3.93 20 3.75
Elder abuse or neglect 35 3.74 T28 3.54 21 4.00 31 3.47
Occupational training for the disabled 36 3.69 36 3.35 31 3.69 32 3.45
Violence in schools 37 3.65 32 3.51 16 4.17 29 3.51
Access to transportation for the disabled
38 3.61 31 3.53 32 3.67 27 3.58
Building access for the disabled 39 3.54 35 3.39 33 3.66 26 3.66
Ethnic/racial discrimination 40 3.38 25 3.84 34 3.65 25 3.67
AIDS/HIV 41 3.19 33 3.50 28 3.87 30 3.50
Gender discrimination 42 3.16 34 3.43 35 3.20 34 3.31
Age discrimination 43 3.14 30 3.54 36 3.16 33 3.32
Transportation for the elderly *** 17 3.96 30 3.73 28 3.54
Is the issue receiving adequate attention by community groups?
2015 2012 2009 2005
% Responding “No”
Abuse of alcohol and/or drugs by youth 68% 62% 72% 54%
Abuse of alcohol and/or drugs by adults 60% 31% 58% 40%
Access to substance abuse services 64% 37% 43% ***
Affordable housing 71% 77% 67% 75%
Access to mental health services 77% 57% 63% 72%
Child abuse and neglect 64% 57% 72% 71%
Access to affordable health insurance 65% 80% 79% 100%
Quality of early childhood education 34%
Illiteracy 50% 41% 41% 17%
Adult job training 49% 39% 41% 33%

9 | P a g e
Affordable housing for seniors 49% 64% 40% 61%
Access to early childhood education 21%
Availability of affordable child care 71% 81% 68% 63%
Access to affordable prescription medications 72% 64% 60% ***
Household budgeting 69%
Domestic abuse 54% 40% 63% 44%
Unemployment 61% 64% 73% 65%
Homelessness 60% 53% 62% 47%
Health care for senior citizens 36% 42% 64% 67%
Youth job training 54%
Access to job skill training 46%
Juvenile delinquency 68% 60% 56% 72%
Access to health care 55% 66% 61% 68%
Access to nutritious meals for seniors 28%
Access to dental care 57% 70% 76% 65%
Underemployment 70% 64% 80% 90%
Heating, electricity, & water assistance 51%
Services for the needs of senior citizens 30% 30% 28% 59%
Availability of after school activities 58% 67% 64% 65%
Hunger 37% 37% 48% 33%
Availability of counseling services 54% 31% 42% 64%
Services for disabled children 34% 17% 36% 46%
Availability of summer activities 61%
Teenage pregnancy 54% 65% 71% 64%
Elder abuse or neglect 45% 38% 46% 60%
Occupational training for the disabled 24% 24% 20% 42%
Violence in schools 58% 52% 74% 69%
Access to transportation for the disabled 21% 19% 13% 31%
Building access for the disabled 22% 18% 23% 35%
Ethnic/racial discrimination 43% 48% 64% 53%
AIDS/HIV 28% 15% 30% 27%
Gender discrimination 45% 45% 48% 56%
Age discrimination 45% 50% 55% 70%
Transportation for the elderly 21% 32% 20%
10 | P a g e
Key Need Categories with Summary Themes The Key Need Categories were defined through understanding previous CNAs and areas of interest that were
mutually important to LCUW, STEP, and the broader community. The themes under each category summarize
findings from customer surveys, partner surveys, community surveys, and focus groups. The themes are
arranged in alphabetical order.
Children and Youth The issue of children and youth is broad-based, with young people bearing the brunt of other issues facing the
community. The consensus seems to be that progress toward solving many county needs requires focused
attention on the problems experienced by county youths. When prior studies allow for comparisons over time,
existing problems remain a concern, with some growth in perceived lack of access to affordable child care and
increased awareness of child abuse. Across the objective data, community, customer, and partner surveys as
well as focus group information four main themes emerge: issues related to family structure and stability,
delinquency, availability and affordability of child care, and child abuse.
Child Abuse The community survey shows that a higher percentage of community members are more aware of someone who
has suffered from abuse. Focus group participants believe that we need to provide families with preventive
services. Changes in the mandatory reporting laws that will inform reporters of the results will help the public
know that something is being done. However, Pennsylvania laws on what constitutes abuse are very lenient and
the emphasis is on keeping the family together.
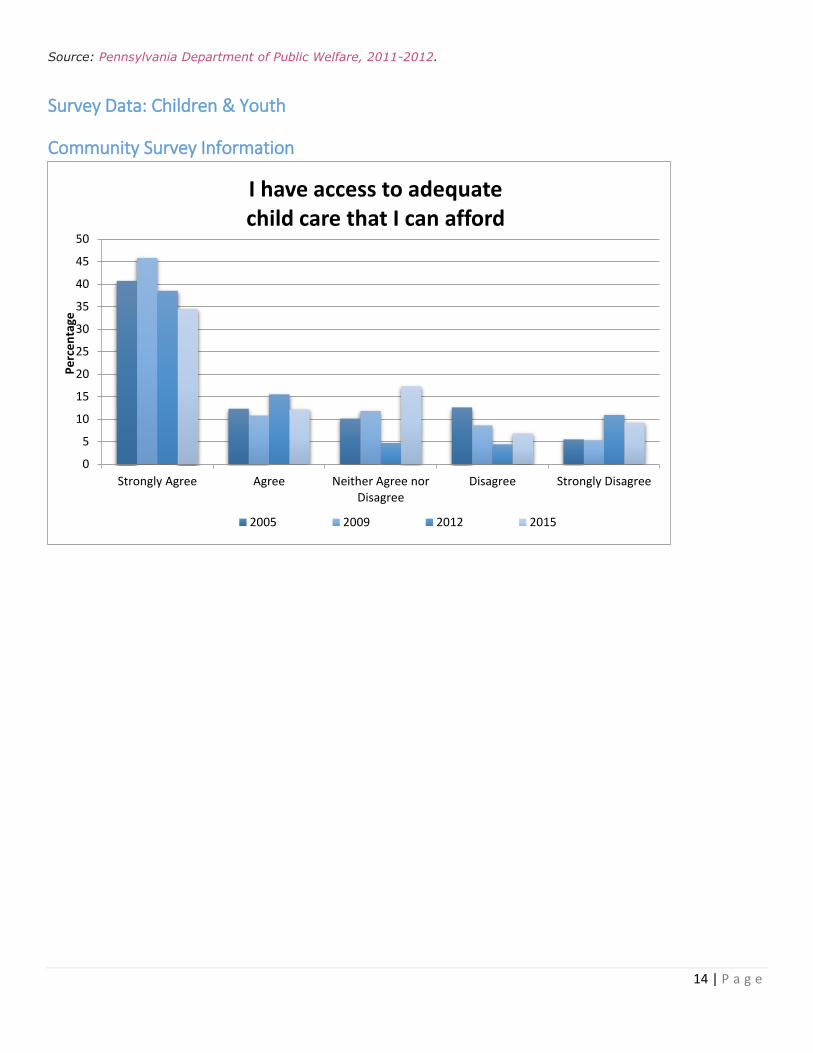
Child Care The objective data shows the number of child care facilities available in the county. The community survey
shows a decline in the percentage of people who either agree or disagree with the statement that they have
access to day care. A customer survey question on access to affordable child care brought a response equally
split between agree and disagree. Customer survey respondents were overwhelmingly positive about their
family’s access to early childhood education. Focus group participants believe that there is a need to provide
children with assistance from early Head Start through twelfth grade and that there is a lack of quality child care
in the area. It is even more difficult to find quality care in the rural areas. Contradictory to the community
survey response, according to the focus group participants, children do not have any activities after school.
Delinquency Community survey data reveals that a strong majority disagree with the statement that there is nothing to do
after school. They strongly agree with the statement that adequate summer activities for children exist. Focus
group members state that although there is actually less delinquency in our community than in the past, the
crimes are worse. Local places to house delinquents are lacking, making it difficult for the family to stay in
contact. Juvenile delinquency workers currently are part of middle school staff, but they should also be doing
preventive services in elementary schools. With as many as 90 percent of delinquents of African-American
ethnicity, outreach with more services for minority youths is needed.

11 | P a g e
Family Issues Objective data from the 2012 U.S. Census shows that the poverty rate for youths aged 0–17 in Lycoming
County was slightly higher than the state or national rate. However, for those aged 0–4 the rate is significantly
higher than the state or national rate. Focus group members believe that many family issues affect children. The
family in crisis must be stabilized before the child can be helped because children bring with them the families’
problems. Sixty percent of parents do not have a high school diploma, so there is a lack of understanding in the
importance of education. If the family is “couch surfing,” it is difficult for children to concentrate on their
academic studies. Parents are also working irregular hours, which makes consistent child care difficult. A two-
generational approach based on increasing the stability of the families, while supporting the children is needed.

12 | P a g e
Objective Data: Children & Youth Population: Children & Youth (ACS) The table below shows the population of youths up to age 17 in Lycoming County and in Pennsylvania.
Population by Age & Gender, 2009 - 2013
County 0 to 4 5 to 17
M F M F Total
Lycoming 3,367 3,090 9,018 8,640 24,115
Pennsylvania 370,033 352,945 1,043,432 993,970 2,760,380
Source: United States Census Bureau, American Community Survey, 2013 Data Release, December 2014.
The 2013 American Community Survey 5-year data is a 5-year average of data collected from 2009 through 2013.
Poverty: Child (0–17) Poverty Rate (ACS) The table below shows total population estimates for children as a whole and children in poverty for the one-county report area. According to the American Community Survey 5-year averages, 20.76 percent of children in this age group lived in a state of poverty during the 2013 calendar year. The poverty rate for children living in Lycoming County is greater than the Pennsylvania average of 18.76 percent.
County Children, Ages 0 - 17 years
Total Population In Poverty Poverty Rate
Lycoming 23,725 4,926 20.76%
Pennsylvania 2,716,032 509,623 18.76%
National 72,748,616 15,701,799 21.58%
Source: United States Census Bureau, American Community Survey, 2013 Data Release, December 2014.
The 2013 American Community Survey 5-year data is a 5-year average of data collected from 2009 through 2013.
Poverty: Child (0–4) Poverty Rate (ACS) The table below shows total population estimates for children as a whole and children in poverty for Lycoming County. According to the American Community Survey 5 year averages, an average of 29.67 percent of children in this age group lived in poverty in Lycoming County during the 2013 calendar year. The poverty rate for children living in the Lycoming County is greater than the Pennsylvania average of 22.12 percent.
County Children, Ages 0 - 4 years
Total Population In Poverty Poverty Rate
Lycoming 6,387 1,895 29.67%
Pennsylvania 713,183 157,748 22.12%
National 19,743,544 4,881,767 24.73%
Source: United States Census Bureau, American Community Survey, 2013 Data Release, December 2014.
The 2013 American Community Survey 5-year data is a 5-year average of data collected from 2009 through 2013.
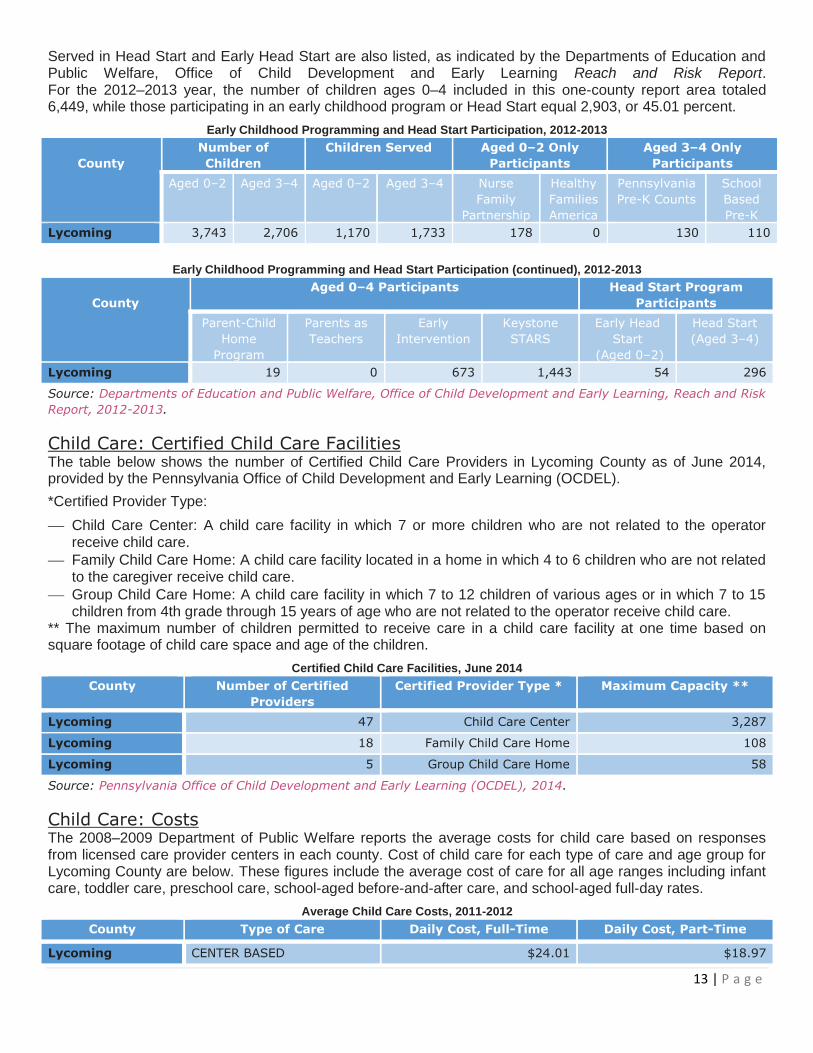
Education: Early Childhood Programming and Head Start Participation In Lycoming County, Children Served, Aged 0–2 includes children served in the following programs: the Nurse Family Partnership, the Parent-Child Home Program, and Healthy Families America. Under Children Served, Aged 3–4 includes children served in the following programs: Parent-Child Home Program, Parents as Teachers, Head Start, Pre-K Counts, School District Pre - K, Early Intervention, and Keystone Stars. Children
13 | P a g e
Served in Head Start and Early Head Start are also listed, as indicated by the Departments of Education and Public Welfare, Office of Child Development and Early Learning Reach and Risk Report. For the 2012–2013 year, the number of children ages 0–4 included in this one-county report area totaled 6,449, while those participating in an early childhood program or Head Start equal 2,903, or 45.01 percent.
Early Childhood Programming and Head Start Participation, 2012-2013
County
Number of
Children
Children Served Aged 0–2 Only
Participants
Aged 3–4 Only
Participants
Aged 0–2 Aged 3–4 Aged 0–2 Aged 3–4 Nurse
Family
Partnership
Healthy
Families
America
Pennsylvania
Pre-K Counts
School
Based
Pre-K
Lycoming 3,743 2,706 1,170 1,733 178 0 130 110
Early Childhood Programming and Head Start Participation (continued), 2012-2013
County
Aged 0–4 Participants Head Start Program
Participants
Parent-Child
Home
Program
Parents as
Teachers
Early
Intervention
Keystone
STARS
Early Head
Start
(Aged 0–2)
Head Start
(Aged 3–4)
Lycoming 19 0 673 1,443 54 296
Source: Departments of Education and Public Welfare, Office of Child Development and Early Learning, Reach and Risk
Report, 2012-2013.
Child Care: Certified Child Care Facilities The table below shows the number of Certified Child Care Providers in Lycoming County as of June 2014, provided by the Pennsylvania Office of Child Development and Early Learning (OCDEL).
*Certified Provider Type:
Child Care Center: A child care facility in which 7 or more children who are not related to the operator receive child care.
Family Child Care Home: A child care facility located in a home in which 4 to 6 children who are not related to the caregiver receive child care.
Group Child Care Home: A child care facility in which 7 to 12 children of various ages or in which 7 to 15 children from 4th grade through 15 years of age who are not related to the operator receive child care.
** The maximum number of children permitted to receive care in a child care facility at one time based on square footage of child care space and age of the children.
Certified Child Care Facilities, June 2014
County Number of Certified
Providers
Certified Provider Type * Maximum Capacity **
Lycoming 47 Child Care Center 3,287
Lycoming 18 Family Child Care Home 108
Lycoming 5 Group Child Care Home 58
Source: Pennsylvania Office of Child Development and Early Learning (OCDEL), 2014.
Child Care: Costs The 2008–2009 Department of Public Welfare reports the average costs for child care based on responses from licensed care provider centers in each county. Cost of child care for each type of care and age group for Lycoming County are below. These figures include the average cost of care for all age ranges including infant care, toddler care, preschool care, school-aged before-and-after care, and school-aged full-day rates.
Average Child Care Costs, 2011-2012
County Type of Care Daily Cost, Full-Time Daily Cost, Part-Time
Lycoming CENTER BASED $24.01 $18.97
14 | P a g e
Source: Pennsylvania Department of Public Welfare, 2011-2012.
Survey Data: Children & Youth
Community Survey Information
0
5
10
15
20
25
30
35
40
45
50
Strongly Agree Agree Neither Agree norDisagree
Disagree Strongly Disagree
Pe
rce
nta
ge
I have access to adequate child care that I can afford
2005 2009 2012 2015

15 | P a g e
0.0
10.0
20.0
30.0
40.0
50.0
60.0
70.0
Strongly Agree Agree Neither Agree norDisagree
Disagree Strongly Disagree
Pe
rce
nta
ge
My family has had access to quality early childhood education.
2015
0
10
20
30
40
50
60
70
Strongly Agree Agree Neither Agree norDisagree
Disagree Strongly Disagree
Pe
rce
nta
ge
My children have nothing to do after school
2005 2009 2012 2015

16 | P a g e
Are you aware of anyone in your community who has been the victim of child abuse or neglect in the last
year?
2005 (Percentage)
2009 (Percentage)
2012 (Percentage)
2015 (Percentage)
Yes 17.6 21.9 17.7 26.7
No 81.3 76.7 81.8 71.3
Refused 0.2 0.0 0.2 0.0
Don't Know 0.8 1.4 0.4 1.9
0.0
5.0
10.0
15.0
20.0
25.0
30.0
35.0
40.0
45.0
50.0
Strongly Agree Agree Neither Agree norDisagree
Disagree Strongly Disagree
Pe
rce
nta
ge
My children have access to adequate activities to keep them busy in the summer.
2015

17 | P a g e
Customer Survey Information
0
5
10
15
20
25
30
Strongly Agree Agree Neither Agree norDisagree
Disagree Strongly Disagree
Pe
rce
nt
I have access to adequate child care that I can afford.
2015

18 | P a g e
0
5
10
15
20
25
30
35
40
45
50
Strongly Agree Agree Neither Agree norDisagree
Disagree Strongly Disagree
Pe
rce
nt
My family has had access to quality early childhood education.
2015
0
5
10
15
20
25
30
35
40
45
50
Strongly Agree Agree Neither Agree norDisagree
Disagree Strongly Disagree
Pe
rce
nt
My children have nothing to do after school.
2015

19 | P a g e
Are you aware of anyone in your community who has been the victim of child abuse or neglect in the last
year?
2015 (Percentage)
Yes 10.3
No 64.8
Don't Know 24.9
0
5
10
15
20
25
30
35
40
Strongly Agree Agree Neither Agree norDisagree
Disagree Strongly Disagree
Pe
rce
nt
My children have access to adequate activities to keep them busy in the summer.
2015

20 | P a g e
Education and Employment The issues that emerged from the interconnected topics of education and employment ranged from children in
their very first educational experiences all the way through adults who lacked skills for success in the
workplace. Prominent amongst the needs identified were the interrelated needs for improvement in the
outcomes attributable to education and overcoming the barriers that prevent productive employment. Making
progress on these combined issues would enable better outcomes on many of the other needs in the county. At
the same time, the problems underlying the educational and employment needs (for example, substance abuse)
are often at the root of why existing educational and employment resources have thus far proven inadequate.
Across the objective data, community, customer, and partner surveys as well as focus group information three
main themes emerge: early childhood education, lack of employment skills, and parents as educators.
Early Childhood Education One of the themes often repeated throughout the focus groups and surveys was the need for increased early
childhood education. The lack of such education was seen as a concern even by representatives of higher
education institutions. One of the issues in providing early education was the need for trained education
professionals. However the cost of receiving such education is too high in comparison to the pay that is
received.
Lack of Employment Skills Another concern of focus group respondents was that people seeking employment did not have the skills needed
for job success. While there are jobs available, they require a level of reading ability, mathematical aptitude and
reasoning skills that many unemployed lack. In addition, the soft skills related to attitude and motivation are
often lacking. Employers are looking for people who not only have the ability to learn job skills, but also the
soft skills to be successful at the job. This results in county citizens unprepared for higher education or
employment and lacking other options besides possibly military service.
Parents as Educators As one focus group participant explained, the family is the first teacher. Her concern was expressed because
many families do not provide intellectual stimulation to their children. The families do not value education.
Education obtainment level data illustrate that nearly 55 percent of residents in Lycoming have a high school
diploma or less, which is higher than both Pennsylvania and National data. This also ties back to the emphasis
placed on the need for early childhood education, so that children will have the opportunity to build their
educational foundations. In addition, parents may lack the skills to be effective parents to their children.
Programs focusing on parenting and how to interact with children were noted as being important. Also,
providing two-generation programs that holistically focus on families and children are essential to addressing
the underlying problem.

21 | P a g e
Objective Data: Education & Employment Education: School Enrollment The table below shows the total public and nonpublic school enrollment for 2013–2014. In Lycoming County, a total of 16,660 persons were enrolled in school, with 9,226 enrolled in elementary school and 7,434 enrolled in secondary schools. In this report, private schools refer to both private and nonpublic institutions and for the report area, 595 students are enrolled in private schools or 3.57 percent of the student population.
Public and Non-Public School Enrollment, 2013–2014
County Enrollment Elementary Secondary
Total Public Private Total Public Private Total Public Private
Lycoming 16,660 16,065 595 9,226 8,782 444 7,434 7,283 151
Pennsylvania 1,971,759 1,750,059 221,700 1,082,069 926,229 221,700 889,690 823,830 65,860
Source: Public School Enrollment report and Private and Non-Public Schools Enrollments Reports, 2013-2014, The
Pennsylvania Department of Education.
Education: High School Graduates The chart shows public high school graduates planning to attend college in Lycoming County for the 2012–2013 academic year, revealing that Lycoming County has 64.06 percent of graduates attending college, while the statewide figure is 67.13 percent.
High School Graduates
County Total Graduates College Bound College Bound %
Lycoming 1,099 704 64.06%
Pennsylvania 129,739 87,099 67.13%
Source: Graduates Public by School 2012-13, The Pennsylvania Department of Education.
Education: High School Dropouts
The annual High School Dropout Rate is defined as the number of students who, for any reason other than death, leave school before graduation without transferring to another school or institution. For the academic year 2011–2012, 179 students dropped out in Lycoming County, which is a rate of 2.39 percent—slightly higher than the Pennsylvania rate.
High School Dropout Rates
County Total
Enrollment
Grades 7-12
Dropouts Dropout Rate
Male Female Total
Lycoming 7,484 110 69 179 2.39%
Pennsylvania 831,595 9,572 7,427 16,999 2.04%
Source: Dropouts Public by School 2011-12, The Pennsylvania Department of Education.

22 | P a g e
Education: Educational Attainment
The table shows the distribution of educational attainment levels in Lycoming County. Educational attainment is calculated for persons over 25, except where noted, and is an average for the period from 2008 to 2012. The statewide percentage of persons with no high school diploma is 11.71 percent, while the national percentage is 14.25 percent.
Percent Attaining Educational Levels
County Over Age
18 and No
High
School
Diploma%
Education Level for Persons over 25
No High
School
Diploma
High
School
Only
Some
College
Associate’s Bachelor’s Graduate or
Professional
Lycoming 12.59% 12.60% 42.30% 16.60% 9.90% 12.00% 6.70%
Pennsylvania 11.91% 11.71% 37.20% 16.50% 7.50% 16.60% 10.40%
National 14.53% 14.25% 28.20% 21.30% 7.70% 17.90% 10.60%
Source: United States Census Bureau, American Community Survey, 2012 Data Release, December 2013. The 2012
American Community Survey 5-year data is a 5-year average of data collected from 2008 through 2012.
Education: Adult Literacy The National Center for Education Statistics (NCES) produces estimates for adult literacy based on educational attainment, poverty, and other factors in each county.
Persons Lacking Basic Prose Literacy Skills, 2003
County Estimated Population over 16 Lacking Literacy Skills %
Lycoming 91,854 12%
Pennsylvania 9,561,844 13%
National 219,016,209 12%
Source: United States Department of Education, Institute of Education Sciences, National Center for Education
Statistics, State and County Estimates of Low Literacy, 2003.
Top Related