


Languages
Pages
Legal


Communicating Tax Penalties to Delinquent Taxpayers: Evidence
from a Field Experiment
Taylor Cranor Jacob Goldin Tatiana Homono� Lindsay Moore∗
September 10, 2018
Abstract
Tax authorities must make many decisions about how to present payment incentives to
taxpayers. We analyze a large �eld experiment conducted in partnership with the Colorado
Department of Revenue to study the e�ect of varying the presentation of �nancial and non-
�nancial incentives in tax delinquency notices. We �nd that making salient the speci�cs of
a �nancial penalty for nonpayment can modestly raise the payment rate among delinquent
taxpayers. We �nd suggestive evidence that describing the existence of a penalty (but not its
details) can also raise payments, but to a lesser degree. In contrast, emphasizing social norms
for timely payment yields a point estimate that is near zero and statistically insigni�cant. The
e�ects we observe are concentrated among taxpayers with low balances due. Our results suggest
that attention to seemingly minor decisions about the wording of notices sent by tax authorities
can reduce administrative costs associated with taxpayer delinquency.
Introduction
Delinquent tax payments represent a central problem for tax authorities. In the United States,
such payments represent approximately 25 percent of uncollected federal tax revenue (Perez-Truglia
∗Cranor: Stanford Law School. Goldin: Stanford Law School. Homono�: [email protected], Robert F. WagnerSchool of Public Service, New York University, 295 Lafayette Street 2nd Floor, New York, NY 10012. Moore: Behav-ioral Insights Team. We would like to thank Christopher Muntean, James Viano, Kevin Furman, Heidi Humphreys,and Barbara Brohl at the Colorado Department of Revenue and David Padrino and David Demres at the ColoradoGovernor's O�ce for their e�orts in data collection and implementation of this study. We are grateful to IngridEllen, Lauren Jones, Jonathan Meer, Ben Meiselman, and Katherine Michelmore for conversations and suggestionsthat have greatly improved the quality of this project. Sarah Kotb provided excellent research assistance. The viewsexpressed here are our own and do not necessarily re�ect the views of the State of Colorado.
1
and Troiano, 2015). Virtually all government bodies that collect taxes � whether at the municipal,
state, or federal level � send notices to those taxpayers who owe an outstanding tax liability. These
notices typically include information on the taxpayer's balance due as well as information on the
�nancial consequences of failing to make the required payment.
Traditional models of tax avoidance assume that individuals decide whether to pay their bal-
ance due by weighing the cost of payment against the penalties for non-compliance (Allingham
and Sandmo, 1972). Such models suggest that varying the �nancial incentives for payment can
a�ect taxpayer behavior but that variations in how those incentives are communicated to taxpayers
are irrelevant to whether taxpayers decide to pay. In contrast, a growing literature in behavioral
economics suggests that how the costs and bene�ts of payment are presented to taxpayers shapes
how taxpayers respond (Krishna and Slemrod, 2003; Slemrod, 2018). If correct, this literature sug-
gests that modifying the presentation of incentives described in delinquent tax notices can improve
compliance for essentially no cost.
This article experimentally evaluates the e�ectiveness of a range of small modi�cations to a
state's tax delinquency notice that varied the presentation of the incentives for timely tax pay-
ment. Speci�cally, we report results from a �eld experiment conducted in collaboration with the
Colorado Department of Revenue (DOR). Our sample consists of the approximately 90,000 house-
holds that comprise the universe of delinquent taxpayers for the state of Colorado for tax year 2015.
Collectively, these households represent approximately 3.5% of Colorado income tax returns and
collectively owe over $85 million in state income taxes.
The taxpayers in our sample were randomly assigned to receive one of several versions of a
delinquency notice sent to taxpayers by DOR. The �rst treatment group emphasized the �nancial
penalty for non-compliance. Taxpayers assigned to this penalty group received one of two notice
variants: a detailed version listed the interest rate penalty associated with delayed payment and
a generic version emphasized the existence of a �nancial incentive for timely payment but did not
provide details. The second experimental treatment focused on social norms: it emphasized the
high fraction of Colorado taxpayers who pay their tax bill on time. The third experimental group
served as the control group. Taxpayers in the control received the version of the notice sent in prior
years. The notices associated with di�erent treatment groups di�ered only with respect to a single
sentence.
2
Despite the seemingly minor di�erences between the notices, we document non-trivial di�erences
in their e�ect on taxpayer behavior. Our strongest evidence comes from the detailed penalty notice,
which increased the fraction of taxpayers making a full payment before the statutory deadline or
creating a payment plan by 1.6 percentage points (a 4.1 percent increase) relative to the control
notice. The estimated e�ect of the generic penalty notice relative to the control was approximately
half as large, but was not statistically distinguishable from zero. We �nd no evidence that the
social norms notice was more e�ective than the control; we estimate its e�ect to be near zero and
statistically insigni�cant. This last result is striking because it contrasts with an in�uential line
of recent studies �nding that drawing on social norms is an e�ective strategy for improving tax
compliance (Perez-Truglia and Troiano, 2015; Hallsworth et al., 2017).
Interpreting the economic signi�cance of our estimates requires understanding whether the addi-
tional taxpayers induced to pay by the treatment represent new non-delinquent taxpayers or simply
a speeding up of payments by taxpayers who would have eventually paid (even had they not received
the treatment message). The notices themselves emphasize the imporance of taking action by the
statutory deadline (30 days from the notice's receipt). To investigate the persistence of our observed
treatment e�ects, we collected data on taxpayer payments for several months after the statutory
deadline. Focusing on payments made within 100 days, we �nd the e�ect of the penalty notice
declines only slightly (by approximately one-third of its size for payments made by the statutory
deadline). This persistence suggests that the treatment induces new payments rather than simply
speeding up the timing of payments that would have otherwise been made within this timeframe.
Our results described so far suggest that improving notice design can reduce the number of delin-
quent taxpayer accounts. This is valuable for taxing authorities because it reduces costs associated
with further outreach to delinquent taxpayers such as additional mailings, phone calls, or enforce-
ment actions. However, to understand the e�ect of our intervention on total revenue, one must
understand how the treatment e�ect varies by taxpayer balance due. Speci�cally, how changes in
taxpayer behavior map to changes in revenue depends on whether the notices predominantly a�ect
the payment decisions of taxpayers with high or low balances due. We �nd striking di�erences in
how the notices a�ect payment decisions along this margin: in response to the penalty notices, the
e�ect was mostly limited to taxpayers in the �rst and second tertiles of balances due. In contrast,
taxpayers in the top tertile of balances due (those owing at least $433) were no more likely to make
3
a full payment after receiving one of the penalty notices. Consistent with our earlier results, we
observe no e�ect of the social norms notice in any of the balance due categories. These �ndings
suggest that a primary �scal bene�t to tax authorities of interventions like the one we study is
to reduce the number of outstanding delinquent accounts � thereby reducing the costs of pursuing
delinquent taxpayers � rather than solely generating additional collected revenue.
We contribute to a growing literature that experimentally evaluates communications sent by tax
authorities with the goal of raising compliance. We do so by investigating the e�ectiveness of al-
ternative delinquency notice designs in a previously unexplored but policy-relevant context: notices
sent by U.S. state taxing authorities. Studying this issue in the context of state tax deliquency
notices is important because insights from research on similar interventions conducted in other
countries (Castro and Scartascini, 2015; Del Carpio, 2013; Hallsworth et al., 2017; Kettle et al.,
2016; Gemmell and Ratto, 2018) or at other levels of government in the U.S. (Chirico et al., 2017;
Meiselman, 2018) may not generalize to this setting. First, the motivational force of social norms
may be quite di�erent across countries and across levels of government. Indeed, we �nd social norms
to be a much less e�ective driver of behavior than what has been found in other countries (Del Car-
pio, 2013; Hallsworth et al., 2017; Kettle et al., 2016). Similarly, with respect to interventions that
emphasize �nancial penalties, the e�ect of such interventions is likely to di�er between U.S. states
and other jurisidctions (either cities or other countries) based on the system of tax payment (e.g.,
near-exact withholding with reconciliation in the U.K. versus frequent refunds and balances due
in the U.S.), base level of compliance, and what type of penalties are legally available or used in
practice by the taxing authority. Finally, the e�ect of notice design is likely to di�er based on the
population of taxpayers receiving the notice (e.g., non-�lers in Meiselman (2018) versus delinquent
�lers in our study), or the type of tax that notice recipients owe (e.g., municipal property taxes in
Chirico et al. (2017) versus state income taxes in our study).1
Our paper also builds on the existing literature by focusing on heterogeneity in the e�ects of
the treatments on taxpayers based on the amount of tax liability they owe. As described above,
the revenue e�ects of an intervention like the one we study depend crucially on this question. An
important advantage of our study in this respect is that it is the �rst experimental evaluation of
1A separate related literature investigates the e�ects of communications from a tax authority that manipulatetaxpayers' perceptions about the likelihood of an audit (Blumenthal, Christian and Slemrod, 1998; Kleven et al.,2011; Dwenger et al., 2016; Castro and Scartascini, 2015; Gangl et al., 2014; Bérgolo et al., 2017).
4
penalty-emphasizing notice designs that is adequately powered to identify heterogeneous e�ects
based on taxpayer balance due.2 And as we note above, the theoretical possibility of heteroge-
neous taxpayer behavior along this dimension turns out to be quite signi�cant in practice, with our
estimated e�ect being entirely driven by taxpayers with low and moderate balances due. These re-
sults thus connect to a recent line of research that focuses on how heterogeneity in an intervention's
treatment e�ect shapes its overall contribution to social welfare (Finkelstein and Notowidigdo, 2018;
Deshpande and Li, 2017).
Our third contribution is to investigate how information about delinquent taxpayer penalties
should be presented to most e�ectively promote payment. Both the detailed penalty and the generic
penalty notices make the existence of a penalty for non-payment more salient, but the former also
makes salient the speci�c �nancial costs of non-payment. The potential downside to this approach
is that simply emphasizing the penalty's existence may be su�cient to motivate taxpayers, whereas
providing extra details may contribute to information overload (e.g., Bhargava and Manoli, 2015).
Our �nding that the detailed penalty notice was more e�ective thus sheds light on the source of the
penalty's motivational force, although we cannot statistically distinguish between the e�ects of the
two penalty treatments.
Lastly, our paper contributes to a broader literature on the e�ectiveness of informational mes-
sages from government agencies at increasing civic responsibility and engagement with government
programs. For example, communications from the Internal Revenue Service sent to low-income non-
�lers emphasizing the availability of the Earned Income Tax Credit (EITC) signi�cantly increase
tax �ling and EITC take-up (Bhargava and Manoli, 2015; Guyton et al., 2016; Manoli and Turner,
2014). Similarly, communications aimed at increasing take-up of government bene�t programs have
been shown to be e�ective in a variety of policy areas such as Disability Insurance (Armour, 2018),
post-secondary education (Barr and Turner, 2018), and retirement savings (Goldin, Homono� and
Tucker-Ray, 2017).
The remainder of the paper proceeds as follows. Section 1 describes the institutional setting
in which our experiment occurred. Section 2 provides details on our experimental design. Section
3 describes our administrative data. Section 4 provides the results of the experiment. Section 5
2Hallsworth et al. (2017) also studies heterogeneity by balance due, but in the context of an intervention focusedonly on social norms, rather than on penalties.
5
discusses our �ndings in relation to the literature and concludes.
1. Institutional Background
Like other tax authorities for states and cities, the Colorado Department of Revenue (DOR) sends
letters to taxpayers who owe additional taxes beyond what they paid when �ling their tax return.
These �Notice of De�ciency� (NOD) letters inform taxpayers that they have an additional unpaid
tax liability or that they are not entitled to the full refund they claimed on their return. The
letters instruct taxpayers to pay the additional amount due, create a payment plan, or challenge the
determination of additional liability. A copy of the letter sent to taxpayers is included as Appendix
Figure 1.
Colorado law creates several incentives for taxpayers receiving a NOD to pay the additional tax
liability. First, unpaid tax liability accrues interest at a statutorily provided interest rate. The
applicable rate of interest increases by three percentage points if payment is not made within 30
days of the NOD's receipt. At the time of our study, the interest rate was 3% for payments made
within 30 days of the NOD's receipt and 6% for tax liability that remained unpaid as of that date.3
The standard NOD letter states that �The Statement of Account re�ects a 3% interest discount if
paid within 30 days.�
The second incentive for taxpayers to pay the tax liability reported on the NOD is that Colorado
law imposes �nancial penalties on delinquent taxpayers. This penalty kicks in for taxpayers who have
not paid by 30 days after the NOD is received. The magnitude of the penalty is initially set at 5% of
the outstanding tax liability, and increases by 0.5 percentage points each month, up to a maximum
penalty rate of 12%. Setting up a payment plan does not erase previously imposed penalties but
stops the penalty rate from increasing.4 The standard NOD letter states that �Penalty and interest
have been charged in accordance with Colorado tax law,� but does not provide details about the
existence of the delinquent taxpayer penalty other than a brief reference to the DOR's website.5 In
our sample (described further below), approximately 34% of those who receive the standard NOD
letter pay o� their balance due prior to the statutory deadline, whereas only approximately 4% set
3Colorado Revised Statutes � 39-21-110.5.4Colorado Revised Statutes � 39-22-621(2)(b).5Speci�cally, the notice states: �For more information regarding penalties and interest, please see FYI General 11
at www.TaxColorado.com.�
6
up a payment plan during the same time period.
Finally, taxpayers whose tax liability remains unpaid may face additional �nancial consequences
such as garnishment of wages or bank accounts, referral to a collection agency, a lien or judg-
ment against personal property, and even the sale or seizure of real property. These additional
consequences are not mentioned in the NOD but are included in a subsequent �Notice of Final
Determination and Demand for Payment� that taxpayers may receive if they have not paid their
liability after receiving the NOD.
Approximately 100,000 NOD letters are mailed by DOR each year. The letter population in-
cludes both Colorado taxpayers as well as out-of-state taxpayers who owe Colorado income taxes.
As of July 2016, the total amount owed to the state by on-time �lers was approximately $85 million.
For context, the state budget o�ce estimates that it will collect $220.9 million in taxes owed after
one year (whether from delinquent taxpayers or from individuals owing tax who fail to �le a return)
(O�ce of the State Controller, 2016).
2. Experimental Design
In July 2016, DOR conducted a randomized controlled trial to assess whether minor modi�cations
to the NOD letters were associated with an increase in the fraction of taxpayers paying o� their
liability in full or creating payment plans. The study population consisted of 90,349 Colorado
taxpayers who were identi�ed by DOR as delinquent and were slated to be mailed the NOD letter
in July of 2016. The taxpayers included in the sample had each �led a return for tax year 2015 but
had failed to fully pay the amount reported due on the return.
To implement the experiment, taxpayers were randomly assigned to receive one of four versions
of the NOD letter. Taxpayers in the control group received the same version of the letter that had
been sent to all taxpayers in prior years. As described in the prior section, the control version of
the letter references the existence of a �nancial incentive for timely payment with the following
sentence: �The Statement of Account re�ects a 3% interest discount if paid within 30 days.�
The �detailed penalty� treatment re�ected three modi�cations to the sentence of the letter that
describes the incentive. First, motivated by the literature on loss aversion (Kahneman and Tversky,
1979), the incentive was reframed as a penalty for non-payment as opposed to a bene�t for early
7

payment. Second, the information about the incentive was made more detailed, with more speci�c
information about the interest rate added. Third, the sentence was bolded to further emphasize it
(the sentence appeared in the middle of a paragraph � see Appendix A). The key sentence read:
�By law, if you do not pay within 30 days, the interest rate on your account will double from 3% to
6%.�
To distinguish the importance of emphasizing the existence of the penalty as opposed to the
speci�c information about the penalty, the �generic penalty� treatment was bolded, but contained
less detailed information about the incentive. The key sentence read: �By law, if you do not pay
within 30 days, any penalty associated with your account will increase for each month you do
not pay (until the statutory maximum is reached).� On the one hand, the detailed penalty may
have a larger motivational force than the generic penalty because providing speci�c information
about the penalty makes it more concrete and easier for the taxpayer to understand. On the other
hand, it may be that taxpayers are equally averse to paying any penalty (at least within a broad
range of amounts), in which case the speci�c information may contribute little extra motivational
force. In addition, the extra information contained in the detailed penalty notice may contribute to
information overload (e.g., Bhargava and Manoli, 2015), dampening the notice's motivational force
relative to the generic penalty treatment.
Finally, the �social norm� treatment was motivated by recent studies suggesting that information
about the prevalence of tax compliance can increase payment rates among delinquent taxpayers, and
that such information is most e�ective when the norm is descriptive (versus injunctive), tailored to
the recipient's local area, and referencing the fact that the taxpayer was in the minority composed
of non-compliant taxpayers (Hallsworth et al., 2017). Along these lines, the letter associated with
this treatment included the following statement: �Nine out of ten people in Colorado pay their tax
on time. You are currently in the very small minority of people who have not yet paid.�
Taxpayers were assigned to each of the four treatment groups with equal probabilities. To
improve the precision of the analysis, randomization was strati�ed based on the taxpayer's age,
balance due, whether the taxpayer's return was �led before the due date, and whether the taxpayer
was a Colorado resident.
8
3. Data
To analyze the results of the experiment, we utilized anonymized data on taxpayer payments and
payment plan creation from the universe of delinquent taxpayers for the state of Colorado (101,068
taxpayers). This data was provided to us by DOR. In addition to these outcome variables, the
data included information on taxpayer age, zip code of residence, tax balance due, and whether
the taxpayer's return was �led on time. We supplement the DOR data in our analysis with zip
code level information from the American Communities Survey (ACS) on income and educational
attainment.
Our main outcome variables relate to whether taxpayers made a payment on their account.
Speci�cally, we track whether a taxpayer fully pays o� the outstanding balance on his or her
account, as well as whether a taxpayer makes a partial payment by creating a payment plan with
DOR. DOR categorizes taxpayers into three groups: those who paid o� their balance in full by
Final Determination (FD), the date corresponding (approximately) to the statutory deadline of 30
days from the taxpayer's receipt of the Notice of De�ciency6; those who created a payment plan
by FD; and those who took no action before FD. For taxpayers who made multiple payments but
did not create a payment plan, we add up the payment amounts and use the last date of payment
to determine if and when the taxpayer successfully paid o� their balance. Taxpayers who had bills
from before the December 31, 2015 �ling period or who had multiple bills were excluded from the
sample. The �nal sample consisted of 90,349 taxpayers.
4. Results
Table 1 provides descriptive statistics of our sample population. Column 1 describes the character-
istics of the delinquent taxpayers comprising our sample. The mean taxpayer is approximately 44
years old and owes a balance due of $515. Not surprisingly, the vast majority of our sample are
Colorado residents. Columns 2 through 5 investigate the balance of taxpayer characteristics across
treatment groups. Rows 1 through 4 show balance across the available taxpayer-level characteristics:
age, balance due, whether the return was received by the �ling deadline, and whether the taxpayer
was a Colorado resident. We also investigate balance of local demographic characteristics of the
6In practice, DOR assigns the date of FD as 45 days from the date the letter was queued to be mailed.
9
taxpayer at the zip code level including median household income and bachelor's degree completion
rates. In contrast to the taxpayer-level characteristics, we observe economically small but precisely
estimated di�erences across treatment groups in these local demographic variables. To address this,
we include either local demographics or zip code �xed e�ects in our preferred empirical speci�cations
below.
Our baseline empirical speci�cation is a linear probability model that takes the following form:
yi = α+ βDPDPi + βGPGPi + βSNSNi + γxi + εi
for taxpayer i, where y indicates the binary outcome of interest (paying a bill or making a payment
plan), DPi, GPi, and SNi are indicators for being assigned to the detailed penalty, general penalty,
or social norms treatment group, respectively, and xi is a vector of taxpayer-speci�c characteristics.7
A. Main Results
i. Full Payments
Our �rst analysis considers the e�ect of the notice variants on payments by taxpayers. The out-
come we consider is an indicator for whether the taxpayer has paid o� his or her balance in full
by the statutory deadline (30 days from receipt of the NOD letter).8 Table 2 presents the results
of this analysis. Among control group members, just over one-third of noti�ed taxpayers made a
full payment by the statutory deadline, suggesting substantial room for improvement in tax compli-
ance. Column 1 presents our baseline speci�cation, which includes indicators for treatment group
assignments and no control variables. We estimate that receiving the detailed penalty treatment
induces a 0.9 percentage point increase in the proportion of delinquent taxpayers who pay o� their
balance in full by the statutory deadline, relative to the control NOD letter. The estimated e�ect
is statistically signi�cant, and represents a 2.6 percent increase relative to mean payment rate un-
der the control NOD letter. The estimated e�ect of the generic penalty is also positive, but the
estimated coe�cient is approximately half as large in magnitude as the detailed penalty and is not
statistically di�erent from zero. The estimated e�ect of the social norms penalty is near zero in
7The results are qualitatively similar when estimated with a probit model.8Because we do not observe the exact date the letter was received, we follow DOR and use as our cuto� 45 days
from the date the letter was queued to be mailed.
10
magnitude and is not statistically signi�cant.
Column 2 adds controls for the individual characteristics described in Table 1: taxpayer age, state
residency, late �ling status, and balance due.9 The addition of these controls does not appreciably
change the estimated coe�cients, consistent with the observed balance of individual characteristics
across treatment groups. In contrast, controlling for the local demographic characteristics from
Table 1 � median income and college completion rates � in Column 3 slightly raises the magnitude
of the estimated coe�cients. Finally, adding zip code level �xed e�ects (Column 4) yields our
preferred speci�cation. The estimated e�ect of the detailed penalty treatment on payments is 1.1
percentage points, representing a 3.2 percent increase over the control group. The estimated e�ect of
the generic penalty treatment is 0.5 percentage points, and the estimated e�ect of the social norms
treatment is approximately 0.2 percentage points, though neither of these e�ects are statistically
signi�cant. The analysis thus suggests that the speci�c penalty treatment is the most e�ective, and
is associated with an economically modest increase in the fraction of delinquent taxpayers paying
o� their balance in full by the statutory deadline.
ii. Payment Plan Creation
Table 3 turns to our next outcome of interest, a taxpayer's partial payment of their outstanding
balance through the creation of a payment plan. For reference, Column 1 replicates our preferred
speci�cation on the likelihood of making a full payment. Column 2 repeats that speci�cation
using payment plan creation as the outcome variable. We observe a similar pattern as with full
payments. The results suggest that the detailed penalty treatment was the most e�ective at inducing
taxpayers to create payment plans � it was associated with a statistically signi�cant 0.5 percentage
point increase in payment plans, representing approximately an 11 percent increase relative to the
control group mean of 4.5 percent. The e�ect of the other two treatments were near zero and not
statistically signi�cant.
Finally, because the treatments might cause taxpayers to switch between paying o� their balance
and payment plan creation, Column 3 of Table 3 investigates the e�ect of the treatment on the
likelihood of taxpayers either making a full payment or creating a payment plan. The results
9For age and balance due, controls include continuous measures of age and balance due, the age and balancecategories used in randomization strati�cation, and the interaction of the continuous and categorical variables. Thespeci�cation also includes an indicator for individuals for whom age is missing (2472 individuals).
11
suggest that the detailed penalty treatment increases the fraction of taxpayers making any payment
by 1.6 percentage points, a 4.1 percent increase relative to the control group mean. The generic
penalty version was associated with an increase relative to the control of approximately half of this
magnitude. Again, we estimate the e�ect of the social norms letter to be near-zero.
B. Short versus Longer Term Outcomes
Interpreting the economic signi�cance of our estimates in the prior subsection requires understanding
whether the intervention induced payments by new, non-delinquent taxpayers, or simply sped up
payments by taxpayers who would have eventually paid even had they not received the treatment
intervention. For example, (Hallsworth et al., 2017) �nds large e�ects of NOD letters emphasizing
various types of social norms compared to the standard NOD on payments made within three weeks;
however, these treatment e�ects fade and many are no longer signi�cant when considering payment
rates 70 days after the letter's mailing, suggesting that the treatment messages primarily increased
the speed at which recipients paid their taxes rather than generating new payments. Our analyses
thus far have focused on taxpayer actions taken by the statutory deadline using DOR's de�nition
of Final Determination to be 45 days from the date the notice was queued to be mailed. This is
the relevant cuto� for the imposition of �nancial penalties, but it is possible that the modi�cations
to the NOD letter could have a�ected behavior apart from that speci�c margin as well, such as by
inducing taxpayers to make their payments earlier than they would have otherwise.
Figure 1 presents the rate of full payments for each experimental group by day for the �rst 100
days after the letter's mailing. We focus only on full payments for this analysis because we lack
data on the precise timing of payment plans created after the statutory deadline. Payment rates
steadily increase over the �rst month for each group with roughly one third of taxpayers making a
full payment by the statutory deadline of 45 days and increasing to roughly 40 percent by 100 days.
The �gure shows that deviations by experimental group emerge around 30 days after the notice was
sent and remain through the end of the follow-up period.
Table 4 estimates the e�ects of the treatments on taxpayer payments up to 100 days from the
letter's mailing, varying the cuto� date across di�erent time windows. The results show the e�ect is
largest at the NOD threshold but suggest that the e�ects persist (albeit with a smaller magnitude) as
far as 100 days from letter's mailing. The results in the table thus provide suggestive evidence that
12
the treatments cause some delinquent taxpayers to pay o� their balance when they would not have
otherwise done so in the months following receipt of the notice. That the estimated e�ects of the
treatments are smaller in magnitude when assessed at the later dates suggests that the treatments
cause other taxpayers to move up the timing of the payments they would have otherwise made
eventually.
C. Payment E�ects by Balance Due
Our results so far suggest that the penalty-design notices a�ect the number of taxpayers who choose
to pay o� their balance due or set up a payment plan. However, understanding how this reduction in
the number of delinquent taxpayer accounts maps into revenue requires understanding heterogeneity
in the treatment e�ect by taxpayers' balance due.
We �nd strong evidence of heterogeneity along this margin. Table 5 considers our baseline
speci�cation separately by balance due tertile. For the �rst tertile (balances due of less than $95),
we �nd that both penalty notices are e�ective. The detailed penalty increases the likelihood of full
payment or payment plan creation by 1.8 percentage points (a 3.1 percent increase relative to the
control) and the generic penalty increases payments or payment plans by 1.2 percentage points (a 2.1
percent relative increase). Because the balance due is relatively low, it is perhaps not surprising that
the treatment e�ect for taxpayers in this tertile is driven by full payments rather than the creation
of payment plans. For taxpayers in the second tertile (balances due between $95 and $433), the
e�ect of the detailed penalty is similar in percentage point terms (a 1.9 percentage point increase)
but somewhat larger in relative terms (a 6.1 percent increase relative to the control). In contrast, we
estimate the e�ect of the generic penalty to be 0.3 percentage points, and statistically insigni�cant.
Finally, neither penalty treatment is statistically signi�cant for taxpayers in the third tertile (above
$433), although we do observe a statistically signi�cant increase in payment plan creation associated
with the detailed penalty. In each tertile, the e�ect of the social norms treatment is economically
small and statistically insigni�cant.10
10Other papers in this literature focus on a distribution of taxpayers with higher balances due (Hallsworth et al.,2017; Meiselman, 2018). If one were to extrapolate our observed e�ect to the distribution of balances due in thosepapers, it would imply a zero e�ect for both social norms and penalty treatments.
13
D. Demographic Heterogeneity in Treatment E�ect
In this section we explore several other dimensions along which treatment e�ects might di�er.
i. Age
One way that our treatment messages could a�ect taxpayer behavior is that the notices increase the
salience of the penalties for delinquent payments. This may be particularly important for younger
taxpayers who have less familiarity with the �nancial consequences of non-compliance.
Table 6 investigates heterogeneity in the treatment e�ects by age. For ease of interpretation,
Table 6 divides the sample into taxpayers above and below the median age in the sample (43 years
old), in columns 1 and 2, respectively, but the results are similar for other cuts of the data. The
results show that the entire treatment e�ect appears driven by taxpayers below the median age in
our sample, for whom receiving the detailed penalty notice increases the fraction of taxpayers taking
action by almost 10 percent (2.7 percentage points). In contrast, the size of the e�ect for above
median age taxpayers is close to zero. Again, we observe a similar pattern (of lesser magnitude)
with respect to the generic penalty NOD.
ii. State Residence
While the majority of the delinquent taxpayers reside in the state of Colorado, 10 percent of our
sample lives outside the state. This could be important for two reasons. In terms of the penalty
treatment, out-of-state taxpayers may be less familiar with Colorado laws and, therefore, communi-
cations emphasizing the �nancial penalties may be more e�ective with this subgroup. With regards
to the social norms, the treatment message describes the high compliance rate of Colorado residents,
not taxpayers in general. Therefore, it is possible that non-Colorado residents may be less likely to
alter their behavior in response to this information.
Columns 3 and 4 of Table 6 consider the e�ect of the treatment messages separately for Colorado
residents and non-residents, respectively. We �nd that the size of the estimated treatment e�ect of
the detailed penalty message is twice as large for non-residents, consistent with the hypothesis that
out-of-state taxpayers may be less familiar with Colorado tax penalties; however, due to the small
sample size of the non-resident population, the point estimate is not statistically signi�cant, despite
14
its larger magnitude. We also �nd that the e�ect of the social norms treatment is near zero for both
residents and non-residents suggesting that the null e�ect of this treatment arm in the main results
section is not being driven by the non-response of out-of-state taxpayers.
iii. Income and Education
While our individual-level demographic data on taxpayers in our sample is limited, we do have
data on the taxpayer's zip code of residence. In this section, we consider how our treatment e�ects
di�er by neighborhood demographic characteristics. Speci�cally, we focus on two demographic char-
acteristics that are commonly associated with �nancial sophistication: median income and college
attainment. If �nancially sophisticated taxpayers are already aware of penalties for non-compliance,
we might expect that our treatment messages would have a larger e�ect in neighborhoods with lower
incomes or levels of education.
Columns 5 through 8 of Table 6 �nd evidence consistent with this hypothesis: treatment e�ects
are almost twice as large for taxpayers in higher-income areas and slightly higher in areas with
higher college attainment, although the di�erences are not statistically signi�cant.
Finally, the preceding analyses have focused on demographic characteristics individually, but it
is likely that these characteristics are correlated with one another. For example, it could be that
our observed di�erences in treatment e�ect by age could be driven by younger taxpayers having
lower incomes. Table 7 investigates this by including interaction terms for balance due, age, income,
education, and Colorado residency. The results suggest that age remains an important determinant
for the e�ectiveness of the notice even after controlling for the other taxpayer characteristics we
observe. Notably, for the subgroup of taxpayers who are below median age and whose balance
due is in the lowest tertile, our results suggest that the detailed penalty raises payment rates by
approximately 3.0 percentage points (7.8 percent) relative to the control.
5. Discussion
We document di�erences in the e�ectiveness of delinquency notices sent to taxpayers based on
whether the notices make salient the details of �nancial incentives for timely payment. In contrast,
we �nd that simply emphasizing the existence of a penalty, or emphasizing social norms against late
15

payment, exert smaller or near-zero e�ects. Because of our large sample, these e�ects are precisely
estimated.
Our �nding that small di�erences in notice wording can a�ect behavior underscores the im-
portance of tax authorities paying attention to such issues when determining how to communicate
with taxpayers. Reducing the total number of delinquent taxpayer accounts is valuable for taxing
authorities because it reduces costs associated with further outreach to delinquent taxpayers such
as additional mailings, phone calls, or enforcement actions. For many taxpayers, the e�ects of the
presentational di�erences we study are modest � an increase in the payment rate of at most a few
percent. However, delinquency notices of the type we study are already routinely sent to taxpayers;
there is essentially no additional cost to designing the notice to have a more e�ective presentation
rather than a less e�ective one. And to the extent a tax authority is focusing on reaching one of
the groups of taxpayers we observe to be particularly responsive (such as younger taxpayers), the
bene�ts of the more e�ective presentation is likely to be greater.
Comparing our results to prior �ndings from behavioral public �nance, our results reinforce some
lessons and are at odds with others. One example of divergence lies in the e�ectiveness of social
norms messaging. For example, Hallsworth et al. (2017) studies delinquent taxpayers in the UK and
�nds that emphasizing social norms using messages similar to ours dramatically raises payments.
Our �nding of a zero e�ect may re�ect di�erences in preexisting beliefs (UK citizens may have been
less aware of the high payment rate than Colorado residents) or di�erent degrees of importance
attached to this type of social norm between citizens of the UK and Colorado.11
With respect to our �nding on the e�ectiveness of �nancial penalties, here the results are, largely
speaking, more in keeping with the other contemporary work on this topic. Chirico et al. (2017) and
Meiselman (2018) investigate the e�ect of communications by tax authorities in U.S. municipalities
on property tax payment and income tax �ling, respectively, and �nd that notices that emphasize
�nancial penalties result in higher payment rates than notices emphasizing social norms. Chirico
et al. (2017) �nd e�ects of substantially larger magnitudes than ours, although for the most part
the con�dence interval for their estimated e�ects overlaps with ours.12 One possible explanation
for the smaller e�ect we observe could be that a larger number of taxpayers in our sample were
11Meiselman (2018) also �nds that social norms are not e�ective in a di�erent American context, suggesting thesource of the di�erence may not simply be Colorado-speci�c.
12Meiselman (2018) also �nds large e�ects, but the outcome he studies is tax �ling, not delinquent payments.
16

already aware that the state could impose a penalty compared to fewer taxpayers aware of the
�nancial consequences of nonpayment of property taxes to a municipality (such as a property tax
lien). Alternatively, it could be that taxpayers were more concerned with avoiding the penalties
for nonpayment of property taxes that Chirico et al. (2017) emphasized in their letters (such as
imposition of a lien) relative to the relatively modest �nancial penalties described in the letter by
DOR.
References
Allingham, Michael G, and Agnar Sandmo. 1972. �Income Tax Evasion: A Theoretical Anal-
ysis.� Journal of Public Economics, 1(3-4): 323�338.
Armour, Philip. 2018. �The Role of Information in Disability Insurance Application: An Analy-
sis of the Social Security Statement Phase-In.� American Economic Journal: Economic Policy,
10(3): 1�41.
Barr, Andrew, and Sarah Turner. 2018. �A Letter and Encouragement: Does Information
Increase Postsecondary Enrollment of UI Recipients?� American Economic Journal: Economic
Policy, 10(3): 42�68.
Bhargava, Saurabh, and Dayanand Manoli. 2015. �Psychological Frictions and the Incomplete
Take-up of Social Bene�ts: Evidence from an IRS Field Experiment.� American Economic Review,
105(11): 3489�3529.
Blumenthal, Marsha, Charles Christian, and Joel Slemrod. 1998. �The determinants of
income tax compliance: Evidence from a controlled experiment in Minnesota.�
Bérgolo, Marcelo L., Rodrigo Ceni, Guillermo Cruces, Matias Giaccobasso, and Ri-
cardo Perez-Truglia. 2017. �Tax Audits as Scarecrows: Evidence from a Large-Scale Field
Experiment.� National Bureau of Economic Research Working Paper 23631.
Castro, Lucio, and Carlos Scartascini. 2015. �Tax Compliance and Enforcement in the Pampas:
Evidence from a Field Experiment.� Journal of Economic Behavior & Organization, 116: 65�82.
17
Chirico, Michael, Robert Inman, Charles Loe�er, John MacDonald, and Holger Sieg.
2017. �Procrastination and Property Tax Compliance: Evidence from a Field Experiment.� Na-
tional Bureau of Economic Research Working Paper 23243.
Del Carpio, Lucia. 2013. �Are the Neighbors Cheating? Evidence from a Social Norm Experiment
on Property Taxes in Peru.� Working Paper.
Deshpande, Manasi, and Yue Li. 2017. �Who Is Screened Out? Application Costs and the
Targeting of Disability Programs.� National Bureau of Economic Research Working Paper 23472.
Dwenger, Nadja, Henrik Kleven, Imran Rasul, and Johannes Rincke. 2016. �Extrinsic
and Intrinsic Motivations for Tax Compliance: Evidence from a Field Experiment in Germany.�
American Economic Journal: Economic Policy, 8(3): 203�32.
Finkelstein, Amy, and Matthew J. Notowidigdo. 2018. �Take-up and Targeting: Experimental
Evidence from SNAP.� National Bureau of Economic Research Working Paper 24652.
Gangl, Katharina, Benno Torgler, Erich Kirchler, and Eva Hofmann. 2014. �E�ects of
Supervision on Tax Compliance: Evidence from a Field Experiment in Austria.� Economics
Letters, 123(3): 378�382.
Gemmell, Norman, and Marisa Ratto. 2018. �The E�ects of Penalty Information on Tax
Compliance: Evidence from a New Zealand Field Experiment.� National Tax Journal.
Goldin, Jacob, Tatiana Homono�, and Will Tucker-Ray. 2017. �Retirement Contribution
Rate Nudges and Plan Participation: Evidence from a Field Experiment.� American Economic
Review, 107(5): 456�61.
Guyton, John, Dayanand S Manoli, Brenda Schafer, and Michael Sebastiani. 2016.
�Reminders & Recidivism: Evidence from Tax Filing & EITC Participation Among Low-income
Non�lers.� National Bureau of Economic Research.
Hallsworth, Michael, John A List, Robert D Metcalfe, and Ivo Vlaev. 2017. �The Behav-
ioralist as Tax Collector: Using Natural Field Experiments to Enhance Tax Compliance.� Journal
of Public Economics, 148: 14�31.
18
Kahneman, Daniel, and Amos Tversky. 1979. �Prospect Theory: An Analysis of Decision
Under Risk.� Econometrica, 263�291.
Kettle, Stewart, Marco Hernandez, Simon Ruda, and Michael A Sanderson. 2016. �Be-
havioral Interventions in Tax Compliance: Evidence from Guatemala.� World Bank Group Work-
ing Paper 7690.
Kleven, Henrik Jacobsen, Martin B Knudsen, Claus Thustrup Kreiner, Søren Pedersen,
and Emmanuel Saez. 2011. �Unwilling or Unable to Cheat? Evidence from a Tax Audit
Experiment in Denmark.� Econometrica, 79(3): 651�692.
Krishna, Aradhna, and Joel Slemrod. 2003. �Behavioral Public Finance: Tax Design as Price
Presentation.� International Tax and Public Finance, 10(2): 189�203.
Manoli, Dayanand S, and Nicholas Turner. 2014. �Nudges and Learning: Evidence from
Informational Interventions for Low-income Taxpayers.� National Bureau of Economic Research.
Meiselman, Ben S. 2018. �Ghostbusting in Detroit: Evidence on Non�lers from a Controlled Field
Experiment.� Journal of Public Economics, 158: 180�193.
O�ce of the State Controller, DPA. 2016. �Colorado Comprehensive Annual Financial Report.�
Perez-Truglia, Ricardo, and Ugo Troiano. 2015. �Shaming Tax Delinquents: Theory and
Evidence from a Field Experiment in the United States.� National Bureau of Economic Research
Working Paper 21264.
Slemrod, Joel. 2018. �Tax Compliance and Enforcement: New Research and its Policy Implica-
tions.� NBER Working Paper 24799.
19
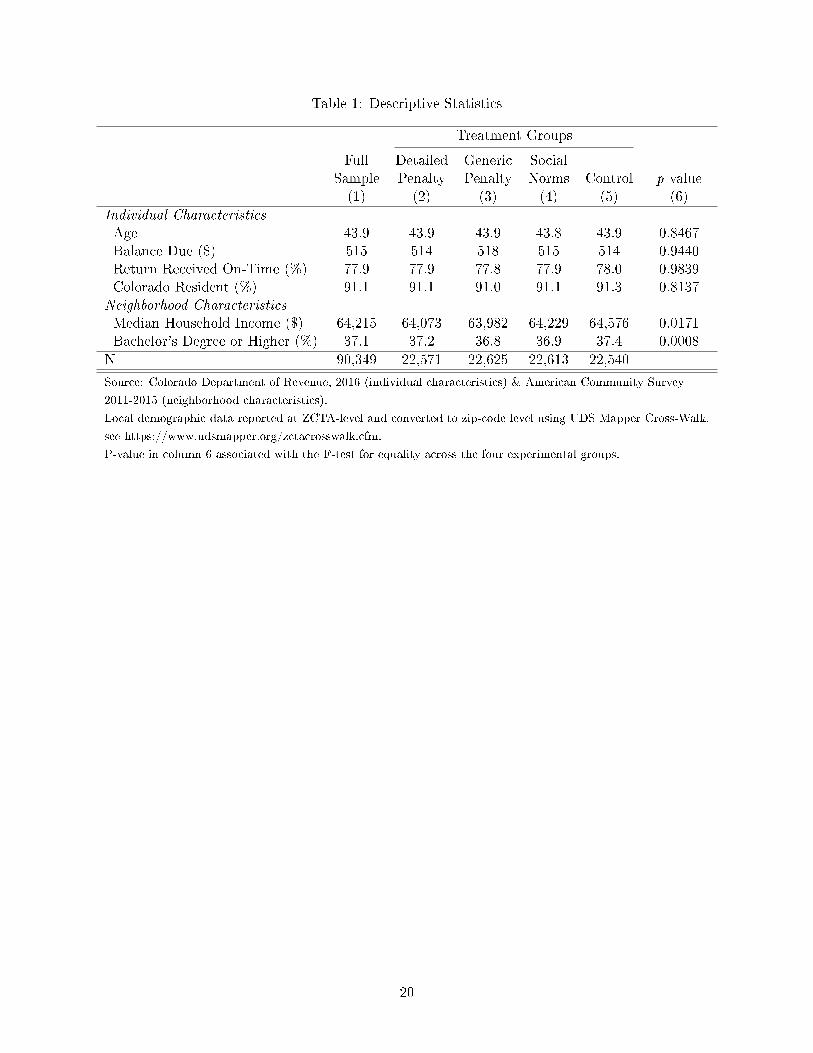
Table 1: Descriptive Statistics
Treatment Groups
Full Detailed Generic Social
Sample Penalty Penalty Norms Control p value
(1) (2) (3) (4) (5) (6)
Individual Characteristics
Age 43.9 43.9 43.9 43.8 43.9 0.8467
Balance Due ($) 515 514 518 515 514 0.9440
Return Received On-Time (%) 77.9 77.9 77.8 77.9 78.0 0.9839
Colorado Resident (%) 91.1 91.1 91.0 91.1 91.3 0.8137
Neighborhood Characteristics
Median Household Income ($) 64,215 64,073 63,982 64,229 64,576 0.0171
Bachelor's Degree or Higher (%) 37.1 37.2 36.8 36.9 37.4 0.0008
N 90,349 22,571 22,625 22,613 22,540
Source: Colorado Department of Revenue, 2016 (individual characteristics) & American Community Survey
2011-2015 (neighborhood characteristics).
Local demographic data reported at ZCTA-level and converted to zip-code level using UDS Mapper Cross-Walk,
see https://www.udsmapper.org/zctacrosswalk.cfm.
P-value in column 6 associated with the F-test for equality across the four experimental groups.
20

Table 2: E�ect of Notice on Payment Rate by Treatment
(1) (2) (3) (4)
Detailed Penalty 0.0089∗∗ 0.0086∗∗ 0.0096∗∗ 0.0110∗∗∗
(0.0045) (0.0040) (0.0040) (0.0041)
Generic Penalty 0.0046 0.0046 0.0066∗ 0.0050
(0.0043) (0.0037) (0.0036) (0.0036)
Social Norms -0.0020 0.0001 0.0015 0.0018
(0.0046) (0.0040) (0.0041) (0.0041)
Individual Characteristics No Yes Yes Yes
Neighborhood Characteristics No No Yes No
Zip Code Fixed E�ects No No No Yes
Control Group Mean 0.3394 0.3394 0.3394 0.3394
N 90,349 90,349 90,349 90,349
Outcomes: indicator for making a full payment within 45 days of NOD.
Individual characteristics include age controls, balance controls, Colorado residency, and
whether the return was �led on time. Age controls include a continuous age variable, dummy
variables for four age categories, and an interaction of the dummies with the continuous
age variable. Similarly, the balance controls include a continuous variable for the log of,
the balance due, dummies for six balance categories, and an interaction of the dummies with
the continuous balance variable.
Neighborhood characteristics include ZCTA-level median household income and college.
attainment.
Robust standard error in parentheses.
* p < 0.1, ** p < 0.05, *** p < 0.01.
21
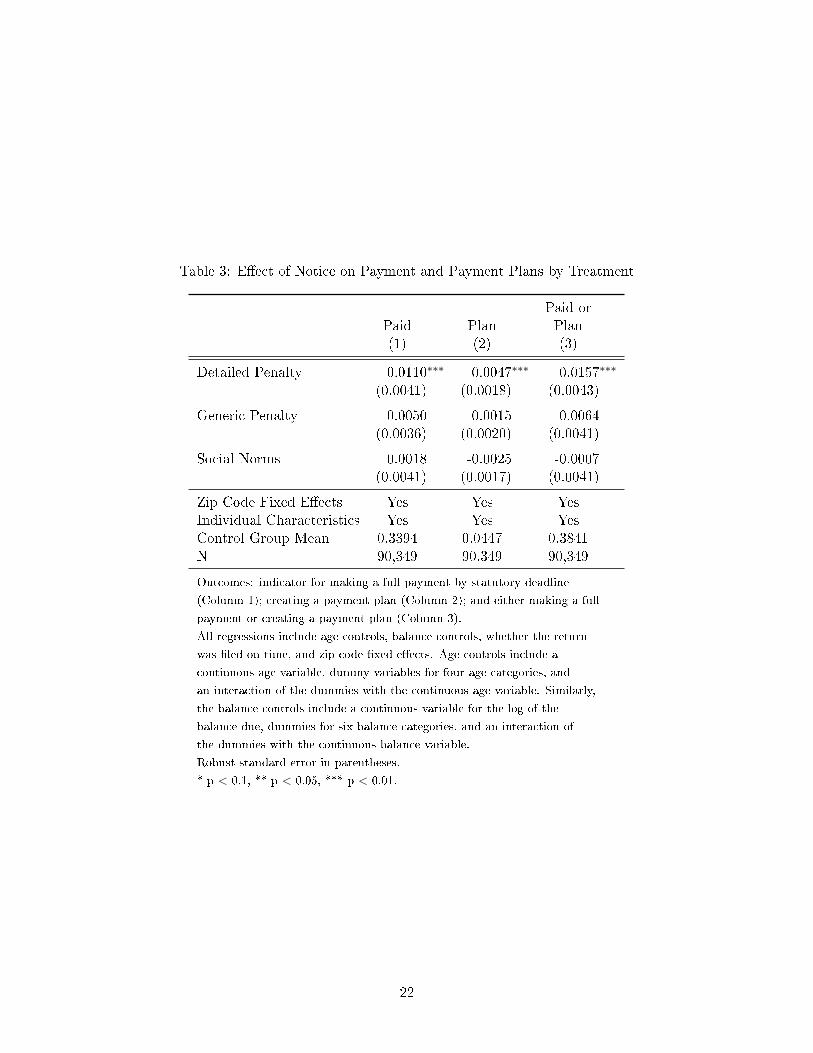
Table 3: E�ect of Notice on Payment and Payment Plans by Treatment
Paid or
Paid Plan Plan
(1) (2) (3)
Detailed Penalty 0.0110∗∗∗ 0.0047∗∗∗ 0.0157∗∗∗
(0.0041) (0.0018) (0.0043)
Generic Penalty 0.0050 0.0015 0.0064
(0.0036) (0.0020) (0.0041)
Social Norms 0.0018 -0.0025 -0.0007
(0.0041) (0.0017) (0.0041)
Zip Code Fixed E�ects Yes Yes Yes
Individual Characteristics Yes Yes Yes
Control Group Mean 0.3394 0.0447 0.3841
N 90,349 90,349 90,349
Outcomes: indicator for making a full payment by statutory deadline
(Column 1); creating a payment plan (Column 2); and either making a full
payment or creating a payment plan (Column 3).
All regressions include age controls, balance controls, whether the return
was �led on time, and zip code �xed e�ects. Age controls include a
continuous age variable, dummy variables for four age categories, and
an interaction of the dummies with the continuous age variable. Similarly,
the balance controls include a continuous variable for the log of the
balance due, dummies for six balance categories, and an interaction of
the dummies with the continuous balance variable.
Robust standard error in parentheses.
* p < 0.1, ** p < 0.05, *** p < 0.01.
22
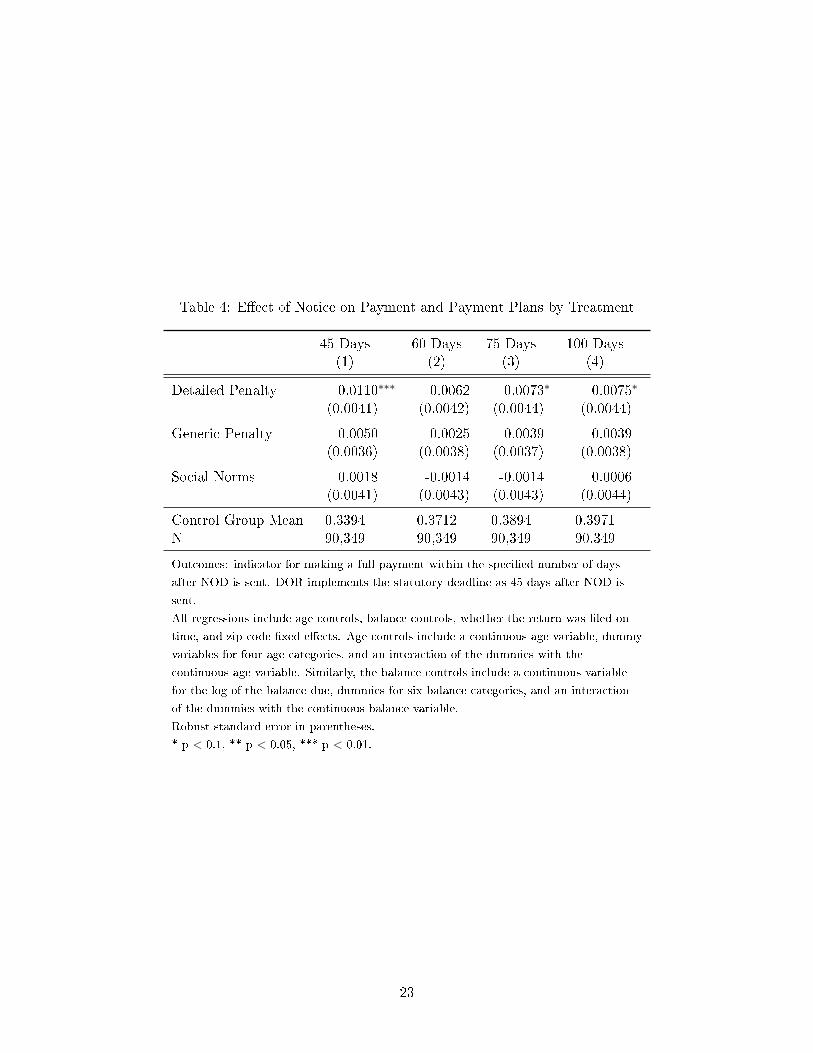
Table 4: E�ect of Notice on Payment and Payment Plans by Treatment
45 Days 60 Days 75 Days 100 Days
(1) (2) (3) (4)
Detailed Penalty 0.0110∗∗∗ 0.0062 0.0073∗ 0.0075∗
(0.0041) (0.0042) (0.0044) (0.0044)
Generic Penalty 0.0050 0.0025 0.0039 0.0039
(0.0036) (0.0038) (0.0037) (0.0038)
Social Norms 0.0018 -0.0014 -0.0014 0.0006
(0.0041) (0.0043) (0.0043) (0.0044)
Control Group Mean 0.3394 0.3712 0.3894 0.3971
N 90,349 90,349 90,349 90,349
Outcomes: indicator for making a full payment within the speci�ed number of days
after NOD is sent. DOR implements the statutory deadline as 45 days after NOD is
sent.
All regressions include age controls, balance controls, whether the return was �led on
time, and zip code �xed e�ects. Age controls include a continuous age variable, dummy
variables for four age categories, and an interaction of the dummies with the
continuous age variable. Similarly, the balance controls include a continuous variable
for the log of the balance due, dummies for six balance categories, and an interaction
of the dummies with the continuous balance variable.
Robust standard error in parentheses.
* p < 0.1, ** p < 0.05, *** p < 0.01.
23

Table 5: Treatment E�ect Heterogeneity by Balance Due
Panel A: Paid
Low Medium High
Balance Balance Balance
(1) (2) (3)
Detailed Penalty 0.0194∗∗ 0.0173∗∗ -0.0043
(0.0084) (0.0078) (0.0054)
Generic Penalty 0.0127∗ 0.0072 -0.0031
(0.0076) (0.0073) (0.0057)
Social Norms 0.0053 0.0069 -0.0066
(0.0075) (0.0081) (0.0055)
Control Group Mean 0.5819 0.2736 0.1605
N 30,261 30,020 30,068
Panel B: Plan
Detailed Penalty -0.0012 0.0017 0.0121∗∗
(0.0007) (0.0031) (0.0048)
Generic Penalty -0.0003 -0.0047 0.0075
(0.0008) (0.0029) (0.0052)
Social Norms -0.0002 -0.0051 -0.0037
(0.0008) (0.0032) (0.0044)
Control Group Mean 0.0021 0.0346 0.0979
N 30,261 30,020 30,068
Panel C: Paid or Plan
Detailed Penalty 0.0182∗∗ 0.0190∗∗ 0.0077
(0.0085) (0.0076) (0.0066)
Generic Penalty 0.0124 0.0025 0.0043
(0.0076) (0.0077) (0.0076)
Social Norms 0.0051 0.0018 -0.0103
(0.0076) (0.0083) (0.0067)
Control Group Mean 0.5841 0.3082 0.2584
N 30,261 30,020 30,068
Outcomes: indicator for making a full payment by statutory deadline
(Panel A); creating a payment plan (Panel B); and either making a full
payment or creating a payment plan (Panel C).
Columns 1-3 present results by the amount of the balance due, where
low balance is less than $95, medium balance is between $95 and $433,
and high balance is more than $433.
All regressions include age controls, balance controls, whether the
return was �led on time, and zip code �xed e�ects. Age controls
include a continuous age variable, dummy variables for four age
categories, and an interaction of the dummies with the continuous
age variable. Similarly, the balance controls include a continuous
variable for the log of the balance due, dummies for six balance
categories, and an interaction of the dummies with the continuous
balance variable.
Robust standard error in parentheses.
* p < 0.1, ** p < 0.05, *** p < 0.01.
24

Table6:Treatm
entE�ectHeterogeneity
byDem
ographicCharacteristics
IndividualLevel
Zip
CodeLevel
MedianAge
CO
Resident
MedianIncome
MedianCollegeAttainment
Above
Below
Yes
No
Above
Below
Above
Below
(1)
(2)
(3)
(4)
(5)
(6)
(7)
(8)
Detailed
Penalty
0.0069
0.0269∗∗
∗0.0312
0.0150∗∗
∗0.0113∗∗
0.0210∗∗
∗0.0137∗∗
0.0174∗∗
∗
(0.0062)
(0.0058)
(0.0206)
(0.0044)
(0.0056)
(0.0065)
(0.0064)
(0.0056)
GenericPenalty
-0.0020
0.0187∗∗
∗-0.0054
0.0069∗
0.0042
0.0093
0.0033
0.0091
(0.0057)
(0.0061)
(0.0224)
(0.0042)
(0.0052)
(0.0064)
(0.0058)
(0.0058)
SocialNorm
s-0.0045
0.0065
-0.0001
-0.0006
-0.0026
0.0020
0.0033
-0.0046
(0.0060)
(0.0061)
(0.0225)
(0.0042)
(0.0057)
(0.0060)
(0.0062)
(0.0054)
ControlGroupMean
0.4856
0.2825
0.4297
0.3797
0.4339
0.3332
0.4456
0.3213
N44,437
43,440
8,005
82,344
45,051
45,298
44,834
45,515
Outcome:
indicatorformakingafullpaymentbystatutory
deadlineorcreatingapaymentplan.
Allregressionsincludeagecontrols,balance
controls,whether
thereturn
was�ledontime,andzipcode�xed
e�ects.Agecontrolsincludea
continuousagevariable,dummyvariablesforfouragecategories,andaninteractionofthedummieswiththecontinuousagevariable.Sim
ilarly,
thebalance
controlsincludeacontinuousvariableforthelogofthebalance
due,dummiesforsixbalance
categories,sndaninteractionofthe
dummieswiththecontinuousbalance
variable.
Robust
standard
errorin
parentheses.
*p<
0.1,**p<
0.05,***p<
0.01.
25
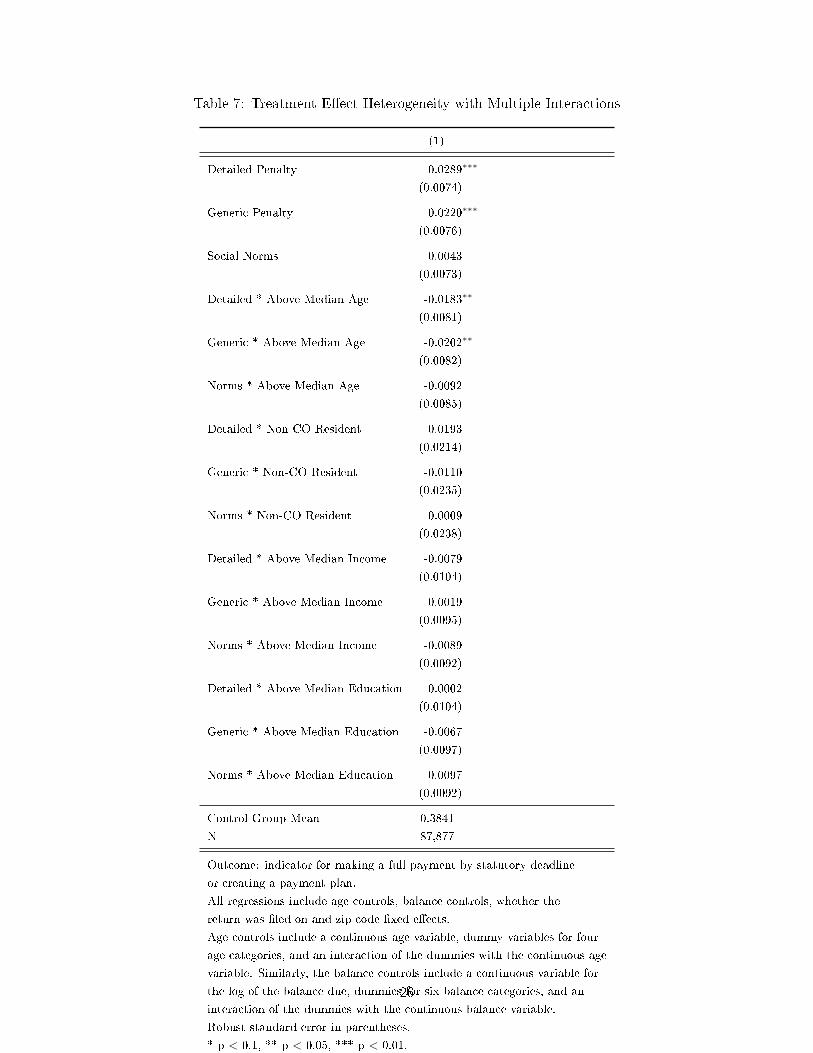
Table 7: Treatment E�ect Heterogeneity with Multiple Interactions
(1)
Detailed Penalty 0.0289∗∗∗
(0.0074)
Generic Penalty 0.0220∗∗∗
(0.0076)
Social Norms 0.0043
(0.0073)
Detailed * Above Median Age -0.0183∗∗
(0.0081)
Generic * Above Median Age -0.0202∗∗
(0.0082)
Norms * Above Median Age -0.0092
(0.0085)
Detailed * Non-CO Resident 0.0193
(0.0214)
Generic * Non-CO Resident -0.0110
(0.0235)
Norms * Non-CO Resident 0.0009
(0.0238)
Detailed * Above Median Income -0.0079
(0.0104)
Generic * Above Median Income -0.0019
(0.0095)
Norms * Above Median Income -0.0089
(0.0092)
Detailed * Above Median Education 0.0002
(0.0104)
Generic * Above Median Education -0.0067
(0.0097)
Norms * Above Median Education 0.0097
(0.0092)
Control Group Mean 0.3841
N 87,877
Outcome: indicator for making a full payment by statutory deadline
or creating a payment plan.
All regressions include age controls, balance controls, whether the
return was �led on and zip code �xed e�ects.
Age controls include a continuous age variable, dummy variables for four
age categories, and an interaction of the dummies with the continuous age
variable. Similarly, the balance controls include a continuous variable for
the log of the balance due, dummies for six balance categories, and an
interaction of the dummies with the continuous balance variable.
Robust standard error in parentheses.
* p < 0.1, ** p < 0.05, *** p < 0.01.
26
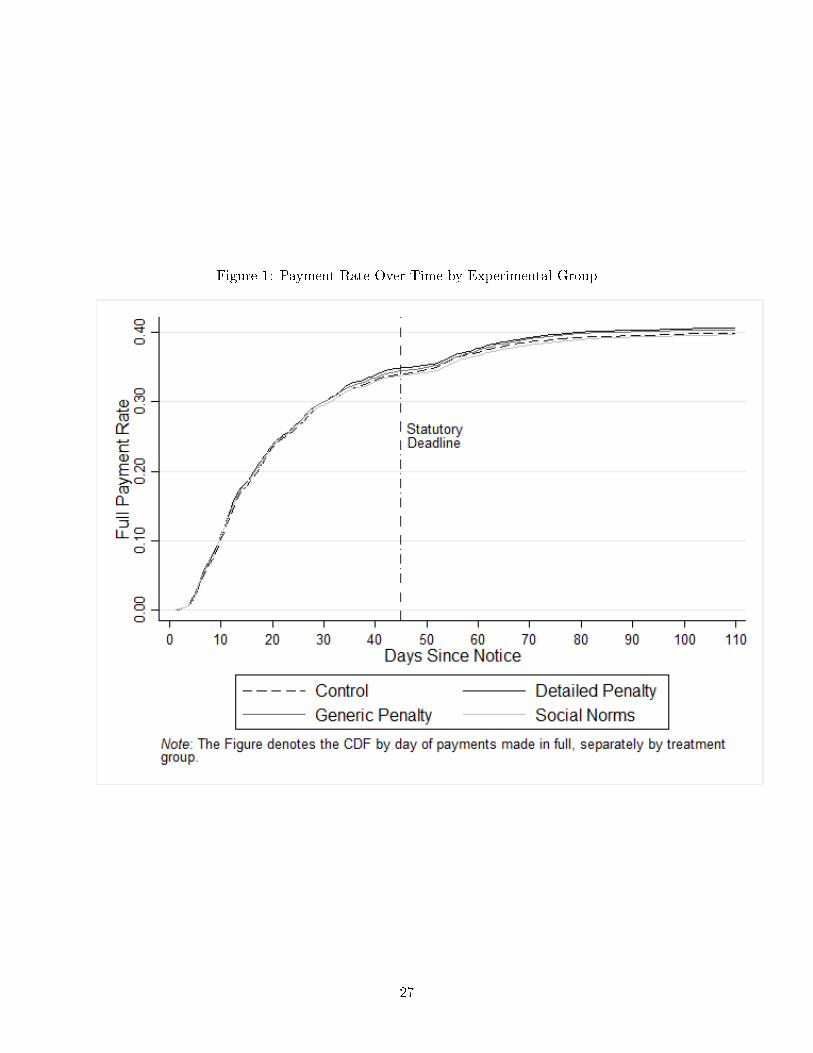
Figure 1: Payment Rate Over Time by Experimental Group
27

Appendix A. Notice of De�ciency Letters
Appendix Figure 1: Control Letter
Appendix Figure 2: Detailed Penalty Letter
28

Appendix Figure 3: Generic Penalty Letter
Appendix Figure 4: Norms Letter
29
Top Related