


Languages
Pages
Legal


CNR-IGG A. Manzella
Adele Manzella
CNR- Earth and Environment Dept.,
Institute of Geosciences and Earth Resources
1

CNR-IGG A. Manzella
Goals to be achieved by Geophysics 1. before and during production
2
• Improve methods of identifying prospective reservoirs without drilling
• Define boundaries (lateral and vertical)
• Improve methods to identify drilling targets
Main permeability is driven
by fracture and faults.
>30% of wells not economic

CNR-IGG A. Manzella
Goals to be achieved by Geophysics 2: during and after production
3
• Continuously characterize the reservoir during energy extraction
• Follow the effect of production and fluid re-distribution, including the formation of steam or gas cap
• Characterize the rock fabric to define fluid flow paths within reservoir
• Track injected fluids
• Characterize formations during deep drilling and stimulation in order to predict reservoir performance/lifetime (effectiveness and sustainability)
CNR-IGG A. Manzella
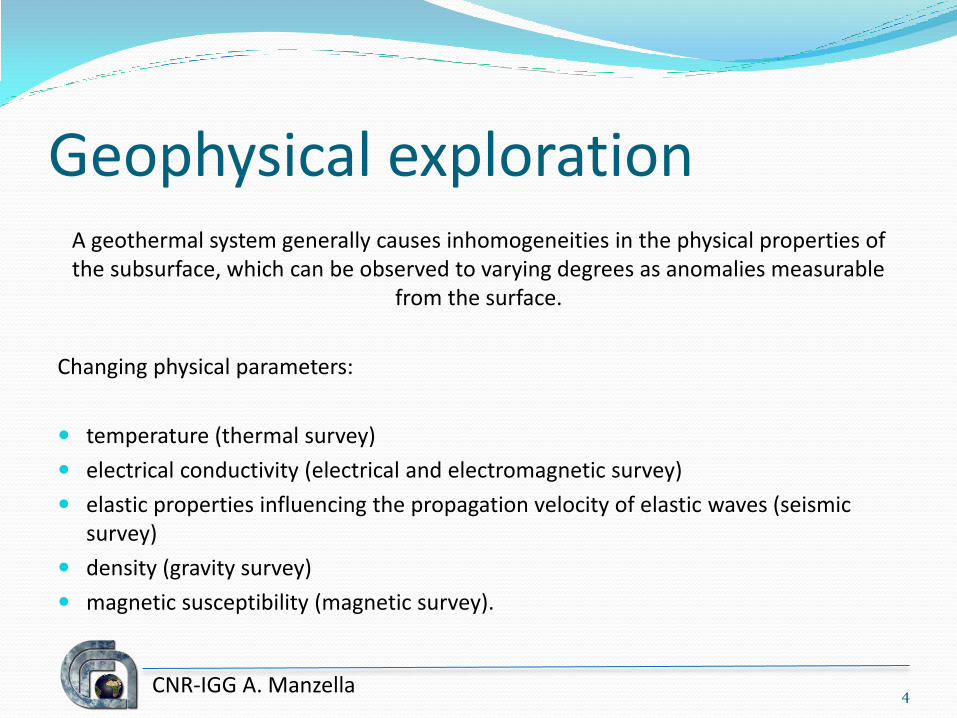
Geophysical exploration A geothermal system generally causes inhomogeneities in the physical properties of the subsurface, which can be observed to varying degrees as anomalies measurable
from the surface.
Changing physical parameters:
temperature (thermal survey)
electrical conductivity (electrical and electromagnetic survey)
elastic properties influencing the propagation velocity of elastic waves (seismic survey)
density (gravity survey)
magnetic susceptibility (magnetic survey).
4

CNR-IGG A. Manzella 5
The range of values for the lithologies that can be measured with the methods of applied geophysics is very variable.

CNR-IGG A. Manzella
Geophysical exploration
6
Degree of relationship
Subsurface structure
Mechanical properties
Metallic mineral content
Magnetic mineral content
Clay content
Water quality
Water content
Permeability
Porosity
Seismic velocity
Dielectric permittivity
Electrical resistivity
Magnetic
susceptibiity
Density
None Weak Moderate Strong
It is not wise to define a
particular sequence of geophysical surveys as
being applicable to all potential reservoirs

CNR-IGG A. Manzella
Geophysical exploration
It is not wise to define a particular sequence of geophysical surveys as being applicable to all potential reservoirs.
Any exploration plan should be tailored to the project
NO STANDARD
To some extent the choice of method depends also upon accessibility.
After detailed geophysical surveys we should have a convincing set of data to say there is evidence for heat and for permeability
7

CNR-IGG A. Manzella
Why resistivity?
8
Electric and electromagnetic methods provide the electrical resistivity ρ or its reciprocal electrical conductivity σ of the subsurface.
Resistivity depends on both host rocks and pore fluid properties
Rocks Temperature & Pressure
Rock mineral association - Lithology, Clays (Surface conduction)
Microstructural properties (e.g., permeability, porosity)
Fluids Amount – saturation, fluid content
Nature (liquid or vapor phase, other liquids and gases)
Geochemisty of the fluid - Salinity

CNR-IGG A. Manzella 9
Electrical resistance = the resistance of a medium to electrical current transmission Ohm Law Where V= potential difference (volts) and I= current flow (ampere) R is adimensional.
Current density Resistance = Resistivity, which is the resistance of a unit volume, has unit ohm-m The conductivity is and has unit Siemens/m

CNR-IGG A. Manzella 10
Electrical current may propagate thanks to the mobility of free charge carriers that allows current conduction Main propagation mechanisms are: Electronic (<10-8 Ωm) electrons metals (magnetite, hematite) , graphite Semi-conduction electrons Solfurs 10-5÷10-3 Ωm and ions
Electrolitic ions brines, salty water, melts

CNR-IGG A. Manzella
Why resistivity? Temperature and Pressure
11
At normal temperature at the earth surface, silicate minerals have very high resistivity.
The higher the temperature, the lower the
resistivity.
Approaching the melting point of a rock the resistivity becomes low enough to become
comparable with resistivities in water-saturated rocks
From Karya and Shankland, 1983
CNR-IGG A. Manzella
Why resistivity? Temperature and Pressure
12
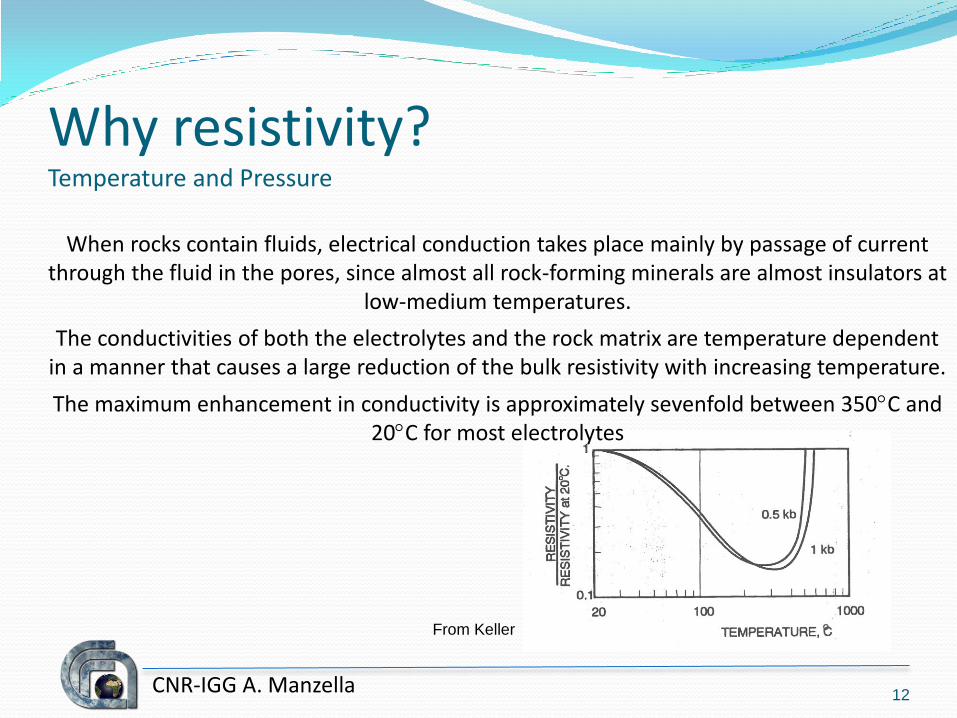
When rocks contain fluids, electrical conduction takes place mainly by passage of current through the fluid in the pores, since almost all rock-forming minerals are almost insulators at
low-medium temperatures.
The conductivities of both the electrolytes and the rock matrix are temperature dependent in a manner that causes a large reduction of the bulk resistivity with increasing temperature.
The maximum enhancement in conductivity is approximately sevenfold between 350C and 20C for most electrolytes
From Keller
CNR-IGG A. Manzella
Why resistivity? Temperature and Pressure
13
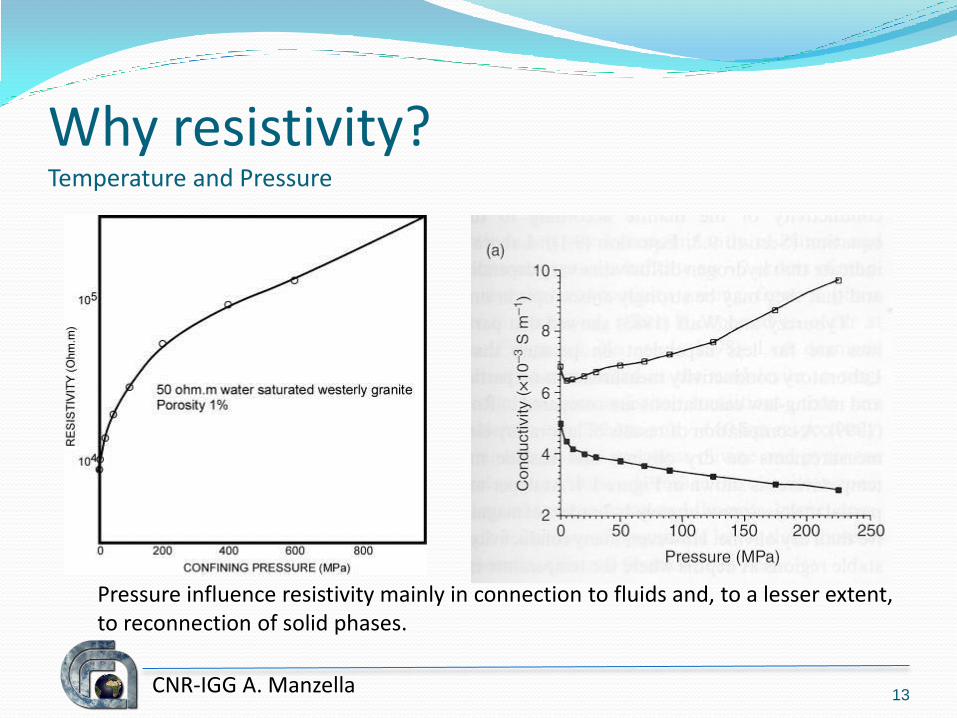
Pressure influence resistivity mainly in connection to fluids and, to a lesser extent, to reconnection of solid phases.

CNR-IGG A. Manzella
Why resistivity? Lithology
14

CNR-IGG A. Manzella
Why resistivity? Clay minerals
15
Resistivity is strongly affected by the presence of clays. In this case there is an electrolyte conductivity dominance
CNR-IGG A. Manzella
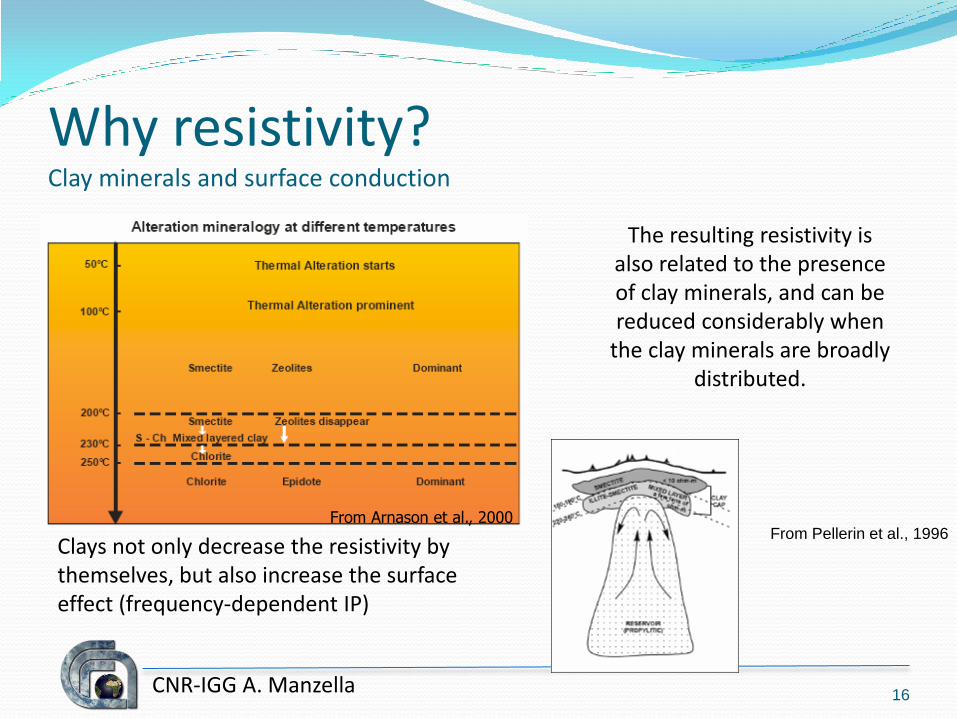
Why resistivity? Clay minerals and surface conduction
16
The resulting resistivity is also related to the presence of clay minerals, and can be reduced considerably when
the clay minerals are broadly distributed.
From Pellerin et al., 1996 Clays not only decrease the resistivity by themselves, but also increase the surface effect (frequency-dependent IP)
From Arnason et al., 2000

CNR-IGG A. Manzella
Why resistivity? Clay minerals and surface conduction
17
The effect of clay over the resistivity is important in
geothermal areas since clayey alteration minerals are very
frequent, particularly in volcanic rocks.
Comparison of the resistivity structure with geological data in volcanic geothermal fields has shown a good correlation with
alteration mineralogy.

CNR-IGG A. Manzella
Why resistivity? Clay minerals and surface conduction
18
Resistivity should be always considered with care. Experience has shown that the apparent one-to-one correlation between low resistivity and the presence of fluids is not correct, since alteration minerals produce comparable, and often higher reduction of resistivity with respect to fluid flow.
Moreover, although the hydrothermal systems in volcanic rocks have an associated low-resistivity signature, the converse is not true.
From Flovenz et al., WGC2005

CNR-IGG A. Manzella
Why resistivity? Salinity
19
As a result, it is not unusual to see an increase in conductivity by an order of magnitude or more in a geothermal reservoir compared with rocks at normal
temperatures removed from the reservoir.
Geothermal waters have high concentrations of dissolved salts which provide conducting electrolytes within a rock matrix
From Keller
CNR-IGG A. Manzella
Why resistivity? Salinity
20
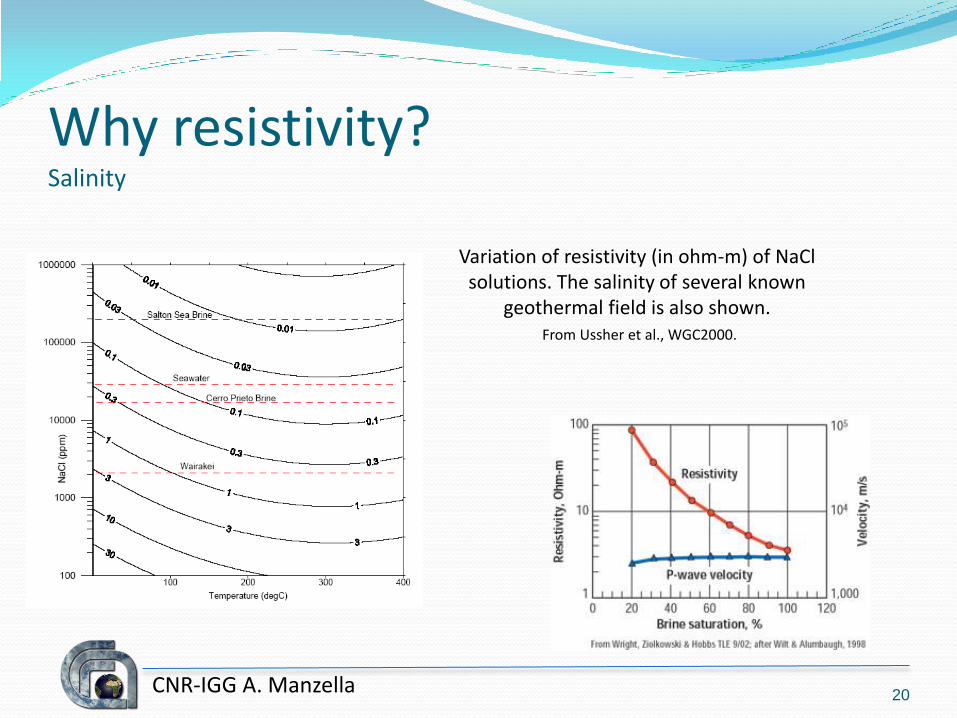
Variation of resistivity (in ohm-m) of NaCl solutions. The salinity of several known
geothermal field is also shown. From Ussher et al., WGC2000.

CNR-IGG A. Manzella
Why resistivity? Fluid phase
21
From Roberts et al., 2002

CNR-IGG A. Manzella
Why resistivity? Hydraulic properties
22
In most rocks there is an empirical relationship, established by Archie (1942), between the ratio of the bulk rock resistivity, ρb, to the pore fluid resistivity, ρf, called the formation factor, F, and the volume fraction porosity, φ. The relationship, now called Archie’s law, is: maF
f
b
a, m empirical parameters.
The equation apply when clays are not present

CNR-IGG A. Manzella
Why resistivity? Hydraulic properties
23
Bulk resistivity versus temperature for rocks saturated with 1000 ppm NaCl solutions, using Archie’s law.
From Ussher et al., WGC2000. .
maFf
b

CNR-IGG A. Manzella
Why resistivity? Hydraulic properties
24
maFf
b
),,,,( clayw maf
When clays are present, Archie’s law modifies to a general law
CNR-IGG A. Manzella
Why resistivity? Hydraulic properties
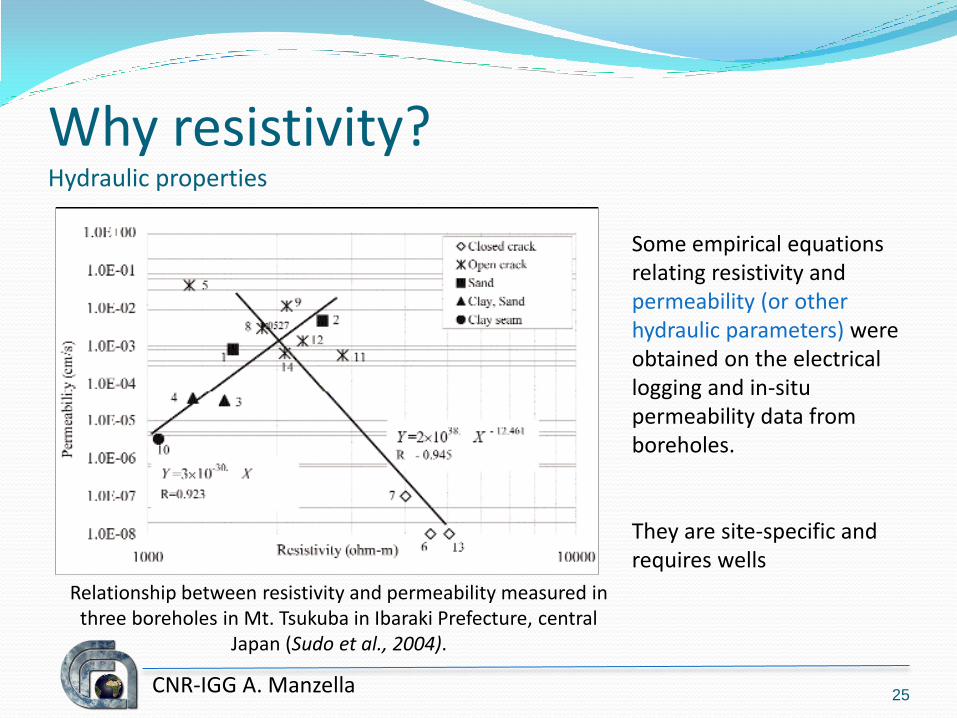
25
Relationship between resistivity and permeability measured in three boreholes in Mt. Tsukuba in Ibaraki Prefecture, central
Japan (Sudo et al., 2004).
Some empirical equations relating resistivity and permeability (or other hydraulic parameters) were obtained on the electrical logging and in-situ permeability data from boreholes.
They are site-specific and requires wells

CNR-IGG A. Manzella
Why resistivity? Hydraulic properties
26
)('')(')( ieff
-Real component σ’ ohmic conduction (energy loose) measured with EM and DC methods
-Imaginary component σ” polarization (energy storage) measured with IP, SP methods
**
1*
i
Frequency dependent complex property

CNR-IGG A. Manzella
Complex conductiviy σ*
real part σ’ imaginary part σ”
Pore-volume
conductivity(electrolite)
Pore –surface
conductivity (CEC)
Porosity Φ
Formation factor F
Pore –surface
conductivity (CEC)
Surface area (Ss)
Grain size
Clay content
Surface area (Ss)
Grain size
Clay content
Kozeny-Carman
Hydraulic conductibity K/ permeability k
Petrophysics
aT
rk
2

CNR-IGG A. Manzella
Why resistivity? Fluid flow
29
Lab measurements have shown that hydraulic and electric flow follow the same paths, but currents are more diffusive
CNR-IGG A. Manzella
natural-source induction methods (magnetotellurics, audiomagnetotellurics and self-potential) controlled-source induction methods (TDM, CSMT, VLF) direct current methods (VES, electric tomography)
Their objective is the mapping of electrical structures at depths that are meaningful
in terms of geothermal exploration.
These depths must be several kilometres at least when looking for the anomaly in conductivity associated with reservoir rocks, and several tens of kilometres when
seeking the thermally excited conductive zone associated with the source of a geothermal system.
EM Geophysical methods
30
CNR-IGG A. Manzella
Inductive methods usually provide information on conductivity-thickness products of conductive layers, whereas they usually provide only thickness
information on resistive layers.
On the contrary, resistivity techniques usually provide information on resistivity-thickness products for resistive layers and conductivity-thickness
products for conductive layers.
For this reason, inductive methods are the most suitable for geothermal exploration, since the target is conductive.
EM Geophysical methods
31

CNR-IGG A. Manzella 32

CNR-IGG A. Manzella
The direct current methods achieve control of the depth of the penetration by
regulating the geometry of the array of equipment used.
Two principal variations of the direct current method have found use in geothermal exploration, though there has been some controversy in the literature
over the relative merits of these techniques.
ELECTRICAL (DC) METHODS
CNR-IGG A. Manzella
I
r
P(r)
Ps(r)
lV RI I
s
24
2
rs
( ) ( ) 24
2
sP r P r
rV V I
r
( ) ( )2
P r P rV Vr k
I I l r
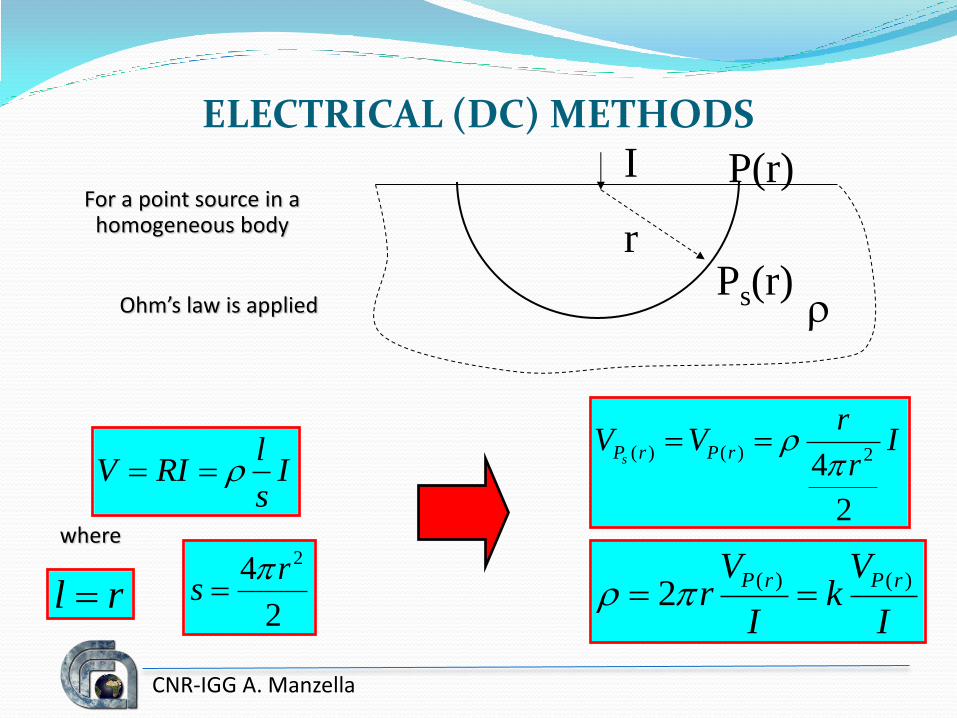
Ohm’s law is applied
where
For a point source in a homogeneous body
ELECTRICAL (DC) METHODS

CNR-IGG A. Manzella
In practice current is injected through a couple of electrodes (usually named A and B) and the voltage difference is measured between two other
electrodes (usually named M and N)
Injected current
Resulting voltage difference
ELECTRICAL (DC) METHODS

CNR-IGG A. Manzella
VI
r rS1
1 22
1 1
VI
r rS2
3 42
1 1
VI
r r r rS S1 2
1 2 3 42
1 1 1 1
2
1 1 1 1
1 2 3 4r r r r
V
Ik
V
I
I2
S1
I1
S2
r1 r2
r3
r4 V
I
ELECTRICAL (DC) METHODS
For a measuring quadripole in a homogeneous body
CNR-IGG A. Manzella 37
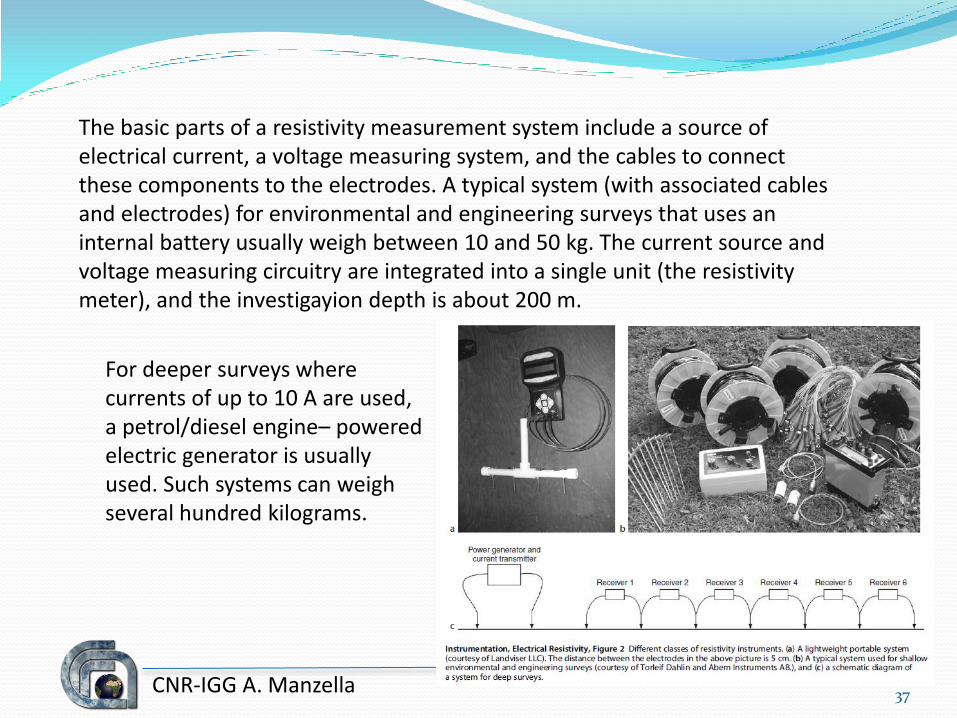
The basic parts of a resistivity measurement system include a source of electrical current, a voltage measuring system, and the cables to connect these components to the electrodes. A typical system (with associated cables and electrodes) for environmental and engineering surveys that uses an internal battery usually weigh between 10 and 50 kg. The current source and voltage measuring circuitry are integrated into a single unit (the resistivity meter), and the investigayion depth is about 200 m.
For deeper surveys where currents of up to 10 A are used, a petrol/diesel engine– powered electric generator is usually used. Such systems can weigh several hundred kilograms.

CNR-IGG A. Manzella 38
Before early 1990s, the electrical resistivity method was mainly used in resistivity sounding, profiling, and mapping surveys and quantitative interpretation was mainly confined to 1-D (one-dimensional) structure of the subsurface consisting of horizontal layers.

CNR-IGG A. Manzella 39
The development of multielectrode and multichannel systems over the past 20 years has sparked a revolution in resistivity surveying. The advent of 2-D and 3-D (three-dimensional) resistivity tomography has opened up whole new application areas to electrical methods. The multielectrode systems made it practical to carry out 2-D imaging surveys that give a more accurate picture of the subsurface in a routine manner.
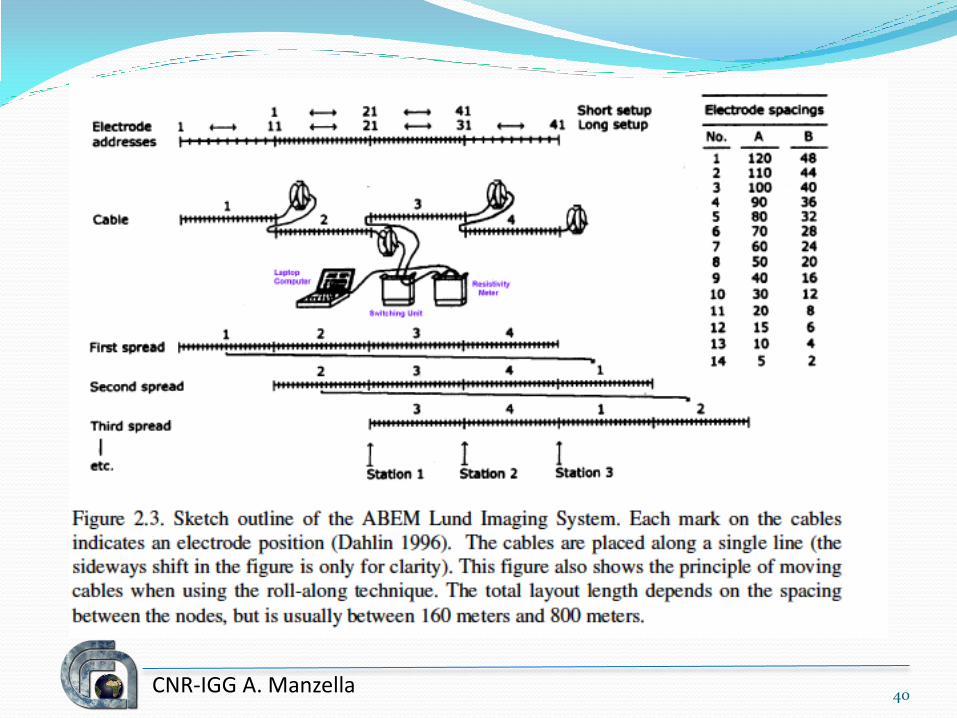
CNR-IGG A. Manzella 40
CNR-IGG A. Manzella
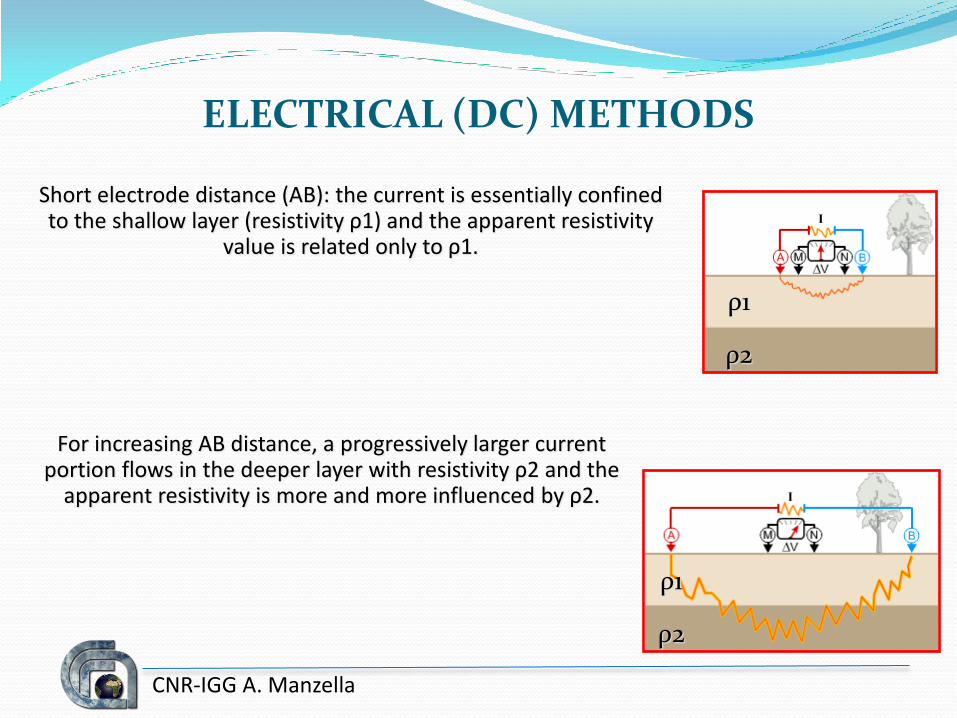
Short electrode distance (AB): the current is essentially confined to the shallow layer (resistivity ρ1) and the apparent resistivity
value is related only to ρ1.
ρ1
ρ2
For increasing AB distance, a progressively larger current portion flows in the deeper layer with resistivity ρ2 and the
apparent resistivity is more and more influenced by ρ2.
ρ1
ρ2
ELECTRICAL (DC) METHODS

CNR-IGG A. Manzella
As a rule of thumb, the investigation depth is in the range :
AB/4 – AB/8
This determines long arrays, and difficult layout to reach large investigation depths.
ELECTRICAL (DC) METHODS

CNR-IGG A. Manzella
• Current line dendity is higher in conductive layers.
In a stratified terrain:
• Shallow resistive layers limit current propagation at depth.
ELECTRICAL (DC) METHODS

CNR-IGG A. Manzella
Data are represented as an “apparent resistivity”, defined as the resistivity of the homogeneous earth which would produce the measured response at a certain distance between transmitter electrodes
ρa
ρ2
ρ1
ρ1
ρ2
AB/2
ELECTRICAL (DC) METHODS

CNR-IGG A. Manzella
The resulting image is a pseudosection apparent resistivity versus depth.
The horizontal location of the point is placed at the mid-point of the set of electrodes used to make that measurement. The vertical location of the plotting point is placed at
a distance that is proportional to the separation between the electrodes.
The pseudosection gives a very approximate picture of the true subsurface resistivity distribution.
ELECTRICAL (DC) METHODS

CNR-IGG A. Manzella
However the pseudosection gives a distorted picture of the subsurface because the shapes of the contours depend on the
type of array used as well as the true subsurface resistivity
ELECTRICAL (DC) METHODS
CNR-IGG A. Manzella
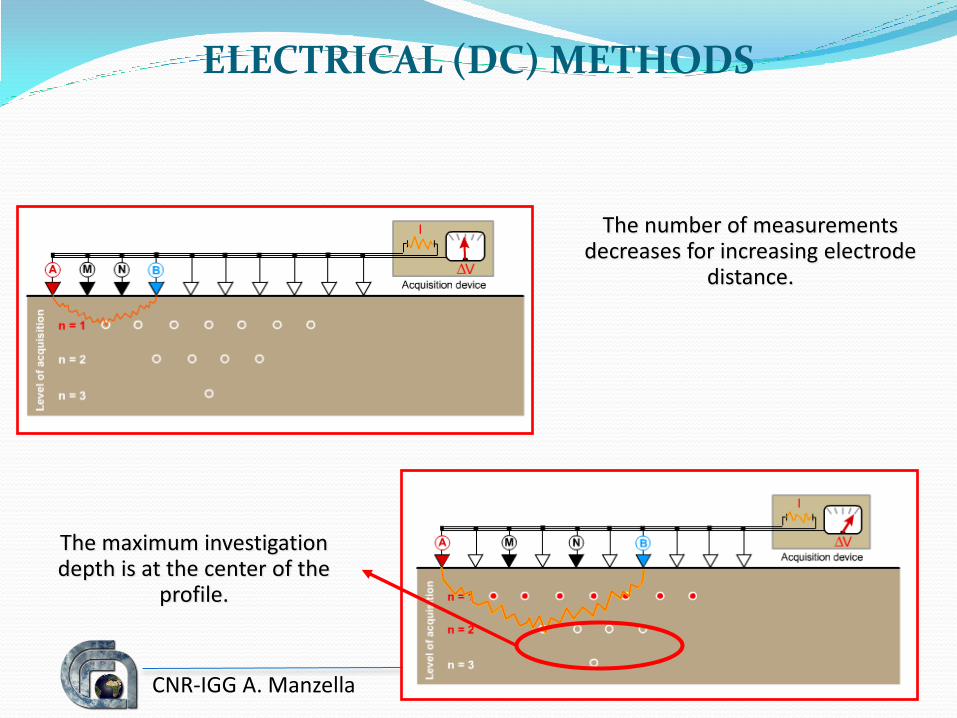
The maximum investigation depth is at the center of the
profile.
The number of measurements decreases for increasing electrode
distance.
ELECTRICAL (DC) METHODS
CNR-IGG A. Manzella
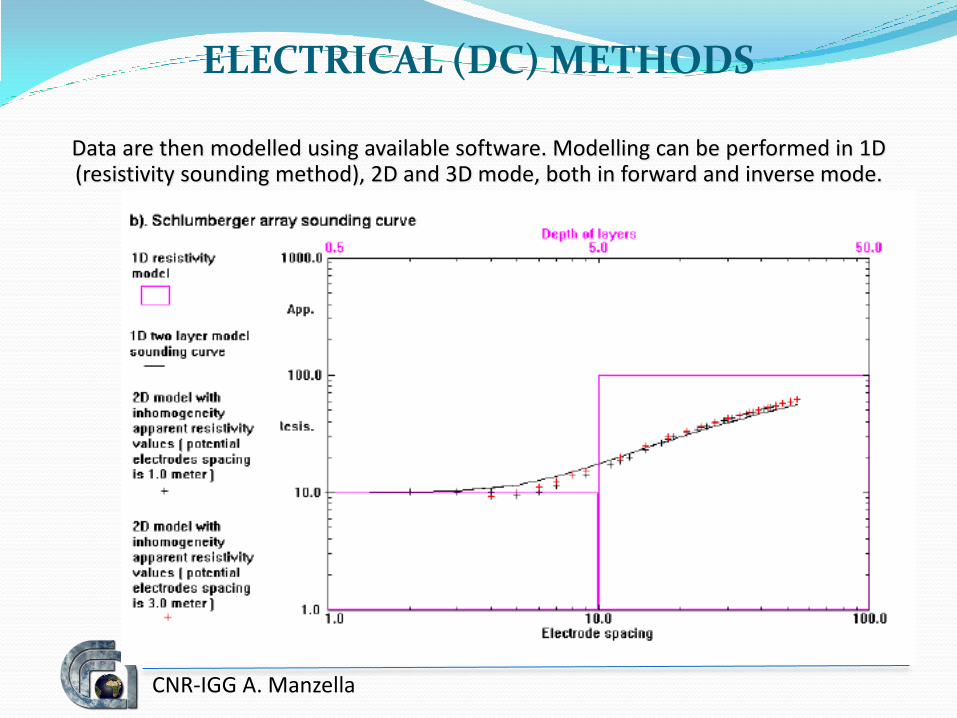
Data are then modelled using available software. Modelling can be performed in 1D (resistivity sounding method), 2D and 3D mode, both in forward and inverse mode.
ELECTRICAL (DC) METHODS

CNR-IGG A. Manzella 49
An example of 2D forward modelling

CNR-IGG A. Manzella 50
In inversion, the first step is to erase bad data point (noise) either manually or automatically.
CNR-IGG A. Manzella 51
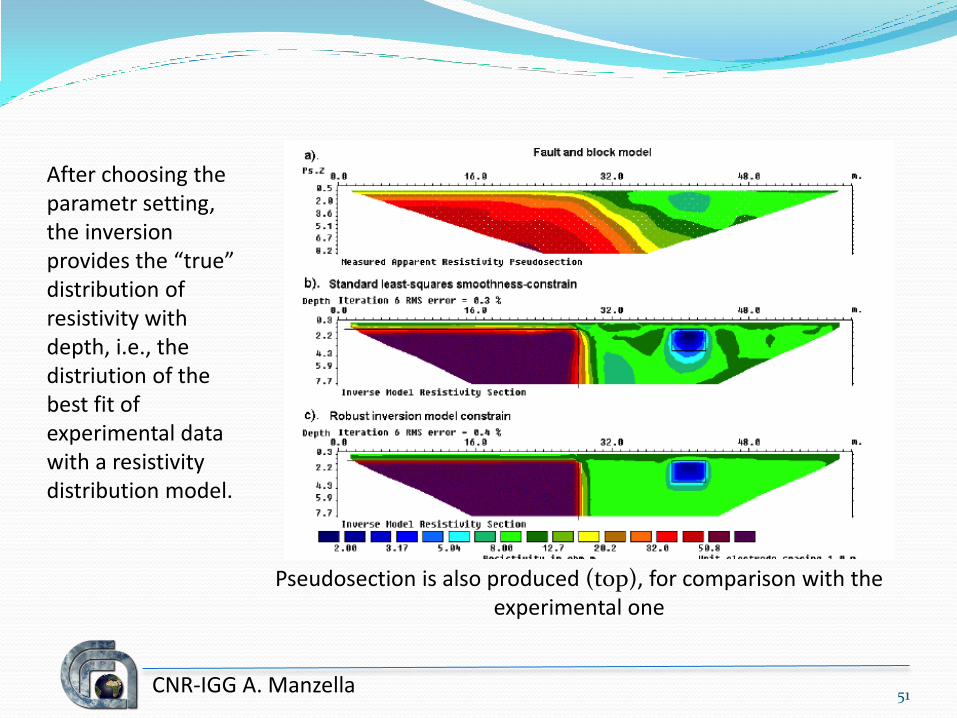
After choosing the parametr setting, the inversion provides the “true” distribution of resistivity with depth, i.e., the distriution of the best fit of experimental data with a resistivity distribution model.
Pseudosection is also produced (top), for comparison with the experimental one
CNR-IGG A. Manzella
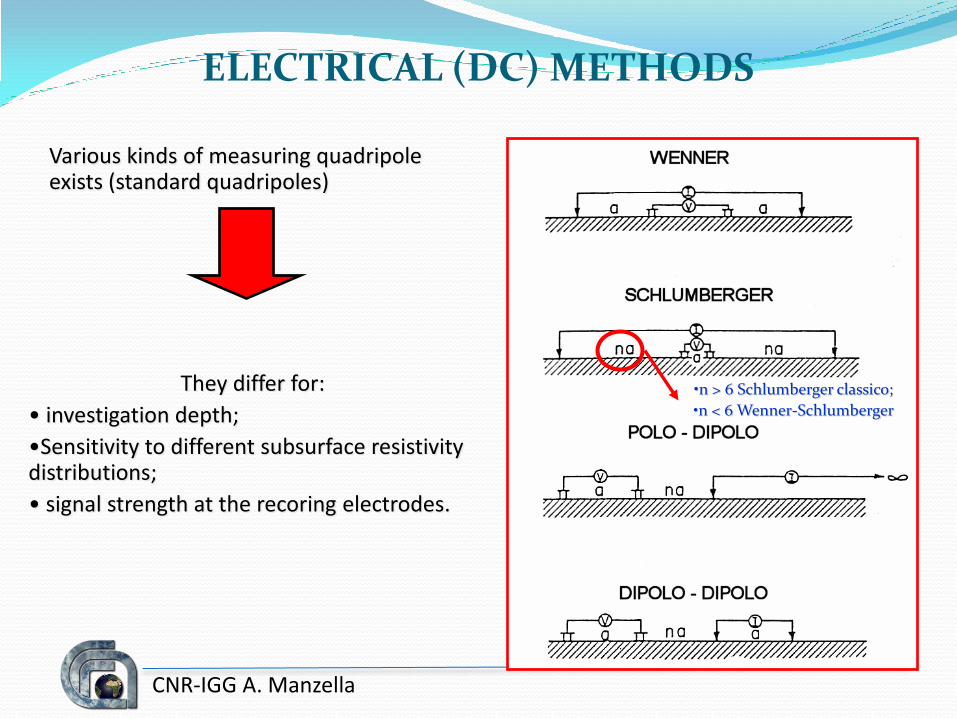
Various kinds of measuring quadripole exists (standard quadripoles)
They differ for:
• investigation depth;
•Sensitivity to different subsurface resistivity distributions;
• signal strength at the recoring electrodes.
•n > 6 Schlumberger classico;
•n < 6 Wenner-Schlumberger
ELECTRICAL (DC) METHODS
CNR-IGG A. Manzella
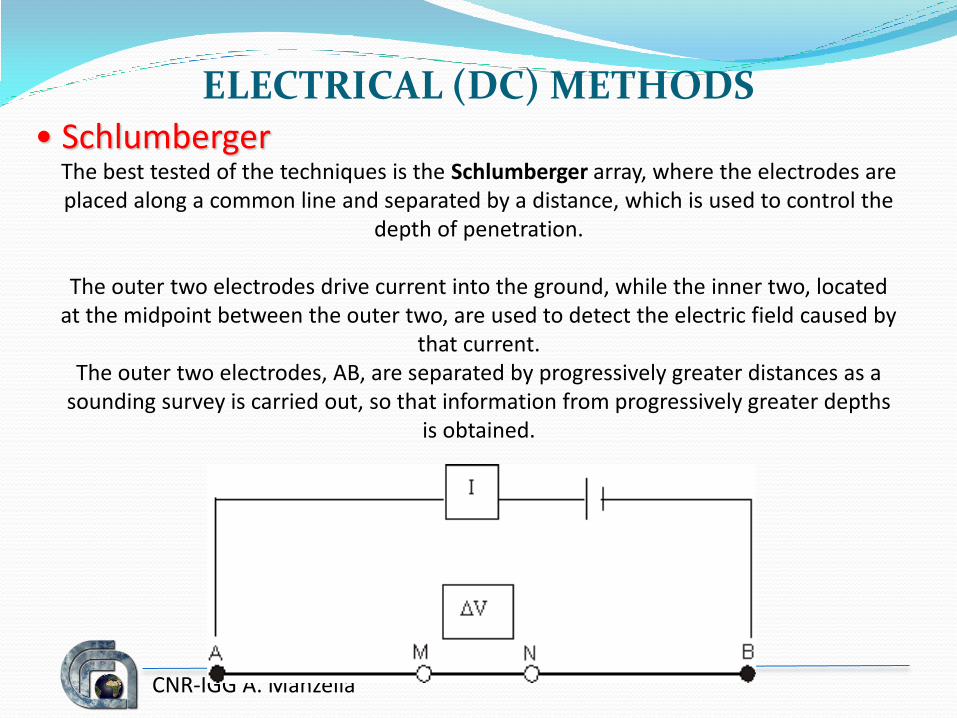
The best tested of the techniques is the Schlumberger array, where the electrodes are placed along a common line and separated by a distance, which is used to control the
depth of penetration.
The outer two electrodes drive current into the ground, while the inner two, located at the midpoint between the outer two, are used to detect the electric field caused by
that current. The outer two electrodes, AB, are separated by progressively greater distances as a
sounding survey is carried out, so that information from progressively greater depths is obtained.
ELECTRICAL (DC) METHODS • Schlumberger

CNR-IGG A. Manzella
N NA B
2
1
N NA B
2
1
100
101
102
101
102
103
Curva di Resistività
AB/2 [m]
ro [O
hm.m
]
The result is a bilogaritmic plot of apparent resistivity versus AB/2 :
ELECTRICAL (DC) METHODS
CNR-IGG A. Manzella
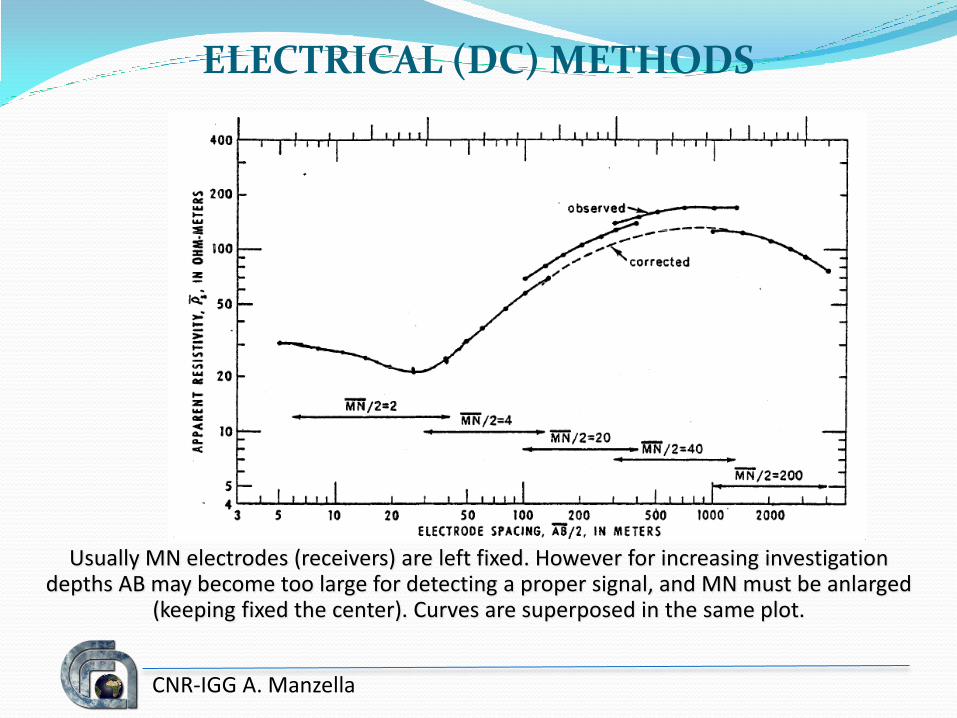
Usually MN electrodes (receivers) are left fixed. However for increasing investigation depths AB may become too large for detecting a proper signal, and MN must be anlarged
(keeping fixed the center). Curves are superposed in the same plot.
ELECTRICAL (DC) METHODS

CNR-IGG A. Manzella
Also with the Wenner array electrodes are placed along a common line and separated by a distance, which is used to control the depth of penetration.
A couple of electrodes drive current into the ground, while the other couple is used to
detect the electric field caused by the transmitted current. The two couples of electrodes are separated by progressively greater distances as a
sounding survey is carried out, so that information from progressively greater depths is obtained.
This method is particularly influenced by vertical structures
M N
ΔV
A B
I
ELECTRICAL (DC) METHODS • Wenner
CNR-IGG A. Manzella
In a survey of a geothermal area, the spacing between electrodes will be increased incrementally from distances of a few metres or tens of metres to
distances of several kilometres or more.
The Schlumberger method has several limitations, including the relatively slow progress with which work can be carried forward in deep sounding, and the fact
that in areas of geothermal activity the lateral dimensions of the areas of anomalous resistivity may be considerably smaller than the total spread required
between electrodes.
In order to detect the presence of lateral discontinuities in resistivity, the bipole–dipole and dipole–dipole techniques have come into use.
ELECTRICAL (DC) METHODS
CNR-IGG A. Manzella
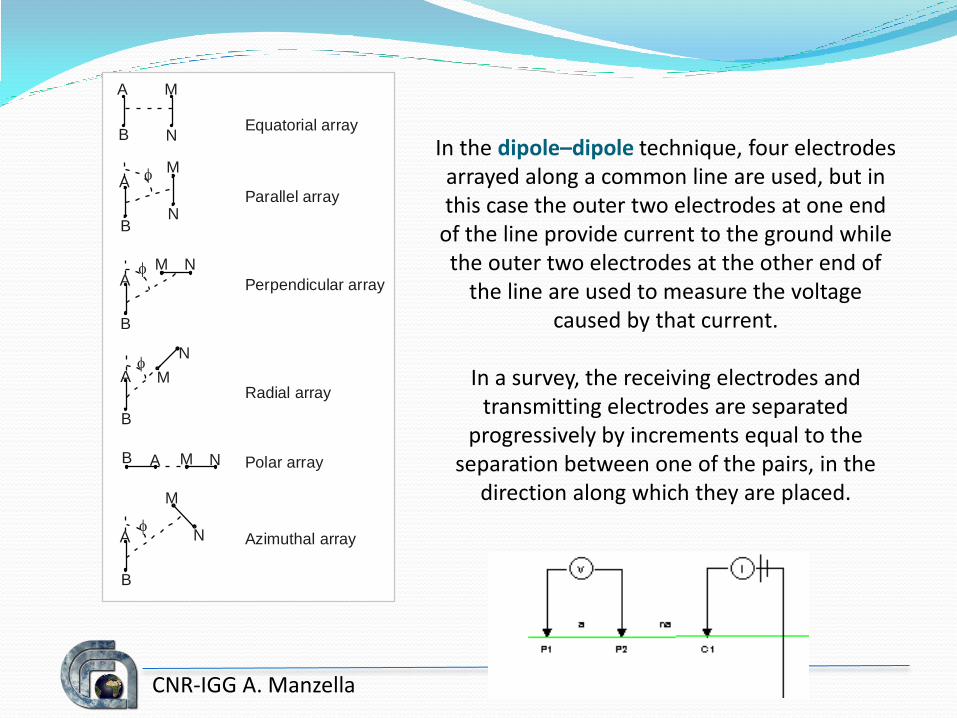
In the dipole–dipole technique, four electrodes arrayed along a common line are used, but in this case the outer two electrodes at one end
of the line provide current to the ground while the outer two electrodes at the other end of
the line are used to measure the voltage caused by that current.
In a survey, the receiving electrodes and
transmitting electrodes are separated progressively by increments equal to the
separation between one of the pairs, in the direction along which they are placed.
A
B
M
N
A
B
M
N
M NA
B
A
B
M
N
A
B
M
N
B A M N
Equatorial array
Parallel array
Perpendicular array
Radial array
Polar array
Azimuthal array

CNR-IGG A. Manzella
The separation between the two dipoles can be increased from one dipole length to as much as 10 dipole lengths.
When this has been done the current dipole is advanced by one dipole length along the traverse and the procedure repeated.
The process is continued with the entire system moving along a profile.
The dipole–dipole method has the advantage of portraying the effects of lateral changes in resistivity clearly, but suffers from the disadvantage of being a
cumbersome method to apply in the field.

CNR-IGG A. Manzella
In the bipole–dipole mapping method, current is driven into the earth with a fixed pair of
electrodes at a source bipole.
The behaviour of the current field over the surface of the earth is then surveyed by making voltage measurements with orthogonal pairs of
electrodes (dipoles) at many locations around the source.
Values for apparent resistivity are computed and contoured.
In some cases a simple relationship exists
between contours of apparent resistivity and the subsurface electrical structure, but in many cases the relationship between the contoured
apparent resistivities and the subsurface structure is difficult to determine.
A B
M
N1 N2
Source bipole
Receivers (dipoles)

CNR-IGG A. Manzella
An important modification of the bipole–dipole method, which has been used in more recent surveys to improve the meaningfulness of the results, is the use
of two orthogonal bipole sources. The two sources are energised separately, and at a receiver site two electric
fields are determined, one for each source.
By combining these two electric fields in various proportions, apparent resistivity is computed as a function of the direction of
current flow at the receiver station.
The result is an ellipse of apparent resistivity drawn as a function of the direction of current flow. These ellipses provide considerably more insight into the nature of the subsurface than
do the single values of apparent resistivity obtained with the single-source bipole–dipole
method.
A B
M
N1 N2
Source bipoles
Receivers (dipoles)
A'
B'

CNR-IGG A. Manzella
Specific features for the different layout:
• Investigation depth
• Sensitivity to vertical or horizontal structures
• Horizontal coverage of data
• Signal strength (voltage)
Why so many different layouts?
ELECTRICAL (DC) METHODS

CNR-IGG A. Manzella
1) The “investigated volume” have different shapes, and the different layouts have different resolving power;
2) A different “investigation density” as a function of depth, within the target volume
Why so many different layouts?
Depending on the application, the choice of the best layout has a main importance
ELECTRICAL (DC) METHODS

CNR-IGG A. Manzella
Wenner
Schlumberger
dipole-dipole
ELECTRICAL (DC) METHODS

CNR-IGG A. Manzella
Sensitivity derives from the array voltage variation measured for varying resistivity in a certain
subsurface volume
Sensitivity of standard quadripoles :
ELECTRICAL (DC) METHODS

CNR-IGG A. Manzella
• Wenner
It is a robust array, very used in the first attempts of tomography surveys :
• much more sensible to vertical variations of resistivity with respect to horizontal ones
• average investigation depth
• strong signal strenth (voltage difference) useful in noisy areas
• reduced horizontal coverage for increasing depth
ELECTRICAL (DC) METHODS

CNR-IGG A. Manzella
• Dipole Dipole
Sensitivity is particularly high around the current and voltage electrodes
ELECTRICAL (DC) METHODS

CNR-IGG A. Manzella
• Wenner-Schlumberger
This mixed array is relatively new and recently very used in tomography
• moderately sensible to both vertical and horizontal resistivity variations
• investigation depth is higher than with just wenner array (n>3).
• good horizontal coverage
•Intermediate signal strength with respect to wenner and schlumberger
ELECTRICAL (DC) METHODS

CNR-IGG A. Manzella
• Wenner-Schlumberger
It can be applied in various contexts thanks to its flexibility and
intermediate features
ELECTRICAL (DC) METHODS

CNR-IGG A. Manzella 70

CNR-IGG A. Manzella
Induced polarization
71
Induced polarization (or IP) is a secondary measurement that can be made at the same time as DC resistivity if the correct equipment is included. IP have been known for a long time, but sparsely used, mainly confined to mineral (ore) exploration. IP measurements respond to variations in the capacity for subsurface materials to retain electric charge. This physical property is referred to as chargeability. The principal materials that exhibit this property are clays, graphite, and sulphide minerals. However, small changes in chargeability can be detected when groundwater is contaminated with salt, hydrocarbons, or other materials.

CNR-IGG A. Manzella
Induced polarization
72
With modern equipment, acquisition and modelling of IP data has been made quick, and IP data are now used to hellp in ERT data interpretation, since it is possible to distinguish the effects due to clays, since the chargeability of clays ( in the 10 to 50 mV/V range) is much smaller that that due to conductive minerals. The IP effect is caused by two main mechanisms, the membrane polarization and the electrode polarization effects. The membrane polarization effect is largely caused by clay minerals present in the rock or sediment. IP measurements are made in the time-domain or frequency domain.

CNR-IGG A. Manzella
Induced polarization
73
CNR-IGG A. Manzella
Self-potential method
74
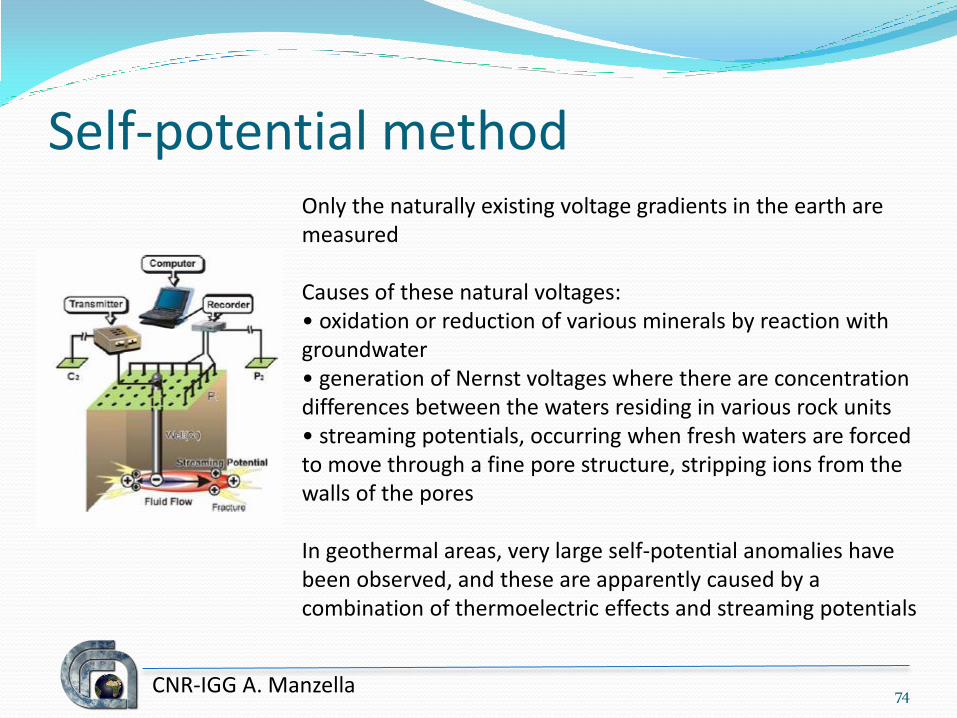
Only the naturally existing voltage gradients in the earth are measured Causes of these natural voltages: • oxidation or reduction of various minerals by reaction with groundwater • generation of Nernst voltages where there are concentration differences between the waters residing in various rock units • streaming potentials, occurring when fresh waters are forced to move through a fine pore structure, stripping ions from the walls of the pores In geothermal areas, very large self-potential anomalies have been observed, and these are apparently caused by a combination of thermoelectric effects and streaming potentials
CNR-IGG A. Manzella
To avoid spurious contribution to the voltage by chemical reaction, non-polarizing electrodes are used, which consist of a metal electrode in contact with a stable
electrolyte, with the whole being contained in a semi-permeable container serving as salt bridge between the metal electrode and the dirty electrolyte present in the
pores of the soil or rock with which it makes contact the two electrode potential will be equal and cancel.
Self-potential method
CNR-IGG A. Manzella
Two different field procedures can be used in mapping SP
The single reference method One non-polarizing electrode is held fixed at a reference point while the other electrode is moved about over the survey area to determine the distribution of
potential over the region Only areas of few hundred meters square because large separation between
electrodes induces telluric electric voltages to the SP
The leap-frog method The two electrodes are moved along a closed survey path. After each
measurement, the trailing electrode is moved ahead of the leading electrode for the next measurement. The incremental voltages observed along the loop are
successively added and subtracted to arrive to a potential map with respect to the starting point of the loop. The net voltage when the loop closes should be zero;
any residual voltage reflects survey errors and can be distributed around the loop.
CNR-IGG A. Manzella
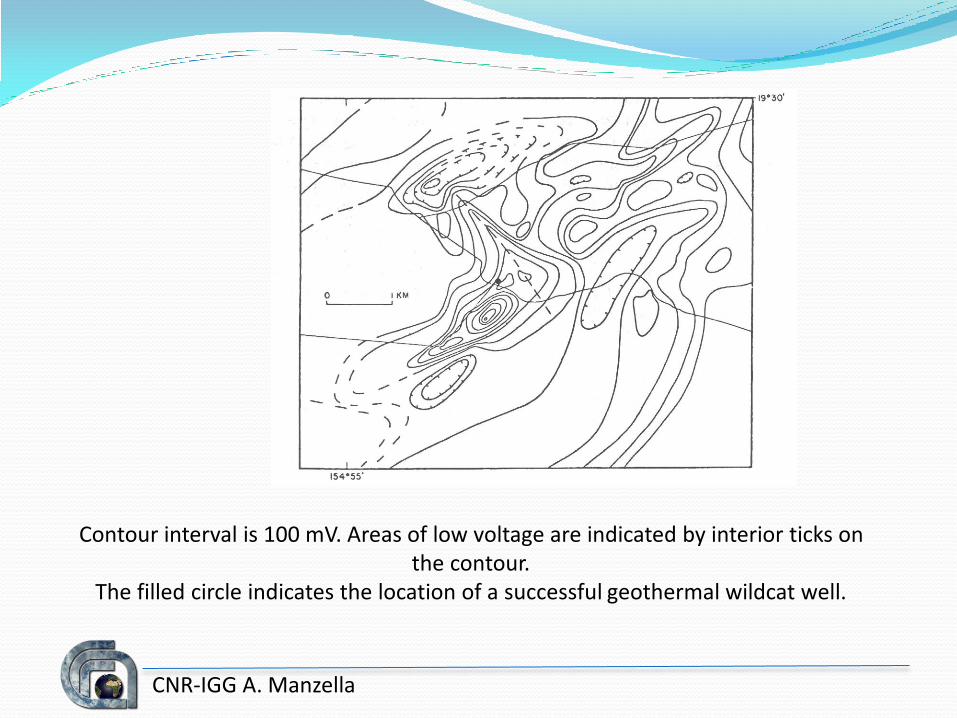
Contour interval is 100 mV. Areas of low voltage are indicated by interior ticks on the contour.
The filled circle indicates the location of a successful geothermal wildcat well.
CNR-IGG A. Manzella
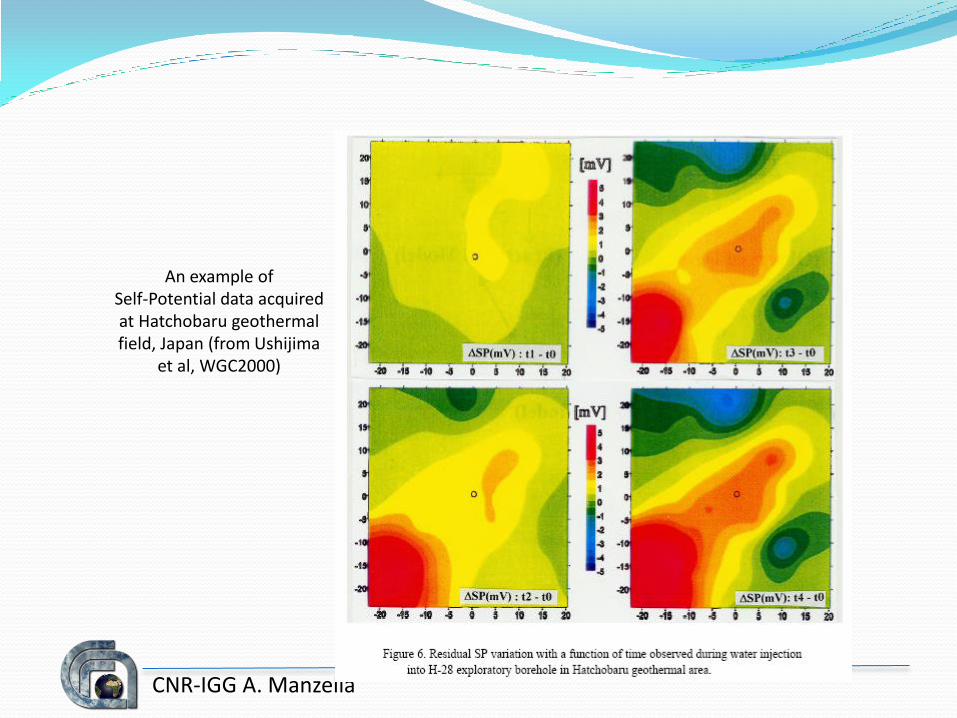
An example of Self-Potential data acquired at Hatchobaru geothermal field, Japan (from Ushijima
et al, WGC2000)

CNR-IGG A. Manzella
An example of Self-Potential data acquired at Pohuthu
geothermal field, New Zealand
(from Nishi et al, WGC2000)

CNR-IGG A. Manzella
An example of Self-Potential data acquired at Yanaizu-Nishiyama geothermal field, Japan (from Tosha et al, WGC2000)

CNR-IGG A. Manzella
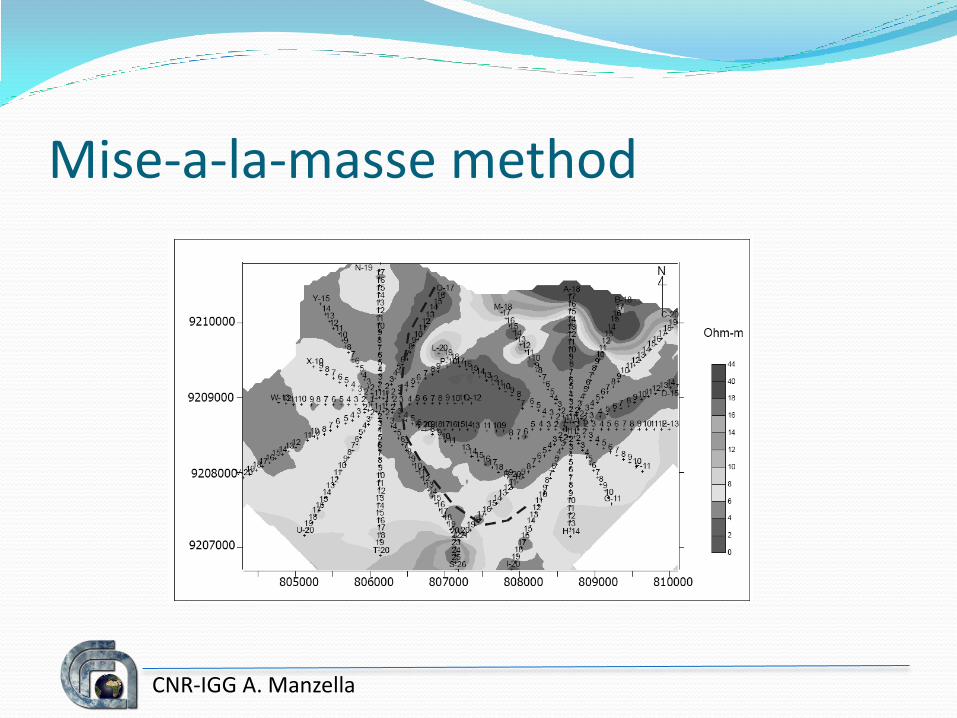
It is used when a prospect hole penetrates a highly conductive zone. A current electrode, lately the casing pipe itself, is embedded in the conductive zone and
energized with direct current, the other electrode being a large distance away on surface.
This method is now used to monitor fluid flow behaviour during reinjection and
during hydraulic fracturing operations in hot dry rocks.
Mise-a-la-masse method
CNR-IGG A. Manzella
Mise-a-la-masse method

CNR-IGG A. Manzella
When many wells are logged, the EM tomography method may define the distribution of resistivity around the borehole and the whole area interested by drilling
A transmitter is located in one hole while a receiver is drawn up in another.
The attenuation of the signal depends on the resistivity structure.
Attenuation will be greater if the field senses a region of low resistivity, and lower if a region of high resistivity is seen.
Cross-hole resistivity survey

CNR-IGG A. Manzella
CNR-IGG A. Manzella
Azimuthal sounding
85
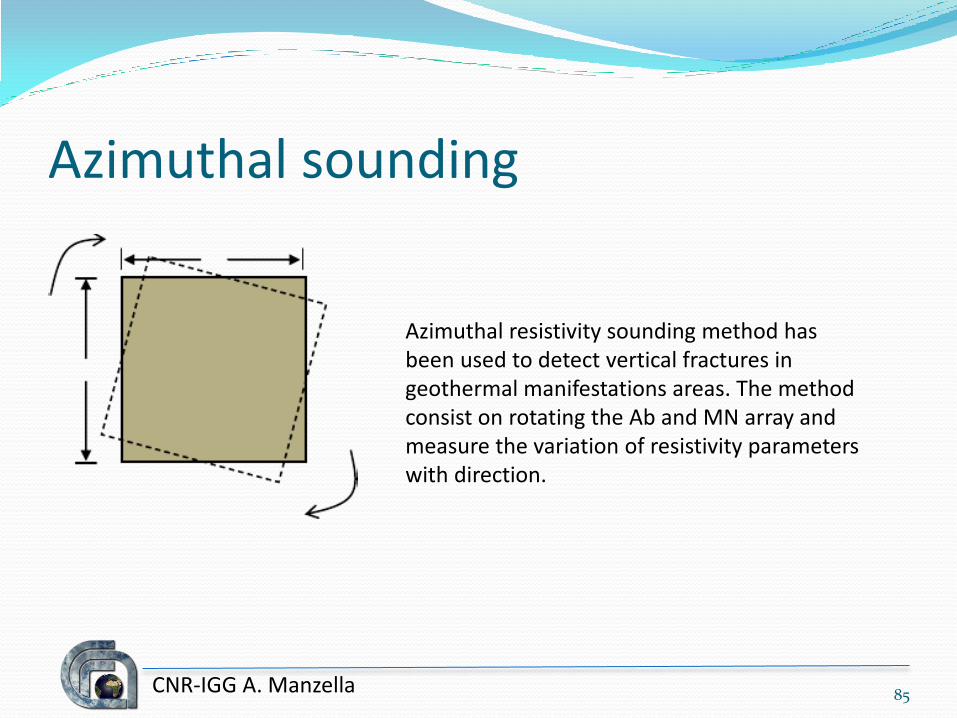
Azimuthal resistivity sounding method has been used to detect vertical fractures in geothermal manifestations areas. The method consist on rotating the Ab and MN array and measure the variation of resistivity parameters with direction.

CNR-IGG A. Manzella
Azimuthal sounding
86
Application of azimuthal resistivity sounding method in Gunung Lamongan (East Java). Anisotropy coefficient is proportional to the dimensions of the fracture. The results of field measurements and data processing, pattern of cracks in the geothermal manifestations was N10ºE to N60ºE. Widya Utama and Tri Martha Kusuma Putra, PROCEEDINGS, 1° ITB Geothermal Workshop 2012
CNR-IGG A. Manzella
Used in areas where the geothermal circulation and related alteration take place at shallow depths (<2 km)
Long electric arrays (Schlumberger and dipole-dipole) used in the 70’s and 80’s for resistivity imaging
2 D and 3 D inversion softwares available “off the shelf”
Advantages : source controlled, resolution
Disadvantages :
Implementation very heavy compared with MT and TDEM
equivalences (non unique solution),
“Blackbox”software could drive very easily to erroneous interpretations
ELECTRICAL (DC) METHODS

CNR-IGG A. Manzella
Used for exploration of natural manifestation or shallow low-enthalpy geothermal systems
1D, 2 D and 3 D inversion softwares available “off the shelf”
Advantages : very high resolution, possibility to distinguish clays and polarized fields
Disadvantages :
only for shallow investigation
ERT, IP, self-potential methods

CNR-IGG A. Manzella
An example of DC data acquired at Cerro Prieto, Mexico (from Charré-Meza et al, WGC2000)
Example
The Cerro Prieto region
was prospected with more
than 400 long offset
Schlumberger soundings.
The geothermal area is at
the center of a system of
echelon faults that produce
a slimming and possible
rupture of the earth's crust.
With the help of resistivity
data, the authors obtained
a 3-D resistivity image of
the geothermal area and of
the two principal faults that
control the regional
tectonics
ELECTRICAL (DC) METHODS
CNR-IGG A. Manzella 90

CNR-IGG A. Manzella
ELECTRICAL (DC) METHODS
CNR-IGG A. Manzella
ELECTRICAL (DC) METHODS

CNR-IGG A. Manzella 93
Geothermal exploration
at a geothermal area of
Las Tres Virginen,
Mexico. The change in
resistivity is coincident
with known faults.
Geothermal
exploration at a low
enthalpy field using
ERT. The low
resistivity zone
is coincident with a
known fault.
FLUID PATHWAY

CNR-IGG A. Manzella
MONITORING
Geothermal exploration at
a low enthalpy field using
ERT. The low resistivity
zone is coincident with a
known fault where warm
and saline fluids mix with
surface and fresh water.
An example of monitoring
the effect on resistivity
change when fresh water
is pumped out from a well
at the center of profile:
the increase of salinity
and temperature in the
subsurface decreases the
resistivity

CNR-IGG A. Manzella
MONITORING
Synthetic subsurface resistivity models for injection process related with different times (t = 0, 1, 2 and 3 unit; unit is equal to month for our problem).

CNR-IGG A. Manzella 96
Top Related