


Languages
Pages
Legal


Clustering andreverse
engineering:from genes to
themetabolome
HumbertoOrtiz Zuazaga
Introduction
Clustering
ReverseEngineering
Clustering and reverse engineering: from genesto the metabolome
Humberto Ortiz Zuazaga
University of Puerto RicoHigh Performance Computing facility
September 18, 2009

Clustering andreverse
engineering:from genes to
themetabolome
HumbertoOrtiz Zuazaga
Introduction
Clustering
ReverseEngineering
Outline
1 Introduction
2 Clustering
3 Reverse Engineering
Clustering andreverse
engineering:from genes to
themetabolome
HumbertoOrtiz Zuazaga
Introduction
Clustering
ReverseEngineering
Bioinformatics
“The creation and advancement of algorithms, computationaland statistical techniques, and theory to solve formal andpractical problems posed by or inspired from the managementand analysis of biological data.” — Wikipedia

Clustering andreverse
engineering:from genes to
themetabolome
HumbertoOrtiz Zuazaga
Introduction
Clustering
ReverseEngineering
Computational biology
The application of computers to the collection, analysis, andpresentation of biological information.
Clustering andreverse
engineering:from genes to
themetabolome
HumbertoOrtiz Zuazaga
Introduction
Clustering
ReverseEngineering
Metabolomics
“the chemical profiling of (all) cellular metabolites by theiridentification and quantification.” [1][1] Unbiased characterization of genotype-dependent metabolicregulations by metabolomic approach in Arabidopsis thaliana.Miyako Kusano, Atsushi Fukushima, Masanori Arita, ParJonsson, Thomas Moritz, Makoto Kobayashi, Naomi Hayashi,Takayuki Tohge and Kazuki Saito. BMC Systems Biology2007, 1:53 doi:10.1186/1752-0509-1-53

Clustering andreverse
engineering:from genes to
themetabolome
HumbertoOrtiz Zuazaga
Introduction
Clustering
ReverseEngineering
Clustering
Dividing the elements of a set into related subsets based on adistance metric among elements.Question: What other biological problem groups elementsbased on their ”distance”?

Clustering andreverse
engineering:from genes to
themetabolome
HumbertoOrtiz Zuazaga
Introduction
Clustering
ReverseEngineering
Principal components
!"#$%&'()*'$!+,-,.&!"##$%!!&'( )**+&,,---./01234536*789.512,:$'";#'#<,:,'(
=8>3!(!1?!:$
/01.)$23*4)5$2,($6,5$7+(1(+,2$0350,')'8
ware for spectral annotation (Fukushima et al., in prepara-tion), 93 peaks were identified or annotated as knownmetabolites. In addition, 78 peaks were annotated withmass spectral tags (MSTs) [29,30]. These peaks were con-sistently observed though not identified completely.
For a total of 171 annotated peaks, partial least square-dis-criminate analysis (PLS-DA) was applied as a multivariatestatistical analysis. The scatter plot of PLS-DA scoresshowed clear separation among WT, mto1, and tt4 with agood cross-validation result in accordance with theirgenetic background (Figure 1). The 2 mutants showed dis-tinct metabolic snapshots that were consistent withineach biological replicate of mutant plants.
Subsequently, we searched the metabolites that contrib-uted to this separation of the mutant profiles group fromthose of WT (discriminative metabolites, hereafter) (Addi-tional File 1). In order to filter the discriminative metabo-lites further, Welch's t-test was conducted for annotatedpeaks by interpreting the first weight vector in the PLS-DA,
assuming that metabolite concentrations follow the nor-mal distribution in the same genetic background. Betweenmto1 and WT, 34 peaks differed significantly, whereas 31peaks were significantly different between tt4 and WT (p <0.05). The discriminative metabolites for mto1 weremostly amino and organic acids, whereas sugars and theprecursors of secondary products were found as discrimi-native metabolites for tt4. In mto1, remarkable changes inmethionine-related compounds such as methionine,homocysteine, and methionine sulfone were observed(see below).
Pronounced metabolite changes are observed in mto1 but fewer changes in tt4In order to identify the metabolic pathways that weremodulated in terms of metabolite levels, significantmetabolite changes (p < 0.05) observed in mto1 or tt4against WT were compared on the metabolic map (Figure2). Only the peaks annotated as known compounds areprojected in Figure 2, while a comprehensive list of all
The partial least square-discriminate analysis (PLS-DA) score scatter plot of the first 2 components for WT and 2 mutants, mto1 and tt4Figure 1The partial least square-discriminate analysis (PLS-DA) score scatter plot of the first 2 components for WT and 2 mutants, mto1 and tt4. Dotted circles represent individual plant samples. This PLS-DA analysis represents the differentiation of 53 samples (WT, n = 17; mto1, n = 16 [13 samples from biological replicates and 3 samples from analytical replicates]; and tt4, n = 20). The symbols correspond as follows: red square, wild-type (WT); blue diamond, methionine-over accumulation 1 (mto1); green circle, transparent testa4 (tt4). The PLS-DA model shows 3 significant components according to cross-validation. The explained variation in the X-matrix (R2X) and the Y-matrix (R2Y) is 0.60 and 0.86, respectively, and the predictive ability according to 7-fold cross-validation (Q2Y) is 0.80.

Clustering andreverse
engineering:from genes to
themetabolome
HumbertoOrtiz Zuazaga
Introduction
Clustering
ReverseEngineering
Transcriptional clustering
Microarrays measure abundance of many (all) genes in asample.
Microarray analysis makes extensive use of clustering.
Extensive review in PMID: 11099257

Clustering andreverse
engineering:from genes to
themetabolome
HumbertoOrtiz Zuazaga
Introduction
Clustering
ReverseEngineering
What is a distance metric?

Clustering andreverse
engineering:from genes to
themetabolome
HumbertoOrtiz Zuazaga
Introduction
Clustering
ReverseEngineering
Distance metrics in microarray analysis
Euclidean distance
Mutual information
Coeficient of correlation

Clustering andreverse
engineering:from genes to
themetabolome
HumbertoOrtiz Zuazaga
Introduction
Clustering
ReverseEngineering
Euclidean distance
according to Euclid’s formula for geometric distance
can generalize to n dimensions
Clustering andreverse
engineering:from genes to
themetabolome
HumbertoOrtiz Zuazaga
Introduction
Clustering
ReverseEngineering
Common clustering techniques
Hierarchical - Eisen et al
K Means, Fuzzy K Means
Self Organizing Maps (SOM) - GENECLUSTER
Support Vector Machines (SVM)
clique graphs - Amir Ben-Dor

Clustering andreverse
engineering:from genes to
themetabolome
HumbertoOrtiz Zuazaga
Introduction
Clustering
ReverseEngineering
CLUSTER
Eisen et al PNAShttp://rana.lbl.gov/papers/Eisen_PNAS_1998.pdf
http://rana.lbl.gov/
Free software and manuals (registration required)
Question: what clustering technique and distancefunction?

Clustering andreverse
engineering:from genes to
themetabolome
HumbertoOrtiz Zuazaga
Introduction
Clustering
ReverseEngineering
GENECLUSTER
Tamayo et al PNAS http://www.pnas.org/cgi/content/abstract/96/6/2907
Question: what clustering technique and distancefunction?

Clustering andreverse
engineering:from genes to
themetabolome
HumbertoOrtiz Zuazaga
Introduction
Clustering
ReverseEngineering
Reverse engineering gene expression networks
Deduce patterns of gene regulation from measured expressiondata.

Clustering andreverse
engineering:from genes to
themetabolome
HumbertoOrtiz Zuazaga
Introduction
Clustering
ReverseEngineering
Inference Techniques
Boolean networks
Mutual information
Linear networks
Neural Networks
A Comparison of Genetic Network Models, L.F.A. Wessels, E.P.Van Someren, and M.J.T. Reinders; Pacific Symposium onBiocomputing 6:508-519 (2001).

Clustering andreverse
engineering:from genes to
themetabolome
HumbertoOrtiz Zuazaga
Introduction
Clustering
ReverseEngineering
Boolean networks
Represent gene levels and stimuli as on or off
Very simple biological model, simple computationalapproach
Discovery of Regulatory Interactions Through Perturbation:Inference and Experimental Design, T.E. Ideker, V. Thorsson,and R.M. Karp; Pacific Symposium on Biocomputing5:302-313 (2000).

Clustering andreverse
engineering:from genes to
themetabolome
HumbertoOrtiz Zuazaga
Introduction
Clustering
ReverseEngineering
Boolean formulas
True 1, False 0, and (∧), or (∨), not (¬)
1 ∧ 0 = 0
1 ∧ 1 = 1
1 ∨ 0 = 1
1 ∨ 1 = 1
¬0 = 1
¬1 = 0

Clustering andreverse
engineering:from genes to
themetabolome
HumbertoOrtiz Zuazaga
Introduction
Clustering
ReverseEngineering
Boolean network

Clustering andreverse
engineering:from genes to
themetabolome
HumbertoOrtiz Zuazaga
Introduction
Clustering
ReverseEngineering
Expression matrix
For a set of genes and a set of perturbation experimentsconstruct an expression matrix as shown:

Clustering andreverse
engineering:from genes to
themetabolome
HumbertoOrtiz Zuazaga
Introduction
Clustering
ReverseEngineering
Inference Procedures
From the expression matrix, the Predictor generates(possibly several) network hypothesis
The Chooser selects a new perturbation experiment, thatwould best discriminate between available hypotheses.
Clustering andreverse
engineering:from genes to
themetabolome
HumbertoOrtiz Zuazaga
Introduction
Clustering
ReverseEngineering
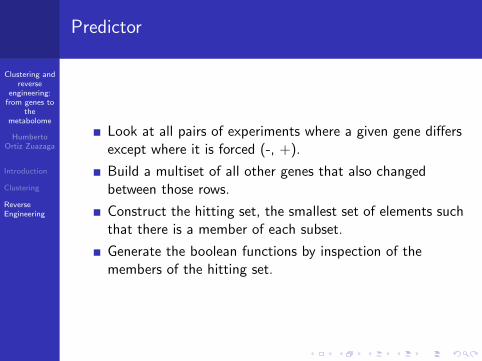
Predictor
Look at all pairs of experiments where a given gene differsexcept where it is forced (-, +).
Build a multiset of all other genes that also changedbetween those rows.
Construct the hitting set, the smallest set of elements suchthat there is a member of each subset.
Generate the boolean functions by inspection of themembers of the hitting set.
Clustering andreverse
engineering:from genes to
themetabolome
HumbertoOrtiz Zuazaga
Introduction
Clustering
ReverseEngineering
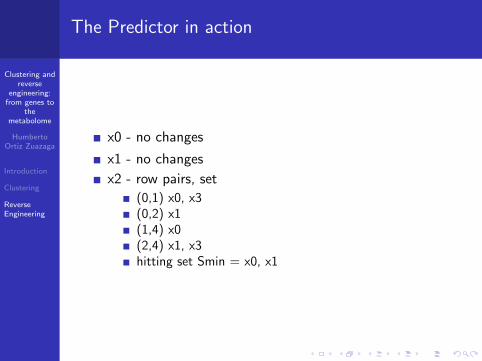
The Predictor in action
x0 - no changes
x1 - no changes
x2 - row pairs, set
(0,1) x0, x3(0,2) x1(1,4) x0(2,4) x1, x3hitting set Smin = x0, x1
Clustering andreverse
engineering:from genes to
themetabolome
HumbertoOrtiz Zuazaga
Introduction
Clustering
ReverseEngineering
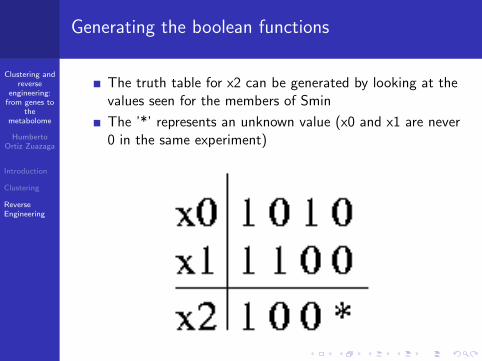
Generating the boolean functions
The truth table for x2 can be generated by looking at thevalues seen for the members of Smin
The ’*’ represents an unknown value (x0 and x1 are never0 in the same experiment)
Top Related