


Languages
Pages
Legal


Clinical Trials of Lipid Therapy in Diabetic Subjects (subgroup analysis)
Haffner Diabetes Care; 1: 1998
Study journal N LDL-C Baseline CHD lowering LDL-C reduction
Primary preventionHelsinki HS Diabetes 135 -6 % 4,9 mmol/l -60 % (ns) Care 1992 191 mg/dlAFCAPS/TEXCAPS JAMA 1998 264 -25% 3.9 mmol/l -43 % (ns)
150 mg/dlSecondary preventionCARE NEJM 1996 586 -28 % 3,5 mmol/l -25 % (p=0.05)
137 mg/dl4S Diabetes 202 -36 % 4,8 mmol/l -55 % (p=0.002) Care 1997 186 mg/dl

Risk Reduction by Simvastatin
Estimated CHD reduction after treating 100 CHD patients for 6 years
Expected fatal and non fatal Ml’s
Number of prevenedFatal and non fatal MI’s
patients with diabetes
patients without diabetes
49
29
24
9
Pyörälä K et al. Diabetes Care 20(4): 614 - 620, 1997

Overview Presentation
• Who are at risk– Secondary prevention– Primary prevention - Diabetes Mellitus type 2
• Lowering Cholesterol– Secondary prevention– Primary prevention
• Beyond cholesterol lowering• How low should we go• Guidelines

Atherosclerosis“The Overall Picture”
Relationship Between Endothelial Function and HMG-CoA reductase Inhibitors
Restoration of endothelium-dependent vasomotion is on of the earliest recognizable benefits after treatment with HMG-CoA reductase
inhibitors.
Treasure et al. N Engl J Med 332:481-487, 1995Anderson et al. N Engl J Med 332:488-493,1995O’Driscoll et al. Circulation 95:1128-1131, 1997
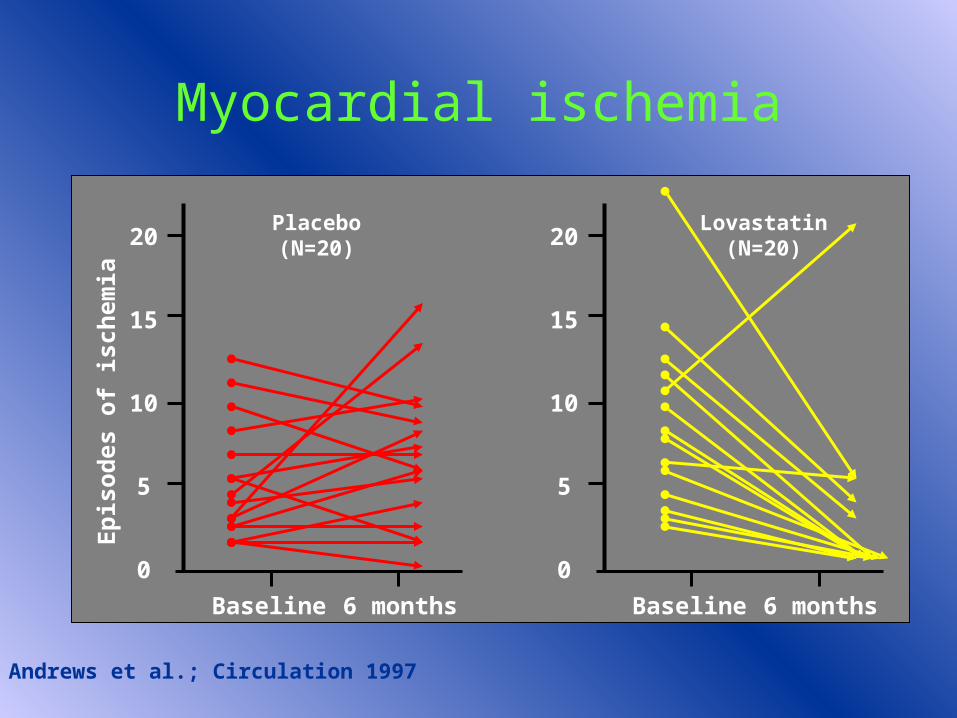
Myocardial ischemia
0
5
15
20
10
Baseline 6 months
Andrews et al.; Circulation 1997
Placebo(N=20)
Ep
iso
des
of
isch
emia
0
5
15
20
10
Baseline 6 months
Lovastatin(N=20)

Study Design • 43 non-diabetic patients
– Normal CAG– Positive exercise test– 43 –61 yrs– Serum total cholesterol > 7.75 mmol/l ( > 300 mg/dl)
• Step 1 diet – 12 weeks• Randomized for diet (n=20) or statins (n=23) – 16 weeks• Statins withdrawn
– Lipid profile – Exercise test
• Repeat after 20 weeks– Lipid profile– Exercise test
A.P. Mansur, et al. Heart 1999;82:689

ResultsAt week 28:
Statin group: significant reductions in plasma lipidsPositive exercise test 23 > 3
Diet group: no significant changes in plasma lipidsPositive exercise test 20 > 15
At week 48:
Statin group: plasma lipids returned to base line levels17 patients on statins; positive exercise test in
15
Diet group: Positive exercise test in 14 out of 15 patients
A.P. Mansur, et al. Heart 1999;82:689
Overview Presentation
Who are at riskSecondary prevention
Primary prevention - Diabetes Mellitus type 2
Lowering CholesterolSecondary prevention
Primary prevention
Beyond cholesterol lowering
How low should we go?
Guidelines
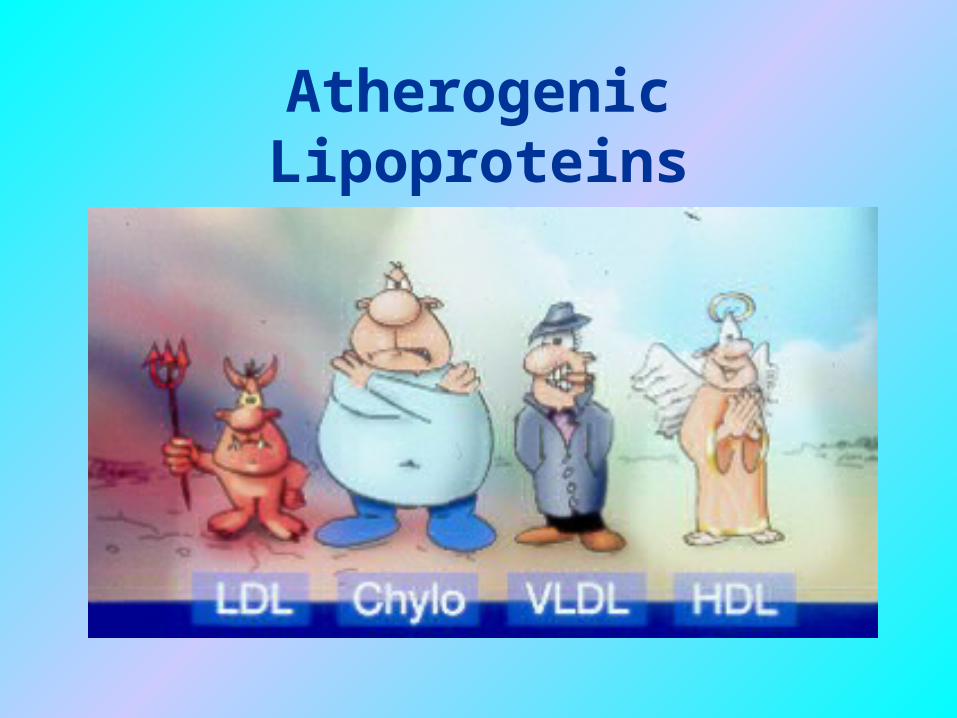
Atherogenic Lipoproteins

Aggressive Tx (93-96)*
Moderate Tx (134-136)*
Post-CABG Study:Aggressive vs Moderate Treatment
Post-CABG Trial Investigators. N Engl J Med. 1997;336:153-162.
* Mean achieved.
Follow-up (mo)12 24 36 486
80
90
100
110
120
130
140
150
160
0
LDL-C(mg/dL)

Is Lower Better? Aggressive Lipid Lowering is Associated with More Favorable Outcomes
05
101520
2530354045
Mea
n %
of
gra
fts
per
pat
ien
t
Aggressive Moderate
*P0.001 vs moderate therapy group.Mean lovastatin dose 76 mg in aggressive group and 4 mg in moderate group. After 1 year, mean LDL-C level was 93 mg/dL (2.4 mmol/L) in the aggressive group and 136 mg/dL (3.5 mmol/L) in the moderate group.The Post CABG Trial Investigators. N Engl J Med 1997;336:153–162.
Grafts with occlusion or death
Grafts withnew lesions
Grafts with progression or death
*
* *

On-Treatment LDL Levels and Correlation with Major Coronary Events in 4S
Circulation 1997;96:I-717
10.813.3
18.9
0
4
8
12
16
20
24
58-104 105-126 127-266
LDL Levels (mg/dL)
Maj
or C
oron
ary
Eve
nt
Rat
e
Absolute difference in event rate:
2.3%5.6%
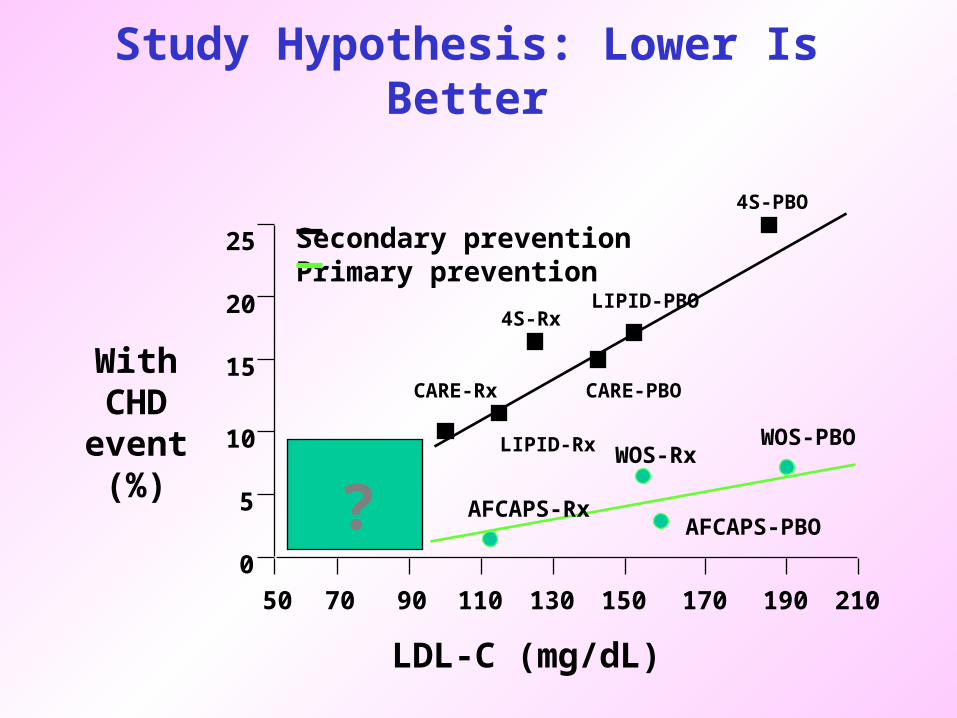
Study Hypothesis: Lower Is Better
With CHDevent(%)
50
0
5
10
15
20
25
70 90 110 130 150 170 190 210
LDL-C (mg/dL)
Secondary preventionPrimary prevention
LIPID-Rx
CARE-PBOCARE-Rx
4S-RxLIPID-PBO
4S-PBO
AFCAPS-Rx
WOS-RxWOS-PBO
AFCAPS-PBO?

Is Lower Better? TNT/ IDEAL Study Hypotheses
With CHDevent(%)
0
5
10
15
20
25
50 70 90 110 130 150 170 190 210
LDL-C mg/dL
Secondary preventionPrimary prevention
TNT 80 mgTNT 10 mg
TNT Entry
IDEAL-sim
IDEAL-Entry
IDEAL-ator

“Normal” Plasma Cholesterol“Normal” Plasma Cholesterol700
(18.0)
300(7.7)
200(5.2)
150(3.9)
100(2.6)
50(1.3)
0Pla
sma
ch
ole
ster
ol
leve
l m
g/d
l (m
mo
l/l)
Physiologic level for plasma LDL-Cholesterol
as predicted from receptor studies
25 mg/dl (0.65mmol/l)
FH Homozygotes
FH Heterozygotes
Normal Adults
Newborns
Guinea pig Cow Rabbit
Rat Sheep CamelPig

Overview PresentationWho are at risk
Secondary prevention
Primary prevention - Diabetes Mellitus type 2
Lowering CholesterolSecondary prevention
Primary prevention
Beyond cholesterol lowering
How low should we go• Guidelines
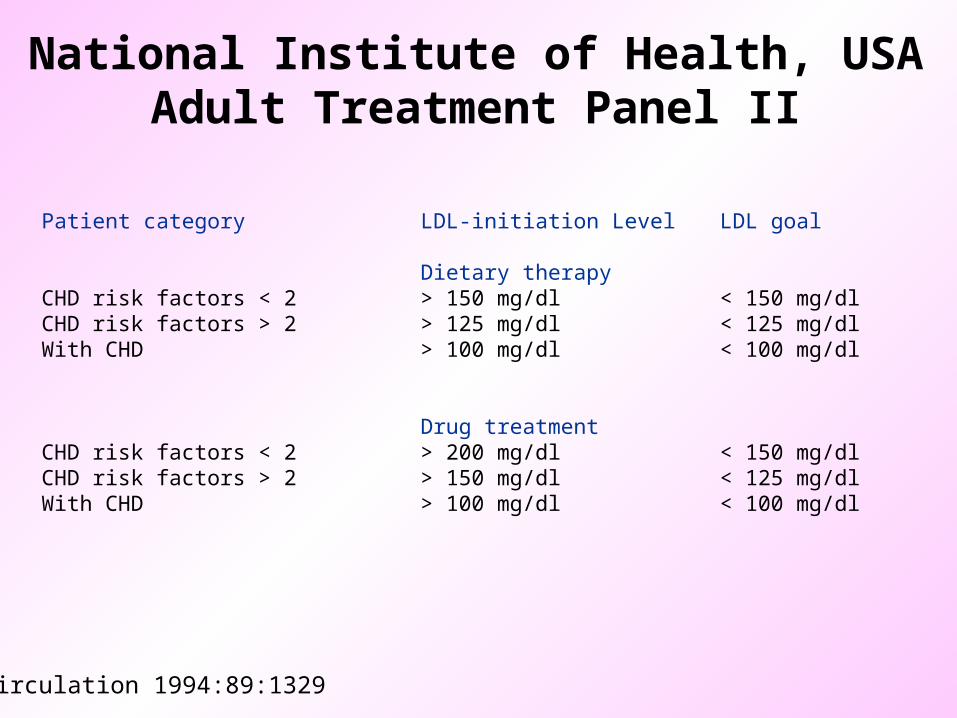
National Institute of Health, USAAdult Treatment Panel II
Patient category LDL-initiation Level LDL goal
Dietary therapyCHD risk factors < 2 > 150 mg/dl < 150 mg/dlCHD risk factors > 2 > 125 mg/dl < 125 mg/dlWith CHD > 100 mg/dl < 100 mg/dl
Drug treatmentCHD risk factors < 2 > 200 mg/dl < 150 mg/dlCHD risk factors > 2 > 150 mg/dl < 125 mg/dlWith CHD > 100 mg/dl < 100 mg/dl
Circulation 1994:89:1329
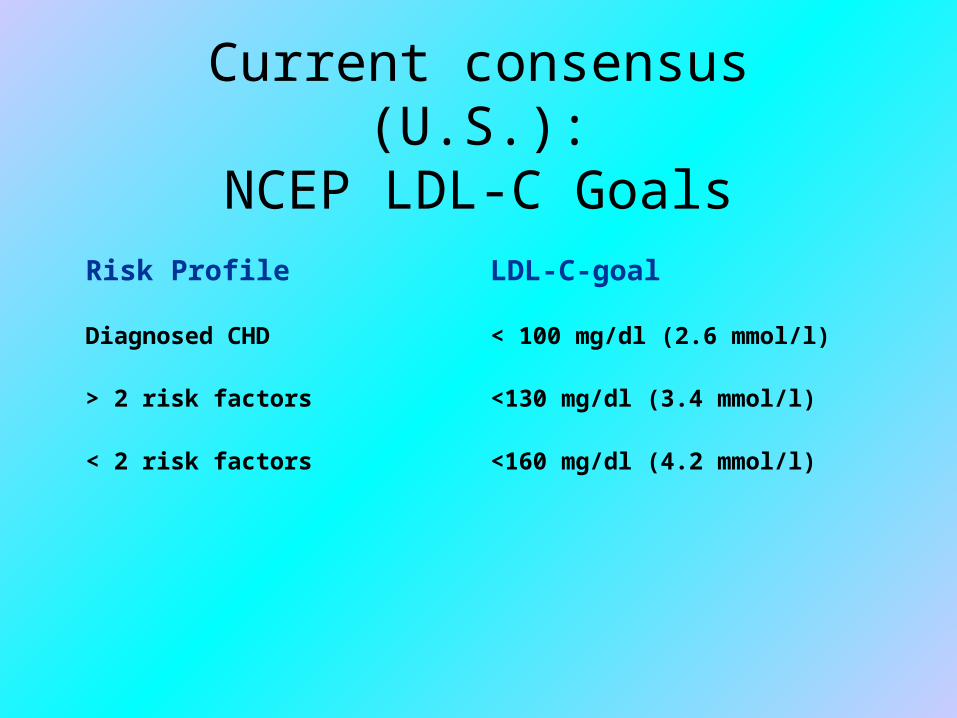
Current consensus (U.S.):NCEP LDL-C Goals
Risk Profile LDL-C-goal
Diagnosed CHD < 100 mg/dl (2.6 mmol/l)
> 2 risk factors <130 mg/dl (3.4 mmol/l)
< 2 risk factors <160 mg/dl (4.2 mmol/l)

Therapeutic group Conservative Drugs (based onmeasures (weight LDL-cholesterol)loss, lipid-lowering,diet
Cholesterol 200–250 mg/dl effective in majority Only in CHD or very LDL cholesterol 135–175 mg/dl high risk and un-
responsive to diet
Cholesterol 250–300 mg/dl Need close dietary CHD or high risk if LDL
LDL cholesterol 175–200 mg/dl compliance > 125 mg/dl andMost respond unresponsive to diet
adequately
Cholesterol > 300 mg/dl Need close dietary Justified even in ab-LDL-cholesterol > 200 mmol/l compliance sense of other risk
Three month trial factors in genetic dyslipidemias
European Atherosclerosis Guidelines:management of hypercholesterolemia
Nutrition Metabolism and Cardiovascular Disease 1998:2:113

Second Joint Task Force Guidelines
Lipoprotein marker Goal of therapy
LDL-C goal <3.0 mmol/L (115 mg/dL)
Total-C goal <5.0 mmol/L (190 mg/dL)

CHD events per year
4.5% 3.0% 2.0% 1.5%
NNT for 5 years* 13 20 30 40
Cost per life year gained# £ 5100 £ 8200 £ 10 700 £ 12 500
Cumulative proportion of 5.1% 8.2% 15.8%24.7%proportion of adults in UKabove CHD risk treshold
Annual cost of treatment £ 549 m £ 885 m £ 1 712 m £ 2 673 mif implemented fully in UK
*Number needed to treat for 5 years to prevent one major coronary event# For Simvastatin treatment at 27.4 mg daily
Statin Treatment at Four CHD Risk LevelsStatin Treatment at Four CHD Risk Levels
Pickin et al. Heart 1999; 82:325

Archie Cochrane’s Plea:
“All effective treatments be made available”
Appears unsustainable at current level of
funding and health level service resources
Pickin et al. Heart 1999; 82:325

PracticalGuidelines

Guidelinestreatment goals?
• Total cholesterol < 5.0 mmol/l (200 mg/dl)
• LDL-cholesterol < 3.0 mmol/l (115 mg/dl)
• triglycerides < 2.0 mmol/l (80 mg/dl)
• HDL-cholesterol > 1.0 mmol/l (40 mg/dl)
5,3,2,1 rule

Guidelineslifestyle
• Stop smoking
• Prevent obesity
• exercise : 3 - 5 x week 30 min
• Diet:– Fruit, vegetables, whole grain cereals
– low fat dairy products
– 2 x per week fish and 1 x per week vegetarian
– avoid snacks and sweets
– fish - pasta - olive oil - red wine (Mediterranean-diet)

GuidelinesDrugs
• Step 1: LDL-reduction
• Step 2: HDL-cholesterol increase and triglyceride
decrease
• Start statins when
– LDL-cholesterol > 3.0 mmol/l
– HDL-cholesterol < 0.9 mmol/l en TG < 2.0 mmol/l
– TG < 4.5 mmol/l

Priorities for Lipid loweringPriorities for Lipid lowering
• Secondary prevention
• Patients with diabetes mellitus type 2
• Patients with genetic dyslipidemia's
• Patients with multiple risk factors

Summary
• Who are at risk–Secondary prevention–Primary prevention - Diabetes Mellitus type 2
• Lowering Cholesterol–Secondary prevention–Primary prevention
• Beyond cholesterol lowering
• How low should we go
• Guidelines

Top Related