


Languages
Pages
Legal


Climate Change: The physical
science basis
Mostly extracted from the IPCC Fourth Assessment Report 2007
Summary for Policy Makers
Bano Mehdi
Advanced Integrated Water Resources Management course
Bridgetown, September 26, 2007

100 units
30% reflected and
scattered by
earth’s albedo
51% absorbed at surface
19% absorbed by
atmosphere and clouds
Energy lost to space
6 units
Solar radiation + infrared
117 units
Energy absorbed by GHG
111 units
Greenhouse Effect
GHG:
CO2, CH4, N2O, H2O

Climate Change terminology
Climate change in IPCC usage refers to any change
in climate over time, whether due to natural
variability or as a result of human activity.

Description of confidence
Terminology Degree of confidence in being
correct
Very high confidence At least 9 out of 10 chance of being
correct
High confidence About 8 out of 10 chance
Medium confidence About 5 out of 10 chance
Low confidence About 2 out of 10 chance
Very low confidence Less than a 1 out of 10 chance

Description of likelihood
Terminology Likelihood of the occurrence/
outcome
Virtually certain >99% probability of occurrence
Very likely 90 to 99% probability
Likely 66 to 90% probability
About as likely as not 33 to 66% probability
Unlikely 10 to 33% probability
Very unlikely 1 to 10% probability
Exceptionally unlikely <1% probability

Changes in GHG from ice
cores and modern data
IPCC 2007: WG1-AR4

Ice cores show evidence of a close relationship between greenhouse gas
concentrations and climate
2005 CO2 levels are
379 ppm3

-1
0
1
2
3
4
5
6
1900 1920 1940 1960 1980 2000 2020 2040 2060 2080 2100
Observed
CGCM1
Other AOGCMs HadCM2
CSIRO
GFDL
ECHM4
Source: Boer et al. (2000); IPCC Data Distribution Centre
Projected Changes in Global Surface Temperature
IPCC
RangeTemperature increase since 1850:
Planet: +0.76 (0.57-0.95oC)

Changes in temperature and sea level
IPCC 2007: WG1-AR4
1850 1900 1950 2000
Total 20th century
sea level rise is
0.17 m ±0.05m
T increase since
1850, 0.76 ±0.9oC
Observed sea level rise
IPCC 2007: WG1-AR4

Projected warming and sea level rise
IPCC 2007: WG1-AR4
Even if GHG are kept constant at 2000 levels, warming of 0.1oC per decade is expected
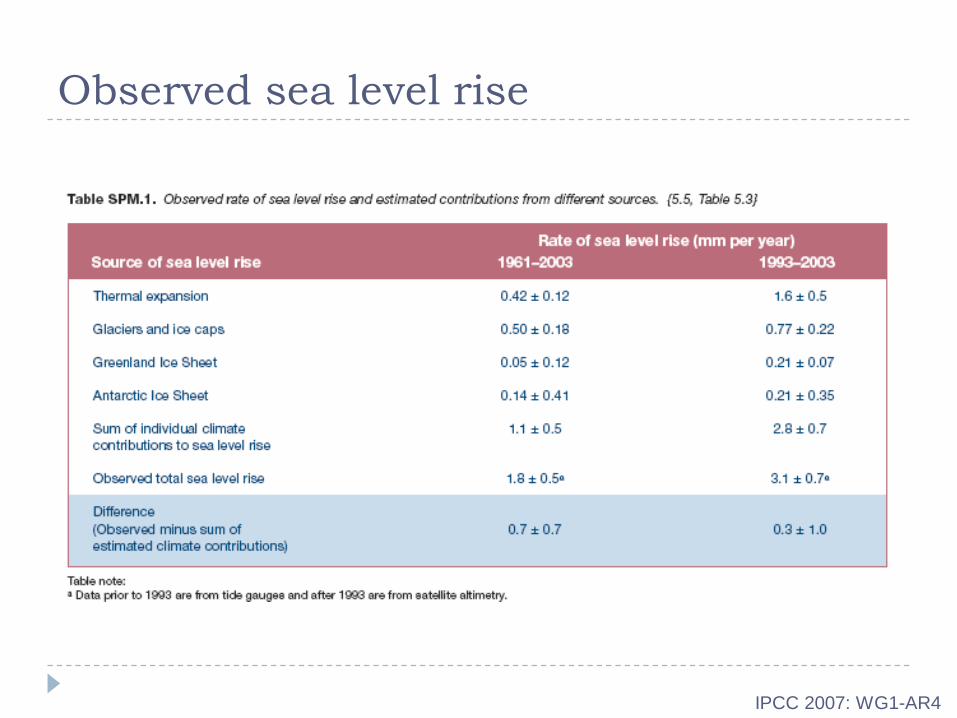
Multi model averages and assessed
ranges for surface warming
IPCC 2007: WG1-AR4
Likely
range

Projections of surface temperatures
IPCC 2007: WG1-AR4

Projected patterns of precipitation
changes
IPCC 2007: WG1-AR4

Precipitation has increased in some parts of the
world and decreased in others
Trends (%/century) in annual precipitation for 1900-2000
Insert figure
IPCC 2001

How has the climate changed in
Canada?
Some historical data…

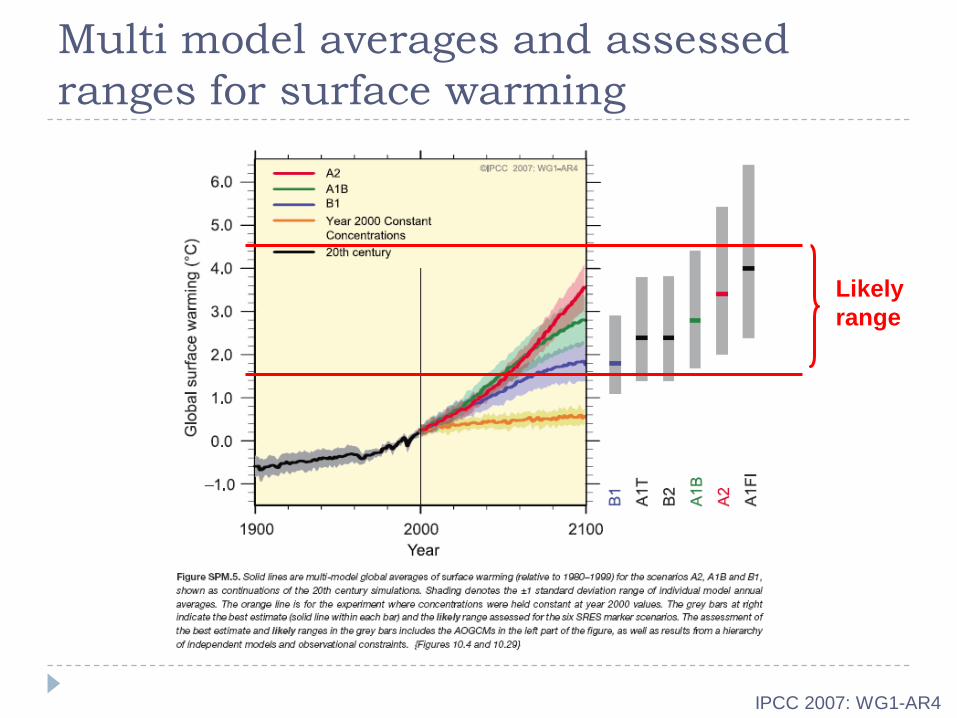
Trend in
number of cold
spells
(consecutive
periods below
20th percentile) -
+
The number of cold spells are decreasing
Climate Research Branch (MSC).
Southern Ontario and Quebec:
Length of the growing season for grain corn
increased from current 135-149 days to
about 165-194 days for 2070-2099Gameda et al., 2004

•The last five years
have been wetter
than normal.
•Since 1973 only 3
annual values have
been drier than
normal

Trends in heavy precipitation vary across CanadaFraction of
annual
precipitation
falling
as heavy events
(%/yr) 1940-95
ºº
Erosion rates
•SWCS: 15 and 30 min rainfall intensities have increased by 10%. Greatest for the 2 and 5 yr return periods.
•For a 10% increase in mean annual ppt, change in erosion by 24% and change in runoff by 25%.
Zhang et al. 2001

10 20 40 80
Recurrence time (years)
40
50
60
70
80
90
100
Siz
e o
f E
vent (m
m)
1985
2050
2090
Trends in Extreme Events


Human influence and projections
IPCC 2007: WG1-AR4
Top Related