


Languages
Pages
Legal


ASIAN DEVELOPMENT BANK6 ADB Avenue, Mandaluyong City1550 Metro Manila, Philippineswww.adb.org
ASIAN DEVELOPMENT BANK
CLIMATE CHANGE PROFILE OF PAKISTAN
Climate Change Profi le of Pakistan
Catastrophic fl oods, droughts, and cyclones have plagued Pakistan in recent years. The 2010 fl ood killed 1,600 people and caused around $10 billion in damage. The 2015 Karachi heat wave led to the death of more than 1,200 people. Climate change-related natural hazards may increase in frequency and severity in the coming decades. Climatic changes are expected to have wide-ranging impacts on Pakistan, a� ecting agricultural productivity, water availability, and increased frequency of extreme climatic events. Addressing these risks requires climate change to be mainstreamed into national strategy and policy. This publication provides a comprehensive overview of climate change science and policy in Pakistan.
About the Asian Development Bank
ADB’s vision is an Asia and Pacifi c region free of poverty. Its mission is to help its developing member countries reduce poverty and improve the quality of life of their people. Despite the region’s many successes, it remains home to a large share of the world’s poor. ADB is committed to reducing poverty through inclusive economic growth, environmentally sustainable growth, and regional integration.
Based in Manila, ADB is owned by 67 members, including 48 from the region. Its main instruments for helping its developing member countries are policy dialogue, loans, equity investments, guarantees, grants, and technical assistance.

ASIAN DEVELOPMENT BANK
Prepared by:
Qamar Uz Zaman Chaudhry, International Climate Technology Expert

Creative Commons Attribution 3.0 IGO license (CC BY 3.0 IGO)
© 2017 Asian Development Bank6 ADB Avenue, Mandaluyong City, 1550 Metro Manila, PhilippinesTel +63 2 632 4444; Fax +63 2 636 2444www.adb.org
Some rights reserved. Published in 2017.
ISBN 978-92-9257-721-6 (Print), 978-92-9257-722-3 (e-ISBN) Publication Stock No. TCS178761 DOI: http://dx.doi.org/10.22617/TCS178761
The views expressed in this publication are those of the authors and do not necessarily reflect the views and policies of the Asian Development Bank (ADB) or its Board of Governors or the governments they represent.
ADB does not guarantee the accuracy of the data included in this publication and accepts no responsibility for any consequence of their use. The mention of specific companies or products of manufacturers does not imply that they are endorsed or recommended by ADB in preference to others of a similar nature that are not mentioned.
By making any designation of or reference to a particular territory or geographic area, or by using the term “country” in this document, ADB does not intend to make any judgments as to the legal or other status of any territory or area.
This work is available under the Creative Commons Attribution 3.0 IGO license (CC BY 3.0 IGO) https://creativecommons.org/licenses/by/3.0/igo/. By using the content of this publication, you agree to be bound by the terms of this license. For attribution, translations, adaptations, and permissions, please read the provisions and terms of use at https://www.adb.org/terms-use#openaccess
This CC license does not apply to non-ADB copyright materials in this publication. If the material is attributed to another source, please contact the copyright owner or publisher of that source for permission to reproduce it. ADB cannot be held liable for any claims that arise as a result of your use of the material.
Please contact [email protected] if you have questions or comments with respect to content, or if you wish to obtain copyright permission for your intended use that does not fall within these terms, or for permission to use the ADB logo.
Notes: In this publication, “$” refers to US dollars. Corrigenda to ADB publications may be found at http://www.adb.org/publications/corrigenda
Photo credits: Photo on page 8: Nadeem Khawar Photo on page 62 and 68: Salman Rashid

iii
Contents
Tables, Figures, and Boxes v
Preface vii
Acknowledgments viii
Executive Summary ix
Currency Equivalents x
Weights and Measures x
Glossary x
Abbreviations xi
I. Introduction 1A. Country Overview 1B. Government’s Climate Change Objectives: Adaptation and Mitigation 3C. About this Report 7
II Climate Change Trends and Impacts 9A. Greenhouse Gas Emission Profile of Pakistan 9B. Climate Change Trends in Pakistan 11
1. Observed Past Climate Trends 112. Projections of Future Climate Trends in Pakistan 17
a. Future Trends of Temperature and Precipitation 17b. Projected Sea Level Rise 21
C. Sector Climate Change Impacts 231. Climate Change Impacts on Agriculture, Livestock, and Forestry 232. Climate Change Impacts on Water Sector in Pakistan 283. Climate Change Impacts on Energy Sector 314. Climate Change Impacts on Coastal Areas 345. Climate Change Impacts on Transport and Urban Sector 356. Climate Change Impacts on the Health Sector 36
III. Institutional Arrangements for Climate Change 39A. Evolution of Climate Change Institutional Arrangements in Pakistan 41
1. Disaster Risk Management Arrangements 412. The Ministry of Climate Change 42
B. Climate Change Linkages to Key Sectors 431. National Climate Change Policy (2012) 432. Other Supporting Policies and Framework 50

iv Contents
IV. Climate Finance Landscape of Pakistan 55A. Domestic Climate-Relevant Finance Mechanisms and Tools 56
1. Planning Processes and Receptivity toward Climate Change 562. Provincial Financial Landscape and Climate Change 593. Institutional Structure for Managing Climate Finance 59
B. International Climate Finance 61
V. Climate Change Adaptation Technologies in Pakistan 63A. Sector-Specific Adaptation Technologies to Climate Risks 63B. Research Gaps 66
VI. ADB Initiatives in Pakistan and their Exposure to Climate Change Risks 69A. Asian Development Bank Initiatives in Pakistan 69B. Climate Change Risk Screening Approach 70C. Initial Climate Change Risk Screening of Asian Development Bank Development
Program Portfolio in Pakistan 71D. Risk Summary by Sector and Subregion 79
Additional Suggested Readings 80
References 82
Appendixes 1 Clean Development Mechanism Projects of Pakistan 88
2 Priority List of Federal Adaptation and Mitigation Projects of Pakistan, 2013–2014 90
3 A Brief Overview of the Available International Climate Financing 98
4 Description of Some Suggested Adaptation Technologies for Pakistan 104
5 Classification of Climate Change Relevant Activities 111
6 Pakistan District Level Climate Risk and Hazard Assessment Classification 113

v
Tables, Figures, and Boxes
Tables 1 Projected Greenhouse Gas Emissions by Sector in 2020
and 2050 Under Business as Usual Scenarios 11 2 Mean Temperatures Trends in Pakistan, 1951–2000 15 3 Percentage of Precipitation Changes on Yearly Basis in Pakistan 1951–2000 16 4 Regionwide Climate Projections for Pakistan for Alternative Scenarios, 2011–2050 18 5 Change in Length of Wheat Growing Season and Production in Different
Climatic Regions of Pakistan by 2080 24 6 Projected Percent Changes in Major Crops Yield (2020–2080)
Compared to Baseline Yield (1961–1990) under A2 Scenario 26 7 Changes in Forest Areas of Different Types of Plants in Northern Pakistan
Under Changed Climate vs. 1961–1990 average, in % Change 27 8 Distribution of Water in Main Rivers of Pakistan 29 9 Brief History of Institutionalization of Climate Change in Pakistan 39 10 Summary of Changes in Responsibilities Between the Federal and
Provincial Levels of Government Before and After the Devolution of the 18th Constitutional Amendment in 2010 46
11 Four-Year Summary Analysis of Climate Expenditures in Development, Current, and Total Federal Development Budget 57
12 Climate Change Risks and Suggested Adaptation Technologies in the Agriculture Sector of Pakistan 63
13 Distribution of Uptake of Adaptation Strategies in Sindh and Punjab Agroclimatic Zones 64 14 Climate Change Risks and Suggested Adaptation Technologies in the Water Sector of Pakistan 65 15 Climate Change Risks and Suggested Adaptation Technologies in the Energy Sector of Pakistan 65 16 Climate Change Risks and Suggested Adaptation Technologies
in the Urban Infrastructure Services Sector of Pakistan 66 17 Amount of Information Supporting Conclusions Regarding Observed
and Projected Impacts for Central and West Asia 67 18 Climate Change Risks to ADB Development Portfolio in Pakistan 72 19 Consolidated Results of Screening of Selected ADB Projects by Region and Sector 79
Figures 1 Work Program for Climate Compatible Development in Pakistan 5 2 Sector Share Comparison of Greenhouse Gas Inventories for Pakistan, 2008
and 2012 10 3 Region-Wide Increase in Winter (Blue), Summer (Red) and Annual
(Yellow) Mean Temperatures from 1960 to 2007 12 4 Time Series of Area-Weighted Mean Daily Temperatures Averaged
over Each Year from 1960 to 2013 14 5 Time Series Annual Average Precipitation, 1901–2007 16 6 Mean Sea Level Rise Recorded along Karachi Coast, Pakistan, 1850–2000 18

vi Tables, Figures, and Boxes
7 Pakistan’s Mean Annual Temperature and Precipitation Deviation Projections During 21st Century Using Two Different Emission Scenarios 20
8 Coupled Model Intercomparison Project Phase-5 Projections of Annual Average Temperature Changes (°C) for 2011–2100 under Representative Concentration Pathways 4.5, Relative to 1975–2005 APHRODITE Baseline 20
9 Coupled Model Intercomparison Project Phase-5 Mean Projections of Annual Average Temperature Changes (°C) for 2011–2100 under Representative Concentration Pathways 8.5, Relative to 1975–2005 APHRODITE Baseline 21
10 CMIP5 Projections of Changes in Annual Mean Precipitation (mm/day) for 2011–2100 Under RCP4.5, Relative to 1975–2005 APHRODITE Baseline 22
11 CMIP5 Projections of Changes in Annual Mean Precipitation (mm/day) for 2011-2100 Under RCP8.5, Relative to 1975–2005 APHRODITE Baseline 22
12 Projected Mean Sea Level Rise to 2100 in South Asia Region 23 13 Wheat Yield in Different Agroclimatic Zones of Pakistan, by 2080 under
Intergovernmental Panel on Climate Change A2 Scenario 25 14 Basmati Rice Production in Central Punjab in Semiarid Plains, by 2085,
under IPCC A2 and B2 Scenarios 25 15 Annual River Flows of the Indus River System in Pakistan, 1947 to 2002 29 16 Hydrological Model Snowmelt Runoff Model Simulated Mean Upstream Discharge
for the Present (2000 to 2007) and Future Climate for the A1B Special Report Emission Scenario (A1B [2046 to 2065]) for Indus Basin 30
17 Primary Energy Supply by Sources in Pakistan 32 18 Sector Allocation of Expenditures to Climate-Relevant Tasks in the Public Sector
Development Program of 2013–2014 58 19 Allocation of Expenditures to Climate-Relevant Activities
in the Public Sector Development Program of 2013–2014 58 A5.1 Early Warning System’s Reach in Pakistan 105A5.2 Punjab Water Balance Sheet 106
Boxes 1 Pakistan’s Global Greenhouse Gas Emissions Ranking 11 2 Key Findings of Past Observed Trends of Climate Change Indicators
and Future Projections for Pakistan 13 3 Key Findings on the Water Challenges for Pakistan in a Changing Climate 28 4 Key Findings on Projected Climate Change Implications for Energy Sector in Pakistan 31 5 Key Findings on Projected Impacts of Climate Change on Coastal Areas of Pakistan 33 6 Key Findings on Projected Climate Change Implications on Urban Infrastructure
and Transport in Pakistan 35 7 Structure of the Ministry of Climate Change 42 8 Pakistan’s Climate Change-Relevant Federal Expenditure, 2010–2014 55 9 Khyber Pakhtunkhwa’s Climate Change-Relevant Provincial Expenditures, 2010-2014 59

vii
Preface
Pakistan has faced catastrophic floods, droughts, and cyclones in recent years that have killed and displaced thousands, destroyed livelihoods, and damaged infrastructure. Climate change raises the prospect that these and other natural hazards will increase
in frequency and severity in the coming decades—a stark reminder that Pakistan is one of the countries most vulnerable to the effects of climate change.
This climate change country profile provides a comprehensive overview of climate change science and policy in Pakistan, drawing insights from national and international literature. The profile covers (i) historical and future expected trends of climate change at provincial level, (ii) expected climate impacts on priority sectors, (iii) the institutional and policy frameworks to address climate change, (iv) climate finance sources, and (v) opportunities for adaptation.
Climatic changes are expected to have wide-ranging impacts on Pakistan: reduced agricultural productivity, increased variability of water availability, increased coastal erosion and seawater incursion, and increased frequency of extreme climatic events. Addressing these risks requires the mainstreaming of climate change into national strategy and policy; and climate-smart investments in infrastructure, businesses, and skills.
This report is targeted at policymakers, project developers, and development professionals whose work may be touched by climate change. The report may serve as a one-stop summary of climate change issues in Pakistan, or provide a starting point for in-depth analysis of climate risks at local or provincial level. The Asian Development Bank intends to play a key role in supporting the climate resilience of its member countries, and it is our hope that this report will be a useful resource for efforts to increase climate resilience in Pakistan.
Akmal SiddiqDirector, Agriculture, Water, and Natural Resources DivisionCentral and West Asia DepartmentAsian Development Bank

viii
Acknowledgments
This climate change profile of Pakistan was prepared by the Asian Development Bank (ADB) under the regional technical assistance project called Enhancing Readiness of ADB Developing Member Countries for Scaled Up Climate Finance (TA 8606-REG).
Akmal Siddiq, director, Environment, Natural Resources and Agriculture Division (CWER) of ADB’s Central and West Asia Department, initiated the study. The report was researched and authored by Qamar Uz Zaman Chaudhry, with supervision and input from Nathan Rive of CWER and Michael Rattinger and Janet Arlene Amponin of the Climate Change and Disaster Risk Management Division of ADB’s Sustainable Development and Climate Change Department. Hanna Uussimaa (climate specialist), Pacific Department and Xianfu Lu (consultant), SDCC kindly reviewed and provided comments.

ix
Executive Summary
Pakistan potentially faces a major climate change challenge. A concerted effort by the government and civil society at all levels is required to mitigate these threats.
In the last 50 years, the annual mean temperature in Pakistan has increased by roughly 0.5°C. The number of heat wave days per year has increased nearly fivefold in the last 30 years. Annual precipitation has historically shown high variability but has slightly increased in the last 50 years. Sea level along the Karachi coast has risen approximately 10 centimeters in the last century.
By the end of this century, the annual mean temperature in Pakistan is expected to rise by 3°C to 5°C for a central global emissions scenario, while higher global emissions may yield a rise of 4°C to 6°C. Average annual rainfall is not expected to have a significant long-term trend, but is expected to exhibit large inter-annual variability. Sea level is expected to rise by a further 60 centimeters by the end of the century and will most likely affect the low-lying coastal areas south of Karachi toward Keti Bander and the Indus River delta.
Under future climate change scenarios, Pakistan is expected to experience increased variability of river flows due to increased variability of precipitation and the melting of glaciers. Demand for irrigation water may increase due to higher evaporation rates. Yields of wheat and basmati rice are expected to decline and may drive production northward, subject to water availability. Water availability for hydropower generation may decline. Hotter temperatures are likely to increase energy demand due to increased air conditioning requirements. Warmer air and water temperatures may decrease the efficiency of nuclear and thermal power plant generation. Mortality due to extreme heat waves may increase. Urban drainage systems may be further stressed by high rainfall and flash floods. Sea level rise and storm surges may adversely affect coastal infrastructure and livelihoods.
Adapting to these impacts may include: development or use of crop varieties with greater heat and drought tolerance, modernizing irrigation infrastructure and employing water-saving technologies, integrated watershed management, reforestation of catchment areas and construction of additional water storage, diversification of energy mix including investment in renewable and small hydropower projects, improved weather forecasting and warning systems, retrofitting of critical energy infrastructure, and construction of dikes or sea walls.
The National Climate Change Policy of 2012 is Pakistan’s guiding document on climate change, setting out the goal of achieving climate-resilient development for the country through mainstreaming climate change in the economically and socially vulnerable sectors of the country. Approximately 6% of Pakistan’s federal budget during 2010–2014 comprised climate change-related expenditures, predominantly in energy and transport. As described in its Nationally Determined Contribution to the Paris Agreement under the United Nations Framework Convention on Climate Change, Pakistan intends to reduce up to 20% of its 2030 projected greenhouse gas emissions, subject to availability of international grants to meet the cumulative abatement costs amounting to approximately $40 billion. The country’s adaptation needs have been identified to range between $7 billion to $14 billion per year.

x
Currency Equivalents(As of 17 August 2017)
Currency Unit – Pakistan Rupee (PR)PR1.00 = $0.0095$1.00 = PR105.38
Weights and Measures0C – Celsius 0F – Fahrenheitha – hectarekm – kilometerkm2 – square kilometerk – kilowattm – meterm3/s1 – cubic meter per secondMAF – million acre footMha – million hectaremm – millimetermt – metric tonMtCO2e – million ton of carbon dioxide equivalent MW – megawattTOE – ton of oil equivalent
Glossarykharif – sowing season of summer crops (autumn)rabi – sowing season of winter crops (spring)

xi
Abbreviations
ADB – Asian Development BankAEDB – Alternative Energy
Development BoardAR5 – (IPCC) Fifth Assessment ReportARE – Alternative and Renewable
Energy PolicyCCD – Climate Change DivisionCCI – Council of Common InterestCDM – Clean Development MechanismCMIP5 – Coupled Model Intercomparison
Project Phase-5COBP – Country Operations Business PlanCOP – Conference of PartiesCPEIR – Climate Public Expenditure and
Institutional ReviewCPS – Country Partnership StrategyDNA – designated national authorityEAD – Economic Affair DivisionEIA – Environmental Impact Assessment EPA – Environmental Protection AgencyFAO – Food and Agriculture Organization
of the United NationsFATA – Federally Administered Tribal AreaGCF – Green Climate FundGCISC – Global Change Impact Studies
CentreGDP – gross domestic productGEF – Global Environment Facility GHG – greenhouse gasGLOF – glacial lake outburst floodHEIS – high efficiency irrigation systemHKH – Hindukhush–Karakoram–HimalayaINDC – Intended Nationally Determined
ContributionIPCC – International Panel
on Climate ChangeIRS – Indus River SystemKPK – Khyber Pakhtunkhwa LIBS – Lower Indus Basin in SindhMAR – managed aquifer recharge
MOF – Ministry of FinanceNAMA – national appropriate
mitigation actionNAP – National Adaptation Plan NCCP – National Climate Change Policy NDMA – National Disaster
Management AuthorityNDMC – National Disaster
Management CouncilNEC – National Economic CouncilPARC – Pakistan Agriculture
Research CouncilPCRWR – Pakistan Council of Research
in Water ResourcesPEPA – Pakistan Environmental
Protection Act PEPC – Pakistan Environmental
Protection Council PEPO – Pakistan Environmental
Protection Ordinance PMD – Pakistan Meteorological
Department PSDP – Public Sector
Development ProgramRCP – Representative
Concentration PathwayREDD+ – Reducing Emissions
from Deforestation and Forest Degradation
SLR – sea level riseUIB – Upper Indus Basin UNDP – United Nations
Development ProgrammeUNEP – United Nations
Environment Programme UNFCCC – United Nations Framework
Convention for Climate ChangeWAPDA – Water and Power
Development Authority

xii

1
Introduction
Pakistan’s vulnerability to climate change impacts is well documented and acknowledged.1 In the past decade, recurrent spells of extreme weather events such as floods, droughts, glacial lake outbursts, cyclones, and heat waves have taken a heavy toll on both life and
property and adversely affected the country’s economic growth. The super flood of 2010 alone, for instance, killed 1,600 people, inundated an area of 38,600 square kilometers (km2) and caused damage worth around $10 billion.2 Similarly, the Karachi heat wave (June 2015) led to the death of more than 1,200 people.3
A. Country OverviewGeography and Climate: Pakistan extends over an area of 796,000 km2 with a great diversity in temperature and precipitation. The eastern areas of the southern half mainly receive precipitation through the southwest summer monsoon (from June to September), while the northern and western areas of the southern half of the country get rains mainly through western weather disturbances in winter (from December to March). The summer monsoon accounts for around 60% of the total annual precipitation. The climate varies from arid to semiarid where three-fourths of the country receive rainfall of less than 250 millimeters (mm) annually, except in the southern slopes of Himalaya and the submountain region in the northern segment of the country, where annual rainfall ranges from 760 mm to 2,000 mm. The northern region includes some of the world’s highest mountain peaks, such as K-2 (8,611 meters [m] high), and the largest glaciers including Siachen (70 kilometers [km] long) and Biafo (63 km) that feed the Indus River and some of its tributaries.4 During winter, the temperatures in this region drop to as low as –50°C and stays around 15°C in the warmest months of May to September.5
The western and southern segments of the country represent the Indus River basin plain and Balochistan Plateau. The transboundary Indus basin covers 520,000 km2 or 65% of the country’s total area, including the whole provinces of Punjab, Khyber Pakhtunkhwa, most of the Sindh territory, and the eastern part of Balochistan.6 The Indus Basin Irrigation System is the world’s largest contiguous irrigation system, accounting for 95% of the country’s total irrigation system.
1 Government of Pakistan, Ministry of Climate Change. 2012. National Climate Change Policy. Islamabad; World Bank, Asian Development Bank. 2010. Pakistan Floods 2010: Preliminary Damages and Needs Assessment Report; S. Kreft and D. Eckstein. 2013. Global Climate Risk Index 2014: Who Suffers Most from Extreme Weather Events? Weather Related Loss Events in 2012 and 1993 to 2012. Briefing Paper. German Watch. Bonn. https://germanwatch.org/en/download/8551.pdf
2 A. Ali. 2013. Indus Basin Floods: Mechanism, Impacts and Management. Manila: ADB.3 Q. Z. Chaudhry et al. 2015. Karachi Heat Wave Event June 2015. Islamabad: Technical Report for the Ministry of Climate
Change Pakistan.4 World Commission on Dams. 2000. Tarbela Dam and Related Aspects of the Indus River Basin in Pakistan. http://
s3.amazonaws.com/zanran_storage/www.dams.org/ContentPages/1311315.pdf5 C. M. McSweeney, M. New and G. Lizcano. 2008. UNDP Climate Change Country Profile. New York. http://ncsp.undp.org/
sites/default/files/Pakistan.oxford.report.pdf6 FAO Aquastat Data Portal. http://www.fao.org/nr/water/aquastat/basins/indus/index.stm.

2 Climate Change Profile of Pakistan
The average annual rainfall in the Indus plain is around 230 mm. The temperature differences between the upper and lower basin plains are quite noticeable: the mean winter temperature (December–February) in the lower plain is 140C–200C, and 20C–230C in the upper plain areas, while during summer (March–June), the mean monthly temperature varies from 420C–440C in the lower plan, and 230C–490C in the upper plain.
The Balochistan Plateau is a vast wilderness of mountain ranges in the southwest of the country with an average altitude of about 600 m. Some seasonal rivers cross this region but most of its northwestern part is a wide expanse of desert similar to the deserts found in the central part of the country, such as Thar and Cholistan. The rainfall in this region is less than 210 mm annually or 20–30 mm per month.
Demography: Pakistan is the sixth most populous country in the world with a population size of 184.5 million. With the current average annual population growth rate of 2%, it is projected to be the fifth most populous country of the world by 2050.7 The density of population is 231 persons per km2 with almost 37% of the population residing in urban areas, of which around 47% are slum dwellers (footnote 7). The current total fertility rate of 3.8 is one of the highest in the Asia-Pacific region and the country holds the second highest out-of-school population in the world of which two-thirds are girls.8 The poverty rate estimated at $2 per day purchasing power parity exceeds 50% of the total population with stark provincial disparities.9 The southern subregions of all provinces are noted for a very high ratio of severe poverty incidences compared to their northern counterparts, except for Khyber Pakhtunkhwa province, where severe poverty is equally high in both subregions.10 This high prevalence of poverty, coupled with the lack of and access to resources places the country in the low human development category, ranked 146 out of 187 countries, well below the average human development index value compared to other South Asian countries.
Climate Threats: The Intergovernmental Panel on Climate Change (IPCC) Fifth Assessment Report (AR5) for the Asia region notes that sensitivity to climate change threats, in agriculture-dependent economies (such as Pakistan), arises from their distinct geography, demographic trends, socioeconomic factors, and lack of adaptive capacity that when taken together, determine the vulnerability profile by perpetuating a vicious cycle of poverty.11 The climate change projections of the AR5 for South Asia as a whole show that warming is likely to be above the global mean and climate change will impact the glaciers’ melting rate and precipitation patterns, particularly affecting the timing and strength of monsoon rainfall. Consequently, this will significantly impact the productivity and efficiency of water-dependent sectors such as agriculture and energy.
7 National Institute of Population Studies (NIPS) and ICF International. 2013. Pakistan Demographic and Health Survey, 2012-13. Islamabad, Pakistan and Maryland, USA: NIPS and ICF International.
8 World Bank. 2014. Country Partnership Strategy for the Period FY2015-19. Washington, DC.9 World Bank. Development Indicators. Data for 2011. http://povertydata.worldbank.org/poverty/region/SAS (accessed on
25 May 2015).10 A. Naveed and N. Ali. 2012. Clustered Deprivation: District Profile of Poverty in Pakistan. Islamabad.11 Y. Hijioka et al. 2014. Climate Change 2014: Impacts, Adaptation, and Vulnerability - Asia. Cambridge, United Kingdom, and
New York, USA: Cambridge University Press. p. 1350.

3Introduction
B. Government’s Climate Change Objectives: Adaptation and Mitigation
The Government of Pakistan has established a number of policies and actions to frame its overall objectives toward climate change adaptation and mitigation. The National Climate Change Policy (NCCP) of 2012 is the guiding policy document for the country on climate change, acknowledging the growing risk of future extreme natural hazards due to climate change and providing a detailed picture of vulnerabilities faced by individual sectors, ecoregions and socioeconomic classes.12 The major climate threats identified in the policy document are briefly summarized below:
(i) Considerable increase in the frequency and intensity of extreme weather events, coupled with erratic monsoon rains causing frequent and intense floods and droughts;
(ii) Projected recession of the Hindukush-Karakoram-Himalaya (HKH) glaciers due to global warming and carbon soot deposits from transboundary pollution sources, threatening water inflows into the Indus River System (IRS);
(iii) Increased siltation of major dams caused by more frequent and intense floods;(iv) Rising temperatures resulting in enhanced heat and water-stressed conditions,
particularly in arid and semiarid regions, leading to reduced agricultural productivity;(v) Further decrease in the already scanty forest cover, from too rapid change in climatic
conditions to allow natural migration of adversely affected plant species;(vi) Increased intrusion of saline water in the Indus Delta, adversely affecting coastal
agriculture, mangroves, and the breeding grounds of fish;(vii) Threat to coastal areas due to projected sea level rise and increased cyclonic activity
due to higher sea surface temperatures; (viii) Increased stress between upper and lower riparian regions in relation to sharing of
water resources; and (ix) Increased health risks and climate change-induced migration.
The NCCP sets out the clear goal of achieving climate resilient development for the country through mainstreaming climate change in the economically and socially vulnerable sectors of the country. The NCCP document identifies the vulnerability to climate change risk with a focus on different sectors and recommends policy measures on mitigation, adaptation, technology, capacity building, and forest-related actions. Furthermore, it has prioritized adaptation actions and measures over mitigation efforts, due to its low level of per capita greenhouse gas (GHG) emissions.
To achieve the goal of sustained economic development, the NCCP has laid out a set of objectives as stated below:
(i) To pursue sustained economic growth by appropriately addressing the challenges of climate change;
(ii) To integrate climate change policy with other interrelated national policies; (iii) To focus on pro-poor gender-sensitive adaptation, while also promoting mitigation to
the extent possible in a cost-effective manner;
12 Government of Pakistan, Ministry of Climate Change. 2012. The National Climate Change Policy. Islamabad.

4 Climate Change Profile of Pakistan
(iv) To ensure water security, food security and energy security of the country in the face of the challenges posed by climate change; and
(v) To minimize the risks arising from the expected increase in frequency and intensity of extreme weather events such as floods, droughts, and tropical storms.
These objectives emphasize a pro-poor and gender-sensitive adaptation approach that would build the adaptive capacity of the vulnerable population, including women, by addressing mainly the structural deficits such as access to knowledge, technology, and credit for agricultural development.13 Other sector-specific policy measures involve implementing risk management that would lead to mitigating the exposure of vulnerable groups to a particular threat (for example, strengthening of early warning systems). For mitigation activities, the policy objectives prefer cost-effectiveness of the intervention and/or program.
The Framework for Economic Growth (2011)—a blueprint for development prepared by the Planning Commission of Pakistan—was released in parallel with the NCCP.14 As a major policy-guiding document on economic growth, this acknowledges the interdependency and linkages of climate change with economic growth. To embark on a green growth path, it identifies the following important measures on climate change:
(i) Protecting growth from climate change-induced disaster through the integration of risk reduction and management within the planning process;
(ii) Provision of financial and other resources for disaster management efforts;(iii) Climate proofing economic growth from the impacts of climate change;(iv) Promotion of green growth through investment in low carbon technologies supported
by necessary funding.
After the release of the NCCP, the government prepared and released other important documents such as the Framework for Implementation of Climate Change Policy (2013) and Work Program on Climate Change Adaptation and Mitigation in Pakistan. The onus of achieving climate change objectives has been placed on the relevant ministries, agencies, and provinces, who are required to prepare their own detailed action plans to achieve their specific targets and goals.
The Work Program on Climate Change Adaptation and Mitigation in Pakistan identified some important short-term objectives, to steer cumulative actions toward achieving climate resilience at the national and subnational levels.15 These include:
(i) Development of the National Appropriate Mitigation Actions (NAMA) framework;(ii) Preparation of the second national communication to the United Nations Framework
Convention on Climate Change (UNFCCC); and(iii) Development of a national adaptation plan (NAP).
To meet these objectives and targets, the document laid out a “climate readiness scheme” that would primarily assist the government in carrying out 10 priority actions at the national level. These actions are illustrated in Figure 1.
13 NCCP, section on Poverty: policy measure number “e.”14 Government of Pakistan, Planning Commission. 2011. Framework for Economic Growth, Pakistan. Islamabad.15 Government of Pakistan, Ministry of Climate Change. 2014. Work Program for Climate Change Adaptation and Mitigation
in Pakistan: Priority Actions. Islamabad.

5Introduction
Pakistan submitted its initial national communication on climate change to the UNFCCC in November 2003. The Ministry of Climate Change is receiving support from the United Nations Environment Programme (UNEP) and the United Nations Development Programme (UNDP) Islamabad for the preparation of Pakistan’s second national communication to the UNFCCC, which is expected in 2017.
On mitigation, pursuant to the Bali Action Plan agreement at the Conference of Parties (COP) 14 in Bali, Indonesia in 2007, Pakistan is employing nationally appropriate mitigation actions (NAMAs) to guide their emissions below “business as usual” by 2020. The Ministry of Climate Change, in coordination with other sector ministries already prepared and submitted eight NAMA to the UNFCCC NAMA registry.16 These mitigation actions address renewable energy from solar, wind, biomass, and municipal waste; energy efficiency; waste management; and carbon capture. The ninth NAMA on solid waste management is ready for registration with UNFCCC, and the Ministry of Climate Change is currently working on two additional NAMA plans. One of these addresses renewable energy solutions for the industrial sector of Sialkot City, Pakistan with the
16 List of NAMAs Pakistan submitted to the UNFCCC NAMA registry. http://www4.unfccc.int/sites/nama/SitePages/SearchResults.aspx?k=pakistan&cs=This%20Site&u=http%3A%2F%2Fwww4.unfccc.int%2Fsites%2Fnama
Figure 1: Work Program for Climate Compatible Development in Pakistan
Mitigation
Common Elements
Identify research needs and strengthenresearch capacity
Renewable energyresource study
Prioritization of NAMA
Design of specificNAMA proposals
Demonstration project — mitigation
Low-carbon scenarioassessment
GHG inventory andsectoral baselines
Design of specificREDD+ proposals
MRV system
NAMA Framework Second NationalCommunication
National AdaptationPlan
Communication and awareness raising
Technology road maps Consulative process with provinces
Diagnostic of climate change work
Demonstrationproject — adaptation
Vulnerabilityassessments
Build capacity in federal and provincialgovernments
Governance and institutional assessment
Mainstreaming strategy
Adaptation
Strengthenmeteorologicalsystems
Monitoring andevaluation system
GHG = greenhouse gas, MRV = monitoring, reporting, and verification, NAMA = national appropriate mitigation action, REDD = Reducing Emissions from Deforestation and Forest Degradation.Note: Priority actions in green.Source: Government of Pakistan, Ministry of Climate Change. 2014. Work Program for Climate Change Adaptation and Mitigation in Pakistan: Priority Actions. Islamabad.

6 Climate Change Profile of Pakistan
help of the Climate and Development Knowledge Network (CDKN); and the second one in the pipeline addresses solar water pumping for agriculture.17
Ahead of the 2015 Conference of the Parties in Paris (COP21), Pakistan submitted to the UNFCCCC its intended nationally determined contribution (INDC) to global mitigation efforts, which was subsequently updated in November 2016. The INDCs outline the post-2020 climate actions countries intend to take under the global climate agreement, known as the Paris Agreement, which sets out a global action plan to limit global temperature increase to 1.5°C-2°C. The Paris Agreement was adopted at COP21 in Paris, France in December 2015, and entered into force in 4 November 2016, 30 days after the date on which at least 55 parties to the UNFCCC, accounting in total for at least an estimated 55% of the total global GHG emissions, have deposited their instruments of ratification, acceptance, approval, or accession. Pakistan ratified the Paris Agreement on 11 November 2016.
Based on its INDC, Pakistan intends to reduce up to 20% of its 2030 projected GHG emissions, estimated at 1,603 million tons of carbon dioxide equivalent (MtCO2e), subject to availability of international grants to meet the equivalent total abatement costs amounting to about $40 billion (at current prices).18 A number of mitigation and adaptation measures and actions are already being undertaken with domestic resources, which will be intensified with availability of international climate finance, technology development and transfer, and capacity building.
On adaptation, the government is in the process of developing a National Adaptation Plan (NAP) to guide the implementing agencies toward a more coordinated approach in mainstreaming climate change efforts into policies, strategies, and programs. Along with the NAP, sector and subnational adaptation plans will be prepared to enable prioritization of adaptation needs and allocation of financial resources at subnational government level. Based on Pakistan’s INDC, the country’s adaptation needs range from $7 billion to $14 billion per year.
In 2014, at the request of the Ministry of Climate Change, UNDP undertook Pakistan’s Climate Public Expenditure and Institutional Review (CPEIR) Study Phase I, which was completed in May 2015. Both entities also agreed to build on the finding and recommendations of CPEIR, particularly regarding assistance to the Ministry of Finance for integrating climate change finance into national planning and budgeting system through an appropriately designed climate-coding system. In the second phase, UNDP plans to extend the CPEIR study to the remaining provinces of Balochistan, Punjab, and Sindh, which were not covered in Phase I.
On 30 June 2015, the government initiated a project, “Carbon Neutral Pakistan,” with technical assistance from the People’s Republic of China to set up a local carbon market to cut GHG emissions and attract foreign investments. The total estimated cost of the project is $3.85 million which is reflected in the 2016 public sector development program (PSDP). This project will help industrial and other sectors to sell and buy carbon credits locally, and make internal adjustment of carbon emissions and credits. The carbon markets are also expected to initiate a competition for greener technology in the country.
17 Climate Development Knowledge Network (CDKN). http://cdkn.org/project/renewable-energy-solutions-punjabs-industrial-sector-evaluating-nama-approach-sialkot-city/
18 Pakistan Intended Nationally Determined Contribution. http://www4.unfccc.int/Submissions/INDC/Published%20Documents/Pakistan/1/Pak-INDC.pdf

7Introduction
C. About This ReportAddressing Pakistan’s sustainable development challenges in the face of its vulnerabilities to climate change requires an understanding of the current and future climate risks and its potential consequences faced at the individual, community, and sector levels. This report aims to provide an overview of climate change science, institutions, interventions, and finance in Pakistan to support this understanding, for the benefit of government and civil society stakeholders, donors, and other parties. The report intends to (i) provide a knowledge base of climate changes and impacts in Pakistan, (ii) support the identification of climate change risks and adaptation options, and (iii) promote the consideration of new climate technologies.
This report continues as follows:
• Chapter 2: Overview of country-level GHG emissions, historical climate changes, and future projections of climatic trends based on global GHG emissions scenarios and downscaled climate models, and identification of sector impacts including subnational disaggregation focused on agriculture, livestock and forestry, water, energy, transport and other urban infrastructure services, coastal areas, and health sectors.
• Chapter 3: Overview of institutional arrangements for climate change at the federal and provincial levels with a discussion of relevant government agencies.
• Chapter 4: Overview of key domestic and international funding mechanisms.• Chapter 5: Overview of Pakistan’s climate change adaptation experiences, sector-
specific risks and adaptation technologies in sectors such as agriculture, water, energy, and urban infrastructure. Research gaps are also discussed briefly.
• Chapter 6: Climate change risk screening of selected ADB projects in Pakistan by sector and region.


9
Climate Change Trends and Impacts
This chapter examines the past and current climatic trends and future projections for Pakistan and reviews its impacts on different sectors such as agriculture, energy, water, transport and other urban infrastructure services, coastal areas, and health.
A. Greenhouse Gas Emission Profile of PakistanAccording to the Intergovernmental Panel on Climate Change (IPCC) Fifth Assessment Report (AR5), global greenhouse gas (GHG) emissions have accelerated to an unprecedented level despite global efforts to cut down emissions. Climate model projections indicate that during the 21st century the global surface temperature is likely to rise 0.3°C to 1.7°C (0.5°F to 3.1°F) for their lowest emissions scenario using stringent mitigation, and 2.6°C to 4.8°C (4.7°F to 8.6°F) for business as usual carbon intense emissions. Hence, the report warns that the present global agreement of limiting the increase in global mean temperature to 2°C above pre-industrial levels requires lowering the global emissions by 40% to 70% compared with 2010 by mid-century, and to near zero by the end of this century.
According to the national GHG inventory of Pakistan for the year 2011–2012, its total GHG emissions was at 369 million tons of carbon dioxide equivalent (MtCO2e) with 45.9% share of energy, 44.8% share of agriculture and livestock sector, 3.9% share of industrial processes, and 2.6% share of land use change for forestry sectors (Figure 2). The energy and agriculture-livestock sectors alone account for 90.7% of the total emissions pool and have thus far remained the biggest emitters of GHGs since 1994. Pakistan has prepared four GHG emission inventories to date. ADB prepared the first one for the years 1989–1990, the Global Environment Facility (GEF) supported the second inventory (fiscal year 1993–1994), the Pakistan Atomic Energy Commission on the request of the Task Force on Climate Change of the Planning Commission of Pakistan prepared the third one for 2007–2008, and the Global Change Impact Studies Centre (GCISC) prepared the inventory for 2011–2012.19
19 K. A. Mir and M. Ijaz. 2015. Greenhouse Gas Emissions Inventory of Pakistan for the Year 2011–2012. GCISC-PR-19. Islamabad: Global Change Impact Studies Centre (GCISC).

10 Climate Change Profile of Pakistan
Figure 2: Sector Share Comparison of Greenhouse Gas Inventories for Pakistan, 2008 and 2012
LUCF 2.9% Waste 1.8%
Energy 50.7%
IndustrialProcesses
5.8%
Agriculture38.8%
Total Emissions:309.4 mt CO2 equivalent
Sectoral Shares for 2008 GHG Inventory
Total Emissions:369.0 mt CO2 equivalent
LUCF 2.6% Waste 2.8%
Energy 45.9%
IndustrialProcesses
3.9%
Agriculture44.8%
Sectoral Shares for 2012 GHG Inventory
CO2 = carbon dioxide, GHG = greenhouse gas, LUCF = land use change for forestry, mt = metric ton.Source: K. A. Mir and M. Ijaz. 2015. Greenhouse Gas Emission Inventory of Pakistan for the Year 2011–2012. Islamabad: Global Change Impact Studies Centre (GCISC).
Pakistan ranks relatively low among countries on a per capita GHG emissions basis, due to its relatively low level of development and high population (Box 1).20
According to a preliminary projection, the GHG emissions levels for Pakistan are expected to increase many times in the coming decades. This is based on the assumption that the GHG emissions intensity for the above-indicated five main sectors will remain essentially the same
20 The Global Economy. 2015. Country Ranking using Data on Carbon Dioxide Emissions. http://www.theglobaleconomy.com/rankings/Carbon_dioxide_emissions/ (accessed on 25 May 2015).

11Climate Change Trends and Impacts
as during 1994–2008. Thus, the projected total GHG emissions of Pakistan—in line with the government’s economic growth strategy—will be more than double by 2020 (compared to the emissions in 2008), and increase by around 14 times by 2050 (Table 1).
Table 1: Projected Greenhouse Gas Emissions by Sector in 2020 and 2050 Under Business as Usual Scenarios
(in MtCO2e)
Sector 1994 2008 2012 2020 2050Energy 86 157 169 358 2,685Agriculture 72 120 165 245 1,395Industrial processes 13 18 14 26 67Land use change and forestry 7 9 10 14 38Wastes 4 6 10 7 15Total national emissions 182 309 369 650 4,200
GHG = greenhouse gas, MtCO2e = million ton of carbon dioxide equivalent.Source: Government of Pakistan, Ministry of Planning, Development and Reforms. 2010. Task Force Final Report on Climate Change. Islamabad; K. A. Mir and M. Ijaz. 2015. Greenhouse Gas Emission Inventory of Pakistan for the Year 2011–2012. Islamabad: Global Change Impact Studies Centre (GCISC).
B. Climate Change Trends in Pakistan
1. Observed Past Climate Trends
a. Past Changes in the Temperature over Pakistan
A significant warming trend of about 0.57°C in the annual mean temperature was observed in the past century from 1901 to 2000 in Pakistan. This increase is less than the mean annual temperature increase of 0.75°C in the past century in the South Asia region.21 A more accelerated trend of warming, with the rise of 0.47°C, was observed from 1961 to 2007 in the country. The warmest year recorded until 2007 was 2004, and the highest increase is observed during winter when the temperature ranges from 0.52°C to 1.12°C (Figure 3). This is in agreement with the pronounced rate of warming observed over the South Asia region in the decade 1998–2007,
21 M. Ahmed and S. Suphachalasai. 2014. Assessing the Cost of Climate Change and Adaptation in South Asia. Manila: ADB.
Box 1: Pakistan’s Global Greenhouse Gas Emissions Ranking
Total GHG per capita emissions = 135th
Total GHG emissions = 31st
GHG = greenhouse gas.Source: The Global Economy. 2015. Country Ranking using Data on Carbon Dioxide Emissions. http://www.theglobaleconomy.com/rankings/Carbon_dioxide_emissions/ (accessed on 25 May 2015).

12 Climate Change Profile of Pakistan
which was attributed to increase in winter temperature and post-monsoon changes (footnote 21). On a regional basis, the highest increase in winter temperature was observed for Balochistan province, while the northwestern parts of the country showed negative temperature trends in the summer. The annual temperatures in Pakistan increased by 0.87°C (maximum) and 0.48°C (minimum) from 1960 to 2007.22
Based on the Pakistan Meteorological Department (PMD) station data from 1951 to 2000, a rising tendency in the annual mean surface temperature was observed throughout the country.23 In the hyper arid plains, arid coastal areas, and mountain regions of Pakistan, an increase of 0.6°C–1.0°C in the mean temperature was observed, whereas an increase of 0.5%–0.7% in solar radiation was noted over the southern half of the country. In central Pakistan, the cloud cover decreased by 3%–5% with a consequent increase of 0.9°C in temperature. The northern parts of the country outside the monsoon region suffered from expanding aridity during the study period.
22 Q. Z. Chaudhry et al. 2009. Climate Change Indicators of Pakistan. Technical Report. No. 22. Islamabad: Pakistan Meteorological Department.
23 B. F. Anjum et al. 2005. Climate Change Perspective in Pakistan. Pakistan Journal of Meteorology. 2(2). pp. 11–21.
Figure 3: Region-Wide Increase in Winter (Blue), Summer (Red), and Annual (Yellow) Mean Temperatures from 1960 to 2007
Punjab1.2
0.90.6
–0.9–1.2
–0.6
0.30.0
–0.3
0.97
0.220.54
Winter Summer Annual
Chan
ge in
Mea
nTe
mpe
ratu
re (º
C)
Sind1.2
0.90.6
–0.9–1.2
–0.6
0.30.0
–0.3
0.91
0.02
0.44
Winter Summer Annual
Chan
ge in
Mea
nTe
mpe
ratu
re (º
C)
KPK1.2
0.90.6
–0.9–1.2
–0.6
0.30.0
–0.3
0.52
–0.26
0.12
Winter Summer Annual
Chan
ge in
Mea
nTe
mpe
ratu
re (º
C)
Balochistan1.2
0.90.6
–0.9–1.2
–0.6
0.30.0
–0.3
1.120.69
1.15
Winter Summer Annual
Chan
ge in
Mea
nTe
mpe
ratu
re (º
C)
KPK = Khyber Pakhtunkhwa.Source: Q. Z. Chaudhry et al. 2009. Climate Change Indicators of Pakistan. Technical Report. No. 22. Islamabad: Pakistan Meteorological Department.

13Climate Change Trends and Impacts
Box 2: Key Findings of Past Observed Trends of Climate Change Indicators and Future Projections for Pakistan
1. During the last century, Pakistan’s average annual temperature increased by 0.57°C compared to 0.75°C for South Asia, and average annual precipitation increased by 25%. The warming is mainly due to increase in winter temperature.
2. Heat wave days per year increased by 31 days in the period 1980 to 2007. Cold waves decreased in northeastern and southern parts, and increased in western and northwestern parts of the country.
3. Observed sea level rise along the Karachi coast was 1.1 millimeters per year in the past century.4. During 1960–2007, the following changes were noted:
• An increase of 0.6°C to 1.0°C in the mean temperature over the hyper arid plains, arid coastal areas, and mountains regions of Pakistan;
• A decrease of 10%–15% in winter and summer rainfall in the arid plains and coastal areas;• A rise of 18%–32% in the summer rainfall over the core monsoon region of Pakistan;• A decrease of 5% in relative humidity over Balochistan province; • An increase of 0.5%-0.7% in solar radiation over the southern half of the country;• A decrease of 3%–5% cloud cover over central parts of Pakistan, and a consequent increase of
0.9°C in temperature;• The northern parts of the country outside monsoon region have suffered from expanding
aridity;• A decrease of 17% to 64% in rainfall observed during the seven strong El Niño events in the last
100 years;• The minimum temperature in summer over central parts of Pakistan has shown a pronounced
warming trend while in the extreme north and south have shown a slight cooling trend in some climatic zones; and
• The coastal belt in general and the Indus delta in particular have not shown any significant warming or cooling trends.
Future Projections
• Pakistan’s projected temperature increase is expected to be higher than the global average.• Projected temperature increase in northern parts is expected to be higher than the southern
parts of the country.• The frequency of hot days and hot nights is expected to increase significantly. • Pakistan’s rainfall projections do not indicate any systematic changing trends.• Major crop yields such as of wheat and rice are expected to decrease significantly.• Water availability per capita is projected to decrease to an alarming level. • An increasing trend in the rainfall over the Upper Indus Basin and decreasing trend in the Lower
Indus Basin.
Source: Footnote 21, 22, 27, 28, 29; M. M. Rabbani et al. 2008, and M. M. Iqbal et al. 2009.

14 Climate Change Profile of Pakistan
The continuous and longtime span data of various meteorological parameters of 56 selected PMD meteorological stations showed the behavior of summer and winter maximum and minimum temperatures during the last decade.24 A time series of area-weighted mean annual temperatures of Pakistan for the years 1961 to 2013, after applying uniform weighing factor, based on regional surface feature characteristics for all the climatic zones of Pakistan, is shown in Figure 4.
It is observed in this study that the warming trend during winter is greater than in summer. This shows that winter is shorter at both ends, hence, summer is now longer. A larger increase in nighttime temperatures than daytime temperatures is noticeable, indicating their adverse impacts on animal and agricultural productivity caused by heat stress, increased water requirements, and higher rates of respiration. In the last decade, a mixed trend in maximum temperatures has been observed during summer. However, the minimum temperature in summer in central parts of Pakistan shows a pronounced warming trend, while in the extreme north and south, a slight cooling trend in some climatic zones is shown. On the other hand, the coastal belt in general, and the Indus Delta in particular have not shown significant warming or cooling trends.
Regional Changes in the Past Mean Temperature in PakistanThe annual and seasonal trends in the mean annual temperature in various climatic zones of the country are listed in Table 2. It is noted that (i) the mean annual temperature has been increasing in most parts of Pakistan, and only the Submountain and Western Highlands and Lower Indus Plains show a decreasing trend; (ii) all the zones show a rising trend for the pre-monsoon summer
24 G. Rasul et al. 2012a. Vulnerability of the Indus Delta to Climate Change in Pakistan. Pakistan Journal of Meteorology. 18 (16). Islamabad. http://www.pmd.gov.pk/rnd/rnd_files/vol8_Issue16/8_Vulnerability%20of%20the%20Indus%20Delta%20to%20Climate%20Change%20in%20Pakistan.pdf
Figure 4: Time Series of Area-Weighted Mean Daily Temperatures Averaged over Each Year from 1960 to 2013
Annual Area-Weighted Mean Temperature (°C) 19.5
y = 0.010x + 17.5519
18.5
18
17.5
17
1960 1961
1962
1963
1964
1965
1966
1967
1968
1969
1970
1971
1972
1973
1974
1975
1976
1977
1978
1979
1980 1981
1982
1983
1984
1985
1986
1987
1988
1989
1990 1991
1992
1993
1994
1995
1996
1997
1998
1999
2000
2001
2002
2003
2004
2005
2006
2007
2008
2009
2010
2011
2012
2013
Notes: red line = area-weighted mean temperature of Pakistan, black line = linear trend (rate of change = 0.01°C), Total Change = 0.54°C). Source: Modified from G. Rasul et al. 2012b. Climate Change in Pakistan Focused on Sindh Province. Technical Report. No. 25. Islamabad: Pakistan Meteorological Department.

15Climate Change Trends and Impacts
months (April–May); (iii) all the zones, except Zone V (Balochistan Plateau, which is an arid and hyper arid region), show a decreasing trend for the monsoon period; (iv) the Greater Himalayan region shows an increasing trend throughout from December to May; and (v) the Balochistan Plateau (Zone V) is getting warmer in all the seasons.25
Table 2: Mean Temperatures Trends in Pakistan, 1951–2000 (in °C/year)
Climatic Regions
Mean Temperature Trends (°C/year)
Annual Jun–Sep Dec–Mar Apr–May Oct–Nov
I (a): Greater Himalayas 0.04 -0.80 0.32 1.09 -0.06
I (b): Submountain -0.19 -0.57 0.00 0.13 0.12
II: Western Highlands -0.72 -1.48 -0.65 0.17 -0.47
III: Central and Southern Punjab 0.11 -0.25 0.03 0.83 0.31
IV: Lower Indus Plains -0.08 -0.55 -0.07 0.35 0.15
V (a) Balochistan Plateau (East) 0.11 0.46 0.63 0.79 0.50
V (b): Balochistan Plateau (West) 1.17 1.3 0.43 2.17 1.80
VI: Coastal areas 0.00 -0.18 0.05 0.03 0.30
Source: Global Change Impact Studies Centre. 2005. Final Technical Report for APN CAPaBLE Project. Islamabad. http://www.gcisc.org.pk/2005-CRP01-CMY-Khan_CAPaBLE_FinalReport.pdf
b. Past Changes in the Mean Precipitation Over Pakistan
During 1951–2000, a decrease of 10%–15% in winter and summer rainfall in arid plains and coastal areas was observed while a rise of 18%–32% in the summer rainfall was observed in the core monsoon region of Pakistan. A decrease of 5% in relative humidity was observed in Balochistan province. Similarly, a decrease of 17%–64% in rainfall was observed during the seven strong El Niño events in the last 100 years. Depressions, storms, and cyclones forming in the Bay of Bengal and Arabian Sea increased in frequency during the last decade of the 20th century, and has been affecting Pakistan as well as other countries in the region (footnote 23).
For a long-term precipitation time series, 18 stations with available data from 1901 to 2007, and five stations with available data from 1914 to 2007 were used. A 10-year moving average showed that rainfall gradually decreased from 600 millimeter (mm) to 400 mm a year from early 1900s to 1940. After 1940, an increase of 133 mm was observed. Annual precipitation increased by 61 mm in Pakistan from 1901 to 2007. Monsoon rains increased by 22.6 mm, and winter precipitation increased by 20.8 mm (Figure 5).
25 Global Change Impact Studies Centre. 2005. Final Technical Report for APN CAPaBLE Project. Islamabad. http://www.gcisc.org.pk/2005-CRP01-CMY-Khan_CAPaBLE_FinalReport.pdf

16 Climate Change Profile of Pakistan
Figure 5: Time Series Annual Average Precipitation, 1901–2007 (in millimeters [mm])
700.0600.0500.0400.0300.0200.0100.0
0.0
Total Change = 61 mm
All Pakistan Rainfall Annual 1901-1954 1955-200710 per. Mov. Avg. (All Pakistan Rainfall Annual)
1901-1954 = -156 mm1955-2007 = 35 mm
1901
1906 19
11
1916
1921
1926
1931
1936
1941
1946
1951
1956
1961
1966
1971
1976
1981
1986
1991
1996
2001
2006
Pakistan’s Average Annual Rainfall
Source: Q. Z. Chaudhry et al. 2009. Climate Change Indicators of Pakistan. Technical Report. No. 22. Islamabad: Pakistan Meteorological Department.
Regional Changes in the Past Mean Precipitation over PakistanTable 3 shows that (i) the mean annual precipitation has generally been increasing except in coastal areas, (ii) the monsoon precipitation also shows the same trend, (iii) the winter rains show a mixed pattern with a decreasing trend in the Western Highlands and a part of Balochistan Province (Sulaiman and Kirthar Ranges), and (iv) the Greater Himalayas show a trend of increasing precipitation during the monsoon period (June–September) and of slightly decreasing precipitation in the winter months (December–March).
Table 3: Percentage of Precipitation Changes on Yearly Basis in Pakistan, 1951–2000
Climatic Regions
Mean Annual Precipitation Changes (%)
AnnualJun-Sep
MonsoonDec-Mar
WinterI (a): Greater Himalayas 0.49 1.73 -0.04I (b): Submountain 0.3 0.38 0.53
II: Western Highlands -0.02 0.22 0.00
III: Central and Southern Punjab 0.63 0.57 0.99
IV: Lower Indus Plains 0.22 0.45 -0.27
V (a): Balochistan Plateau (East) 1.19 1.16 1.14
V (b): Balochistan Plateau (West) 0.1 -0.2 -0.4VI: Coastal areas -0.82 -1.34 0.00
Source: Global Change Impact Studies Centre. 2005. Final Technical Report for APN CAPaBLE Project. Islamabad. http://www.gcisc.org.pk/2005-CRP01-CMY-Khan_CAPaBLE_FinalReport.pdf

17Climate Change Trends and Impacts
c. Past Changes in the Climate Extremes of Pakistan
A significant increase in the number of heat wave days per year with a rate of 11 days per decade was observed over the period 1980–2007 for Pakistan.26 A positive linear trend is noted in the frequency of heat waves at 5, 7, and 10 consecutive days for moderate heat waves (≥40°C) in the Sindh Province of Pakistan. The trends for 5, 7, and 10 consecutive days rose very sharply, indicating the increased frequency of heat waves in Sindh from 1961–2011. The study for Sindh shows a sharp increase in the intense heat waves events, calculated for temperatures ≥45°C for 5, 7, and 10 consecutive days. During the period 1961–1990s, the heat wave events were less frequent. However, from 1990 to 2011, an increase in frequency of these events is noticed. It is expected that with high temperatures in the long run, heat waves will become more frequent and intense all over the world, including Pakistan.27
A rise of 30–60 days in cold wave is observed in the northwestern parts of the country, and the number of cold wave days in Punjab and the southern areas of Sindh province decreased. However, no significant trend is observed in the average number of cold wave days across the country. No significant trends are noted in the frequency of consecutive wet and dry days (footnote 27).
d. Sea Level Rise
Sea level rise for Pakistan is estimated at 1.1 mm per year (mm/year) from 1856–2000 along the Karachi coast (Figure 6). According to the IPCC AR5 Working Group I report, global mean sea level rose 0.19 meter (m) over the period 1901–2010. The rate of change was markedly higher during the later period: the mean rate of the global average sea level rise was 1.7 mm/year between 1901 and 2010, and 3.2 mm/year between 1993 and 2010. The change in sea level was due to two major processes of thermal expansion of ocean from global warming and glacier mass loss.
2. Projections of Future Climate Trends in Pakistan
a. Future Trends of Temperature and Precipitation
Using the General Circulation Model for future climate change projection, the Global Change Impact Study Centre (2007) modeled annual temperature and precipitation change for future years 2020, 2050, and 2080 under two emissions scenarios of A2 and A1B. According to the model, by 2080, the temperature increase in Pakistan will be as high as 4.38°C. Regarding regional change in annual temperature, the study further noted that (i) the temperature increase in both summer and winter are higher in northern than southern Pakistan, and (ii) the temperature increases in both regions are higher in winter than summer. For the percentage of precipitation change, no significant change is observed. However, there is some precipitation increase in summer, and decrease in winter in southern Pakistan.28
26 The number of days are counted as heat wave days when for at least 6 successive days, the maximum temperature (TMAX) >90th percentile of the temperature records per year using the warm spell duration index (WSDI)”—one of the extreme indexes defined by the Expert Team on Climate Change Detection and Indices (ETCCDI, http://cccma.seos.uvic.ca/ETCCDI/list_27_indices. html).
27 M. Zahid and G. Rasul. 2012. Changing Trends of Thermal Extremes in Pakistan. Climatic Change. 113 (3). pp. 883-896. https://www.researchgate.net/publication/254451065_Changing_trends_of_thermal_extremes_in_Pakistan
28 W. Iqbal and M. Zahid. 2014. Historical and Future Trends of Summer Mean Air Temperature over South Asia. Pakistan Journal of Meteorology. 10 (20). Islamabad.

18 Climate Change Profile of Pakistan
Figure 6: Mean Sea Level Rise Recorded along Karachi Coast, Pakistan, 1850–2000
MEA
N S
EA L
EVEL
(mm
)
YEARS
1,800
1,750
1,700
1,650
1,600
1,550
1,500
1860
1870
1880
1890
1900 1910
1920
1930
1940
1950
1960
1970
1980
1990
2000
mm = millimeter.Source: M. M. Rabbani et al. 2008. The Impact of Sea Level Rise on Pakistan’s Coastal Zones - In a Climate Change Scenario. 2nd International Maritime Conference at Bahria University, Karachi.
The PMD conducted another significant study that computed temperature and precipitation change for different regions of Pakistan from 2011 to 2050. The climate models show a maximum rise in the northern areas of Pakistan, central and south Punjab, and lower parts of Khyber Pakhtunkhwa Province. However, mixed trends are projected for precipitation over different regions of Pakistan. Table 4 shows the regionwide changes in temperature and precipitation over Pakistan.
Table 4: Regionwide Climate Projections for Pakistan for Alternative Scenarios, 2011–2050
Region
Precipitation(mm/decade)
Temperature(°C/decade)
A2 A1B B1 A2 A1B B1Pakistan +1.73 +1.26 -0.89 +0.51 +0.41 +0.24Northern areas +4.6 +2.9 -1.3 0.76 0.63 0.39Potohar and upper NWFP +6.1 +3.8 -0.5 0.01 -0.34 -0.01Central/southern Punjab and lower NWFP -2.98 -1.78 -3.5 +0.63 +0.71 +0.05High Balochistan +1.48 +0.92 -0.57 +0.15 +0.26 +0.03Southeastern Sindh +5.1 +3.0 -0.1 0.00 -0.1 +0.01Sindh and lower Balochistan -1.8 -0.98 -0.05 +0.5 +0.27 +0.01
mm = millimeter, NWFP = Northwest Frontier Province and current Khyber Pakhtunkhwa. Notes: A2 shows business as usual, A1B shows balanced scenarios, and B1 shows Ideal World (SRES Report IPCC 2001) based on greenhouse gas emissions likely in the 21st century.Source: Q. Z. Chaudhry et al. 2009. Climate Change Indicators of Pakistan. Technical Report. No. 22. Islamabad: Pakistan Meteorological Department.

19Climate Change Trends and Impacts
In the Indus Basin area, one important study projects an almost uniform variation in the rainfall distribution over the entire basin region.29 At subregion levels of the Upper Indus Basin (UIB) and Lower Indus Basin (LIB), the models show an increasing trend in the rainfall over the UIB, decreasing in the LIB with a small change in the border zone between the two basin subregions. Winter precipitation is projected to decrease, particularly in the southern part of the basin with greater warming in the winter than in other seasons of the year. Similarly, UIB will become warmer than LIB. The model simulations also suggest a rise in the total number of rainy days over the basin, but a decrease in the number of rainy days, and an increase in rainfall intensity is projected in the border zone between the upper and lower basins, where the volume of rainfall is highest.
The PMD in May 2015 released a daily gridded downscaled precipitation and temperature time series from 2010 to 2099 climate change scenarios at 10 km resolution for the four different General Circulation Models using the World Climate Research Program-Coupled Model Inter-Comparison Project Phase-5 (CMIP5). The results are high resolution gridded projections of temperature and precipitation for the whole Indus River Basin. The downscaled results show a 3°C–5°C temperature rise in mean temperature under the Representative Concentration Pathways (RCP) 4.5 emission scenario.30 The mean trend of temperature under RCP8.5 indicates a 4°C–6°C rise by the end of the century with a sharp increase after 2050. The rainfall is highly variable in both spatial and temporal domains. Area average rainfall over Pakistan shows a large inter-annual variability. Sharp rising peaks give some indication of extreme precipitation events while negative peaks indicate droughts. CMIP5 multimodel mean projections of annual average temperature and precipitation changes for 2046–2065 and 2081–2100 under RCP4.5 and 8.5 relative to 1986–2005 are in Figure 7.
According to the model, spatial patterns of temperature and precipitation have similar behavior. Snow-covered areas of Pakistan in the north show a larger increase in mean temperature compared to central and southern regions under both RCP scenarios. However, RCP8.5 shows a more abrupt increase in temperature in the region after 2060 and up to 10°C–12°C, especially in northern Pakistan, whereas RCP4.5 shows a similar increasing trend but with less intensity, i.e., 5°C–6°C (Figures 8 and 9).
29 R. Rajbhandari et al. 2014. Projected Changes in Climate over the Indus River Basin Using a High Resolution Regional Climate Model (PRECIS). Climate Dynamics. 44 (1–2). pp. 339–357.
30 The IPCC Fifth Assessment Report defined a set of four new scenarios, denoted RCPs, RCP2.6, RCP4.5, and RCP6; and RCP8.5 where the numbers (2 to 8.5) denote approximate total radiative forcing in year 2100 relative to 1750, ranging from 2.6 watts per square meter (W/m2) to 8.5 W/m2. RCP4.5 is a stabilization scenario where GHG emissions stabilize by 2100. RCP8.5 is another scenario with very high GHG emissions where radiative forcing does not peak by 2100. Each RCP provides spatially resolved data sets of land use change and sector-based emissions of air pollutants, and specify annual GHG concentrations and anthropogenic emissions up to 2100.

20 Climate Change Profile of Pakistan
Figure 7: Pakistan’s Mean Annual Temperature and Precipitation Deviation Projections During 21st Century Using Two Different Emission Scenarios
21st Century Annual Temperature Deviation (oC) for Pakistan
21st Century Annual Rainfall Deviation (mm) for Pakistan
Tem
pera
ture
(o C)
mm
mm
Tem
pera
ture
(o C)12
700600500400300200100
0-100-200-300
2011 2021 2031 2041
RCP4.5 RCP8.5
2051 2061 2071 2081 2091 2100
2011 2021 2031 2041 2051 2061 2071 2081 2091 2100
1086420
-2
RCP4.5 RCP8.5
mm = millimeter, RCP4.5 and RCP8.5= Representative Concentration Pathways (RCPs) are emission IPCC AR5 scenarios. RCP4.5 is a stabilization scenario where greenhouse gas emissions stabilize by 2100. In RCP8.5 radiative forcing does not peak by year 2100.Source: Pakistan Meteorological Department. 2015. High Resolution Climate Scenarios. http://www.pmd.gov.pk/rnd/rndweb/rnd_new/climchange_ar5.php
Figure 8: Coupled Model Intercomparison Project Phase-5 Projections of Annual Average Temperature Changes (°C) for 2011–2100 under Representative Concentration Pathways 4.5, Relative to 1975–2005
APHRODITE Baseline
CMIP5 = Coupled Model Intercomparison Project Phase-5, RCP = Representative Concentration Pathways.Notes: RCP4.5 is an emission IPCC AR5 scenario. RCP4.5 is a stabilization scenario where greenhouse gas emissions stabilize by 2100. Source: Pakistan Meteorological Department . 2015. High Resolution Climate Scenarios. http://www.pmd.gov.pk/rnd/rndweb/rnd_new/climchange_ar5.php

21Climate Change Trends and Impacts
Figure 9: Coupled Model Intercomparison Project Phase-5 Mean Projections of Annual Average Temperature Changes (°C) for 2011–2100 under Representative Concentration Pathways 8.5, Relative to 1975–2005
APHRODITE Baseline
CMIP5 = Coupled Model Intercomparison Project Phase-5, RCP = Representative Concentration Pathways.Notes: RCP8.5 - RCPs is an emission IPCC AR5 scenario. In RCP 8.5, radiative forcing does not peak by year 2100. APHRODITE = a climate model.Source: Pakistan Meteorological Department. 2015. High Resolution Climate Scenarios. http://www.pmd.gov.pk/rnd/rndweb/rnd_new/climchange_ar5.php
A similar model shows that midcentury summer rainfall peaks will shift toward August while those of winter will shift toward March. The shifts in the rainfall peaks continue even up to the end of the century. RCP4.5 shows an increase of 4 mm/day in annual mean precipitation with a shift in maxima toward the northeastern part of the country until 2050. After 2050, the precipitation pattern shifts toward northwest until the end of the 21st century with the same magnitude and wet situation in the southern region. A similar pattern is seen in the RCP8.5 scenario but with less magnitude of up to 2–3 mm/day and more spatial spread (Figures 10 and 11).
b. Projected Sea Level Rise
In the past century, the average mean sea level rose to 1.1 mm/year for Pakistan. It is difficult to project sea level rise (SLR) by the end of 2100 for Pakistan, since data is limited at the country level. However, the sea level rise projections at the global and regional levels can be helpful in capturing the extent of the risk Pakistan will be exposed to in the future. IPCC AR5 notes a global mean SLR of 0.2–0.6 m by the end of this century, whereas for South Asia, of which Pakistan’s coast is a part of due to the shared Arabian Sea border, 0.7 m (with range between 0.42 and 1.12 m and a 90% level of confidence, footnote 21) SLR is projected by 2100 on average, relative to the pre-industrial level (Figure 12). Future sea level rise will most likely affect the low-lying coastal areas south of Karachi toward Keti Bander and Indus River delta.

22 Climate Change Profile of Pakistan
Figure 10: CMIP5 Projections of Changes in Annual Mean Precipitation (mm/day) for 2011–2100 Under RCP4.5, Relative to 1975–2005
APHRODITE Baseline
CMIP5 = Coupled Model Intercomparison Project Phase-5, mm = millimeter, RCP = Representative Concentration Pathways.Notes: RCP4.5 = Stabilization pathway where radiative forcing stabilized by the year 2100. APHRODITE = a climate model.Source: Pakistan Meteorological Department. 2015. High Resolution Climate Scenarios. http://www.pmd.gov.pk/rnd/rndweb/rnd_new/climchange_ar5.php
Figure 11: CMIP5 Projections of Changes in Annual Mean Precipitation (mm/day) for 2011-2100 Under RCP8.5, Relative to 1975–2005 APHRODITE Baseline
CMIP5 = Coupled Model Intercomparison Project Phase-5, mm = millimeter, RCP = Representative Concentration Pathways.Notes: RCP8.5 = High greenhouse gas emission pathway scenario where radiative forcing does not peak by year 2100. APHRODITE = climate model.Source: PMD 2015. High Resolution Climate Scenarios. http://www.pmd.gov.pk/rnd/rndweb/rnd_new/climchange_ar5.php

23Climate Change Trends and Impacts
C. Sector Climate Change Impacts1. Climate Change Impacts on Agriculture, Livestock, and Forestry
Agriculture Sector
Agriculture is a key economic sector that contributes 21% to the gross domectic product (GDP), employs 45% of the total workforce and contributes about 60% to exports.31 The total cropped area is 23.4 million hectares (Mha), representing 29% of the total reported area32 of which irrigated areas make up 18.63 Mha (24% of the total irrigated area) with the percentage by province of 77% in Punjab, 14% in Sindh, 5% in Khyber Pakhtunkhwa, and 4% in Balochistan.33 Currently, 3.8 Mha are under Sailaba/Rod-Kohi, riverine, and Barani farming systems commonly called the spate irrigation farming system.34 The potential area under spate irrigation is estimated to be around 6.935 Mha, divided as follows: 4.68 Mha in Balochistan, 0.862 Mha in Khyber Pakhtunkhwa, 0.571 Mha in Punjab, and 0.551 Mha in Sindh.35
31 Government of Pakistan, Ministry of Planning, Development, and Reforms. 2015. Annual Plan 2014–2015. Islamabad.32 Excluding northern areas, the country’s total geographical area is 79.61 Mha, of which only 72% is reported for land use
and 28% is not surveyed yet for land use classification. 33 Government of Pakistan, Bureau of Statistics. 2011. Agricultural Statistics of Pakistan. 2010–2011. Islamabad.34 The spate irrigation farming system refers to a type of water management unique to semiarid environments. Flood water
from mountain catchments is diverted from river beds and spread over large areas.35 S. Ahmad and F. V. Steenberger. 2007. The Potential for the Development of Spate Irrigation System in Pakistan. Practical
Notes 1. Spate Irrigation Network.
Figure 12: Projected Mean Sea Level Rise to 2100 in South Asia RegionSe
a le
vel r
ise (i
n m
eter
s)
abov
e pr
e-in
dust
rial le
vels
1.2
1
.8
.6
.4
.2
02010 2020 2030
95th/5th percentiles mean±sdmean
2040 2050 2060 2070 2080 2090 2100
Year
sd = standard deviation.Source: A. Ahmed and S. Suphachalasai. 2014. Assessing the Costs of Climate Change and Adaptation in South Asia. Manila: Asian Development Bank.
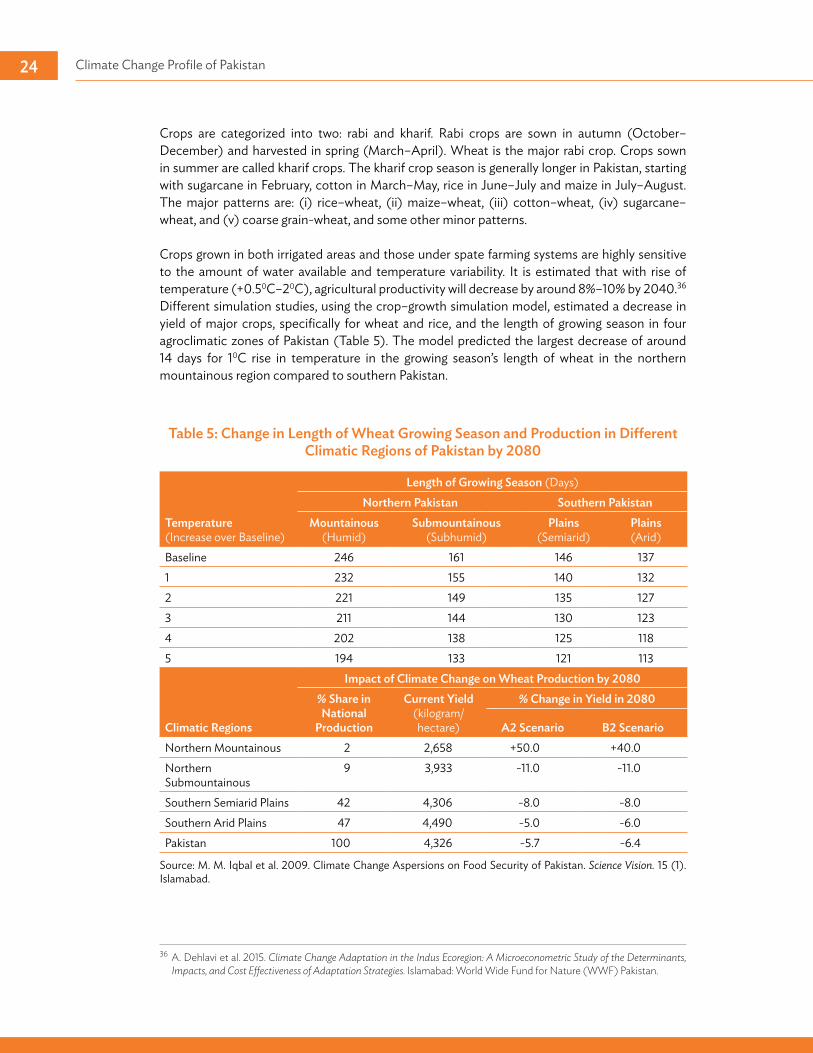
24 Climate Change Profile of Pakistan
Crops are categorized into two: rabi and kharif. Rabi crops are sown in autumn (October–December) and harvested in spring (March–April). Wheat is the major rabi crop. Crops sown in summer are called kharif crops. The kharif crop season is generally longer in Pakistan, starting with sugarcane in February, cotton in March–May, rice in June–July and maize in July–August. The major patterns are: (i) rice–wheat, (ii) maize–wheat, (iii) cotton–wheat, (iv) sugarcane–wheat, and (v) coarse grain-wheat, and some other minor patterns.
Crops grown in both irrigated areas and those under spate farming systems are highly sensitive to the amount of water available and temperature variability. It is estimated that with rise of temperature (+0.50C–20C), agricultural productivity will decrease by around 8%–10% by 2040.36 Different simulation studies, using the crop–growth simulation model, estimated a decrease in yield of major crops, specifically for wheat and rice, and the length of growing season in four agroclimatic zones of Pakistan (Table 5). The model predicted the largest decrease of around 14 days for 10C rise in temperature in the growing season’s length of wheat in the northern mountainous region compared to southern Pakistan.
Table 5: Change in Length of Wheat Growing Season and Production in Different Climatic Regions of Pakistan by 2080
Temperature (Increase over Baseline)
Length of Growing Season (Days)Northern Pakistan Southern Pakistan
Mountainous (Humid)
Submountainous (Subhumid)
Plains (Semiarid)
Plains (Arid)
Baseline 246 161 146 1371 232 155 140 1322 221 149 135 1273 211 144 130 1234 202 138 125 1185 194 133 121 113
Climatic Regions
Impact of Climate Change on Wheat Production by 2080% Share in National
Production
Current Yield (kilogram/ hectare)
% Change in Yield in 2080
A2 Scenario B2 ScenarioNorthern Mountainous 2 2,658 +50.0 +40.0Northern Submountainous
9 3,933 -11.0 -11.0
Southern Semiarid Plains 42 4,306 -8.0 -8.0Southern Arid Plains 47 4,490 -5.0 -6.0Pakistan 100 4,326 -5.7 -6.4
Source: M. M. Iqbal et al. 2009. Climate Change Aspersions on Food Security of Pakistan. Science Vision. 15 (1). Islamabad.
36 A. Dehlavi et al. 2015. Climate Change Adaptation in the Indus Ecoregion: A Microeconometric Study of the Determinants, Impacts, and Cost Effectiveness of Adaptation Strategies. Islamabad: World Wide Fund for Nature (WWF) Pakistan.

25Climate Change Trends and Impacts
The same study found a 6% reduction in wheat yield, and 15%–18% decrease for fine-grain aromatic basmati rice yield in all agroclimatic zones except northern areas where around 50% increase in wheat yield is noted by 2080 (Figures 13 and 14). For the wheat crop, it is seen that yield is significantly affected by various agronomic and socioeconomic factors, such as water availability, pesticides, labor supply, household characteristics including number of women and past experiences, and exposure to extreme events and seasonal weather. High summer (kharif) rainfall is particularly important to the winter (rabi) crop productivity and yield.
Figure 13: Wheat Yield in Different Agroclimatic Zones of Pakistan, by 2080 under Intergovernmental Panel on Climate Change A2 Scenario
5,000
4,500
4,000
3,500
3,000
2,500
Northern Mountainous RegionSouthern Semi-arid Plains
Northern SubmountainousSouthern Arid Plains
Base 2020 2050 2080
Whe
at Y
ield
(kg/
ha)
ha = hectare, IPCC = Intergovernmental Panel on Climate Change, kg = kilogram.Source: M. M. Iqbal et al. 2009. Climate Change Aspersions on Food Security of Pakistan. Science Vision. 15 (1). Islamabad.
Figure 14: Basmati Rice Production in Central Punjab in Semiarid Plains, by 2085, under IPCC A2 and B2 Scenarios
A2 Scenarios B2 Scenario
Rice
yiel
d (k
g/ha
)
1990 2025 2055 2085Year
4,4004,200
4,000
3,800
3,600
3,400
3,200
3,000
ha = hectare, IPCC = Intergovernmental Panel on Climate Change, kg = kilogram.Source: M. M. Iqbal et al. 2009. Climate Change Aspersions on Food Security of Pakistan. Science Vision. 15 (1). Islamabad.

26 Climate Change Profile of Pakistan
Other studies conducted to determine yield change in crops show similar results. According to findings of the International Institute for Applied Systems Analysis (IIASA) Austria, by 2080, yield will decrease for all the major crops and cereals where wheat would have the highest reduction in its yield. The results are available on the World Bank Knowledge Portal and are in Table 6. The yield changes, particularly in wheat production, are alarming for Pakistan, and likely require significant adaptation interventions.
Table 6: Projected Percent Changes in Major Crops Yield (2020–2080) Compared to Baseline Yield (1961–1990) under A2 Scenario
Crops% Change
2020 2050 2080Wheat –3.2% –11.0% –27.0%Rice 0% –0.8% –1.9.0%Maize –2.4% –3.3% –4.3.0%
Source: World Bank Climate Change Knowledge Portal: Agriculture Model by IIASA. http://sdwebx.worldbank.org/climateportal/index.cfm?page=country_impacts_agriculture&ThisRegion=Asia&ThisCcode=PAK
Livestock Sector
Pakistan, the livestock sector contributes 56.3% of agriculture sector output and 11.8% to the national GDP, and supports more than 8 million rural families involved directly in raising livestock.37 The emissions of this sector make up a large part of the total emissions of the agricultural sector of Pakistan. For example, only enteric fermentation and manure management make up approximately 90% of the GHG emissions of the agricultural sector, and thereby contribute approximately 40% of Pakistan’s total GHG emissions (footnote 19). Vast rangelands and pastures in the country support the livestock sector, and it is estimated that 60% of land is used as a rangeland in northern Pakistan, Balochistan, and arid and semiarid areas of Sindh and Punjab. These rangelands support around 93 million livestock, and in Balochistan alone, approximately 87% of the total population derive their livelihood from livestock.38
While sufficient evidence is available on how climate change is impacting crops in the agriculture sector, very little evidence is available in the literature on how climate change affects the world’s dairy and livestock system.39 Even the IPCC’s AR5 contains very limited information on the projected impacts of climate change on livestock and livestock systems, specifically in Asia. A general assumption is it will be through degradation of grazing systems such as pastures and grazing lands due to drought, floods, and a rise in temperature and, ultimately, loss of land productivity, decrease in fodder quality and quantity, and increase in disease epidemics (footnote 39).
Considering the size of the livestock sector and its importance in supporting rural livelihood, it is imperative to explore the impacts of climate change on this sector. However, the research studies performed on livestock management in the face of climate change in the sub-Sahara Africa region indicate there are limitations and high costs attached to the various adaptation options explored for the enhanced resilience of households and food security (footnote 39).
37 Government of Pakistan, Ministry of Finance. 2015. Economic Survey of Pakistan for 2014–15. Islamabad.38 S. Ahmad et al. 2012. Rangeland Degradation and Management Approaches in Balochistan, Pakistan. Pakistan Journal of
Botany. 44. pp. 127–136.39 P. K. Thornton et al. 2015. Climate Change Impacts on Livestock. CCAFS Working Paper no. 120. Copenhagen: CGIAR
Research Program on Climate Change, Agriculture and Food Security (CCAFS) CGIAR Research Program on Climate Change, Agriculture and Food Security (CCAFS). www.ccafs.cgiar.org

27Climate Change Trends and Impacts
Forestry Sector
Forests are an important natural resource specifically in the context of rural livelihood. It provides timber, fuelwood, food, habitat for wildlife, and various important ecosystem services, such as mitigating carbon dioxide, and controlling or reducing cyclones and storms in coastal areas. Forest area in Pakistan is 4.19 Mha, representing 5% of the total land area. Coastal mangrove forests extend over 132,000 ha, representing about 3% of the forest area of Pakistan. The Indus Delta alone supports 97% of the total mangrove forests and is home to over one million people, 135,000 of which depend on mangroves for their livelihood.40
It is predicted that most of the anticipated impacts of climate change, such as SLR, change in temperature and precipitation, and increasing frequency and intensity of extreme events, will affect the forest severely, threatening the biodiversity status, and soil quality.
Very limited research is available on the consequences of climate change on forests in Pakistan. However, a study on the impact of climate change on forest ecosystems of northern Pakistan showed a decrease in forest cover for some plant types and migration of some forest species to a new forest biome, and an increase in net primary productivity of all biomes by using the BIOME3 model. The study assessed nine dominant plant types or biomes for the climate change impact. Out of nine biomes selected, three biomes (alpine tundra, grassland or arid woodlands, and deserts) showed a reduction in their area, and five biomes (cold conifer or mixed woodland, cold conifer or mixed forests, temperate conifer or mixed forests, warm conifer or mixed forests, and steppe or arid shrub lands) showed an increase in their areas. Net primary productivity exhibited an increase in all biomes and scenarios (Table 7).41
40 WWF Pakistan. Lahore 2005 GIS/Remote Sensing Based Assessment of Mangroves Resources of Selected Project Sites of Indus Delta and Makran Coast. http://www.wwf.org.pk/pdf/tp_sp_ectp.pdf
41 K. M. Siddiqui et al. 1999. Forest Ecosystem Climate Change Impact Assessment and Adaptation Strategies for Pakistan. Climate Research. 12. pp. 195–203. http://www.int-res.com/articles/cr/12/c012p195.pdf
Table 7: Changes in Forest Areas of Different Types of Plants in Northern Pakistan Under Changed Climate vs. 1961–1990 average, in % Change
Biome Type2020 2050 2080
-P 0P +P -P 0P +P -P 0P +PAlpine tundra -16.7 -16.7 -16.7 -31.5 -31.5 -31.5 -38.9 -38.9 -38.9Cold conifer/Mixed woodland 22.2 22.2 11.1 5.6 44.4 22.2 44.4 33.3 11.1Cold conifer/Mixed forest 10.3 10.3 13.8 13.8 20.7 24.1 6.9 10.3 13.8Temperature conifer/Mixed forest 5.6 5.6 5.6 2.8 5.6 5.6 16.7 19.4 19.4Warm conifer/Mixed forest 22.0 22.0 34.1 43.9 56.1 63.4 51.2 68.3 85.4Xerophytic wood/Scrub 0.0 0.0 0.0 -1.8 -3.6 -1.8 0.0 0.0 0.0Grassland/Arid shrubland -42.9 -28.6 -28.6 -57.1 -57.1 -57.1 -57.1 -57.1 -28.6Steppe/Arid shrubland 5.2 8.1 10.7 9.1 13.0 17.6 10.1 16.9 20.5Desert -7.6 -7.6 -16.3 -12.9 -19.3 -26.1 -14.4 -25.4 -33.0
Note: The assumptions of the study are: Precipitation change (P) of 0, +3, and -3% with 0.90C increase in temperature, and carbon dioxide concentrations of 425 parts per million (ppm) in 2020; 0, +3, -3 P, 500 ppm of carbon dioxide, and 1.800C increase in temperature for 2050; and 0, +9,-9 for P, 575 ppm of carbon dioxide, 2.70C increase in temperature for 2080 with 1990 as the base year.
Source: K. M. Siddiqui et al. 1999. Forest Ecosystem Climate Change Impact Assessment and Adaptation Strategies for Pakistan. Climate Research. 12. pp. 195–203. http://www.int-res.com/articles/cr/12/c012p195.pdf

28 Climate Change Profile of Pakistan
2. Climate Change Impacts on Water Sector in Pakistan
The water sector is one of the most sensitive sectors to the impacts of climate change. Pakistan has the world’s largest contiguous Indus Basin Irrigation System that is largely dependent on precipitation, glaciers and snow melt, and ground water abstraction. The primary sources of water are rainfall during the monsoon season (50 million acre feet [MAF]), and river inflows (142 MAF) in the IRS. Ground water contributes around 48% of surface water available at the canal head of the irrigation system. Water is currently used in agriculture (92%), industries (3%), and domestic and infrastructure (5%). It is expected that in the future, sector water demand will increase due to socioeconomic development and the increase in population.
Box 3: Key Findings on the Water Challenges for Pakistan in a Changing Climate
1. Increased variability of river flows due to increase in the variability of monsoon and winter rains;
2. Uncertainty about future river flow and glaciers melting;
3. Increased demand of irrigation water because of higher evaporation rates at elevated temperatures in the wake of reducing per capita availability of water resources and increasing overall water demand;
4. Reduction in water storages capacities due to increased sediments (0.2 million acre foot/year);
5. Conventional irrigation system with high water losses and low crop water productivity (wheat at 24% and rice at 55% less than the world averages);
6. Influence of groundwater recharge due to high level of abstraction and changes in precipitation and evapotranspiration; and
7. Lack of transboundary river inflows and glaciers monitoring infrastructure.
Source: Footnote 43, 44, 45; and Hussain, I., R. Sakthivadivel, U. Amarasinghe, M. Mudasser and D. Molden. 2003. Land and water productivity of wheat in the western Indo-Gangetic plains of India and Pakistan: A comparative analysis. International Water Management Institute Research Report 65. Colombo, Sri Lanka: International Water Management Institute.
River flows have very high seasonal and annual variability, where the highest flows are almost double the lowest flows, and total flows during the kharif season is five times the rabi season flows (Table 8).
Analyses of river flows from 1947–2003 show a decreasing trend in annual flows (Figure 15). There was a particularly rapid decline during 1998–2003, attributed to the persistent drought from 1998–2004.42 The annual variability of river flows is more pronounced in downstream Kotri Barrage where in a normal year, the annual flow is reduced from 77.3 MAF to 39.2 MAF.
42 S. Ahmad. n.d. Water Resources of Pakistan and Strategy for Climate Change Adaptations. Islamabad: Pakistan Agricultural Research Council.

29Climate Change Trends and Impacts
In the post-Kotri/Mangla period, there is on average 33 days with zero flows in the rabi season43 This has serious implication for the Indus Delta regions such as Hyderabad, Thatta, and Badin, where seawater intrudes in the agricultural lands, and destroys both the agriculture system and groundwater drinking quality.
Table 8: Distribution of Water in Main Rivers of Pakistan
River
% of Indus River
Inflows
% SeasonalDistribution
Dominant Source in Summer
Dominant Source in Winter
Summer (April–
September)
Winter (October–
March)Indus 44 86 14 Snow or glacial melt +
monsoonWinter rainfall +
base flowChenab 19 83 17 Snow or glacial melt +
monsoonWinter rainfall +
base flowJhelum 16 78 22 Mainly snow melt +
monsoonWinter rainfall +
base flowKabul 16 82 18 Snow or glacial melt Winter rainfall +
base flowOthers 5 - - - -
Source: Government of Pakistan, Ministry of Water and Power Pakistan. 2008. Impact of Climate Change on Water Resources of Pakistan. Islamabad.
43 S. Ahmad. 2009. Water Resources and Management in Pakistan - Challenges and Future Vision. Paper Presented in the Course on Integrated Water Resources Management at the National University of Agricultural Sciences, National Agricultural Research Centre. Islamabad.
Figure 15: Annual River Flows of the Indus River System in Pakistan, 1947 to 2002
y = 6E-08x6 - 1E-05x5 + 0.0011x4 - 0.0316x3 + 0.2915x2 + 0.3369x + 136.01
R2 = 0.3036
Flow
(MA
F)
200.00180.00160.00140.00120.00100.00
80.0060.0040.0020.00
0.00
Period (years)
1947
-48
1950
-51
1953
-54
1956
-57
1959
-60
1962
-63
1965
-66
1968
-69
1971
-72
1974
-75
1977
-78
1980
-81
1983
-84
1986
-87
1989
-90
1992
-93
1995
-96
1998
-99
2001
-02
MAF = million acre foot.Source: S. Ahmad. n.d. Water Resources of Pakistan and Strategy for Climate Change Adaptations. Islamabad: Pakistan Agricultural Research Council.

30 Climate Change Profile of Pakistan
The “Task Force on Climate Change” in 2010 identified some climate change-related threats to water security, as follows:44
(i) Increased variability of river flows due to an increase in the variability of monsoon and winter rains, and loss of natural reservoirs in the form of glaciers;
(ii) Increased demand of irrigation water because of higher evaporation rates at elevated temperatures in the wake of reducing per capita availability of water resources and increasing overall water demand;
(iii) Increase in sediment flow due to increased incidences of high intensity rains, resulting in more rapid loss of reservoir capacity;
(iv) Increased incidences of high altitude snow avalanches and glacial lake outburst floods (GLOFs) generated by surging tributary glaciers blocking main unglaciated valleys;
(v) Increased degradation of surface water quality due to increase in extreme climate events such as floods and droughts; and
(vi) Lack of current knowledge and monitoring effort on climate change impacts in the HKH region, and lack of understanding and modeling capability about the patterns of glacier melt and rainfall feeding the IRS and their corresponding impact on IRS flows.
44 Government of Pakistan, Ministry of Planning, Development, and Reforms. 2010. Task Force on Climate Change. Final Report. Islamabad.
Figure 16: Hydrological Model Snowmelt Runoff Model Simulated Mean Upstream Discharge for the Present (2000 to 2007) and Future Climate
for the A1B Special Report Emission Scenario (A1B [2046 to 2065]) for Indus Basin
16,000
12,000
8,000
4,000
00 5 9 13 17 21 25 29 33 37 41 45 49 53
2000-2007
Week
Indus
A1B (2046-2065)
Q (m
3 s-1)
m3/s1 = cubic meter per second.Source: K. Hewitt. 2005. The Karakoram Anomaly? Glacier Expansion and the ‘Elevation Effect’, Karakoram Himalaya. Inner Asia. Mountain Research and Development: Special Issue - Climate Change in Mountains. 25 (4).

31Climate Change Trends and Impacts
Box 4: Key Findings on Projected Climate Change Implications for Energy Sector in Pakistan
1. Reduction in water availability for hydropower generation. The most likely impact of global warming is the recession of Himalayan glaciers that is the largest source of fresh water supply in the country, and this would very likely affect the country’s power generation systems.
2. Extreme climate events damaging oil, gas, and power infrastructure. The other major likely impact on the energy sector is damage to oil and gas infrastructure due to heavy precipitation leading to flooding.
3. Hotter temperatures increase energy demand. Due to increase in airconditioning requirements particularly in summer, energy demand is expected to increase. Further, climate change induces higher temperatures, and evaporation will increase electricity needs for pumping water for agriculture irrigation.
4. Warmer air and water temperatures may affect efficiency of nuclear and thermal power plants. Increase in water temperatures used for cooling of nuclear and thermal power plants will affect the power plants’ efficiency.
Source: Footnote 48 and 49.
Impacts of declining glacier mass on river discharge as a result of climate change will be more substantial in the Indus basin because of the high proportion of discharges from melted water. This may cause substantial variations in future water supply in the IRS. Western Himalayan glaciers are projected to retreat during the next 50 years initially causing increase of Indus River flows. Then, the glacier reservoirs will be empty, resulting in the decrease of flows by as much as 30% to 40% over the next 50 years. Based on surveys between 1997 and 2002, it is reported that some of the large Karakoram glaciers—40–70 km in length—exhibit 5–15 m of thickening over substantial ablation zone areas.45 These conflicting findings make the impact of climate change on Karakoram glaciers and Indus River flows uncertain (Figure 16).
3. Climate Change Impacts on Energy Sector
The energy sector is the major contributor to climate change through its high GHG emissions and is also sensitive to its impacts. It is predicted that rising population, economic growth, and changing patterns of consumption including rising demand for air conditioning in the summer months will likely increase energy demand and consequently increase GHG emissions from the energy sector in Pakistan.
In Pakistan, the energy sector is the largest contributor of GHG emissions. In 2012, energy sector emissions accounted for 46% of the total national GHG emissions inventory (footnote 38). The major likely impact of climate change on the energy sector is predicted to be changes in precipitation patterns, temperatures rising, and extreme weather events. The country’s current energy needs are heavily dependent on oil and gas while the demand far exceeds supply, consequently translating into a severe energy crisis that has crippled the country since 2006.
45 K. Hewitt. 2005. The Karakoram Anomaly? Glacier Expansion and the ‘Elevation Effect’, Karakoram Himalaya, Inner Asia. Mountain Research and Development: Special Issue - Climate Change in Mountains. 25 (4).
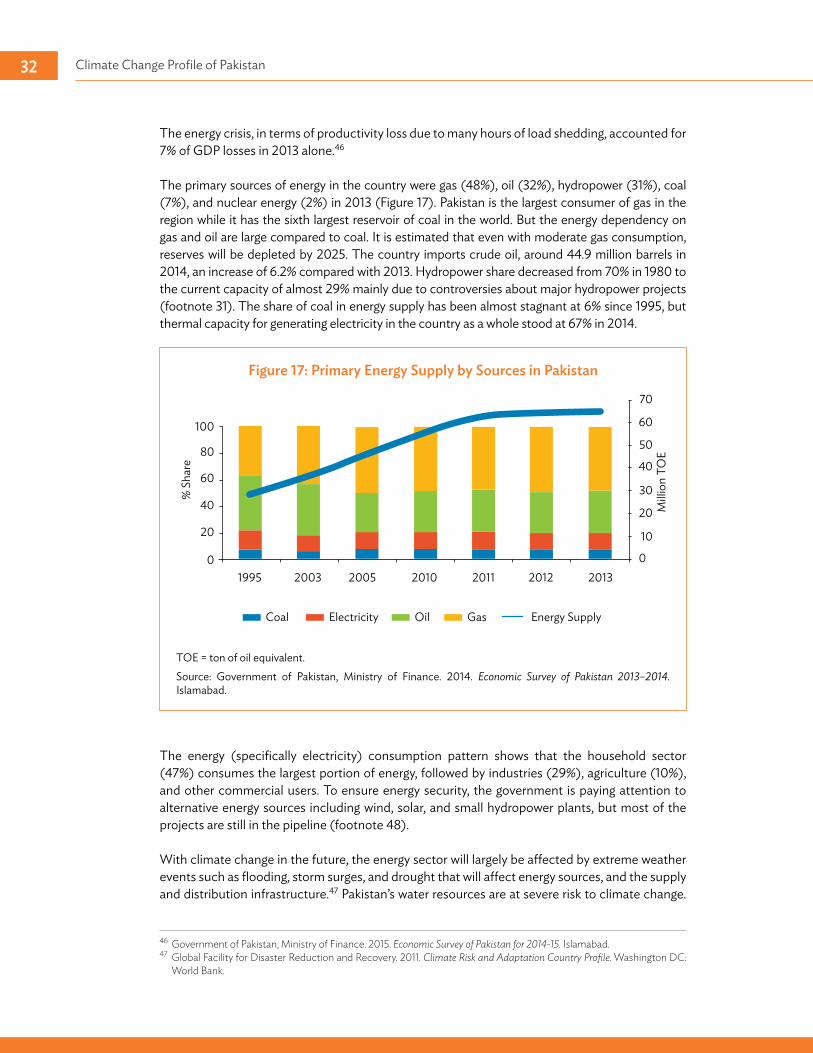
32 Climate Change Profile of Pakistan
The energy crisis, in terms of productivity loss due to many hours of load shedding, accounted for 7% of GDP losses in 2013 alone.46
The primary sources of energy in the country were gas (48%), oil (32%), hydropower (31%), coal (7%), and nuclear energy (2%) in 2013 (Figure 17). Pakistan is the largest consumer of gas in the region while it has the sixth largest reservoir of coal in the world. But the energy dependency on gas and oil are large compared to coal. It is estimated that even with moderate gas consumption, reserves will be depleted by 2025. The country imports crude oil, around 44.9 million barrels in 2014, an increase of 6.2% compared with 2013. Hydropower share decreased from 70% in 1980 to the current capacity of almost 29% mainly due to controversies about major hydropower projects (footnote 31). The share of coal in energy supply has been almost stagnant at 6% since 1995, but thermal capacity for generating electricity in the country as a whole stood at 67% in 2014.
The energy (specifically electricity) consumption pattern shows that the household sector (47%) consumes the largest portion of energy, followed by industries (29%), agriculture (10%), and other commercial users. To ensure energy security, the government is paying attention to alternative energy sources including wind, solar, and small hydropower plants, but most of the projects are still in the pipeline (footnote 48).
With climate change in the future, the energy sector will largely be affected by extreme weather events such as flooding, storm surges, and drought that will affect energy sources, and the supply and distribution infrastructure.47 Pakistan’s water resources are at severe risk to climate change.
46 Government of Pakistan, Ministry of Finance. 2015. Economic Survey of Pakistan for 2014-15. Islamabad.47 Global Facility for Disaster Reduction and Recovery. 2011. Climate Risk and Adaptation Country Profile. Washington DC:
World Bank.
Figure 17: Primary Energy Supply by Sources in Pakistan
70
60
50
40
30
20
10
0
100
80
60
40
20
01995 2003 2005 2010 2011 2012 2013
Coal
Milli
on T
OE
% S
hare
Electricity Oil Gas Energy Supply
TOE = ton of oil equivalent.Source: Government of Pakistan, Ministry of Finance. 2014. Economic Survey of Pakistan 2013–2014. Islamabad.

33Climate Change Trends and Impacts
Presently, hydropower resources of Pakistan supply about 30% electricity and is projected to provide about 32.7 million kilowatts (kw) in 2030. The most likely impact of global warming is the recession of Himalayan glaciers that is the largest source of freshwater supply in the country. Uncertain water resources will reduce reliability of the hydro-electricity supply which is a key provider of the country’s power sector, leading to the reduced reliability of the whole electricity generation system. Variations in water supply will be further aggravated by increased sedimentation of major reservoirs.48
The climate change-induced natural hazards may damage oil and gas infrastructure due to heavy precipitation leading to flooding. Major gas fields are located in the vicinity of the Indus River. About one-third of the country’s primary commercial energy supply is met by imported oil, transported via sea. The infrastructure damage of these resources may stop supply for a long time and put a large burden on the national economy. One example is the flooding in August 2010 that disrupted the supply of natural gas and fuel oil due to severe damage to some major installations and the transportation network. This disruption resulted in a shortfall of more than 3,500 megawatts of electricity for several days.
Higher temperatures under climate change will increase evapotranspiration rates and increase electricity needs for pumping water for agriculture irrigation. Increased water temperatures used for cooling of nuclear and thermal power plants affects power plants’ efficiency. Supply gaps may arise between maximum demand and the installed capacity during peak hours during some months, as cooling requirements increase. The increase in share of space cooling will make the peak more pronounced and the reliability of Pakistan’s power system will further deteriorate. The operation and maintenance cost of the transmission and distribution system will also increase due to the higher rate of failures in extreme events.49
48 Government of Pakistan, Ministry of Climate Change. 2012. National Climate Change Policy. Islamabad.49 R. Tariq and G.R. Athar. Possible Impacts of Climate Change on Energy Sector of Pakistan. Pakistan Atomic Energy
Commission. http://nijesr.iefr.edu.pk/journalFolder/6/8e6bd.pdf
Box 5: Key Findings on Projected Impacts of Climate Change on Coastal Areas of Pakistan
1. Vulnerability of the Sindh coastal zone is considered higher than the Balochistan coastal areas because of Sindh’s tidal flat topography and higher population concentration;
2. Increased level of coastal erosion due to sea level rise; the current level is as high as 176 m per year in some places in the Indus creek system;
3. The delta is shrinking due to sediment loss, which is mainly due to extensive damming of the Indus River. The current rate of sediment aggradation of 1 millimeter per year (mm/year) no longer exceeds relative projected sea level rise and this sediment retention is considered as one of the primary causes of the effective sea level rise;
4. The delta is sinking due to subsidence. The subsidence rate for Indus is not established yet but the other deltas in Asia have the highest rate in the world at 2.1 mm/year subsidence;
5. By 2050, after sea water incursion into the delta, 0.79% of the Indus Delta population will be at risk while 2.73% of the delta area will potentially be lost.
Source: Footnote 51, 52, and 53.

34 Climate Change Profile of Pakistan
4. Climate Change Impacts on Coastal Areas
It is expected that sea level impacts on the coastal areas and its resources may be large as already evident in the inundation of low-lying areas, degradation of mangrove forests, declining drinking water quality, and decrease in fish and shrimp productivity.50 Pakistan has a 1,046 km-long coastline that stretches along the border of the Arabian Sea in the South of the country falling within the administrative boundaries of the provinces of Sindh and Balochistan. The Sindh coastal zone’s vulnerability is considered higher than that of the Balochistan coastal areas because of its tidal flat topography and higher population concentration with marked industrial activities along coastal areas, such as Karachi. A 2-m SLR is expected to submerge 7,500 km2 in the Indus Delta. The low-lying Balochistan coastal areas, such as Pasni, may also be impacted by SLR since the mean sea level in the coastal town of Pasni is about 1.4 m. However, the Balochistan coast is tectonically active and is uplifted at the rate of 1–2 mm/year due to subduction of the Indian Ocean plate.51
The rise in sea level is also expected to increase the rate of erosion along the coastal belt. The creeks in the delta regions such as Hajamaro, Ghoro, Kaanhir, and Kahhar are the active erosion hotspots with erosion rate ranging from 31 m/year to 176 m/year. The south side of the mouth of Ghoro Creek shows the highest erosion frequency of 176 m/year with a retreat rate of 425 m from 2006 to 2009.52 Furthermore, the delta region is both shrinking and sinking due to lack of sedimentation and subsidence. There is 80% reduction in the river sediment compared to the early 20th century due to extensive damming of the Indus River.53 The current rate of sediment aggradations of 1 mm/year no longer exceeds relative projected SLR and this sediment retention is considered as one of the primary causes of the effective SLR in nearly 70% of the world’s deltas, including the Indus Delta.54 Due to threats it faces, the Indus is ranked third among the global deltas in the greater risk scale (footnote 53).
The delta sinking or subsidence process is natural and generally ranges from less than 1 mm/year to more than 10 mm/year. This rate is exceeded due to groundwater and petroleum extraction due to humans’ activities. The subsidence rate for Indus Delta is not established yet, but deltas in Asia have the highest rate of 2.1 mm/year subsidence. A seminal study conducted by Ericson et al (2006) extrapolated the baseline effective sea level rise condition from 2000 to 2050 to estimate potential vulnerability to sea level incursion into deltas. It showed that 0.79% of the Indus Delta population is at risk with 2.73% of the delta area potentially lost by 2050.
50 Global Facility for Disaster Reduction and Recovery. 2011. Climate Risk and Adaptation Country Profile. Washington DC: World Bank.
51 T. M. A. Khan and M. M. Rabbani. Sea Level Monitoring and Study of Sea Level Variations Along Pakistan Coast: A Component of Integrated Coastal Zone Management. 2000. http://www.loiczsouthasia.org/pdfdocuments/ge9-meeting-report-pakistan.pdf
52 WWF Pakistan. 2012. Delta-Wide Hazard Mapping - A Case Study of Keti Bundar, Kharo Chann, and Jiwani. Karachi. http://www.wwfpak.org/ccap/pdf/Hazard_Mapping.pdf ( Accessed on June 5 2015).
53 J. P. M. Syvtiksi et al. 2009. Sinking Delta Due to Human Activities. Nature Geoscience. Macmillan Publishers. 2. pp. 681–686.
54 J. P. Ericson et al., 2006. Effective Sea Level Rise and Deltas: Causes of Change and Human Dimension Implication. Global and Planetary Change. 50 (1-2). pp. 63–82.

35Climate Change Trends and Impacts
5. Climate Change Impacts on Transport and Urban Sector
This section discusses the impacts of climate change on transportation and urban infrastructure services.
Transportation and Roads
A nation’s economy is highly dependent on the system of transportation, which relies on infrastructure and vehicles. Alongside other infrastructure, climate change also affects transport-related features of an area as these services are also located in the same geographical location. In urban areas with dense populations and high demands for travel, the conditions are stressful as compared to suburban rural areas in Pakistan. Due to old infrastructure of airports, ports, railway systems, and highways; along with overpopulation, and economic and environmental pressures, transportation systems are under significant stress in Pakistan. The heavy climatic events, which produce heavy flooding or snowfall, impose adverse effects on the transportation system.55 Similarly, in mountainous areas, landslides can disrupt transportation systems for extended periods. Sea level rise in addition to storm surge during extreme weather events can also increase the frequency and magnitude of floods in coastal areas. These events of flooding, saltwater intrusion, and corrosion due to storm surges and wave action can lead to serious damage to coastal transportation infrastructure. Higher average temperatures and extreme temperature events may also damage or weaken the structural integrity of transport networks, including bridges and road surfaces.
55 T. J. Wilbanks and S. Fernandez. 2014. Climate Change and Infrastructure, Urban Systems, and Vulnerabilities: Technical Report for the US Department of Energy in Support of the National Climate Assessment. Island Press.
Box 6: Key Findings on Projected Climate Change Implications on Urban Infrastructure and Transport in Pakistan
1. Increased stress on urban drainage systems due to high rainfall and flash floods;
2. Hydrological extreme impacts on urban potable water supply systems by inundating water supply systems and consequently worsening the quality of supplied water;
3. Heavy rainfall-induced landslides in mountainous urban centers;
4. Impacts on coastal towns through projected sea level rise and storm surges. The possible impacts on coastal towns, particularly in Karachi, are: damage to sensitive government installations, residential and commercial properties; livelihood losses to fishing communities; and damage to ecosystems and biodiversity; and
5. Increased rate of mortality due to extreme heat waves or the urban heat island effect.
Source: Footnote 55.

36 Climate Change Profile of Pakistan
In economic terms, there are two types of impacts of extreme weather events on the transportation system. The first is the damage inflicted upon infrastructure, such as flood damage to road, rail, and bridges. The second is the economic cost of interruptions in the operation of the transportation systems, which prevent employees from going to work; shoppers from getting to stores; and goods from being delivered to factories, warehouses, and stores.
Urban Infrastructure Services
The impact of climate change on urban infrastructure is considered to be due to changes in parameters related to weather or climate, either in magnitude or duration, as a result of climate change. These include changes in temperature (either maximum or minimum), precipitation causing heavy floods, frequency and intensity of storms, and sea level rise. In Pakistan, past experiences show infrastructure located in areas exposed to such events or near climate-sensitive features such as rivers, coastal areas, storm tracks, or arid areas are at risk from extreme weather events. Normally, the urban infrastructure services are interdependent and failure of services in one infrastructure in most of the cases results in disruptions to other connected urban services. Climate change may increase the frequency of such disruptions in the coming decades.
For example, on 23 July 2001, a cloudburst resulted in 620 mm of rainfall recorded in 12 hours in Islamabad. Heavy floods in Nullah Lai—a rain-fed natural stream flowing through the Rawalpindi City—and its tributaries inundated the nearby houses, bridges, and roads. This urban catastrophe resulted in losses to life and property, with a death toll of 61 people, destruction of 800 houses, and damage to 1,069 houses.
6. Climate Change Impacts on the Health Sector
Climate change has the potential to affect both environmental and social determinants of health—safe drinking water, clean air, sufficient food, and secure shelter. This may play out through extreme heat events, natural disasters, and variable rainfall patterns. Heat wave events are projected to increase both in frequency and duration. The heat wave of Karachi in June 2015 took more than 1,200 human lives in Karachi alone, and about 200 lives in other parts of the Sindh Province.56 In Karachi, a maximum temperature of 44.8°C was recorded which is the second highest temperature after 1979. In Pakistan, heat waves are common in the premonsoon months (May–June) in the plains of the country.
The variations in rainfall and temperature were correlated with the spread of different infectious diseases and food security.57 During the floods in 2010, in a preliminary study by UNDP, it was found that the proportion of population below the minimum level of dietary energy consumption increased by 3%, thereby adding an additional 5 million to the population of undernourished people.58 Similarly, extreme events were correlated with the mental health of the affected
56 Q. Z. Chaudhry et al. 2015. A Technical Report on Karachi Heatwave Event Prepared for the Ministry of Climate Change. Islamabad.
57 S. M. Malik et al. A Study of the Effects of Climate Change on Human Health in Pakistan: Evidence-Based Policy Advocacy. SightSavers. 2011. http://pk.sightsavers.org/in_depth/policy_and_research/15837_climatechange.pdf
58 United Nation Pakistan 2010. The Human Cost of Floods in Pakistan. Annual Report 2010. http://www.unicef.org/pakistan/UNICEF_Pakistan_2010_Annual_Report.pdf

37Climate Change Trends and Impacts
population, i.e., extreme events generally cause depression, distress, aggression, etc.59 With the rise of temperature, the risk of water-borne and vector-borne diseases also increases. Higher numbers of dengue and malaria cases are due to changes in temperature and heavy precipitation, possibly resulting in the increased number of breeding sites for mosquitoes.60
59 Save the Children. 2011. Psychological Assessment Report: Psychological Problems and Needs of Children in Flood Affected Areas in Pakistan. Pakistan. http://www.savethechildren.org.uk/sites/default/files/docs/Psychological_Assessment_Report_1.pdf
60 B. Khalid and A. Ghaffar. 2013. Dengue Transmission Based on Urban Environmental Gradients in Different Regions of Pakistan. International Journal of Biometeorology. 59 (3). http://www.researchgate.net/publication/262229060_Dengue_transmission_based_on_urban_environmental_gradi ents_in_different_cities_of_Pakistan


39
Institutional Arrangements for Climate Change
The role and importance of strong institutions to address climate change is highly acknowledged to mainstream the issue in development policies and programs. Strong institutions promote adapting to climate change and ultimately transform the system by building resilience. However, developing countries, including Pakistan, suffer from inefficient and weak institutional structures, ultimately yielding poor governance systems.
Institutionalization of climate change in Pakistan finds its roots in the early environmental efforts dating back as early as the mid-1970s. Pakistan signed and ratified 14 international environmental commitments between 1971–2001, including the United Nations Framework Convention for Climate Change and Kyoto Protocol, which acted as stimuli in initiating and guiding the policy processes and efforts on climate change in the country. Significant progress has been made to set up institutional structures for guiding the environmental initiatives in the country. After over 4 decades, however, these efforts still remain fragmented, with insufficient coordination, political support, and ownership.
After the 18th constitutional amendment was passed in 2010, the Ministry of Environment was devolved to the provinces and a new Ministry of Disaster Management was established in 2011. This was later renamed as the Ministry of Climate Change in 2012, which raised the issue of climate change to a cabinet level portfolio. In 2013, the Ministry of Climate Change was downgraded to a division of the Cabinet Secretariat and remained in this position until early 2015, when it was upgraded to the level of a ministry again. Table 9 outlines the institutionalization of environment and/or climate change in Pakistan.
Table 9: Brief History of Institutionalization of Climate Change in Pakistan
Year Accomplishment Purpose and/or Function1974 Environment and Urban Affairs Division
established at the Federal levelFollow up to Stockholm Declaration June 1972
1983 Pakistan Environment Protection Ordinance enacted
First comprehensive environment-specific legislation
1989 Environment and Urban Affairs Division upgraded to Federal Ministry of Environment, Forestry, and Wildlife
1991–1993 National Conservation Strategy prepared
National Environmental Quality Standards adopted in 1993
It provided the broad framework for addressing environmental challenges
continued on next page

40 Climate Change Profile of Pakistan
Year Accomplishment Purpose and/or Function1995 • Cabinet Committee on Climate Change
established• Acted as policy coordination forum for
climate change1997 • Pakistan Environmental Protection Act
enacted• First environmental act of the country
2002 • Global Centre for Impact Studies on Climate Change established
• This research center on climate change functioned for 10 years as a development project
2004–2005
• Prime Minister Committee on Climate Change convenes National Environment Policy
• Includes Prime Minister, Ministers of Water and Power, Food and Agriculture, Science and Technology, Environment, Planning Commission, Special Advisor to the Prime Minister
2006 • National Energy Conservation Policy• National Renewable Energy Policy• Clean Development Mechanism National
Operational Strategy2010 • 18th Amendment to the 1973
Constitution• Devolution of power to the provinces
2011 • Ministry of Environment ceases to exist• New Federal Ministry of Disaster
Management established
• Functions transferred to the Planning Commission
2012 • Ministry of Disaster Management renamed to the Ministry of Climate Change
• National Climate Change Policy approved by Federal Cabinet
• Punjab and Balochistan Environmental Protection Act prepared and enacted
• “Green Benches” established in all High Courts and Supreme Court of Pakistan by the Chief Justice of Pakistan
• National Disaster Management Plan approved
• National Sustainable Development Strategy
• Elevate climate change issue to a cabinet level portfolio
• A dedicated policy on climate change
• Deals with environmental cases; 2013 decision prioritizes environmental cases in the High Courts
2013 • Ministry of Climate Change downgraded to Division of Climate Change
• Global Climate Change Impact Studies granted autonomous status
• National Disaster Risk Reduction Policy approved
• Becomes part of Cabinet Secretariat
• Serves as the secretariat for the Prime Minister Committee through “GCISC Act 2013”
2014 • Framework for Implementation of Climate Change Policy adopted
2015 • Division of Climate Change upgraded to the Ministry of Climate Change
• Federal focal ministry on all climate change-related issues
Sources: Adapted from I. Ahsan and S.A. Khuwaja. 2013. Development of Environmental Laws and Jurisprudence in Pakistan. Manila: Asian Development Bank. http://www.adb.org/sites/default/files/publication/31140/environmental-law-jurisprudence-pakistan.pdf; I. Khan and S. Munawar. 2011. Institutional Arrangement for Climate Change in Pakistan. SDPI Report Series 19. Islamabad: Government of Pakistan, Ministry of Climate Change.
The frequent changes in status and policy focus of a single institution convey two messages. First, there is an evolving degree of understanding among key policy and decision makers about the interdependencies and linkages of environmental issues, initially with disaster management,
Table 9: continued

41Institutional Arrangements for Climate Change
and then with the broader theme of climate change. This argument is supported by the gradual increase in framing climate change in the key policy documents such as the Poverty Reduction Strategy Paper-II (2009), Framework for Economic Growth (2011), and Economic Survey of Pakistan (2012–2014). Second, it reflects a rather reactive and bifurcated approach toward managing issues of the environment and climate change, without a concrete course of action. This creates confusion among the key policy makers when it comes to linking and decoupling the two issues which can be traced, again, through the key policy document. For example, the Economic Survey of Pakistan (released by the Ministry of Finance) had been acknowledging Climate Change Policy since 2012, albeit under the environment section.
In the next subsections, we discuss various institutional arrangements at the federal and provincial levels that support climate change directly or indirectly. Further, we examine the challenges the climate change mainstreaming efforts encounter in the country in coordination, information gaps, and ownership.
A. Evolution of Climate Change Institutional Arrangements in Pakistan
Pakistan’s first comprehensive piece of legislation on the environment came out in 1983 as the Pakistan Environmental Protection Ordinance (PEPO). It established institutions, i.e., the Federal and Provincial Environmental Protection Agencies (EPAs), and the Pakistan Environmental Protection Council (PEPC). The Pakistan Environmental Protection Act (PEPA) later repealed PEPO in 1997. The PEPA provided the framework for the implementation of a national conservation strategy; establishment of Provincial Sustainable Development Funds; establishment of Environmental Tribunals, and appointment of Environmental Magistrates for these; and establishment of the Initial Environmental Examination, and the Environmental Impact Assessment (EIA).
EPAs and councils are currently established at both the federal and provincial levels. The Prime Minister chairs the PEPC, which comprises 35 members, including chief ministers of provinces. Historically, the PEPC has been relatively inactive it met only once in the first 10 years of its existence since 1984, and a more frequent meeting schedule is still not forthcoming.61 After the 18th constitutional amendment, various powers of the federal EPA were delegated to provincial governments. However, the rule-making power of the federal government under Section 31 and regulation-making power of the federal EPA under Section 33 were not delegated. Currently, both the EPA and the PEPC function as attached departments of the Ministry of Climate Change.
1. Disaster Risk Management Arrangements
At present, the institutional setup for disaster risk reduction in the country is a prime representative of the cross-sector mainstreaming of climate change in government. This is evident from its effective and prioritized mainstreaming through appropriate policy, legal and institutional arrangements, and implementing strategies and programs to minimize risks and vulnerabilities.62 Though the National Disaster Management Authority (NDMA) is a new institution, it gained
61 A. Kundi. 2011. Toothless Pakistan Environmental Protection Council. Pakistan Today. 6 March.62 Government of Pakistan, National Disaster Management Authority. 2011. Annual Report. Islamabad. http://www.ndma.
gov.pk/Documents/Annual%20Report/NDMA%20Annual%20Report%202011.pdf

42 Climate Change Profile of Pakistan
strong political support and ownership from the legislature and executive branches of the government.
The National Disaster Management Council, headed by the Prime Minister of Pakistan, is an apex national policy-making body for disaster management. Other members of the National Disaster Management Council include leaders of opposition parties in the parliament; chief ministers of all the provinces; governor of Khyber Pakhtunkhwa; chairperson, Joint Chiefs of Staff Committee; ministers for defense, health, foreign affairs, social welfare, special education, finance, communication, and interior; and representatives of civil society. The Disaster Management Authority (DMA) is present at the national (i.e., NDMA), provincial (i.e., Provincial Disaster Management Authority), and district levels (i.e., Distract Disaster Management Authority) to manage and coordinate disaster-related activities. The NDMA serves under the Ministry of Climate Change.
The NDMA suffers from a lack of a separate and dedicated budget line, hence, its response to risk mitigation is mainly reactive and on an ad hoc basis. Also, the institutional incapacity arises from the lack of access to researches on climate change impacts, and discrete adaptation and/or mitigation plans.
2. The Ministry of Climate Change
The Ministry of Climate Change is the focal institution for climate change in Pakistan. It evolved from the Ministry of Environment after the 18th constitutional amendment, in 2010, when the Ministry of Environment ceased to exist due to devolution of power to provincial governments. The environment is now under the jurisdiction of the provincial governments, but climate change remains federal, given the need for a national response and representation in international climate change negotiations.
Pakistan is highly vulnerable to climate change impacts. The future cost of climate impacts is estimated at $6 billion to $14 billion per year over the next 40 years.63 Yet, so far, the issue has
63 M.A.A. Khan et al. 2011. Pakistan National Economics and Environmental Development Study. https://unfccc.int/files/adaptation/application/pdf/pakistanneeds.pdf
Box 7: Structure of the Ministry of Climate Change
Attached Wings: The Ministry has five attached wings: Administrative, Development Environment and Climate Change, Forestry, and International Cooperation.
The Clean Development Mechanism (CDM) Secretariat and Global Change Impact Studies Centre (GCISC) act as the secretariat of the Prime Minister Committee on Climate Change that is also part of the Ministry.
Attached Departments: The five attached departments are: Natural Disaster Management Authority, Pakistan Environmental Protection Agency, Pakistan Environmental Planning and Architecture Consultants, Pakistan Environmental Protection Council, and Zoological Survey Department.
Source: Organogram of Ministry of Climate Change, Pakistan. www.mocc.gov.pk

43Institutional Arrangements for Climate Change
failed to capture the proper attention and be given the urgency needed to address its far-reaching consequences. In July 2013, when the Ministry of Climate Change was demoted to a Climate Change Division (CCD), its budget was slashed by more than 60% of its annual spending. The CCD regained ministry status as in January 2015, but was not given new projects and budget. After the 18th constitutional amendment, the main role of the ministry was limited to coordination and facilitation with the provinces and international forums.
The Ministry of Climate Change handles and supports both the Clean Development Mechanism (CDM) and Reducing Emissions from Deforestation and Forest Degradation (REDD+) initiatives in the country. Guided by the CDM Strategy (2006), the CDM cell inside the Ministry of Climate Change is the designated national authority (DNA) on CDM projects in the country. The strategy allows for unilateral, bilateral, and multilateral CDM projects, preferably in the areas of energy, including renewable energy, energy efficiency, energy conservation, and fossil-fueled cogeneration; land use, land use change, and forestry (e.g., biodiversity protection, soil conservation, watershed maintenance and sustainable forest and rangeland management); agricultural and livestock practices; waste management (e.g., landfills, solid waste management, recycling, animal and livestock wastes); transportation (e.g., alternative fuel vehicles, mass transit systems, cleaner engines, compressed natural gas); and industrial processes. Appendix 2 presents the list of CDM projects in the country.
Finally, there are ministries—of power, energy, food security, and research—with some responsibilities for climate change-related policies. The Ministry of Power is of particular interest as it is responsible for a key area of mitigation for power generation, and adaptation for water resources. The role overlaps with the Ministry of Climate Change’s role, but transfer and delegation of oversight remains difficult and contested, due in part to the relative newness of the climate change institution, which has less political ownership and required resources.
B. Climate Change Linkages to Key SectorsClimate change is a cross-sector issue and, thus, necessitates strong linkages with other key sectors of economy that are specifically sensitive and vulnerable to the impacts of climate change. The extent to which climate change is integrated in policy instruments across key sectors provides an indication of the extent of climate change mainstreaming. In this subsection, various key sector policies, specifically the National Climate Change Policy (NCCP), are examined.
1. National Climate Change Policy (2012)
The NCCP is the main document informing the policy framework for climate change in Pakistan. In early 2011, the Ministry of Environment, in collaboration with UNDP Islamabad, initiated the process to develop the country’s first climate change policy. It took about 1.5 years of extensive consultation to formulate the policy. It was approved by the Federal Cabinet in September 2012, and then launched by the newly-formed Ministry of Climate Change in February 2013.

44 Climate Change Profile of Pakistan
Policy Analysis
NCCP provides an overarching framework for addressing the challenges that Pakistan faces or will face in the future due to climate change. The policy outlines some major climate-induced threats before laying out the policy measures for different sectors. The document takes a sector approach and recognizes the importance of developing both adaptation and mitigation strategies to combat climate change threats.
NCCP is motivated by its supporting role in achieving economic growth. NCCP’s policy goal is “to pursue sustained economic growth by appropriately addressing the challenges of climate change.” This goal acknowledges that challenges and opportunities posed by climate change cannot be separated from the broader development goals of the country. However, thus far, the development policies put more emphasis on economic and human development than direct climate change issues. Short-term development goals, depicted in annual plans, focus on macroeconomic stability, and achieving high gross domestic product growth rate, while medium-term development goals in the Poverty Reduction Strategy Paper II and the Medium-Term Development Framework focus on increasing human development through reducing poverty. Under Pillar IV of the Poverty Reduction Strategy Paper II, the Integrated Energy Development Program acknowledges the nexus of poverty reduction and environmental sustainability. The subject of climate change only arises under the section on National Environmental Policy and is limited to “its potential to reverse progress in Millennium Development Goal achievements.” Similarly, the Vision 2030 document briefly mentions climate change under “challenges - mitigating climate change” without providing any clear direction on what the vision is or where it is supposed to take the country, with respect to addressing how climate change may affect the gains of other socioeconomic policies, such as macroeconomic and social stability, poverty reduction, human development, and improved governance.64
NCCP recognizes and prioritizes adaptation measures over mitigation. It gives a set of policy measures for adaptation in the following sectors: water resources, agriculture and livestock, human health, forestry, and biodiversity and other vulnerable ecosystems; and for mitigation in the following sectors: energy, energy efficiency and conservation, transport, industries, agriculture and livestock, carbon sequestration, and forestry.65
NCCP acknowledges better socioeconomic gains through tackling climate induced-poverty, mainstreaming gender, and improving town planning. Furthermore, appropriate measures relating to disaster preparedness, capacity building, and institutional strengthening; technology transfer and international cooperation for raising Pakistan’s stance regarding climate change at various international forums have also been incorporated as important components of the policy.
NCCP also has an implementation plan for the policy which emphasizes devising “climate change action plans” by all relevant ministries, departments, and agencies at the federal, provincial, and local government levels. Furthermore, “implementation committees” at national and provincial levels reporting to the “Prime Minister Committee on Climate Change” is considered an important institutional structure to move forward with climate change implementation and mainstreaming.
64 Government of Pakistan, Planning Commission. 2007. Pakistan in the 21st Century, Vision 2030. Islamabad. http://www.pc.gov.pk/vision2030/Pak21stcentury/vision%202030-Full.pdf
65 For detailed policy measures, please refer to the National Climate Change Policy 2012 document.

45Institutional Arrangements for Climate Change
a. Strengths of the National Climate Change PolicyThe strengths of this NCCP document are:
a. The extensive consultation process with all the sector federal ministries, provincial governments, and all relevant stakeholders including federal and provincial line departments, academia, nongovernment organizations, and civil society organizations who were involved in the formulation and development of the first NCCP. All the provinces were fully involved in its developmental phase. It was precisely the time when, under the 18th constitutional amendment, devolution was taking shape and all the stakeholders were clear that the ultimate responsibility of its implementation would be through the respective provinces. The federal government is required to provide the national and international coordination and facilitator role, including the support needed to access international climate financing.
b. The policy is comprehensive and inclusive. While on one hand it has adequately covered adaptation and mitigation challenges in different development sectors of the economy, on the other hand, it has not ignored the gender aspects of climate change and the impact of climate change on the poor and marginalized groups of the society.
c. The policy was developed on the basis of insights gained from the IPCC 4th Assessment Report, but it is also in line with the findings and scenarios of the IPCC AR5.
d. Indirectly, the policy is informed and supported by a range of regulatory and policy documents such as the National Disaster Risk Reduction Policy (2013), Renewable Energy Policy (2011), draft National Sustainable Development Strategy (2012), and the regulations establishing the DNA for the CDM.
b. Challenges of the National Climate Change Policy
Institutional overlap and uncertainty post-18th Constitutional Amendment. Under the 1973 Constitution of Pakistan, the subject of “environmental pollution and ecology” was part of the “Concurrent Legislative List,” which meant both Parliament and Provincial Assemblies had the power to make laws on this subject (Table 10). After the 18th constitutional amendment, the subject of “environmental pollution and ecology” along with 46 other subjects including health, education, food, agriculture, irrigation and population, livestock, forestry, biodiversity and conservation, and socioeconomic and welfare responsibilities were devolved to the provinces. However, the federal power and authority remained, ensured through Clause 6 of Article 270 AA (Declaration and Continuance of Laws, etc.). This means the federal government can still continue its role and responsibility in the handling of environment and climate change. Federal and provincial bodies have not challenged nor clarified this situation.
Inherent institutional challenges. The effectiveness of the NCCP is generally hampered by many inherent challenges climate change poses to the society. The time frame for consequences of climate change impacts extends by decades and even centuries. The current planning structure of government hinders its ability to deal with such long-term issues. These challenges include:

46 Climate Change Profile of Pakistan
Table 10: Summary of Changes in Responsibilities Between the Federal and Provincial Levels of Government Before and After the Devolution of the 18th
Constitutional Amendment in 2010
Responsibilities
Legislative Responsibilities: Changes Due to the 18th Constitutional Amendment of 2010
Before AfterFederal responsibility Federal Legislative List Revised Federal Legislative List
Parts I and II.Federal Government has exclusive domain in Part 1. All policy decisions on subjects in Part II shall be decided by the Council of Common Interest.
Shared federal and provincial responsibility
Concurrent List
Provincial responsibility (Residual subjects not mentioned in either of the two lists)
All residual subjects not mentioned in the Federal Legislative List.
Source: United Nations Development Programme. 2015. Climate Public Expenditure and Institutional Review (CPEIR) Study. Islamabad.
(i) Long time frame for the impacts of climate change to unfold and be felt is a constraint to effective policy and planning formulation and implementation, while the development plans normally cover a short term of half a decade.
(ii) Cross-sector and multidisciplinary approach is required to understand the implications of climate change and respond accordingly. It requires a breadth of skills and expertise within government to address multiple dimensions of climate change.
(iii) Strong interest groups with a smaller number of losers and many dispersed winners.(iv) National and international jurisdiction.
The most serious challenge the climate change policy is facing is its implementation. NCCP makes the gigantic task of policy implementation contingent upon devising an “action plan” at the federal, provincial, and local government levels. With much confusion and limited understanding of the administrative and legal powers of the regulations, policies, and programs transferred to the provinces, there seems to be less interest in adopting a policy with less clear directives. Furthermore, the government’s priority is focused on other more immediate challenges the country is facing, such as terrorism and energy shortfalls. Most of the efforts and financial resources are used up by these problems and limited time or financial resources are left to deal with climate change aspects. Another challenge is the erosion of climate change policy ownership by the provinces, due to potentially conflicting or overlapping objectives, responsibilities, and priorities between provinces and federal agencies.
The mainstreaming of NCCP into public sector discourse is not possible without effective vertical and horizontal coordination efforts with full involvement of all stakeholders from the government, civil society, technocrats, private businesses, and the general public. The formal institutionalized coordination efforts in the past have largely been horizontal, involving mainly the government sector. An effective vertical coordination among federal, provincial, and local governments has not yet started.

47Institutional Arrangements for Climate Change
The Cabinet Committee on Climate Change marks the earliest coordination efforts of the government in early 1995. This was later changed to the “Prime Minister Committee on Climate Change” in 2004. This committee represents the apex political body directing climate efforts and is required to meet annually. It is headed by the Prime Minister of Pakistan, and includes the ministers for water and power, food and agriculture, science and technology, and environment; the deputy chairman of the Planning Commission; and the special advisor to the Prime Minister. The committee’s mandate is to provide the directive to policy formulation on climate change in the country. The body has suffered from lack of sustainability and, thus, is ineffective in building interministerial linkages.66
The then-Ministry of Environment established the Core Group on Climate Change. It aimed to forge Pakistan’s approach and strategies toward the negotiation underway at the UNFCCC following the adoption of the Bali Plan of Action (2007). The group was composed of members of civil society, think tanks and various ministries. The efficacy of this group was largely hampered by the other important ministries’ apparent lack of interest in the issue, and it became inactive by the end of 2013.
The provision of climate change data and information is considered as a primary motivational variable for mainstreaming the climate change issue that reduces uncertainty in decision-making processes.67 In the case of Pakistan, the lack of information and scaled-down data on climate change impacts, and its associated responses poses a major challenge in the implementation and mainstreaming of NCCP.
Currently, the evidence of the direct impacts of climate change on development is scarce compared to evidence on natural disasters. At the federal level, each ministry has its own system for collecting and using data and information, mostly supported by the attached research institutions. For example, the Ministry of Water and Power generate water and energy-related data through its organizations such as the Water and Power Development Authority (WAPDA), Alternative Energy Development Board (AEDB), and the National Energy Conservation Centre, etc. Similarly, the Ministry of Food Security and Research generates and collects data from Pakistan Agriculture Research Centre (PARC). Some agencies such as the PMD and Global Change Impact Studies Centre (GCISC) under Ministry of Climate Change generate particular climate-related information. Among ministries and sectors, coordination, communication, and information sharing remain weak.
66 I. Khan and S. Munawar. 2011. Institutional Arrangement for Climate Change in Pakistan. SDPI Report Series 19. Islamabad.67 C. B. Field et al. 2014. Climate Change 2014: Impacts, Adaptation and Vulnerability Part A: Global and Sectoral Aspect.
Contributions of Working Group II to Fifth Assessment Report of the IPCC. Cambridge, UK and NY, USA: Cambridge University Press.

48 Climate Change Profile of Pakistan
At the provincial and local levels, this information generation and dissemination system is quite fragmented, incoherent, and suffers from lack of legitimacy and authenticity. Decision makers are unable to make concrete decisions because of the lack of specific information on adaptation and mitigation.
The following are some of the important research institutions working on different aspects of country-specific climate change issues and impact assessments. It is notable that there is a considerable overlapping of scientific research related to climate change across these institutions as the country currently lacks a centralized coordinating system to keep track of research programs and avoid overlapping efforts. For example, WAPDA, GCISC, and the water wing of PARC are all working on glaciers, mainly in isolation. These institutions also suffer from lack of human and financial resources.
Pakistan Meteorological Department (PMD): Established in 1947, PMD recognizes itself both as a scientific and service department, and functions under the Aviation Division of the Cabinet Secretariat. It researches, collects, and (re)broadcasts scientific information on a breadth of topics ranging from early warning of natural hazards including drought, flood, tropical cyclone, tsunami and seismic activities, weather data for agricultural community, global warming, and research for renewable energy resources; and advisory services in the fields of planning and development, town planning, and infrastructure. PMD stands out as one of the primary organizations in the country in producing data directly supporting climate change efforts at the local scale.
PMD is divided into four divisions, namely:
(i) National Centre for Drought Monitoring, Islamabad(ii) Research and Development Division, Islamabad (This division is working on the GLOF
in the Northern Pakistan in coordination with UNDP)(iii) Flood Forecasting Division, Lahore(iv) National Seismic Monitoring and Tsunami Warning Centre, Karachi
The meteorological services are extended on a regular basis to some of the purely scientific and hybrid organizations involved in both data production and decision making at the higher level of governance. Among these are the Civil Aviation Authority, PARC, NDMA, Climate Change Division, Federal Flood Commission, Ministry of Religious Affairs and National Food Security, and water sector agencies. Likewise, PMD is also a member of the World Meteorological Organization and the South Asian Association for Regional Cooperation Meteorological Research Centre in Dhaka, Bangladesh.
Global Change Impact Studies Centre: GCISC is an autonomous and dedicated institution on climate change impacts in the country that serves as the Secretariat to the Prime Minister Committee on Climate Change. Established in 2002, it functioned as a Public Sector Development Project for 11 years. It received the status of a national entity in 2013 through the “GCISC Act 2013.” Its function encompasses areas of research, capacity building, and information dissemination and assistance to national planners and policy makers coming from the various sectors of water, energy, food, agriculture and livestock, forestry and biodiversity, health, ecology, and new technology. Among other research initiatives, GCISC is engaged in studying the impact of climate change on glaciers in the Himalayan region.

49Institutional Arrangements for Climate Change
A board of governors chaired by the federal minister for climate change oversees the GCISC. Other members include different scientists; technical experts from the provinces, private sector representatives, and various federal and provincial ministries; NDMA; the Pakistan Space and Upper Atmosphere Research Commission, and the PMD.
Pakistan Agricultural Research Council (PARC): PARC is an autonomous body with the mandate to provide science-based solutions to the agriculture sector. It is administered through a board of governors which is headed by the Minister for National Food Security and Research. Other ministries represented in the board are finance, planning and development, food, agriculture and livestock, and science and technology. PARC is a prime research and policy organization in the agriculture sector.
Pakistan Council of Research in Water Resources (PCRWR):68 The PCRWR is an apex autonomous body established with the objective to conduct, organize, coordinate, and promote research in all aspects of water resources. Since its inception, PCRWR has played its role as a national research organization by undertaking and promoting applied as well as basic research in various disciplines of the water sector, more specifically, irrigation, drainage, surface and groundwater management, groundwater recharge, watershed management, desertification control, rainwater harvesting, water quality assessment and monitoring, and development of innovative water resource management, conservation and quality improvement technologies, etc. However, it is important to note that the organization does not consider climate change as one of the main challenges to water management in the country.
The overall decision-making body of the PCRWR is its Board of Governors (BOG). The Federal Minister (Scientific and Technological Division) of the Ministry of Science and Technology is the President of the BOG, and its Secretary is the Vice President of the BOG.
Water and Power Development Authority (WAPDA):69 Established in 1958, WAPDA is a semi-autonomous body that handles the water and power sector. In 2007, it was bifurcated into two separate entities: WAPDA and the Pakistan Electric Power Company. The former is responsible for all aspects of water and hydropower development including irrigation, drainage and water supply, flood management, prevention of water logging and salinity, and inland navigation; whereas the latter handles thermal power generation, transmission, distribution, and billing.
WAPDA has two important wings: water and power. The power wing looks after hydropower generation. The water wing is more active as it deals with all water-related areas. The coordination and monitoring subwing is responsible for coordination among various WAPDA formations with the Ministry of Water and Power and other national and international organizations and ministries. WAPDA has its own research wing and has been producing science-based information related to the water, and power issues and challenges.
68 The Pakistan Council of Research in Water Resources. http://www.pcrwr.gov.pk/About.aspx69 Water and Power Development Authority. www.wapda.gov.pk

50 Climate Change Profile of Pakistan
2. Other Supporting Policies and Framework
a. Framework for Implementation of Climate Change Policy (2013)
This framework provides a guideline for the implementation of the NCCP by considering both the current and future anticipated climate change threats to the country. Keeping in line with the NCCP’s policy measures, it spells out a comprehensive list of both adaptation and mitigation strategies, and actions for each key sector primarily identified in the NCCP, while prioritizing the adaptation efforts at the sector level.
The framework document aims to provide a basis and form the building block that will lead to the development of a National Adaptation Plan, National Appropriate Mitigation Action, and the preparation of the Second National Communication to the UNFCCC.
The implementation time frame ranks action strategies into priority action (within 2 years), short term (5 years), medium term (10 years), and long term (20 years), with identification of the relevant organizations and ministries to play a role in each. However, the framework does not assign clear roles and responsibilities to these organizations and, most importantly, does not itemize how coordination among these would be effective regarding institutional power and authority after the 18th constitutional amendment.
The framework enlists important enabling factors for its success that includes building high-level political support, besides enhancing donor community interest and attracting international climate financing. It pinpoints the donor community’s lack of interest in climate change-related initiatives as a major implementation challenge for the mainstreaming of the NCCP. Similarly, it identifies the importance of the private sector’s role in the successful implementation of climate change adaptation and mitigation programs in the country.
b. National Disaster Risk Reduction Policy (2013)
The National Disaster Risk Reduction Policy (2013) aims to build the nation’s resilience by reducing its exposure to various types of hazards, adopting principles to strengthen community resilience by improving vulnerability and risk assessment through a multihazard approach, and by assigning a clear division of roles and responsibilities, interorganizational partnership, and accountability and transparency.70
The policy objectives recognize climate change challenges in the context of national capacity building and development planning, as follows:
(i) Creating an integrated national capacity to identify and monitor vulnerability and hazard trends including potential climate change impacts.
(ii) Promoting development planning that considers and addresses disaster risks alongside environmental and climate change concerns.
70 National Disaster Risk Reduction Policy. 2013. http://www.ndma.gov.pk/Documents/drrpolicy2013.pdf

51Institutional Arrangements for Climate Change
The vision statement, however, while emphasizing building national resilience against natural and manmade hazards, misses out on the strong linkage of climate change and the increasing frequency and intensity of disasters with the ability to erode the resilience of communities. It states, “A Pakistan that builds up its resilience to shocks from natural and man-made hazards with a sense of urgency, creating a solid base to address disaster risk reduction in vulnerable areas, while involving an increasingly wider range of stakeholders...”
It is important to highlight that the current policy document is not synchronous with the main thrust of NCCP. The issue of disaster risk reduction is assigned a separate section in NCCP but in the National Disaster Risk Reduction Policy, which was formulated after the NCCP, the recognition of climate change mostly does not go beyond one-liners that acknowledge its role mainly in the context of hydrometrological hazards such as floods and droughts, and melting glaciers of the North.
c. National Environmental Policy 2005
The National Environment Policy 2005 was formulated at a time when understanding among policy makers about the country’s climate change challenges was low.71 The environment policy recognizes various issues such as dwindling water resources and desertificationthat could be linked to the serious outcome of climate change in Pakistan. In this policy document, climate change is one of the key environmental issues.
The issue of climate change is explicitly mentioned only in Section 4.7 of the environment policy, reproduced below:
4.7. “Climate Change and Ozone Depletion.” In order to effectively address challenges posed by climate change and to protect the ozone layer, the government shall:
(i) Develop and implement the national climate change action plan.(ii) Establish National Clean Development Mechanism (CDM) Authority.(iii) Develop and implement policy and operational framework for effective management
of CDM process. (iv) Promote the use of ozone friendly technologies. (v) Phase out the use of ozone depleting substances in line with the provisions of the
Montreal Protocol.”
This narrow perspective mainly focuses on CDM, which is a mitigation instrument, and is restricted to protecting air quality, which is only one of the many manifestations of climate change. This does recognize the need for a national climate change action plan but fails to acknowledge its serious cross-sector implications on Pakistan’s fragile demographic profile.
71 National Environmental Policy. 2005. http://environment.gov.pk/NEP/Policy.pdf
52 Climate Change Profile of Pakistan
d. Alternative and Renewable Energy Policy 2011
The Alternative and Renewable Energy (ARE) Policy 2011, developed by the Ministry of Water and Power, provides a road map for realizing the full potential of ARE in Pakistan.72 The AEDB, under the AEDB Act (2011), is empowered to develop the national strategy, policies, and plans for the utilization of ARE. The ARE Policy 2011 has an expanded scope encompassing all ARE sources including solar, wind, small-scale hydropower, biogas, biofuel, and energy from waste.
The ARE Policy 2011 sets out some enhanced financial mechanisms and also addresses areas like rural energy services and biofuels. It aims to set the requisite infrastructure in place so it can be fully mainstreamed and integrated within energy planning, and economic and social development. Likewise, it has tried to resolve policy conflicts, addressed stakeholders concerns, and includes the proposed establishment of Alternative Energy Development Fund to promote this sector.
The ARE 2011 was developed at a time when stakeholders’ consultations for the development of NCCP were underway. As such, the ARE Policy 2011 is complementary to the climate change policy, and most of the policy measures regarding renewable energy are more or less the same in both polices. Furthermore, as a mitigation effort, the alternative energy indirectly improves the adaptive capacity of the community.
To earn financing for the ARE initiatives, the focus of the ARE Policy is getting carbon credits by using CDM.73 In this context, the AEDB is authorized to provide technical expertise to the (former) Ministry of Environment as the DNA in its role under the CDM. The AEDB assists in the development of local CDM capacities, as well as carries out CDM promotion and awareness of ARE.
Another important focus is environmental and potential social impacts of alternative fuels, specifically biodiesel supply chains. Under the alternative fuel chapter, it identifies the EPA as the main agency to develop emissions standards for aldehyde and methanol production.
e. National Power Policy (2013)
The National Power Policy was formulated in 2013 under the auspices of the Ministry of Water and Power.74 The key objective of this National Power Policy is to attract local and foreign investments for the expansion of the country’s power generation capacity, particularly in the production of cheap electricity.
The National Power Policy strategy focuses on shifting Pakistan’s energy mix toward low cost sources such as hydropower, gas, coal, nuclear, and biomass. Local and foreign investments will aggressively seek small- and medium-size runs of river hydel projects. Selected hydel projects under development will be positioned for privatization, and multilateral agencies will be invited to partner for large infrastructure hydel projects. The National Power Policy assessed that 7,000 megawatts (MW) of electricity need to be added to the system to control load shedding in Pakistan.
72 Government of Pakistan, Ministry of Water and Power. 2011. Alternative and Renewable Energy Policy 2011. Islamabad.73 CDM is one of the emission reduction instruments of the Kyoto Protocol.74 Ministry of Water and Power Pakistan. National Power Policy. http://www.ppib.gov.pk/National%20Power%20Policy%20
2013.pdf

53Institutional Arrangements for Climate Change
In the National Power Policy document, clear targets are laid out in terms of efficiency, affordability, financial viability, the demand–supply gap, and governance of the system. However, the policy does not have a clear emission reduction strategy. All over the world, the energy sector is at the forefront in combating climate change due to its highest share in GHG emissions. In Pakistan, this sector contributes more than 50% of emissions, but, unfortunately, the policy does not consider how initiation of cheap coal power can change the country’s present low-emission status. Likewise, it fails to include any initiatives that would drive energy efficiency and promote clean energy by putting in place the carbon pollution standards for high emission subsectors.


55
Climate Finance Landscape of Pakistan
The current global efforts toward mainstreaming of climate change in development policies and programs are getting more traction due to expanding avenues of domestic and international climate finance. For developing countries, climate finance is undoubtedly becoming the key incentive to integrate climate change issues into their development discourse and advance their efforts and initiatives to mitigate and adapt to the impacts of climate change. According to the Climate Policy Initiative (CPI) report, in 2013, annual global climate finance flows approximately reached $331 billion, of which $34 billion flowed from developed to developing countries.75
Pakistan is a relatively new player in the international climate finance arena with a nascent institutional setup, and, hence, has limited experience in receiving or disbursing international climate finance resources. As of 2012, it had only $15 million in disbursements of multilateral finance explicitly for climate change.76
This chapter reviews the current architecture of climate finance of the government to paint a picture of its capacities and constraints. It starts by discussing the domestic public finance flow process and allocation for climate change-relevant expenditures. It further elaborates on the roles of the various key institutions in this process. Lastly, it examines how successful the country has been in accessing international climate finance.
75 Global Policy Initiative. 2014. Global Landscape of Climate Finance. http://climatepolicyinitiative.org/publication/global-landscape-of-climate-finance-2014/
76 Vivid Economics. 2013. Pakistan’s Climate Finance Architecture: A Review of Financial Fund or Facility for the Ministry of Climate Change, Government of Pakistan. Unpublished.
Box 8: Pakistan’s Climate Change-Relevant Federal Expenditure, 2010–2014
6.52% of total federal expenditure
Adaptation spending = 25%–60% of climate change-relevant federal budget
Mitigation spending = 30%–71% of climate change-relevant federal budget
Adaptation/Mitigation = 11% of climate change-relevant federal budget
Source: United Nations Development Programme. 2015. Climate Public Expenditure and Institutional Review (CPEIR), Pakistan. Islamabad.

56 Climate Change Profile of Pakistan
A. Domestic Climate-Relevant Finance Mechanisms and Tools
At the domestic level in the country, there is no separate and dedicated funding to date for mitigation and adaptation activities. The national planning processes and budgetary framework lack a discrete standard coding system for the identification of climate-relevant projects and programs scattered across different sectors and departments. According to the recent Climate Public Expenditure and Institutional Review (CPEIR) study for Pakistan (2015), the total federal climate-related expenditure (development + current budget) was estimated to be around 6.52% during the last 4 years.77 The relative proportion of the climate-relevant budget spent on adaptation and mitigation varied significantly across studied years. Similarly, the number of climate-relevant projects and proportion of projects within each government institution varied greatly during the study years, suggesting a lack of directed and consistent resource allocation and policy delivery toward climate activities.
The resource allocation process as they relate to prospective climate-relevant programs and projects at the national government level summarized below.
1. Planning Processes and Receptivity toward Climate Change
The Ministry of Planning, Development, and Reforms (Planning Commission) and the Ministry of Finance (MOF) are the two apex planning and coordination bodies of the national government that exercise an authoritative power in fiscal resource allocation, execution, and distribution to line ministries. The Medium-Term Budgetary Allocation Framework, acting as the central guiding approach, sets the process of budget allocation in motion by establishing a budget ceiling for each ministry. The budget is earmarked for both the development projects and recurrent expenses of each ministry where recurrent expenses get the major chunk of the budget.78 Once approved, the development budget is displayed in the Public Sector Development Program (PSDP). The PSDP document lists all the public sector projects and programs with specific allocations made for each in a particular financial year.
The Planning Commission and the MOF set the development and recurrent expenditures budget that spans a 7-month preparation period. In the initial cycle of project and program preparation and approval, the line ministries set their own project lists with a proposed amount of funding. Individual projects with cost exceeding PRs60 million ($0.6 million) (but less than PRs500 million [$5 million] need further review and approval from the Planning Commission through its Central Development Working Party (CDWP) committee. Similarly, projects costing more than PRs500 million ($5 million) go through the National Economic Council (NEC) for final approval. The NEC sits in the MOF and is headed by the Prime Minister or finance minister.
In the next phase of project prioritization, the projects are reviewed again and discussed individually for funding allocation by the Priorities Committee and the Annual Plan Coordination Committee of the Planning Commission. Lastly, the finance minister presents the Annual Federal Budget to the Cabinet and the Parliament for final approval.
77 United Nations Development Programme. 2015. Pakistan Climate Public Expenditure and Institutional Review (CPEIR). Islamabad.
78 A budget analysis of the 2011–2014 period shows that current expenditure ranged from 80%–84% of the total federal budget, while the development budget was only 16%–20%. UNDP. 2015. Climate Public Expenditure and Institutional Review (CPEIR), Pakistan.

57Climate Finance Landscape of Pakistan
While climate change mainstreaming necessitates an integrated cross-sector approach, ministries and sectors normally concentrate on their own key sector policies—appearing to pay limited attention to umbrella policies such as the National Climate Change Policy—as the main driver for derivation of their investments and, thus, there virtually no direct entry point for climate change in the preparation of the Medium-Term Budgetary Allocation Framework’s budget ceilings.
Climate-Relevant Expenditures in the Federal Budget
The process of budget allocation tends to reinforce the core and business-as-usual activities. According to the CPEIR, “…Projects that solely focus on mitigation or adaptation to climate change rank low on the prioritization scale at all levels of decision-making in the government, barring the examples of the big investment and foreign-funded projects, e.g., hydroprojects for increasing energy supplies and water availability rank high even if their externalities lead to mitigation of climate change emissions.”
The inclusion of projects in the development budget (i.e., PSDP) is further affected by many other factors, e.g., the political influence of stakeholders and parliamentarians, political parties’ manifestos, foreign funding, and a lesser influence of sector policies. Moreover, at the implementation and execution cycle of the federal budget, the finance and planning divisions or departments have a centralized role in allocating fiscal resources across sectors and departments, among expenditure heads, and activities and schemes. Such centralized control discourages line ministries from saving on wages, and diverting funds toward enhancing allocation for repair and maintenance expenditures.
The climate-relevant budget analysis for the federal government (2010–2014) shows a very low ratio of climate-related expenditures in the federal budget, which varied between 5.8% and 7.6% of the annual total federal budget (Table 11).
Table 11: Four-Year Summary Analysis of Climate Expenditures in Development, Current, and Total Federal Development Budget (in PRs million)
Federal Budget 2010–2011 2011–2012 2012–2013 2013–2014CC-relevant actual development expenditures 133,427.98 129,494.76 133,544.91 187,485.67CC-relevant actual current expenditures 58,620.28 69,835.31 63,188.51 55,914.82CC-relevant actual expenditure (% in federal budget) 7.57% 6.52% 5.78% 6.22%
CC = climate change, PRs = Pakistan rupees.
Source: United Nations Development Programme. 2015. Climate Public Expenditure and Institutional Review (CPEIR) Study, Pakistan. Islamabad.
Similarly, on a sector basis, expenditures in the energy sector for mitigation purposes dominate the climate-related federal expenditures, (57%, 2013–2014 data) and represent over half of the total expenditures. Other significant contributions are from transport (19%, predominantly mitigation), health and social services (9%, adaptation) and water resources (8%, adaptation) (Figure 18).

58 Climate Change Profile of Pakistan
Figure 18: Sector Allocation of Expenditures to Climate-Relevant Tasks in the Public Sector Development Program of 2013–2014
Agriculture and Livestock 0%
Disaster Preparedness 5%
Forestry 0%
Health and Other Social Services
9%
Transport19%
Awareness Raising and Education 2%
Water Resources 8%
Energy (EN)57%
PSDP = public sector development program.Source: United Nations Development Programme. 2015. Climate Public Expenditure and Institutional Review (CPEIR) Study, Pakistan. Islamabad.
Figure 19: Allocation of Expenditures to Climate-Relevant Activities in the Public Sector Development Program of 2013–2014
Adaptation26%
Mitigation54%
Adaptation/Mitigation
18%
Supporting Activities2%
PSDP = public sector development program.Source: United Nations Development Programme. 2015. Climate Public Expenditure and Institutional Review (CPEIR) Study, Pakistan. Islamabad.
Mitigation tasks dominated the federal climate-related budget profile by taking 54% of the total climate-relevant budget expenditure, followed by adaptation activities (26%), and adaptation and/or mitigation (18%). The supporting activities such as awareness creating and capacity building received the lowest (around 2%) portion of the budget (Figure 19). The list of federal priority adaptation and mitigation PSDP projects for the year 2013–2014 is attached in Appendix 3.

59Climate Finance Landscape of Pakistan
Box 9: Khyber Pakhtunkhwa’s Climate Change-Relevant Provincial Expenditures, 2010–2014
6.42 % of the total provincial expenditures
12.00 % of the development expenditures
Adaptation = 44.00% of the total climate change-related provincial budget expenditures
Joint adaptation and/or mitigation = 28.00% of the total climate change-related provincial budget expenditures
Supporting activities = 18% of the total climate change-related provincial budget expenditures
Mitigation = 10% of the total climate change-related provincial budget expenditures
Source: United Nations Development Programme. 2015. Climate Public Expenditure and Institutional Review (CPEIR) Study, Pakistan. Islamabad.
2. Provincial Financial Landscape and Climate Change
Following the 18th constitutional amendment, the expenditure pool of the provinces increased significantly. For example, after the 18th constitutional amendment, the budget expenditure for the province of Khyber Pakhtunkhwa increased by 35% and consequently; the development budget (the Annual Development Plan) represents 30%–32% of the total budget (2010–2014), according to the CPEIR study. Moreover, grants from the external resources represent 80%–90% share in the fiscal resource pool of the province.79
The climate change-relevant budget analysis for the province shows that climate change-related projects make up 75%–82% of development expenditure lines (compared to 47%–56% at federal level in 2010–2014) and nearly three-quarters of the climate activities in Khyber Pakhtunkhwa had an adaptation component falling under water, disaster, and health sectors. On a sector basis, transport (28%), water (20%), and awareness raising and education (18%) make up about two-thirds of the Khyber Pakhtunkhwa climate budget of the Annual Development Plan.
3. Institutional Structure for Managing Climate Finance
The Ministry of Climate Change is the apex federal-level institutional body handling various international climate finance flows, including Clean Development Mechanism (CDM), Reducing Emissions from Deforestation and Forest Degradation (REDD+) and international climate funds such as the Adaptation Fund. The ministry holds a fully-functional structure for CDM, which is run through its CDM Secretariat. It acts as the national focal point for the CDM and performs all the necessary activities required under United Nations Framework Convention for Climate Change (UNFCCC) regulations.
The Ministry of Finance (MOF) receives and disburses all finances from donors. The MOF also plays the role of an auditor for the loan-funded programs.
79 After the 18th constitutional amendment, the provinces enjoy a sovereign power to set and negotiate their own development assistance agenda and seek international climate funding. The Article 167 (4) of the Constitution (of 1973) enable provinces to raise domestic or international funds or loans, either autonomously or through consultation with the interprovincial Council of Common Interest (CCI) and the NEC, or gives guarantees on the security of the Provincial Consolidated Funds.

60 Climate Change Profile of Pakistan
The Economic Affairs Division (EAD), as a division of the MOF, coordinates all finances from donors through the assessment of requirements, programming, and negotiation of external economic assistance. It remains the legal point of contact between foreign development partners and the Government of Pakistan as all development partner activities must be approved by the EAD even after the 18th constitutional amendment in the constitution. This means the federal government, through EAD, will continue exercising control over provincial borrowing by limiting the size of loan a province can directly take on.
The National Economic Council (NEC) is reconstituted under the 18th constitutional amendment. Its main functions encompass various aspects of interprovincial oversight. It directly reports to the national assembly, and has to work with provincial governments on the formulation of economic policies. Although not clear, it is believed that NEC plays a parallel role to that of the Council of Common Interest (CCI) with respect to development and economic growth.
The Council of Common Interest was established as part of the 1973 Constitution but its role was suspended twice, in 1977 and 1999. The 17th amendment in 2003 gave it a quasipresidential form. After the 18th constitutional amendment, changes were made to the CCI’s role, as follows:
a. The Prime Minister now chairs the CCI. Previously, any federal minister could be nominated by the President to be the chair of the CCI.
b. The CCI had been accountable to the parliament since its inception. However, the modalities and operationalization of this accountability were never clearly stated in the constitution. The 18th constitutional amendment directed the CCI to submit annual reports to both houses of parliament for approval and made the CCI responsible to the parliament.
c. The 1973 Constitution authorized the President to appoint members of CCI without mentioning any time frame. Thus, the President could delay setting up the CCI indefinitely. The 18th Constitutional Amendment compelled the President to constitute the CCI within 30 days of the Prime Minister’s oath of office.
d. Clause 3 of Article 154 provided that the CCI must have a permanent secretariat and will hold meetings at least once in 90 days. Prior to the 18th Constitutional Amendment, none of these two conditions were present.
After the 18th Constitutional Amendment, the Prime Minister can now convene the meetings of the CCI on the request of a province on an urgent matter. The CCI has authority on all matters included in the Federal Legislative List 2, and is constitutionally bound to meet once every 90 days and report to both Houses of Parliament. Its major responsibilities include: to formulate and regulate the policies of subjects that come under the joint ownership of federal and provincial governments, such as to draft policies on interprovincial issues of electricity and railways; to supervise and control the institutions associated with those policies; and to act as the main forum for the intergovernment dispute resolution.
The CCI played a very active role after the 18th Constitutional Amendment. It has been meeting four times a year and has taken up responsibilities mentioned above, including flood crises response.
The role of CCI is of particular interest and importance since climate change impacts do not have jurisdictional boundaries. The CCI can play a key role when new administrative issues arise among the provinces on natural resources management or responding to a natural disaster. Similarly, its broad reach at the federal as well as provincial level allows it a central role among new power players from the grassroots level, such as civil society organizations, district governments, and indigenous people who did not have a role and position in the decision-making process.

61Climate Finance Landscape of Pakistan
Finally, there are ministries with some responsibilities for climate change-related policies. In particular, the Ministry of Water and Power is responsible for a key area of mitigation (power generation) and adaptation (water). Similarly, the Inter-Provincial Committee is another noticeable newly-emerged institution entitled to develop provincial environmental acts. Its role and function is specifically limited to the national impact assessment plan at this time, but considering the recent inclusion of strategic environmental assessment in development planning, this would be an important institution to take note of for climate change-related activities.
B. International Climate FinanceThe international climate financing landscape is currently very complex and fragmented. It involves a large number of players including both public and private sectors, as well as channeling mechanisms and tools. The private sector stands out as a major actor contributing 62% of the total finances. The public sector, so far, has invested around 38% of the total global climate finances and its resources remain the key driver of the climate finance system. It is important to note that domestic policies are critical drivers of investments, especially for private investors. In 2013, three-quarters of the investments originated and were spent in the same country, while the private actors spent 90% of their investments in the country of origin.80 Appendix 4 has a brief overview of the international climate funds.
In the past, Pakistan received international climate financing from the Asian Development Bank (ADB), the Global Environment Facility (GEF), the Adaptation Fund, and Japan’s Fast Start Finance Initiative. From 2011-2015, ADB’s climate finance to Pakistan has reached $389.8 million, covering both investments and technical assistance.81 A large portion of this figure ($375.9 million or 96.4%) was for mitigation and only $13.9 (3.6%) million was for adaptation.82 The country has also received around $12.5 million, most of which has been disbursed, through the GEF for mitigation activities. The financing from the Adaptation Fund and the Fast Start Finance Initiative were mainly for adaptation activities. The former provided around $3.9 million and the latter provided around $31.7 million for a water supply scheme in the City of Abbottabad.
The Green Climate Fund (GCF) is the newest actor in multilateral climate finance with focus on both mitigation and adaptation. It is an independent institution headquartered in the Republic of Korea, and is managed by a board of 24 members with equal representation from among both developed and developing countries. Working as the operating entity of the financial mechanism of the UNFCCC, it shows promise as it has emerged as the biggest public finance source for developing countries. It is intended that the GCF will support the mobilization of $100 billion per year of private and public funds by 2020 to address the mitigation and adaptation needs of developing countries. To date, the GCF has raised $10.3 billion equivalent in pledges from 43 state governments.83 With half of the current pledges committed to adaptation, the GCF can be seen as the biggest multilateral adaptation finance institution in the world.
With the adaptation financing from the Adaptation Fund, Japan’s Fast Start Finance Initiative, and ADB, the current adaptation support funneled into Pakistan is currently small when compared to the adaptation needs of the country estimated between $7 billion to $14 billion annually (Footnote 18).
80 Climate PoIicy Initiative. 2014. Global Landscape of Climate Finance. http://climatepolicyinitiative.org/publication/global-landscape-of-climate-finance-2014/
81 ADB database. Internal communication. 82 No mitigation finance support was provided in 2012 while the adaptation finance support were all provided in 2014.83 Green Climate Fund. Status of Pledges and Contributions Made to the Green Climate Fund. https://www.greenclimate.
fund/documents/20182/24868/Status_of_Pledges.pdf/eef538d3-2987-4659-8c7c-5566ed6afd19


63
Climate Change Adaptation Technologies in Pakistan
The climate change adaptation experience of Pakistan is still at the nascent stage. The NCCP prioritizes adaptation over mitigation efforts for the country with a suggested set of sector level adaptation measures which are further prioritized and categorized for short-, medium- and long-term implementation through important policy guiding documents such as the “Framework for Implementation of Climate Change Policy (2013)” and Work Program on Climate Change Adaptation and Mitigation in Pakistan (2014). These efforts, however, fail to plan out a transition from the current phase of increased climate change awareness and outreach to the development and implementation of adaptation plans, strategies, legislation, and projects at the national, subnational, and local levels. International development partners and donors act as a major force in the country for building momentum for a sustainable and climate-resilient development.
A. Sector-Specific Adaptation Technologies to Climate Risks
In Tables 12 and 14–16, selected adaptation technologies and measures are suggested against the types of risks faced by Pakistan’s agriculture, water, energy, and urban infrastructure services sectors.
It is worthwhile to note that a recent study by WWF84 showed that the uptake and success of agricultural adaptation technologies are found to be heterogeneous across the farming community. What may work in one location, or for one type of crop, may not work for others. From this study, Table 13 displays adaptation strategies and the respective frequencies of uptake in the study areas of Punjab and Sindh.
Table 12: Climate Change Risks and Suggested Adaptation Technologies in the Agriculture Sector of Pakistan
Climate Change Risks Suggested Adaptation TechnologiesReduced crop production due to heat stress and higher temperatures.
Development of or use of crop varieties with greater heat and drought tolerance such as mustard. Shifting to delayed sowing.Water shortages due to low rainfall and
increased evapotranspiration-induced cropwater requirements, particularly in rain-fed dry areas.
84 (Dehlavi et al., 2015).
continued on next page

64 Climate Change Profile of Pakistan
Climate Change Risks Suggested Adaptation TechnologiesErratic and uncertain and sometime unseasonal rainfall patterns badly affecting crop production.
Promote use of efficient irrigation techniques (sprinkler and drip irrigation, etc.); improve the irrigation distribution system and reducing distribution losses; and laser land leveling to reduce water wastage.Reduction in available irrigation water
due to changing rainfall patterns and increased demand.Decreasing quality and quantity of underground water due to excessive pumping which is negatively affecting crop productivity and soil fertility.
Improve integrated water management system along with required legislation and awareness raising support.
Increased frequency and intensity of extreme climatic events of flooding, drought, and heat waves causing extensive damage to agriculture and livestock sectors.
Develop an improved multihazard early warning system.
Sources: Asian Development Bank. 2014. Technologies to Support Climate Change Adaptation. Manila; R. Clements et al. 2011. Climate Change Adaptation - Agriculture Sector. Roskilde: United Nations Environment Programme (UNEP) Riso Centre; L. A. Christiansen, A. Olhoff, and S. Traerup eds. 2011. Technologies for Adaptation: Perspectives and Practical Experiences. Roskilde: UNEP Risø Centre on Energy, Climate and Sustainable Development. http://www.unep.org/pdf/TechnologiesAdaptation_PerspectivesExperiences.pdf
Table 13: Distribution of Uptake of Adaptation Strategies in Sindh and Punjab Agroclimatic Zones
Adaptation StrategyWhole sample frequency (%)
Punjab sample frequency (%)
Sindh Sample Frequency (%)
Crop Timing 3.7 3.2 4.3Cropping Pattern 2.0 0.7 3.7Altering Agricultural Inputs 5.3 5.5 5.0Soil Conservation 3.1 1.7 5.0Water Conservation 12.2 10.7 14.2Diversification 12.4 9.6 16.2Public Infrastructure 10.0 15.1 3.0Total Adapters 48.6 47.6 51.3Nonadaptation 51.4 52.4 48.7
Total 100.0 100.0 100.0
Source: A. Dehlavi et al. 2015. Climate Change Adaptation in the Indus Eco-region: A Micro Econometric Study of the Determinants, Impacts, and Cost-Effectiveness of Adaptation Strategies. Karachi: WWF-Pakistan.
Table 12: continued

65Climate Change Adaptation Technologies in Pakistan
Table 14: Climate Change Risks and Suggested Adaptation Technologies in the Water Sector of Pakistan
Climate Change Risks Suggested Adaptation TechnologiesIncreasing water shortages due to changing climatic patterns, particularly precipitation and warmer temperatures causing higher evaporation, in addition to increasing demand from the rising population and additional industrial usage.
Promote efficient irrigation techniques such as sprinkle and drip irrigation system; recycle wastewater in urban areas; promote rainwater harvesting; and promote desalination techniques particularly in coastal and hyperarid areas with saline underground water.
Higher water losses in conventional irrigation system.Reduction in water storage capacities due to sedimentation.
Initiate efforts on integrated watershed management; reforestation of catchment areas; and construction of additional water storage areas.
Increased frequency of extreme climatic events of floods, droughts, storms, etc. due to the changing climate.
Improve multihazard early warning system.
Lack of understanding how climate change is affecting water availability in our country.
Carry out awareness-raising campaigns, both for the public as well as for policy makers to create better understanding of the water issues and the need to conserve this precious resource.
Increased frequency of flash floods generating huge damage by hill torrents, particularly in hilly areas.
Construction of slow action dams and small storage containers in hilly areas
Increased saltwater intrusion particularly in the Indus delta due to reduced freshwater supplies to the area.
Improve water management to ensure required freshwater supplies to the delta area to maintain a healthy ecosystem in the area.
Sources: M. Elliott et al. 2011. Technologies for Climate Change Adaptation - Water Sector. Roskilde: UNEP Risø Centre; IPCC. 2014. Climate Change 2014: Impacts, Adaptation, and Vulnerability. IPCC Working Group II Contribution to AR5. http://ipcc-wg2.gov/AR5/; M.M. Linham and R.J. Nicholls. 2011. Technologies for Climate Change Adaptation: Coastal Erosion and Flooding. TNA Guidebook Series. Roskilde: UNEP Risø Centre on Energy, Climate, and Sustainable Development.
A more detailed description of a number of the agriculture and water technologies is provided in Appendix 5.
Table 15: Climate Change Risks and Suggested Adaptation Technologies in the Energy Sector of Pakistan
Climate Change Risks Suggested Adaptation TechnologiesReduction in water availability for hydropower generation.
Diversify the energy mix and make further investments in renewable and small hydropower projects.
Extreme climate events damaging oil, gas, and power infrastructure.
Improve weather forecasting and warning systems; carry out retrofitting of critical energy infrastructure.
Hotter temperatures increase energy demand. Invest in additional energy capacity, preferably in renewable energy sources.Warmer air and hotter water temperature may
affect efficiency of thermal plants.
Source: Climate Techwiki. http://www.climatetechwiki.org/

66 Climate Change Profile of Pakistan
Table 16: Climate Change Risks and Suggested Adaptation Technologies in the Urban Infrastructure Services Sector of Pakistan
Climate Change Risks Suggested Adaptation TechnologiesHeavy rainfall impact on urban drainage systems. Enhance capacity of urban storm drain channels;
developing and promoting rain and roof gardens and bioswales; and make efficient use of water to offset the impacts of severe drought spells in urban areas particularly if located in arid areas.
Extreme hydrological events impact on urban potable water supply systems.
Heavy rainfall-induced landslides in mountain urban centers.
Adopt both hard and soft preventive measures to offset the impact of landslides and sea level rise, such as construction of dikes, or sea walls, and increasing vegetation cover to minimize landslide threats.
Sea level rise and storm surge impacts on coastal towns.
Sources: W.C. Cam. 2012. Climate Change Mitigation - Building Sector. Roskilde: UNEP Centre on Energy, Climate and Sustainable Development; T.J. Wilbanks and S. Fernandez. 2013. Climate Change and Infrastructure, Urban Systems, and Vulnerabilities: Technical Report for the U.S. Department of Energy in Support of the National Climate Assessment. Washington DC: Island Press.
B. Research GapsThere is a very limited pool of research and data available on observed changes and impacts of climate change on various socioecological systems and sectors at the national and subnational levels. Agriculture, water, and coastal areas stand out as most sought after research areas, where research is mainly restricted to the vulnerability assessments and largely ignores the complex interaction of various socioeconomic factors and their linkages to local livelihood, and resilience of the natural resource-dependent communities and, ultimately, poverty reduction.
Pakistan’s climate monitoring network over the Hindukush-Karakoram-Himalaya (HKH) glaciated areas is very sparse and needs to be strengthened, along with the capacity building of the relevant institutions. For instance, Global Change Impact Studies Centre’s glaciers mass balance and glacio-hydrological modeling capacities could be developed further. Therefore, there is limited information on how glaciers will respond to the changing climate by the end of this century, and what the pronounced impacts will be on the country’s water security.85
At the regional level, the Central and West Asia regions specifically lack a good understanding of climate change impacts on ecosystems and biodiversity due to the poor quality and low accessibility of information on this subject. In the context of Pakistan, the major research gaps identified are thermal tolerance and acclimation capacities of both plants and animals, and the direct impact of rising carbon dioxide on biodiversity.
Significant uncertainty surrounds the impacts of climate change on rice though it is the most studied crop at the regional level. Also, other well-studied crops such as wheat, maize, and cotton lack good experimental data to predict the accurate nature of risks borne by cropping patterns and productivity. Research is needed on impacts, vulnerabilities, and adaptation in urban centers, both in large and medium-sized cities.
85 G. Rasul. 2011. An Analysis of Knowledge Gaps in Climate Change Research. Pakistan Journal of Meteorology. 7 (13).

67Climate Change Adaptation Technologies in Pakistan
Table 17 provides a quick overview of the extent of research and amount of available information supporting conclusions regarding observed and projected impacts of climate change in the Central and West Asia region.
Table 17: Amount of Information Supporting Conclusions Regarding Observed and Projected Impacts for Central and West Asia
Sector Topic or IssueCentral Asia West AsiaO P O P
Freshwater resources Major river runoff X X X X
Water supply X X X X
Food production systems and food security
Rice yield X X X /Wheat yield X X / /Corn yield X X X XOther crops (e.g., barley, potato) X X / /Vegetables X X X XFruits X X X XLivestock X X X XFisheries and aquaculture production X X X XFarming area X / X XPest and disease occurrence X X X XWater demand for irrigation X X X X
Human settlements, industry, and infrastructure
Floodplains X X X XCoastal areas NR NR X XPopulation and assets X X X XIndustry and Infrastructure X X X X
Terrestrial and inland water systems
Distributions of species and biomes X X X XInland waters X X X XPhenology and growth rates X X X X
Human health, security, livelihoods, and poverty
Health effects of floods X X X XHealth effects of heat X X X XHealth effects of drought X X X XWater-borne diseases X X X XVector-borne diseases X X X XLivelihoods and poverty X X X XEconomic valuation X X X X
Notes: NR = not relevant; O = observed impacts; P = projected impacts; / = relatively abundant or sufficient information, knowledge gaps need to be addressed but conclusions can be drawn based on existing information; X = limited information or no data, critical knowledge gaps, and difficult to draw conclusions.
Source: Y. Hijioka et al. 2014. Asia-Climate Change Impacts. 2014. Asia. In: Climate Change 2014: Impacts, Adaptation, and Vulnerability. Part B: Regional Aspects. Contribution of Working Group II to the Fifth Assessment Report of the Intergovernmental Panel on Climate Change. Cambridge, U.K. and New York: Cambridge University Press. p. 1,357.


69
ADB Initiatives in Pakistan and their Exposure
to Climate Change Risks
Climate risk screening, as applied to investment projects, is a rapid assessment tool through which the hazards and risks of climate change can be identified such that appropriate adaptation options may then be assessed and implemented. The foremost challenge in risk screening is the availability of required data, and this also contributes to the difficulty in identifying adaptation options. In this chapter, a screening of three climate-sensitive sectors is performed to demonstrate how the portfolio of ADB-funded initiatives in Pakistan is exposed to medium- to high-level climate risks, and relevant adaptation technologies and measures are identified. In doing so, this exercise aims to (i) provide guidance as to how climate change risk management and reduction may be included into future projects through targeted adaptation, and (ii) identify key vulnerable sectors, regions, and investments which will likely need particular support from ADB and other donors in future.
A. ADB Initiatives in Pakistan The Asian Development Bank (ADB) supports the Government of Pakistan’s objectives in achieving high, sustained, and inclusive growth through its Country Partnership Strategy (CPS) and project pipeline as indicated in the Country Operation Business Plans (COBP). The COBP 2016–2018 for Pakistan is aligned with the interim CPS 2014–2015 and CPS 2015–2019. According to this COBP, ADB will help address Pakistan’s development needs through investment and policy reforms in six key sectors: energy; transport; agriculture, natural resources, and rural development; water and other urban infrastructure and services; finance; and public sector management. The private sector investments remains a priority to achieve development targets that ADB and the government will seek through the reform of public sector enterprises and by generating long-term finance for infrastructure and facilitating public–private partnerships.86 By the end of 2015, ADB’s cumulative grants, loans, and technical assistance for Pakistan amounted to $27.9 billion for 708 projects.87 The energy sector is the largest sector, with $7.7 billion (28%) for 121 projects.
86 ADB. 2016. Country Operation Business Plan: Pakistan, 2016–2018. Manila. 87 ADB. 2015. Fact Sheet for Pakistan. https://www.adb.org/sites/default/files/publication/27786/pak-2015.pdf

70 Climate Change Profile of Pakistan
B. Climate Change Risk Screening ApproachFor this risk screening analysis, a selection of ADB’s approved, ongoing, and completed projects are grouped into three sector categories: agriculture and natural resources, energy, and transport and urban infrastructure services; and seven regional subcategories. The projects are categorized by climate change relevance based on the categorization system of the UNDP CPEIR study88 (see Appendix 6).
The climate risks for the ADB portfolio were assessed at the sector and regional level, based on NDMA’s district vulnerability and hazard classification (see Appendix 7), and further supplemented with a screening checklist (see next paragraph) and expert judgment by the author. Climate risk of a project in this case is defined as a sensitivity of the project or program to climate change, and whether or not there is a loss of performance or effectiveness due to climate change. The methodology categorizes different risk classes in qualitative terms of low, medium, and high climate change risk potential.89 The steps for screening are discussed further in the next subsection. It should be noted that this portfolio-level screening is meant to supplement further detailed project-level screening performed under ADB’s Climate Risk Management System and the online AWARE tool.
Screening has the following steps:
(i) Main Step: Use of the NDMA-developed vulnerability and hazard risk assessment from the classification table which is self-explanatory and easy to use.
(ii) Step 2: A screening checklist is employed to reconfirm and cross-check the initial risk assessment obtained from the district vulnerability and hazard classification:• Project’s location elevation and distance from coast or a water body.• Project’s location in current flood plains or in projected future flood plains.• Project’s location at potential risk from coastal flooding, including projected risks
from storm surge, coastal erosion, and sea level rise, etc.• Freshwater requirements of the project and projected water stress in that area.• Project’s natural resources requirements and their future availability in the project’s
location area under changing climate.• Probability of project’s failures due to climate-induced hazards.• Probability of project exacerbating the climate-induced disaster risk for human life,
property, and environment in the project area.• Defining assessment threshold of winter and/or summer temperature extremes,
intensity and frequency of heavy precipitation events, sea level rise, risk of increased frequency of storms floods, etc. for project area.
88 Q. Z. Chaudhry. 2015. Climate Public Expenditure and Institutional Review Study for Pakistan. Islamabad: United Nations Development Programme.
89 It would be interesting to note that a few climate change screening efforts have used a quantitative risk scale for the screening purpose where low climate change risk is chosen when less than 1% of the development investment is at risk; medium = less than 10% of the development invest is at risk; high = more than 10% of the development invest is at risk; “Climate Change Screening of the Danish Development Cooperation with Kenya” by Ministry of Foreign Affairs of Denmark, Danish International Development Assistance (2007) Climate change screening of Danish development cooperation with Kenya. Copenhagen. http://kenya.um.dk/en/~/media/Kenya/Documents/KenyaClimateScreeningDanida29NOV20072.ashx

71ADB Initiatives in Pakistan and their Exposure to Climate Change Risks
Most of the data required to analyze the check list is available online as follows:
• Data about distance from coast or a water body can be obtained from Survey of Pakistan or from an atlas of Pakistan.
• Information about present or future flood plains can be obtained from the Federal Flood Commission website.
• Information about potential risk of coastal flooding, including projected risk from storm surge and information about sea level rise can be obtained from PMD and from the National Institute of Oceanography.
(iii) Step 3: Expert judgment. To assess the probability of exacerbating climate-induced disasters, expert judgment can provide additional experience and expertise.
Following screening, the sector and regional groupings are assigned one of the three categories: no/low risk, moderate risk, or high climate risks.
(i) Category 1/Low includes projects not likely to be affected significantly by climate.(ii) Category 2/Medium includes projects with some degree of climate vulnerabilities.(iii) Category 3/High includes projects likely to be affected significantly by climate vulnerabilities.
C. Initial Climate Change Risk Screening of Asian Development Bank Development Program Portfolio in Pakistan
Table 18 below presents the overview of the climate change risks in ADB’s selected projects in Pakistan in sectors such as agriculture, energy, and water sectors on a subregional level:
• The first column in the table includes Pakistan’s different ecoregions where each region represents a different climatic pattern and variability.
• The second and third columns provide a disaggregated overview of the main focus of ADB’s projects in the respective ecoregions of the country identified from the clustering of the projects in the main project inventory created for this assessment. Additionally, effort is made to identify the focus of major technologies or interventions that were part of the design of ADB’s projects. The aim is to note the extent to which ADB is already using different adaptation technologies in its development projects in Pakistan.
• The fourth and fifth columns classify the projects characteristic of each ecoregion into adaptation, mitigation, or adaptation and mitigation. The classification of the projects on the basis of its relevance to climate change determines if projects under screening have any climate change-related aspect or not. If yes, then how relevant it is, measured here on a scale of 0%–100% from the “climate change relevant classification” in Appendix 6.
• The sixth column is the initial risk assessment. It shows the risk of climate change impacts on the development portfolio. The risk identifies whether the development objectives are at possible risk. It helps in identifying project categories at a sector and ecoregion basis that need improved risk assessment and risk reduction strategies in the future.
• The seventh column addresses opportunities of synergy with climate change mitigation. Identification and utilization of potential synergies of adaptation and mitigation efforts may lead to improved development efforts and smoothing the mainstreaming efforts of climate change in sector policies and strategies.

72 Climate Change Profile of Pakistan
Tabl
e 18
: Clim
ate
Chan
ge R
isks t
o A
DB
Dev
elop
men
t Por
tfol
io in
Pak
istan
Agr
icul
ture
, Nat
ural
Res
ourc
es, a
nd R
ural
Dev
elop
men
t Sec
tor (
Incl
udin
g Su
bsec
tor o
f Wat
er)
Regi
ons
AD
B In
itiat
ives
A
DB
Initi
ativ
es C
limat
e Ch
ange
Cl
assifi
catio
n an
d Re
leva
ncea
Prel
imin
ary
Clim
ate
Chan
ge
Risk
Sy
nerg
ies w
ith
Miti
gatio
n F
ocus
Inte
rven
tion
and/
or T
echn
olog
yCl
assifi
catio
nRe
leva
nce
Cent
ral a
nd
Sout
hern
Pu
njab
Cons
truct
ing n
ew ir
rigat
ion
infra
stru
ctur
e; re
habi
litat
ion
and
sust
aina
bilit
y of t
he o
lder
syst
em; fl
ood
man
agem
ent t
hrou
gh c
apac
ity b
uild
ing
Reha
bilit
atio
n of
Low
er D
oab,
Pa
njna
d, T
rimm
u, a
nd S
ulei
man
ki
Barra
ges –
raisi
ng c
anal
ban
ks fo
r flo
od sa
fety
Irrig
atio
n re
form
s by
form
ing f
arm
ers’
orga
niza
tions
for
capa
city
bui
ldin
g
Ada
ptat
ion
Med
ium
re
leva
nce
(55%
)H
igh
Non
e
Com
men
ts: C
limat
e Ch
ange
Risk
Ass
essm
ent—
Poor
mai
nten
ance
of i
rriga
tion
infra
stru
ctur
e an
d cl
imat
ic e
xtre
mes
are
put
ting e
xtra
stre
ss o
n th
ese
stru
ctur
es. T
his r
egio
n is
also
pro
ne to
ext
rem
e m
onso
on fl
oods
and
som
e of
the
barra
ges i
n th
e ar
ea w
ere
at th
e cr
itica
l sta
ge o
f nea
r col
laps
e du
ring t
he
supe
r floo
ds o
f 201
0. B
ut, r
ehab
ilitat
ion
and
impr
ovem
ent o
f the
se b
arra
ges a
nd o
ther
infra
stru
ctur
es (p
art o
f AD
B’s p
rogr
am) c
an b
e at
risk
bec
ause
bot
h th
e cu
rrent
clim
ate
data
tren
ds a
nd p
roje
cted
futu
re d
ata
indi
cate
incr
ease
in c
limat
ic e
xtre
mes
in th
e ar
ea d
ue to
clim
ate
chan
ge a
nd va
riabi
lity.
Det
aile
d ris
k and
vuln
erab
ility a
sses
smen
t nee
d to
be
unde
rtake
n be
fore
com
men
cing
such
infra
stru
ctur
e pr
ojec
ts in
the
area
.
Subm
ount
ain
(Isla
mab
ad,
Nor
th P
unja
b)
Cons
truct
ion
and
reha
bilit
atio
n of
irr
igat
ion
infra
stru
ctur
e an
d w
ater
re
sour
ces,
effici
ent o
n-fa
rm w
ater
m
anag
emen
t, di
vers
ifica
tion
of
inte
rven
tions
, soi
l con
serv
atio
n,
food
secu
rity t
hrou
gh h
ortic
ultu
re
and
aqua
cultu
re; e
nhan
ced
mar
ket
conn
ectiv
ity
Barra
ge (K
hank
i) co
nstru
ctio
n,
mic
ro-ir
rigat
ion
syst
em (d
rip
and
sprin
kler
), sh
ift to
hig
h va
lue
crop
s, sa
nd d
une
stab
ilizat
ion
and
alte
rnat
ive
ener
gy so
urce
(bio
gas
plan
t), m
icro
cred
it lo
an sc
hem
es
with
hig
h ge
nder
focu
s, fis
h ha
tchi
ng b
y usin
g bar
ren
land
s
Ada
ptat
ion
Med
ium
re
leva
nce
(70%
)Lo
w
Low
miti
gatio
n op
portu
nity
th
roug
h us
e of
bi
ogas
fuel
syst
em
by th
e lo
cal
com
mun
ities
Wes
tern
H
ighl
ands
(K
hybe
r Pa
khtu
nkhw
a an
d Fe
dera
lly
Adm
inist
ered
Tr
ibal
Are
as
[FAT
As]
)
Due
to a
quife
r dep
letio
n, sh
ift fr
om
grou
ndw
ater
to su
rface
wat
er re
sour
ce
deve
lopm
ent f
or ir
rigat
ed a
gric
ultu
re;
use
of w
ater
shed
man
agem
ent a
nd
com
man
d ar
ea d
evel
opm
ent a
ppro
ache
s an
d al
so b
ringi
ng n
ew la
nd u
nder
irr
igat
ion
Cons
truct
ion
of c
oncr
ete
grav
ity
dam
s, d
iver
sion
wei
rs, m
ain
and
seco
ndar
y irri
gatio
n ch
anne
ls;
lined
wat
er c
ours
es, t
erra
cing
, and
la
nd le
velin
g; in
stal
latio
n of
rain
an
d st
ream
gaug
es to
mea
sure
w
ater
avai
labi
lity;
affor
esta
tion
of d
egra
ded
wat
ersh
ed a
rea
and
co
nstru
ctio
n of
che
ck d
ams
Ada
ptat
ion
and
Miti
gatio
n
Med
ium
to
hig
h re
leva
nce
(55
to 7
5%)
Low
Hig
h m
itiga
tion
oppo
rtuni
ty-
thro
ugh
affor
esta
tion
in
the
44 w
ater
shed
ar
eas o
f FAT
A
cont
inue
d on
nex
t pag
e

73ADB Initiatives in Pakistan and their Exposure to Climate Change Risks
Agr
icul
ture
, Nat
ural
Res
ourc
es, a
nd R
ural
Dev
elop
men
t Sec
tor (
Incl
udin
g Su
bsec
tor o
f Wat
er)
Regi
ons
AD
B In
itiat
ives
A
DB
Initi
ativ
es C
limat
e Ch
ange
Cl
assifi
catio
n an
d Re
leva
ncea
Prel
imin
ary
Clim
ate
Chan
ge
Risk
Sy
nerg
ies w
ith
Miti
gatio
n F
ocus
Inte
rven
tion
and/
or T
echn
olog
yCl
assifi
catio
nRe
leva
nce
Low
er In
dus
Plai
n (S
indh
)
Impr
oved
avai
labi
lity a
nd p
rodu
ctivi
ty o
f wa
ter r
esou
rces
thro
ugh
reha
bilit
atio
n an
d up
grad
atio
n of
the
Lowe
r Ind
us B
asin
in
Sin
dh (L
IBS)
and
thos
e ou
tsid
e LI
BS;
pove
rty re
duct
ion
in th
e m
argin
alize
d se
gmen
t of p
opul
atio
n
Dev
elop
men
t of s
mal
l to
med
ium
-size
dam
s out
side
the
LIBS
; par
ticip
ator
y dev
elop
men
t m
icro
cred
it sy
stem
Ada
ptat
ion
Med
ium
re
leva
nce
(70%
)N
one
Non
e
Balo
chist
an
Plat
eau
(Eas
t an
d W
est)
Usin
g riv
er b
asin
man
agem
ent a
ppro
ach
for w
ater
har
vest
ing a
nd c
onse
rvat
ion;
re
habi
litat
ion
of ir
rigat
ion
infra
stru
ctur
e,
effici
ent i
rriga
tion
syst
em; in
stitu
tiona
l ca
paci
ty b
uild
ing o
f gov
ernm
ent a
nd
loca
l com
mun
ities
Cons
truct
ion
of n
ew sm
all d
ams,
impr
ovin
g spa
te ir
rigat
ion
syst
em,
Kare
zes,
wat
er c
anal
s, an
d dr
ains
; ca
paci
ty b
uild
ing o
f the
loca
l co
mm
uniti
es a
nd go
vern
men
t de
partm
ents
incl
udin
g irri
gatio
n an
d po
wer
, and
coo
pera
tive
; de
velo
pmen
t of s
atel
lite-
base
d w
ater
info
rmat
ion
syst
em m
akin
g w
ater
bal
ance
stud
ies a
vaila
ble
at th
e riv
er b
asin
leve
l; clim
ate
chan
ge ri
sk a
sses
smen
t stu
dy
Ada
ptat
ion
Med
ium
re
leva
nce
Hig
hN
one
Com
men
ts: C
limat
e Ch
ange
Risk
Ass
essm
ent—
This
area
is a
rid a
nd h
yper
-arid
with
scan
ty a
nd va
riabl
e ra
infa
ll, an
d at
tim
es e
xper
ienc
es fl
ash
flood
s. Bo
th p
ast c
limat
e da
ta tr
ends
and
futu
re c
limat
e pr
ojec
tions
sugg
est e
rratic
beh
avio
r of c
limat
ic e
xtre
mes
in th
is ar
id a
rea.
Hen
ce, t
he a
chie
vem
ents
of t
he
prog
ram
obj
ectiv
e in
cha
ngin
g clim
ate
can
be a
cha
lleng
ing t
ask.
Det
aile
d cl
imat
e ch
ange
risk
ass
essm
ents
nee
d to
be
unde
rtake
n be
fore
em
brac
ing h
igh
inve
stm
ent f
eedi
ng in
frast
ruct
ure
proj
ects
such
as d
am c
onst
ruct
ion.
Coas
tal A
reas
(B
aloc
hist
an
and
Sind
h)
Form
ulat
ion
of in
tegr
ated
coa
stal
zo
ne m
anag
emen
t pla
ns a
nd c
ode
of
cond
uct f
or m
arin
e an
d in
land
fish
ing;
man
grov
e fo
rest
reha
bilit
atio
n an
d re
stor
atio
n; in
com
e di
vers
ifica
tion;
co
mm
unity
-frie
ndly
cre
dit a
nd sa
ving
sc
hem
e re
plac
ing t
he m
ore
“exp
loita
tive”
in
form
al o
nes
Coas
tal z
one
man
agem
ent
stra
tegi
es, p
lans
and
rule
of
con
duct
; affo
rest
atio
n of
m
angr
oves
; aqu
acul
ture
Ada
ptat
ion
and
Miti
gatio
nH
igh
rele
vanc
eLo
w
Hig
h m
itiga
tion
oppo
rtuni
ty
thro
ugh
man
grov
e re
fore
stat
ion
Gre
ater
H
imal
ayas
No
signi
fican
t clim
ate
chan
ge-r
elev
ant i
nitia
tives
not
ed fo
r thi
s reg
ion
in th
e cu
rrent
and
pro
pose
d A
DB
inve
stm
ent s
chem
es
Tabl
e 18.
cont
inue
d

74 Climate Change Profile of Pakistan
Ener
gy S
ecto
r
Regi
ons
AD
B In
itiat
ives
Cl
imat
e Ch
ange
Rel
evan
ceCl
imat
e Ch
ange
(CC
) Ri
skSy
nerg
ies W
ith M
itiga
tion
Focu
s and
/or I
nter
vent
ion
Clas
sifica
tion
Rele
vanc
e
Coun
tryw
ide
proj
ects
Focu
s on
win
d an
d ot
her r
enew
able
sour
ces o
f ene
rgy t
hat i
ndep
ende
nt p
ower
pro
duce
rs (I
PPs)
can
ope
rate
, and
thus
fost
er p
rivat
e se
ctor
in
vest
men
t in
this
ener
gy su
bsec
tor o
f; su
stai
nabl
e en
ergy
effi
cien
cy d
evel
opm
ent p
rogr
ams t
hat p
ut fo
rth re
form
stra
tegy
for m
ains
tream
ing
the
ener
gy e
ffici
ency
in n
atio
nal p
lann
ing a
nd p
ublic
inve
stm
ent p
roce
dure
s and
very
likel
y to
trans
form
the
clea
n en
ergy
mar
ket t
hrou
gh
desig
ning
and
app
licat
ion
of su
stai
nabl
e bu
sines
s mod
els.
Cent
ral a
nd S
outh
ern
Punj
abLo
w-h
ead,
hig
h-vo
lum
e sm
all h
ydro
pow
er
stat
ion
that
can
be in
stal
led
in th
e ex
istin
g irr
igat
ion
cana
l sys
tem
with
per
enni
al w
ater
flo
ws
Miti
gatio
nH
igh
rele
vanc
e (8
0%)
Non
eH
igh
miti
gatio
n op
portu
nity
thro
ugh
smal
l hy
drop
ower
uni
tsSu
bmou
ntai
n (I
slam
abad
, Nor
th
Punj
ab)
Wes
tern
Hig
hlan
ds
(Khy
ber P
akht
unkh
wa
and
Fede
rally
A
dmin
ister
ed T
ribal
A
reas
[FAT
As]
)
Smal
l hyd
ropo
wer
from
per
enni
al h
igh-
head
rive
rsM
itiga
tion
Hig
h re
leva
nce
(80%
)N
one
Hig
h m
itiga
tion
oppo
rtuni
ty th
roug
h sm
all
hydr
opow
er u
nits
Low
er In
dus P
lain
(S
indh
)
Cons
truct
ion
of n
ew h
ydro
pow
er u
nits
(HPU
)—G
ulpu
r HPU
; div
ersifi
catio
n fro
m im
porte
d fu
el
oil a
way
to a
new
coa
l-fire
d un
its (e
.g., J
amsh
oro
Pow
er G
ener
atio
n U
nit)
Miti
gatio
n
Hig
h re
leva
nce
(80%
) to
hydr
opow
er
initi
ativ
es
Non
e
Hig
h m
itiga
tion
oppo
rtuni
ty th
roug
h G
ulpu
r hyd
ropo
wer
uni
t, w
hich
may
be
bala
nced
out
by
new
coa
l-fire
d un
it at
Ja
msh
oro
Balo
chist
an P
late
au
(Eas
t and
Wes
t)
Cons
truct
ion
and
oper
atio
n of
con
vent
iona
l en
ergy
uni
ts u
sing n
atur
al ga
s res
ervo
ir of
the
Prov
ince
at U
chM
itiga
tion
Low
rele
vanc
eN
one
Low
miti
gatio
n op
portu
nity
th
roug
h op
erat
ion
of
conv
entio
nal e
nerg
y uni
t on
nat
ural
gas i
nste
ad o
f oil
Tabl
e 18.
cont
inue
d
cont
inue
d on
nex
t pag
e

75ADB Initiatives in Pakistan and their Exposure to Climate Change Risks
Ener
gy S
ecto
r
Regi
ons
AD
B In
itiat
ives
Cl
imat
e Ch
ange
Rel
evan
ceCl
imat
e Ch
ange
(CC
) Ri
skSy
nerg
ies W
ith M
itiga
tion
Focu
s and
/or I
nter
vent
ion
Clas
sifica
tion
Rele
vanc
e
Coas
tal A
reas
(B
aloc
hist
an a
nd S
indh
)
Cons
truct
ion
and
oper
atio
n of
lique
fied
natu
ral
gas r
egas
ifica
tion
proj
ect,
win
d en
ergy
uni
tsM
itiga
tion
Med
ium
to h
igh
rele
vanc
e(5
0% to
80%
)H
igh
Hig
h m
itiga
tion
oppo
rtuni
ty th
roug
h w
ind
ener
gy u
nits
, and
med
ium
th
roug
h na
tura
l gas
av
aila
bilit
y
Clim
ate
Chan
ge R
isk A
sses
smen
t – T
he c
oast
al a
rea
of S
indh
, loca
tion
of th
e LN
G re
gasifi
catio
n an
d w
ind
pow
er p
roje
cts,
are
occa
siona
lly
impa
cted
from
trop
ical
cyc
lone
s whi
ch a
re p
roje
cted
to in
crea
se in
freq
uenc
y and
inte
nsity
in th
e fu
ture
cha
ngin
g clim
ate.
Hen
ce, t
hese
in
frast
ruct
ures
pro
ject
s nee
d to
be
clim
ate-
resil
ient
.
Gre
ater
Him
alay
aH
ydro
pow
er p
lant
s in
Chila
s and
Ska
rdu
Miti
gatio
nH
igh
rele
vanc
e (8
0%)
Low
Hig
h m
itiga
tion
oppo
rtuni
ty th
roug
h hy
drop
ower
pla
nts
Not
e: A
DB
initi
ativ
es c
limat
e ch
ange
cla
ssifi
catio
n an
d re
leva
nce
is ba
sed
on th
e ta
ble
give
n in
App
endi
x 6.
Sour
ce: A
DB.
Tabl
e 18.
cont
inue
d

76 Climate Change Profile of Pakistan
Tran
spor
t and
Urb
an In
fras
truc
ture
Ser
vice
s Sec
tor
Regi
ons
AD
B In
itiat
ives
Cl
imat
e Ch
ange
Rel
evan
ceCl
imat
e Ch
ange
(CC
) Ri
sk to
AD
B In
vest
men
tSy
nerg
ies W
ith M
itiga
tion
Focu
sIn
terv
entio
n an
d/or
Te
chno
logy
Clas
sifica
tion
Rele
vanc
e
Coun
tryw
ide
proj
ects
Floo
d em
erge
ncy r
econ
stru
ctio
n pr
ogra
ms;
natio
nal h
ighw
ays i
mpr
ovem
ent a
nd re
habi
litat
ion
prog
ram
s aim
ed a
t roa
d se
ctor
effi
cien
cy: s
uppo
rt re
gion
al c
oope
ratio
n by
rem
ovin
g or r
elax
ing i
nstit
utio
nal, p
hysic
al, a
nd o
ther
bar
riers
and
cap
acity
bui
ldin
g of t
he N
atio
nal H
ighw
ay A
utho
rity
(NH
A)
Cent
ral a
nd
Sout
hern
Pun
jab
Nat
iona
l Tra
de C
orrid
or
Hig
hway
dev
elop
men
t; Pu
njab
In
term
edia
te C
ities
Impr
ovem
ent
prog
ram
Inte
grat
ed u
rban
pla
nnin
g; im
prov
ed u
rban
infra
stru
ctur
e;
stre
ngth
enin
g bus
ines
s pr
oces
ses o
f urb
an u
tiliti
es;
impr
oved
inst
itutio
nal
fram
ewor
k for
urb
an se
rvic
es
at th
e ci
ty le
vel
Ada
ptat
ion
Mar
gina
l re
leva
nce
(15%
)H
igh
Low
miti
gatio
n op
portu
nity
th
roug
h th
e N
atio
nal T
rade
Co
rrido
r
Subm
ount
ain
(Isla
mab
ad, N
orth
Pu
njab
)Co
mm
ents
: Clim
ate
Chan
ge R
isk A
sses
smen
t – T
his r
egio
n is
pron
e to
ext
rem
e m
onso
on fl
ash
flood
s. Th
e N
atio
nal T
rade
Cor
ridor
Hig
hway
de
velo
pmen
t and
Pun
jab
Inte
rmed
iate
Citi
es Im
prov
emen
t pro
ject
s are
par
t of A
DB
prog
ram
s tha
t can
be
at ri
sk b
ecau
se b
oth
the
curre
nt c
limat
e da
ta tr
ends
and
pro
ject
ed fu
ture
dat
a in
dica
te in
crea
ses i
n cl
imat
ic e
xtre
mes
in th
e ar
ea d
ue to
clim
ate
chan
ge a
nd va
riabi
lity.
A d
etai
led
risk a
nd
vuln
erab
ility a
sses
smen
t is w
arra
nted
.
Wes
tern
H
ighl
ands
(Khy
ber
Pakh
tunk
hwa
and
Fede
rally
A
dmin
ister
ed
Trib
al A
reas
[F
ATA
s]))
Mas
s Tra
nsit
Tran
spor
t Sys
tem
fo
r the
City
of P
esha
war
; N
atio
nal T
rade
Cor
ridor
Hig
hway
de
velo
pmen
t to
impr
ove
subr
egio
nal c
onne
ctiv
ity w
ithin
Pa
kist
an, a
nd to
Peo
ple’s
Rep
ublic
of
Chi
na, A
fgha
nist
an, a
nd o
ther
Ce
ntra
l Asia
cou
ntrie
s
Polic
y ref
orm
and
inst
itutio
nal
deve
lopm
ent f
or im
prov
ing
the
effici
ency
of m
ass t
rans
it sy
stem
by e
stab
lishi
ng th
e Si
ndh
Mas
s Tra
nsit
com
pany
); in
frast
ruct
ure
expa
nsio
n in
clud
ing c
onst
ruct
ion
of
bus t
erm
inal
s, de
pots
, acc
ess
road
s, pa
rkin
g are
as w
ith st
reet
lig
hts,
and
drai
nage
syst
em;
capa
city
bui
ldin
g of t
he
impl
emen
ting a
genc
y; ur
ban
deve
lopm
ent s
trate
gies
for t
he
met
ro b
us c
orrid
or
Ada
ptat
ion
and
miti
gatio
n
Mar
gina
l re
leva
nce
(15%
).Lo
w to
hig
h
Low
miti
gatio
n op
portu
nity
- th
roug
h Pe
shaw
ar
Mas
s Tra
nspo
rt Sy
stem
an
d th
roug
h N
atio
nal
Trad
e Co
rrido
r Hig
hway
de
velo
pmen
t.
Tabl
e 18.
cont
inue
d
cont
inue
d on
nex
t pag
e

77ADB Initiatives in Pakistan and their Exposure to Climate Change Risks
Tran
spor
t and
Urb
an In
fras
truc
ture
Ser
vice
s Sec
tor
Regi
ons
AD
B In
itiat
ives
Cl
imat
e Ch
ange
Rel
evan
ceCl
imat
e Ch
ange
(CC
) Ri
sk to
AD
B In
vest
men
tSy
nerg
ies W
ith M
itiga
tion
Focu
sIn
terv
entio
n an
d/or
Te
chno
logy
Clas
sifica
tion
Rele
vanc
e
Com
men
ts: C
limat
e Ch
ange
Risk
Ass
essm
ent –
Thi
s is a
n ar
id a
rea
and
with
a la
rge
part
of m
ount
aino
us te
rrain
. Mos
tly it
rece
ives
rain
fall f
rom
the
wes
tern
wea
ther
syst
ems a
nd m
onso
on ra
rely
pen
etra
tes t
hat d
ip. B
ut w
ith c
limat
e ch
ange
, the
mon
soon
is sh
iftin
g wes
t to
thes
e ar
eas.
Hen
ce, f
resh
ris
k ass
essm
ents
of t
hese
wes
tern
are
as n
eed
to b
e un
derta
ken
befo
re th
e N
atio
nal T
rade
Cor
ridor
Hig
hway
dev
elop
men
t and
Mas
s Tra
nsit
Syst
em
for P
esha
war
pro
ject
s are
impl
emen
ted.
It is
good
that
AD
B Pr
ojec
t Tra
nche
-3 h
as a
lread
y con
sider
ed c
limat
e ch
ange
risk
s to
the
proj
ect d
esig
n.
Low
er In
dus P
lain
(S
indh
)
Prov
inci
al ro
ad im
prov
emen
t pr
ogra
ms;
Sind
h ci
ties
Impr
ovem
ent p
rogr
ams
Capa
city
bui
ldin
g of t
he
rele
vant
gove
rnm
ent
depa
rtmen
ts b
y sta
ff tra
inin
g; im
prov
ing q
ualit
y, co
ntin
uity
, an
d co
vera
ge o
f urb
an
infra
stru
ctur
e se
rvic
es in
wat
er
supp
ly, w
aste
wat
er, a
nd st
orm
w
ater
; pro
vidi
ng in
cent
ives
an
d su
ppor
ting e
ffect
ive
man
agem
ent a
nd su
stai
nabl
e fin
anci
ng o
f urb
an se
rvic
e pr
ovid
ers
Ada
ptat
ion
and
Miti
gatio
n
Mar
gina
l re
leva
nce
(15%
). Cl
imat
e ch
ange
ris
ks w
ere
cons
ider
ed in
th
e de
sign
of
the
tranc
he 3
pr
ojec
t
Low
Low
miti
gatio
n op
portu
nity
th
roug
h w
aste
wat
er a
nd
solid
was
te m
anag
emen
t ac
tiviti
es
Balo
chist
an
Plat
eau
(Eas
t and
W
est)
Nat
iona
l hig
hway
dev
elop
men
t fo
r enh
ance
d in
terp
rovi
ncia
l co
nnec
tivity
and
mov
emen
t
Ada
ptat
ion
and
miti
gatio
n
Mar
gina
l re
leva
nce
(15%
).Lo
wN
one
Tabl
e 18.
cont
inue
d
cont
inue
d on
nex
t pag
e

78 Climate Change Profile of Pakistan
Tran
spor
t and
Urb
an In
fras
truc
ture
Ser
vice
s Sec
tor
Regi
ons
AD
B In
itiat
ives
Cl
imat
e Ch
ange
Rel
evan
ceCl
imat
e Ch
ange
(CC
) Ri
sk to
AD
B In
vest
men
tSy
nerg
ies W
ith M
itiga
tion
Focu
sIn
terv
entio
n an
d/or
Te
chno
logy
Clas
sifica
tion
Rele
vanc
e
Coas
tal A
reas
(B
aloc
hist
an a
nd
Sind
h)
Mas
s Tra
nsit
Tran
spor
t Sys
tem
for
the
city
of K
arac
hi
(i) P
olic
y ref
orm
and
in
stitu
tiona
l dev
elop
men
t (li
ke e
stab
lishi
ng S
indh
M
ass T
rans
it co
mpa
ny);
(ii) I
nfra
stru
ctur
e bu
ildin
g in
clud
ing t
erm
inal
, dep
ot,
acce
ss ro
ad, p
arki
ng a
rea,
st
reet
light
, dra
inag
e sy
stem
; (ii
i) ca
paci
ty b
uild
ing o
f im
plem
entin
g age
ncy,
polic
y fo
rce,
(iv)
. impl
emen
t urb
an
deve
lopm
ent s
trate
gy a
long
bu
s cor
ridor
Miti
gatio
nM
argi
nal
rele
vanc
eLo
wLo
w m
itiga
tion
oppo
rtuni
ty
thro
ugh
Kara
chi M
ass
Tran
spor
t Sys
tem
Gre
ater
Him
alay
as
Nat
iona
l hig
hway
dev
elop
men
t, es
peci
ally
Kar
akor
um H
ighw
ay
to im
prov
e co
nnec
tivity
with
the
Peop
le’s
Repu
blic
of C
hina
A
dapt
atio
nM
argi
nal
rele
vanc
e (2
0%)
Hig
hN
one
Not
e: A
DB
initi
ativ
es c
limat
e ch
ange
cla
ssifi
catio
n an
d re
leva
nce
is ba
sed
on th
e ta
ble
give
n in
App
endi
x 6.
Sour
ce: C
reat
ed b
y the
aut
hor f
or th
is re
port
from
the
proj
ect d
atab
ase
of A
DB
for P
akist
an.
Tabl
e 18.
cont
inue
d

79ADB Initiatives in Pakistan and their Exposure to Climate Change Risks
D. Risk Summary by Sector and SubregionBased on the preceding assessment, broad-level climate risks of the three sectors and seven subregions are consolidated in Table 19. This table highlights the heterogeneity of risks both across and within sectors and regions, and indicates the importance of context-specific climate risk and vulnerability assessments. However, it should be noted that these reflect only the screening of the selected ADB projects and their component activities, rather than a broader assessment of the sector and region.
Table 19: Consolidated Results of Screening of Selected ADB Projects by Region and Sector
RegionRisk Screening Classification
Low or No Risk Medium Risk High RiskAgriculture and Water SectorsI(a): Greater Himalayas
I(b): Submountain
II: Western Highlands
III: Central and Southern Punjab
IV: Lower Indus Plains
V: Balochistan Plateau
VI: Coastal Areas
Energy SectorI(a): Greater Himalayas
I(b): Submountain
II: Western Highlands
III: Central and Southern Punjab
IV: Lower Indus Plains
V: Balochistan Plateau
VI: Coastal Areas
Transport and Urban Infrastructure Services SectorI(a): Greater Himalayas
I(b): Submountain
II: Western Highlands
III: Central and Southern Punjab
IV: Lower Indus Plains
V: Balochistan Plateau
VI: Coastal Areas low or no climate risk, medium climate risk, and high climate risk.Source: ADB.

80
Additional Suggested Readings
Climate Modeling and Scenarios:
B. Ahmad et al. n.d. Regional Comparison between Global Circulation Model GCM20 and Regional Climate Model PRECIS. Pakistan Journal of Meteorology. 11 (21).
P. Lucas-Picher et al. 2011. Can Regional Climate Models Represent the Indian Monsoon? Journal of Hydrometeorology. 12. pp. 849–868.
F. S. Saeed et al. 2012. Influence of Mid-latitudinal Circulation on Upper Indus Basin Precipitation: The Explicit Role of Irrigation. Climate Dynamics. 40 (1–2).
M. M. Sheikh et al. 2014. Trends in extreme daily rainfall and temperature indices over South Asia. International Journal of Climatology.
U. L. Siraj et al. 2009. Assessment of Future Changes in Temperature Related Extreme Indices Over Pakistan Using Regional Model PRECIS.
Water Resources and Agriculture:
M. Akhtar, N. Ahmad, and M.J. Booij. 2008. The Impact of Climate Change on the Water Resources of Hindukush–Karakorum–Himalaya Region Under Different Glacier Coverage Scenarios. Journal of Hydrology. 355. pp. 148–163.
K. Firdos et al. 2014. Climate Variability and its Impacts on Water Resources in Upper Indus Basin under IPCC Climate Change Scenarios. International Journal of Global Warming. http://www.inderscience.com/info/ingeneral/forthcoming.php?jcode=ijgw
Food and Agriculture Organization of the United Nations. 2013. Tackling Climate Change Through Livestock. Rome: FAO. http://www.fao.org/docrep/018/i3437e/i3437e.pdf
M. M. Iqbal, M.A. Goheer, and A.M. Khan. 2011. Impacts of Climate Change on Agriculture and Food Security in the HKH Region. Background Paper prepared for ICIMOD, Nepal for their Synthesis Report on “HKH Regional Climate Change.”
S. A. Qureshi et al. 2010. Challenges and Prospects of Sustainable Groundwater Management in the Indus Basin, Pakistan. Water Resources Management. 24. pp. 1551–1569.
World Health Organization (WHO). 2008. Climate Change and Health. Report by the Secretariat. World Health Organization: EB 124/11. 20 November.

81Additional Suggested Readings
World Meteorological Organization and World Health Organization. 2015. Heat Waves and Health: Guidance on Warning-System Development. Report No. 1142.
T. Zhu et al. 2013. Climate Change Impacts and Adaptation Options for Water and Food in Pakistan: Scenario Analysis using an Integrated Global Water and Food Projections Model. Water International. 38 (5). pp. 651–669.
Energy Sector
ADB. 2012. Climate Risk and Adaptation in the Electric Power Sector. http://www.adb.org/sites/default/files/publication/29889/climate-risks-adaptation-power-sector.pdf
Intergovernmental Panel on Climate Change (IPCC). 2014. Climate Change: Implications for the Energy Sector. http://www.worldenergy.org/wp-content/uploads/2014/06/Climate-Change-Implications-for-the-Energy-Sector-Summary-from-IPCC-AR5-2014-Full-report.pdf
Adaptation Technologies
ADB. 2014. Technologies to Support Climate Change Adaptation. Manila. http://www.adb.org/sites/default/files/publicatio/149400/technologies-climate-change-adaptation.pdf
Ministry of Climate Change, Government of Pakistan. 2016. Technology Needs Assessment for Climate Change Adaptation. Islamabad, Pakistan.
United Nations Framework Convention on Climate Change (UNFCCC). 2006: Technologies for Adaptation to Climate Change. Climate Change Secretariat of UNFCCC. Bonn. http://unfccc.int/resource/docs/publications/tech_for_adaptation_06.pdf

82
References
S. Ahmad. 2009. Water Resources and Management in Pakistan – Challenges and Future Vision. Paper presented in the course on Integrated Water Resources Management at the National University of Agricultural Sciences, NARC, Islamabad, Pakistan.
____. n.d. Water Resources of Pakistan and Strategy for Climate Change Adaptations. Islamabad: Pakistan Agricultural Research Council.
S. Ahmad, M. Islam, and S. N. Mirza. 2012. Rangeland Degradation and Management Approaches in Balochistan, Pakistan. Pakistan Journal of Botany. 44. pp.127–136.
S. Ahmad and F. V. Steenberger. 2007. The Potential for the Development of Spate Irrigation System in Pakistan. Practical Notes 1. Spate Irrigation Network.
A. Ahmed, I. Henna, and G. M. Chaudhry. 2007. Water Resources and Conservation Strategy of Pakistan. The Pakistan Development Review. 46 (4). Part II. Islamabad.
A. Ahmed and S. Suphachalasai. 2014. Assessing the Cost of Climate Change and Adaptation in South Asia. Manila: ADB.
I. Ahsan and S. A. Khuwaja. 2013. Development of Environmental Laws and Jurisprudence in Pakistan. Manila: ADB.
M. Akhtar, N. Ahmad, and M. J. Booij. 2008. The Impact of Climate Change on the Water Resources of Hindukush–Karakorum–Himalaya Region Under Different Glacier Coverage Scenarios. Journal of Hydrology. 355 (1–4). pp. 48–163.
A. Ali. 2013. Indus Basin Floods: Mechanism, Impacts and Management. Manila: ADB.
B. F. Anjum, H. K. Azmat, and M. Hazrat. 2005. Climate Change Perspective in Pakistan. Pakistan Journal of Meteorology. 2 (2). pp. 11–21.
F. Anwar. 2012. Karachi City Climate Change – Adaptation Strategy Road Map. Shehri-Citizen for a Better Environment. Karachi. http://www.preventionweb.net/files/27915_100286295karachicityclimatechangead.pdf
Asian Development Bank (ADB). 2014. Technologies to Support Climate Change Adaptation. Manila.
____. 2015. Country Operation Business Plan, Pakistan, 2015–2017. Manila. http://www.adb.org/documents/pakistan-country-operations-business-plan-2015-2017

83References
____. 2014 Fact Sheet for Pakistan. http://www.adb.org/sites/default/files/publication/27786/pak.pdf.
S. Bhatt et al. 2013. The Global Distribution and Burden of Dengue. Nature. 496 (7446). pp. 504–507.
W. C. Cam. 2012. Climate Change Mitigation – Building Sector. Roskilde: UNEP Centre on Energy, Climate, and Sustainable Development.
Q. Z. Chaudhry et al. 2009. Climate Change Indicators of Pakistan, Pakistan. Meteorological Department Technical Report No. PMD 22/2009, Islamabad.
Q. Z. Chaudhry et al. 2015. Karachi Heat Wave June 2015. Islamabad: Ministry of Climate Change, Pakistan.
L. A. Christiansen, L. Olhoff, and S. Traerup. 2011. Technologies for Adaptation: Perspectives and Practical Experiences. Roskilde: United Nations Environment Programme Risø Centre on Energy, Climate and Sustainable Development. http://www.unep.org/pdf/TechnologiesAdaptation_PerspectivesExperiences.pdf
R. Clements et al. 2011. Climate Change Adaptation – Agriculture Sector. Roskilde: UNEP Risø Centre.
Climate Policy Initiative (CPI). 2014. Global Landscape of Climate Finance. http://climatepolicyinitiative.org/publication/global-landscape-of-climate-finance-2014/
A. Dehlavi et al. 2015. Climate Change Adaptation in Indus Ecoregion: A Micro-Econometric Study of the Determinants, Impacts, and Cost Effectiveness of Adaptation Strategies. Karachi: WWF Pakistan.
M. Elliott et al. 2011. Technologies for Climate Change Adaptation – Water Sector. Roskilde: UNEP Risø Centre.
J. P. Ericson et al. 2006. Effective Sea Level Rise and Deltas: Causes of Change and Human Dimension Implication. Global and Planetary Change. 50. pp. 63–82.
C. B. Field et al. eds. 2014. Climate Change 2014: Impacts, Adaptation and Vulnerability Part A: Global and Sector Aspect. Contributions of the Working Group II to Fifth Assessment Report of the IPCC. Cambridge, UK and New York: Cambridge University Press.
P. J. Gerber et al. 2013. Tackling Climate Change Through Livestock – A Global Assessment of Emissions and Mitigation Opportunities. Rome: Food and Agriculture Organization of the United Nations (FAO).
A. K. Githeko et al. 2000. Climate Change and Vector-Borne Diseases: A Regional Analysis. Bulletin of the World Health Organization. 78 (9). pp. 1136–1147.
Global Facility for Disaster Reduction and Recovery (GFDRR). 2011. Climate Change Risk and Adaptation Profile of Pakistan. Washington DC: World Bank.

84 References
Government of Pakistan. 2012. National Climate Change Policy. Islamabad.
Government of Pakistan, Bureau of Statistics. 2011. Agricultural Statistics of Pakistan 2010–11. Islamabad.
Government of Pakistan, Ministry of Climate Change. 2014. Work Program for Climate Change Adaptation and Mitigation in Pakistan: Priority Actions. Islamabad.
Government of Pakistan, Ministry of Environment. 2003. Pakistan’s Initial National Communication on Climate Change. http://unfccc.int/resource/docs/natc/paknc1.pdf
Government of Pakistan, Ministry of Finance. 2013. Economic Survey 2013–2014. Islamabad.
Government of Pakistan, Ministry of Planning, Development and Reforms. 2010. Task Force Final Report on Climate Change. Islamabad. http://pc.gov.pk/usefull%20links/Taskforces/TFCC%20Final%20Report.pdf
Government of Pakistan, Ministry of Planning, Development and Reforms. Annual Plan 2014. Islamabad.
Government of Pakistan, Ministry of National Health Services, Regulations and Coordination. 2013. Pakistan 2012–2013 Demographic And Health Survey Report. National Institute of Population Survey (NIPS). Islamabad. http://www.nips.org.pk/abstract_files/PDHS%20Final%20Report%20as%20of%20Jan%2022-2014.pdf
Government of Pakistan, Ministry of Water and Power. 2011. Alternative and Renewable Energy Policy 2011. Islamabad.
Government of Pakistan, National Disaster Management Authority. Annual Report 2011. Islamabad. http://www.ndma.gov.pk/Documents/Annual%20Report/NDMA%20Annual%20Report%202011.pdf
M. Hanif, A. Z. Khan, and S. Adnan. 2013. Latitudinal Precipitation Characteristics and Trends in Pakistan. Journal of Hydrology. 492. pp. 266–272.
K. Hewitt. 2005. The Karakoram Anomaly? Glacier Expansion and the “Elevation Effect,” Karakoram Himalaya, Inner Asia. Mountain Research and Development: Special Issue – Climate Change in Mountains. 25 (4).
Y. Hijioka et al. eds.. Asia. In: Climate Change 2014: Impacts, Adaptation, and Vulnerability. IPCC Working Group II. Cambridge, United Kingdom and New York: Cambridge University Press. p. 1350.
W. W. Immerzeel, L. P. Van Beek, and M. F. P. Bierkens. 2010. Climate Change Will Affect the Asian Water Towers. Science. 328. pp. 1382–1385.
Intergovernmental Panel on Climate Change (IPCC). 2014. Climate Change 2014: Impacts, Adaptation, and Vulnerability. IPCC Working Group II Contribution to AR5. http://ipcc-wg2.gov/AR5/

85References
M. M. Iqbal, M. A. Goheer, and A. M. Khan. 2009. Climate Change Aspersions on Food Security in Pakistan. Science Vision. 15 (1). pp. 15–23.
D. H. Kazmi et al. 2014. Statistical Downscaling and Future Scenario Generation of Temperatures for Pakistan Region. Theoretical and Applied Climatology. 120 (1–2). pp. 341–350.
B. Khalid and A. Ghaffar. 2013. Dengue Transmission Based on Urban Environmental Gradients in Different Regions of Pakistan. International Journal of Biometeorology. 59 (3). http://www.researchgate.net/publication/262229060_Dengue_transmission_based_on_urban_environmental_gradients_in_different_cities_of_Pakistan
I. Khan and S. Munawar. 2011. Institutional Arrangement for Climate Change in Pakistan. SDPI Report Series 19. Islamabad.
M. A. A. Khan et al. 2011. Pakistan National Economics and Environmental Development Study (NEEDS). https://unfccc.int/files/adaptation/application/pdf/pakistanneeds.pdf
T. M. A. Khan and Rabbani. n.d. Sea Level Monitoring and Study of Sea Level Variations Along Pakistan Coast: A Component of Integrated Coastal Zone Management. Karachi: National Institute of Oceanography.
S. Kreft and D. Eckstein. 2013. Global Climate Risk Index 2014: Who Suffers Most from Extreme Weather Events? Weather Related Loss Events in 2012 and 1993 to 2012. Briefing Paper. German Watch. Bonn. https://germanwatch.org/en/download/8551.pdf
A. Kundi. 2011. Toothless Pakistan Environmental Protection Council. Pakistan Today. 6 March.
M. M. Linham and R. J. Nicholls. 2010. Technologies for Climate Change Adaptation - Coastal Erosion and Flooding. Roskilde: UNEP Risø Centre.
S. M. Malik, H. Awan, and N. U. Khan. 2010. A Study of the Effects of Climate Change on Human Health in Pakistan. Islamabad: Sightsavers. http://pk.sightsavers.org/in_depth/policy_and_research/15837_climatechange.pdf
K. A. Mir and M. Ijaz. 2015. Greenhouse Gas Emission Inventory of Pakistan for the Year 2011–2012. Islamabad: Global Change Impact Studies Centre (GCISC).
C. McSweeney, M. New, and G. Lizcano. 2008. UNDP Climate Change Country Profile. New York. http://ncsp.undp.org/sites/default/files/Pakistan.oxford.report.pdf
A. Naveed, and N. Ali. 2012. Clustered Deprivation: District Profile of Poverty in Pakistan. Islamabad: Sustainable Development Institute Publication.
National Institute of Population Studies (NIPS) and ICF International. 2013. Pakistan Demographic and Health Survey, 2012–2013. Islamabad, Pakistan and Maryland, USA: NIPS and ICF International.
Pakistan Meteorological Department. 2015: High Resolution Climate Scenarios. Islamabad. http://www.pmd.gov.pk/rnd/rndweb/rnd_new/climchange_ar5.php

86 References
R. R. Rabani et al. 2008. The Impact of Sea Level Rise on Pakistan’s Coastal Zone in a Climate Change Scenario. National Institute of Oceanography. Second International Maritime Conference, Bahria University, Karachi.
R. Rajbhandari et al. 2014. Projected Changes in Climate over the Indus River Basin Using a High Resolution Regional Climate Model (PRECIS), Climate Dynamics. 44 (1–2). pp. 339–357.
G. Rasul. 2011. An Analysis of Knowledge Gaps in Climate Change Research. Pakistan Journal of Meteorology Vol. 7, Issue 13. http://pmd.gov.pk/rnd/rnd_files/vol7_issue13/pdf
G. Rasul et al. 2012a. Climate Change in Pakistan: Focused on Sindh Province. Technical Report No. PMD-25/2012. Islamabad.
G. Rasul et al. 2012b. Vulnerability of the Indus Delta to Climate Change in Pakistan. Pakistan Journal of Meteorology. 18 (16).
G. Rasul et al. 2011. Effect of Temperature Rise on Crop Growth and Productivity. Pakistan Journal of Meteorology. 8 (15). Islamabad.
Save the Children. 2011. Psychological Assessment Report: Psychological Problems and Needs of Children in Flood Affected Areas in Pakistan. Pakistan.
K. M. Siddiqui, I. Mohammad, and M. Ayaz. 1999. Forest ecosystem climate change impact assessment and adaptation strategies for Pakistan. Climate Research. 12: 195–203. http://www.int-res.com/articles/cr/12/c012p195.pdf
P. Singh and L. Bengtsson. 2004. Hydrological Sensitivity of a Large Himalayan Basin to Climate Change. Hydrological Processes. 18 (13). pp. 2363–2385.
Sustainable Development Policy Institute. 2014. Natural Capital in the Context of Semi-Arid Regions of Pakistan. Islamabad. Unpublished.
J. P. M. SyvitskI et al. 2009. Sinking Delta Due to Human Activities. Nature Geoscience. Macmillan Publishers. doi:10.1038/ngeo629.
R. Tariq and G. R. Athar. n.d. Possible Impacts of Climate Change on Energy Sector of Pakistan. Pakistan Atomic Energy Commission. http://nijesr.iefr.edu.pk/journalFolder/6/8e6bd.pdf
The Global Economy. 2015. Country Ranking using Data on Carbon Dioxide Emissions. http://www.theglobaleconomy.com/rankings/Carbon_dioxide_emissions/. Accessed on 25 May 2015.
P.K. Thornton, R. B. Boone, J. Ramirez-Villegas. 2015. Climate Change Impacts on Livestock. CCAFS Working Paper No. 120. CGIAR Research Program on Climate Change, Agriculture and Food Security (CCAFS). Copenhagen. www.ccafs.cgiar.org
United Nations Development Programme (UNDP). 2015. Climate Public Expenditure and Institutional Review (CPEIR), Pakistan. Islamabad.

87References
____. 2008. Climate Change Country Profile: Pakistan. http://ncsp.undp.org/document/undp-climate-change-country-profile-pakistan
____. 2014. Sustaining Human Progress: Reducing Vulnerabilities and Building Resilience. Human Development Report. Islamabad.
United Nations Framework Convention on Climate Change (UNFCCC). 2005. Report on the Seminar on the Development and Transfer of Technologies for Adaptation to Climate Change: Note by the Secretariat. FCCC/SBSTA/2005/8.
Vivid Economics. 2013. Pakistan’s Climate Finance Architecture: A Review of Financial Fund or Facility for the Ministry of Climate Change, Government of Pakistan. Unpublished.
T. J. Wilbanks and S. Fernandez. 2013. Climate Change and Infrastructure, Urban Systems, and Vulnerabilities: Technical Report for the U.S. Department of Energy in Support of the National Climate Assessment. Island Press. https://scholar.google.com/citations?view_op=view_citation&hl=en&user=YpCTAm0AAAAJ&citation_for_view=YpCTAm0AAAAJ:isC4tDSrTZIC
World Wide Fund for Nature (WWF). n.d. Pakistan: Mangrove. Islamabad. http://www.wwf.org.pk/pdf/forest_mangrove_rcpakistan.pdf
WWF-Pakistan. 2012. Delta Wide Hazard Mapping – A Case Study of Keti Bundar, Kharo Chann, and Jiwani. Karachi, Pakistan: WWF. http://www.wwfpak.org/ccap/pdf/Hazard_Mapping.pdf. Accessed on 5 June 2015.
World Bank. 2014. Country Partnership Strategy for the Period FY 2015–2019. Washington, DC.
World Bank and Asian Development Bank. 2010. Pakistan Floods 2010: Preliminary Damage and Needs Assessment. Islamabad: Government of Pakistan. http://siteresources.worldbank.org/PAKISTANEXTN/Resources/293051-1264873659180/6750579-1291656195263/PakistanFloodsDNA_December2010.pdf
World Commission on Dams. 2000. Tarbela Dam and Related Aspects of the Indus River Basin in Pakistan. http://s3.amazonaws.com/zanran_storage/www.dams.org/ContentPages/1311315.pdf
M. Zahid, and R. Ghulam. 2011. Changing Trends of Thermal Extremes in Pakistan. Climatic Change.

88
Appendix 1: Clean Development Mechanism Projects of Pakistan
1. Catalytic Abatement of Nitrous Oxide, Tail Gas End Plant of the Pakarab Fertilizers, Multan2. Landhi Cattle Waste Management Project3. 84-megawatt (MW) New Bong Escape Hydropower Project4. Pakarab Fertiliser Cogeneration Power Project Version 025. Maple Leaf Cement Factory Generator Change Project, Iskanderabad, Daud Khel, Pakistan6. Fuel Switch and Energy Efficiency Project at Prosperity Weaving Mills7. Construction of Additional Cooling Tower at AES Lal Pir Muzaffar Garh, Pakistan 8. Almoiz Bagasse Cogeneration Project. Version 019. Fuel Switch to a Less Carbon-Intensive Fuel at SFS, Pakistan. Version 0110. Community-Based Renewable Energy Development in Northern Areas of Pakistan11. Gul Ahmed Combined Cycle Gas Turbine Project. Version 0112. Composting of Organic Content of Municipal Solid Waste in Lahore, Pakistan. Version 0113. Biogas-Based Cogeneration Project at Shakarganj Mills Ltd., Jhang, Pakistan. Version 0114. Installation of Natural Gas-Based Cogeneration System at Century Paper and Board Mills, Pakistan15. Waste Heat Recovery and Utilization Project at Cherat Cement Factory, Pakistan 16. D.G. Khan Cement Company Waste Heat Recovery and Utilization for 10.4 MW Power Generation DGKhan Plant17. Imperial Chemical Industries Polyester Co-Generation Project. Version 01
18. Waste Heat Recovery and Utilization for Power Generation at Maple Leaf Cement Factory, Iskanderabad, Pakistan. Version 01.
19. Reduction of Heavy Fuel Oil Usage for Power Generation at Lucky Cement, Pezu, Pakistan 20. Waste Heat Recovery-Based 15 MW Power Generation Project Bestway Cement, Chakwal, Pakistan 21. Grid Connected Combined Cycle Power Plant in Qadirpur Using Permeate Gas Previous Flared22. Waste Heat Recovery and Utilization for Power Generation at Lucky Cement Karachi 23. Waste Heat Recovery and Utilization for Power Generation at Lucky Cement, Pezu Plant, Pakistan
24. Installation of Energy Efficient Products and Technologies for Carbon Dioxide Emission Reduction Districts of Northern Pakistan
25. Installation of Energy Efficient Products and Technologies for Carbon Dioxide Emission Reduction in Chitral District of Northern Pakistan
26. Supply Side Energy Efficiency Improvements in Steam Generation at Ali Asghar Textile Mills Limited and Indus Dyeing And Manufacturing Company Limited
27. Dawood Hercules Chemicals Limited Gas Turbine-Based Cogeneration Project.28. Compost from Municipal Solid Waste in Peshawar, Pakistan29. Biomass Fuel Switch Project at Sapphire Finishing Mills, Pakistan30. Methane Avoidance Project at Colony Sugar Mills

89Clean Development Mechanism Projects of Pakistan
31. Pakistan Domestic Biogas Program – Program of Activities32. Substitution of Coal with Alternate Fuels at DG Khan Cement Company, Khairpur Plant33. 720 MW Karot Hydropower Project, Rawalpindi34. Waste Heat Recovery Clean Development Mechanism Project at Attock Cement Pakistan35. Waste Heat Recovery Power Plant at Fecto Cement36. Biomass-Based Energy Generation at Kohinoor Mills37. Biomass-Based Cogeneration Project for Madina Enterprise38. Fatima nitrous oxide Abatement Project39. The National CFL Project40. Wellbeinggreen CFL Programme for Pakistan41. Biomass Waste Energy Generation at Master Textile42. Sapphire 49.5 MW Wind Farm Project43. Biomass Base Cogeneration in Engro Foods Supply Chain44. Zorlu Enerji Wind Project45. 147 MW Patrind Hydropower Project46. Municipal Solid Waste (MSW) Project in Quetta47. 50 MW Solar Project in Cholistan, Pakistan48. Waste Heat Recovery and Utilization for Power Generation at DG Cement Khairpur Plant49. Construction of Hydropower Plant on Golen Gol Nullah50. FFC Cogeneration Project at Mirpur Mathelo, Ghotki, Pakistan51. Younus Energy 50 MW Wind Farm Project52. Foundation Wind Energy-I 50 MW Wind Farm Project53. Foundation Wind Energy-II 50 MW Wind Farm Project54. Power Generation through Wind Energy at Gul Ahmad55. Power Generation through Wind Energy at Metro Power Company56. Substitution of Coal with Alternate Fuels at Lucky Cement, Karachi Plant57. Partial Substitution of Coal with Alternate Fuels at DG Cement, Khofli Sattai DGKhan Plant58. Attock Cement Partial Substitution of Fossil Fuel with alternative fuels, Lasbela59. Programme of Activities Solar photovoltaics in Pakistan60. Installation of Biomass Cogeneration at Bulleh Shah Paper Mill in Kasur, Pakistan61. Azad Pattan Hydropower Project62. Composting of Organic Content of Municipal Solid Waste at Padri Landfill Site Lahore Cantonment, Pakistan63. Allia Khwar Hydropower Project64. Renewable Energy-Based PoA in Pakistan65. RE PoA in Pakistan
66. Energy Efficiency Improvement Project through Retrofitting of Steam Turbine at Lal Pir and Pak Gen Power Plant, Muzaffar Garh, Pakistan
67. CFL Cost-Effective Distribution Program in Pakistan68. Low Head Hydropower Development Project, Punjab Pakistan69. .49.6 MW Wind Power Project at Jhimpir, Sindh by Dewan Energy in Pakistan70. TGF 49.5 MW Wind Power Project71. UEP 99 MW Wind Power Project
Source: Government of Pakistan, Ministry of Climate Change. Clean Development Secretariat, Pakistan.

90
Appendix 2: Priority List of Federal Adaptation and Mitigation
Projects of Pakistan, 2013–2014
Adaptation Projects 2013–2014
Federal Ministry or Division Project Name
Climate Change
Relevance Weight (%) Classification
Actual Expenditure 2013–2014PR million
CC Weighted Actual
ExpenditurePR million
Cabinet division
Id6947 – National Income Support Program Bisp
0.30 Adaptation 18,979 5,693.71
Cabinet division
Id3700 – Up-Gradation of Critical Care Facilities at Pims Islamabad
0.10 Adaptation 519 51.91
Cabinet division
Id6566 – Citizen Damage Compensation Program (Ii)
0.50 Adaptation 1,784 892.11
Cabinet division
Id6814 – Up-Gradation/Strengthening of Cabinet Division’s 6 Aviation Squadron for Relief Operation and Enhancement of Security
0.85 Adaptation 97 82.61
Cabinet division
Id7320 – Establishment of Environmental Monitoring System In Pakistan Project
0.80 Adaptation 9 7.99
Cabinet division
Global Change Impact Studies Centre Iiasa Pakistan Collaboration, Islamabad
1.00 Adaptation 292 292.30
Finance/EAD/P&D
Id4327 – Pakistan Poverty Alleviation Fund (Kfw Project) (Ifad Reach Project Loan) (Ifadmiop)
0.30 Adaptation 6,268 1,880.41
Finance/EAD/P&D
Id6034 – Lowering of Water in Attabad Landslide Dam
0.30 Adaptation 56 17.10
National health
Id6861 – Expanded Program on Immunization Islamabad
0.10 Adaptation 2,932 293.21
National health
Id6918 – Roll Back Malaria 0.90 Adaptation 90 81.03
continued on next page

91Priority List of Federal Adaptation and Mitigation Projects of Pakistan, 2013–2014
Federal Ministry or Division Project Name
Climate Change
Relevance Weight (%) Classification
Actual Expenditure 2013–2014PR million
CC Weighted Actual
ExpenditurePR million
National health
Id6922 – National Program for Family Planning and Primary Health Care
0.50 Adaptation 9,564 4,782.33
States and frontier regions
Bj1113 – Irrigation-Bajour Agency (FATA)
0.50 Adaptation 107 53.85
Water and power division
Bl0012 – 6 Nos Flood Disposal Structures Along with Conveyance System on Nari River Bolan
0.75 Adaptation 870 652.50
Water and power division
Gr0039 – Reconstruction of Shahdicore Dam Balochistan
0.75 Adaptation 1,083 812.58
Water and power division
Hd0133 – Construction of Small Storage Dam, Delay Ation Dams, Retention Weir and Isso Barriers in Sindh, Hyderabad
0.75 Adaptation 1,300 975.00
Water and power
Id4624 – Indus 21 Water Sector Capacity Building
0.50 Adaptation 449 224.51
Water and power division
Ka1002 – Construction of Fall Structure on Nara Canal and Resection of Tato Canal
0.50 Adaptation 485.81 242.91
Water and power division
Ka1006 – Makhi Faras Link Canal Project Chotiari Phase-Ii Sindh
0.50 Adaptation 325.31 162.66
Water and power
Ka1011 – Normal Emergent Flood Program Sindh
0.75 Adaptation 263.50 197.63
Water and power division
Ka1171 – Survey and Study Design for Construction of Rainwater Dams (Reservoir) Along River Indus in Sindh
0.75 Adaptation 47 35.25
Water and power division
Ka1172 – Feasibility Study for Exploration of Ground Water along Course of Historical Hakra River at Tharcoal
0.75 Adaptation 30 22.50
Water and power
Kt0132 – Construction of Snam/Pali and Kundal Dam, Kp
0.75 Adaptation 500 375.00
Water and power
Kt0135 – Feasibility Study of Small Dams in Nwfp
0.75 Adaptation 14 10.78
Water and Power
Kt0147 – Construction of Small Dams in Nwfp
0.75 Adaptation 240 180.00
Adaptation Projects table. continued
continued on next page

92 Appendix 2
Federal Ministry or Division Project Name
Climate Change
Relevance Weight (%) Classification
Actual Expenditure 2013–2014PR million
CC Weighted Actual
ExpenditurePR million
Water and power
Lo0335 – Gomal Zam Dam South Wazirstan and D.I. Kha
0.75 Adaptation 1,200 900.00
Water and power division
Lo0337 – “Greater Thal Canalbhakkar, Layyah, Jhang” Khushab
0.60 Adaptation 300 180.00
Water and power division
Lo0338 – Kachhi Flood Canal Project Dera Bughti, Nasirabad
0.75 Adaptation 5,235 3,926.00
Water and power
Lo0340 – Satpara Multipurpose Dam Northern Areas
0.75 Adaptation and mitigation
70 52.50
Water and power
Lo0390 – Rainee Canal Phases – I
0.60 Adaptation 2,000 1,200.00
Water and power division
Lo0555 – Land and Water Monitoring and/or Evaluation of Indus Plan
0.50 Adaptation 77 38.00
Water and ower
Lo0634 – Rehabilitation of Sidhnai Mailsi Link Canal
0.50 Adaptation 16 8.00
Water and power division
Lo0762 – Research Studies on Drainage, Land Reclamation, Water Management and Use of Drainage Water Wasri, Mon
0.75 Adaptation 100 75.00
Water and power
Lo0827 – Mangla Water Shed Management
0.50 Adaptation 64.369 32.18
Water and ower
Lo0869 – Construction of Darawat Dam Sindh
0.75 Adaptation 1,600 1,200.00
Water and power division
Lo0877 – Lining of Irrigation Channels in Punjab
0.50 Adaptation 1,000 500.00
Water and power division
Lo0878 – Irrigation System Rehabilitation Punjab Ph-1
0.50 Adaptation 300 150.00
Water and power
Lo0879 – Normal Emergent Flood Program Punjab
0.75 Adaptation 191.25 143.00
Water and Power division
Lo0881 – Construction of Daraban Dam Khyber Pakhtunkhwa
0.75 Adaptation 10 7.00
Water and power
Lo0883 – Nai Gaj Dam, Sindh
0.75 Adaptation 1,390 1,042.00
Water and power division
Lo0984 – Construction of Flood Management Structure In District Tank
0.75 Adaptation 40.5 30.00
Adaptation Projects table. continued
continued on next page

93
Federal Ministry or Division Project Name
Climate Change
Relevance Weight (%) Classification
Actual Expenditure 2013–2014PR million
CC Weighted Actual
ExpenditurePR million
Water and power
Lo1037 – Rehabilitation of Flood Damage (Rbod-Iii)
0.30 Adaptation 250 75.00
Water and power division
Lo1038 – Rehabilitation of Flood 2010-Damage (Rbod-I)
0.30 Adaptation 350 105.00
Water and power division
Pr0744 – Rehabilitation of Irrigation Infrastructure in Nwfp
0.50 Adaptation 549 275.00
Water and power division
Pr0757 – Construction of Diversion Weir for Kabul River Canal District Peshawar
0.50 Adaptation 38 19.00
Water and power division
Pr0758 – Flood Management of Takhta Baig Khawar District Peshawar
0.75 Adaptation 46.1 34.58
Water and power division
Pr0789 – Kabul River and Warsak Canal System Remodeling of Warsak Canal System Peshawar and Noshera District and Construction of Diversion W
0.50 Adaptation 260 130.00
Water and power
Pr0791 – Normal Emergent Flood Program FATA
0.75 Adaptation 25.5 19.13
Water and power division
Qa0487 – 100 Dams in Balochistan (Package-Ii 25 Small Dams)
0.75 Adaptation 450 337.50
Water and power division
Qa0488 – Extension of Pat Feeder for Utilization of Indus Water In Balochistan
0.50 Adaptation 1,320 660.00
Water and power division
Qa0490 – Construction of Delay Action Dams Groundwater Recharge of Pishin, Quetta, Mastang, and Mangocher Valleys
0.75 Adaptation 8 6.00
Water and power division
Qa0491 – Construction of 100 Delay Action Dams Balochistan.
0.75 Adaptation 50 37.50
Water and power division
Qa0492 – Restoration of Bolam Dam District Kachhi, Balochistan
0.75 Adaptation 40 30.00
Water and power division
Qa0494 – Provision of Groundwater for Development of Industrial Sector Balochistan
0.50 Adaptation 200 100.00
continued on next page
Adaptation Projects table. continued
Priority List of Federal Adaptation and Mitigation Projects of Pakistan, 2013–2014

94
Federal Ministry or Division Project Name
Climate Change
Relevance Weight (%) Classification
Actual Expenditure 2013–2014PR million
CC Weighted Actual
ExpenditurePR million
Water and power division
Qa0496 – Shore Protection of Pasni Town Balochistan
0.75 Adaptation 300 225.00
Water and power division
Qa0498 – Normal Emergent Flood Program Balochistan
0.75 Adaptation 68 51.00
Water and power division
Qa0543 – Rehablitation and Reconstruction of Akra-Kaur
0.50 Adaptation 86 43.00
Water and power division
Qa0585 – Feasibility Study for Water Resources Development with the Construction of Small/Medium Dams in Balochistan
0.75 Adaptation 80 60.00
Water and power division
Qs0010 – Nawa Bato Tazi Balochistan
0.50 Adaptation 500 250.00
Water and power division
Sk0138 – Sukkur Barrage Rehabiltation and Improvement Project
0.50 Adaptation 250 125.00
Water and power division
Wcap01 – Indus 21 Water Sector Capacity Building and Advisory Services Project
0.50 Adaptation 275 137.54
EAD = Economic Affairs Division, FATA = Federally Administered Tribal Area, P&D = Planning and Development.Source: Controller General of Accounts, Pakistan; United Nations Development Programme. 2015. Climate Public Expenditure and Institutional Review (CPEIR) Study, Pakistan. Islamabad.
Adaptation Projects table. continued
Appendix 2

95
Mitigation Projects
Federal Ministry or Division Project Name
Climate Change
Relevance Weight (%) Classification
Actual Expenditures
2013–2014PR million
CC Weighted Actual
ExpenditurePR million
Cabinet division
Chashma Nuclear Power Project (C3 and C4) (Mianwali) (People’s Republic of China)
0.75 Mitigation 40,328 30,246
Cabinet division
Development of Project Team for Site Development and Installation of 300 MW and 1000 MW Nuclear Power Plants in Karachi
0.75 Mitigation 119 89
Cabinet division
Joint Pre-Project Feasibility and Design Study of a 1000 MW Nuclear Power Plant for Karachi
0.75 Mitigation 70 52
Cabinet division
Karachi Coastal Power Project
0.75 Mitigation 8,000 6,000
Cabinet division
Long-Term Operation of KANUPP (Karachi)
0.75 Mitigation 1,498 1,123
Comm. Division National Highway Authority
Construction of Bridge Across River Chenab Linking Shorkot and Garh Maharaja (Sultan Bahoo)
0.25 Adaptation and
Mitigation
964 241.15
Finance/Economic Affairs Division/Planning and Development Department
Ka1080 – 2x50 MW Power Plant for Syngas (Igcc-2009) Tharparkar
0.15 Mitigation 1000 150
Science and technology research division
Id3497 – Upgrade Of Facilities of Produce Silicon Solar Modules Up to 80 Kw
0.80 Mitigation 48 38
Water and power division
Construction of Diamer Basha Dam Project Land Acquisition (4500 MW)
0.75 Mitigation 25,091 18,818
Water and power division
Dubair Khawar Hydropower Project, Kohistan, khyber Pakhtunkhwa (IDB)
0.75 Mitigation 583 437
Water and power
Golan Gol Hydropower Project (106 MW) (Chitral) (OPEC)
0.75 Mitigation 3,109 2,332
Water and power division
Harpo Hydropower Project Skardu 33 MW (Skardu) (France)
0.75 Mitigation 132 99
continued on next page
Priority List of Federal Adaptation and Mitigation Projects of Pakistan, 2013–2014

96
Federal Ministry or Division Project Name
Climate Change
Relevance Weight (%) Classification
Actual Expenditures
2013–2014PR million
CC Weighted Actual
ExpenditurePR million
Water and power division
Keyal Khawar Hydropower Project,Khyber Pakhtunkhwa (Battagram) (Germany)
0.75 Mitigation 2,862 2,147
Water and power division
Neelum Jhelum Hydropower Project (969 MW) (People’s Republic of China, Kuwait, Saudi Arabia, Islamic Development Bank, and Organization of the Petroleum Exporting Countries)
0.75 Mitigation 46,174 34,630
Water and power division
Power Distribution Enhancement Project (Tranche I and II) (STG-ELR-DOP-Rehabilitation Capacitor Installation and Energy Efficiency (For8 Discos) FESCO (ADB)
0.25 Mitigation 119 29
Water and power division
Power Distribution Enhancement Project (Tranche I and II) (STG-ELR-DOP-Rehabilitation Capacitor Installation and Energy Efficiency (For8 Discos) GEPCO (ADB)
0.25 Mitigation 2,230 557
Water and power division
Power Distribution Enhancement Project (Tranche I and II) (STG-ELR-DOP-Rehabilitation Capacitor Installation and Energy Efficiency (For8 Discos) HESCO (ADB)
0.25 Mitigation 571 142
Water and power division
Power Distribution Enhancement Project (Tranche I and II) (STG-ELR-DOP-Rehabilitation Capacitor Installation and Energy Efficiency (For8 Discos) IESCO (ADB)
0.25 Mitigation 423 105
Water and power division
Power Distribution Enhancement Project (Tranche I and II) (STG-ELR-DOP-Rehabilitation Capacitor Installation and Energy Efficiency (For8 Discos) LESCO (ADB)
0.25 Mitigation 533 133
Mitigation Projects table. continued
continued on next page
Appendix 2

97
Federal Ministry or Division Project Name
Climate Change
Relevance Weight (%) Classification
Actual Expenditures
2013–2014PR million
CC Weighted Actual
ExpenditurePR million
Water and power division
Power Distribution Enhancement Project (Tranche I and II) (STG-ELR-DOP-Rehabilitation Capacitor Installation and Energy Efficiency (For8 Discos) MEPCO (ADB)
0.25 Mitigation 1,633 408
Water and power division
Power Distribution Enhancement Project (Tranche I and II) (STG-ELR-DOP-Rehabilitation Capacitor Installation and Energy Efficiency (For8 Discos) LESCO (ADB)
0.25 Mitigation 533 133
Water and power division
Rehabilitation of Jabban Hydropower Project (22 MW) (Dargai) (France)
0.75 Mitigation 700 525
Water and power division
Tarbela Fourth Extension Hydropower Project (1410 MW) (Swabi) (World Bank, IDA)
0.75 Mitigation 9,961 7,471
Water and power division
Id6140 – Refurbishment And Up-Gradation of Generating Units of Mangla Power Station Enhancing the Capacity from 1000 MW To 1,310 MW
0.75 Mitigation 1,279 959
Water and power division
Lo0898 – Installation of Effluent Treatment Plant Rbod
0.35 Adaptation and
Mitigation
200 70
Water and power division
Lo0902 – Naulong Storage Dam, Jhal Magsi Balochistan.
0.75 Adaptation 460 345
MW = megawatt.Source: Development budget (2013-14) data received from the Controller General of Accounts, Ministry of Finance, Pakistan and used in the Climate Public Expenditure and Institutional Review study: UNDP Pakistan. 2015. http://www.pk.undp.org/content/dam/pakistan/docs/Environment%20&%20Climate%20Change/UNDP%20Climate%20Report%20V10.pdf
Mitigation Projects table. continued
Priority List of Federal Adaptation and Mitigation Projects of Pakistan, 2013–2014

98
Appendix 3: A Brief Overview of the Available International
Climate Financing
Adaptation FundThe Adaptation Fund, a financial instrument under the United Nations Framework Convention on Climate Change (UNFCCC) and its Kyoto Protocol, was established to finance concrete adaptation projects and programs in developing country Parties to the Kyoto Protocol, to reduce the adverse effects of climate change facing communities, countries, and sectors.1 Operational since 2009, the Adaptation Fund gets 2% from the Clean Development Mechanism. The Adaptation Fund Board makes all major decisions. As of 30 June 2016, available funds amounted to $168.55 million.2
ADB’s Clean Energy Financing Partnership FacilityEstablished in 2007, the Clean Energy Financing Partnership Facility3 aims to help improve energy security in developing member countries (DMCs) and decrease the rate of climate change through the deployment of new, more efficient and less polluting supply and end-use technologies, through either grant or non-grant resources. It is currently supported by the Governments of Australia, Canada, Japan, Norway, Spain, Sweden, and the United Kingdom, and the Global Carbon Capture and Storage Institute. It aims to raise a total of $700 million to facilitate investments.4 Potential investments include: (i) deployment of new clean energy technology, (ii) projects that lower the barriers to adopting clean energy technologies, (iii) projects that increase access to modern forms of clean and efficient energy for the poor, and (iv) technical capacity programs for clean energy.
1 Climate Funds Update. Adaptation Fund. http://www.climatefundsupdate.org/listing/adaptation-fund 2 The World Bank Group. Financial Intermediary Funds. Adaptation Fund Trust Fund. http://fiftrustee.worldbank.org/
SiteCollectionDocuments/ADAPT/Trustee%20Reports/AF_TR_09_16.pdf3 ADB. Clean Energy Financing Partnership Facility. https://www.adb.org/site/funds/funds/clean-energy-financing-
partnership-facility 4 Clean Energy Financing Partnership Facility. 2016. Annual Report 2015. https://www.adb.org/sites/default/files/
institutional-document/182927/cefpf-annual-report-2015.pdf

99A Brief Overview of the Available International Climate Financing
ADB’s Climate Change FundEstablished in 2008, the Climate Change Fund5 aims to facilitate greater investments in DMCs to effectively address the causes and consequences of climate change. It is currently financed by ADB’s net income and ordinary capital resources. It focuses on three areas: (i) clean energy, sustainable transport and low-carbon urban development, (ii) reduced emission from deforestation and degradation and improved land use management, and (iii) adaptation. As of 31 December 2015, total Climate Change Fund resources amounted to $60.3 million. Qualifying projects includes mitigation, adaptation, disaster risk reduction focusing on renewable energy, energy efficiency, sustainable land management, etc.
Climate Investment FundSince 2008, the Climate Investment Fund (CIF) has led efforts to empower transformations in the energy, climate resilience, transport, and forestry sectors.6 CIF concessional financing offers flexibility to test new business models and approaches, build track records in unproven markets, and boost investor confidence to unlock additional finance from other sources, particularly the private sector and the multilateral development banks that implement CIF funding. The CIF is comprised of two funds:
a. Clean Technology Fund (CTF) is empowering transformation in developing and emerging economies by providing resources to scale up low carbon technologies with significant potential for long-term greenhouse gas emissions savings, in renewable energy, energy efficiency and clean transport.7 Its current fund size is $5.6 billion. India, Indonesia, and the Philippines are among its major beneficiaries. CTF has been operational since 2008. CTF resources are channeled through partner multilateral development banks such as the World Bank, Asian Development Bank, African Development Bank, etc.
b. Strategic Climate Fund (SCF) is the overarching fund supporting three targeted programs to pilot new approaches with potential for scaled-up and transformational actions aimed at specific a climate change challenge or sector response:8 (i) Forest Investment Program (FIP).9 Operational since 2009, FIP provides
direct investments to benefit forests, development and climate. The FIP supports developing countries’ in reducing deforestation and forest degradation, and promotes sustainable forest management. Current FIP resources amount to $775 million.
(ii) Pilot Program for Climate Resilience (PPCR).10 Operational since 2008, PPCR assists national governments in integrating climate resilience into
5 ADB. Climate Change Fund. https://www.adb.org/site/funds/funds/climate-change-fund 6 Climate Investment Funds. http://www-cif.climateinvestmentfunds.org/about 7 Clean Technology Fund. http://www-cif.climateinvestmentfunds.org/sites/default/files/knowledge-documents/50723_
ctf_factsheet_web.pdf 8 Strategic Climate Fund. https://www-cif.climateinvestmentfunds.org/fund/strategic-climate-fund 9 Climate Investment Funds. Funds and Programs. Forest Investment Program. https://www-cif.climateinvestmentfunds.
org/fund/forest-investment-program 10 Climate Investment Funds. Funds and Programs. Pilot Program for Climate Resilience. https://www-cif.
climateinvestmentfunds.org/fund/pilot-program-climate-resilience

100 Appendix 3
development planning across sectors and stakeholder groups. PPCR also provides additional funding to put pilot innovative public and private sector solutions to climate-related risks. Current PPCR resources amount to $10.2 billion.
(iii) Scaling Up Renewable Energy Program (SREP).11 Operational since 2009, SREP helps in demonstrating the economic, social and environmental viability of renewable energy. SREP is active only in low-income countries. Current SREP resources amount to $780 million.
Global Energy Efficiency and Renewable Energy FundThe Global Energy Efficiency and Renewable Energy Fund (GEEREF) is a Fund-of-Funds advised by the European Investment Bank Group catalyzing private sector capital into clean energy projects in developing countries and economies in transition.12 GEEREF invests in private equity funds focusing on renewable energy and energy efficiency in emerging markets. It focuses on infrastructure projects with proven and low risk technologies that generate clean power. GEEREF’s operations began in 2008, with funding from the European Union, Germany, and Norway totaling €112 million. In 2015, GEEREF successfully concluded its fundraising from private sector investors, bringing total funds under management to €222 million.
Major Multilateral Forest Initiatives and/or Fundsa. Forest Carbon Partnership Facility is a global partnership focused on reducing
emissions from deforestation and forest degradation, forest carbon stock conservation, sustainable forest management, and the enhancement of forest carbon stocks in developing countries.13 Operated by the World Bank, the Forest Carbon Partnership Facility has been operational since 2008. Current total contributions and commitments amount to $1.1 billion: $365 million for the Readiness Fund and $692 million for the Carbon Fund.
b. Forest Investment Program. See description above under Climate Investment Fund.c. GEF Trust Fund was established in 1991 as a $1 billion pilot project in the World
Bank to assist in the protection of the global environment. In 1994, at the Rio Earth Summit, it was made an independent institution, moved out of the World Bank system, and serves as the financial mechanism for six different conventions, including the UNFCCC. GEF funds are available to developing countries and countries with economies in transition to meet the objectives of the international environmental conventions and agreements. GEF is currently on its sixth replenishment with total funding of about $7.7 billion.14
11 Climate Investment Funds. Funds and Programs. Scaling Up Renewable Energy Program. https://www-cif.climateinvestmentfunds.org/fund/scaling-renewable-energy-program
12 Global Energy Efficiency and Renewable Energy Fund. http://geeref.com/ 13 Forest Carbon Partnership Facility. https://www.forestcarbonpartnership.org/about-fcpf-014 Includes climate change adaptation funds (Least Developed Countries Fund, Special Climate Change Fund) and climate
change mitigation fund for GEF Trust Fund replenishments 1–6.

101A Brief Overview of the Available International Climate Financing
d. United Nations–Reducing Emissions from Deforestation and Forest Degradation (UN-REDD) Programme. Launched in 2008, the UN-REDD Programme aims to reduce forest emissions and enhance carbon stocks in forests while contributing to national sustainable development. It supports nationally-led REDD+ processes and promotes the informed and meaningful involvement of all stakeholders, including indigenous peoples and other forest dependent communities, in national and international REDD+ implementation.15 It is operated jointly by the Food and Agriculture Organization of the United Nations (FAO), the United Nations Development Programme (UNDP), and the United Nations Environment Programme (UNEP). Donor support to the UN-REDD Program amounts to more than $280 million.16
Global Environment Facility—Special Climate Change FundThe Special Climate Change Fund is administered by the GEF and has been operational since 2002.17 It has a focus on adaptation and is open to all vulnerable developing countries. As of 31 August 2016, its total fund size amounted to around $351 million.18
Germany’s International Climate InitiativeOperational since 2008, the International Climate Initiative of the Federal Ministry for the Environment, Nature Conservation, Building and Nuclear Safety (BMUB) finances climate and biodiversity projects in developing and newly industrializing countries, as well as in countries in transition. It aims to: (i) promote a climate-friendly economy by supporting partner countries in establishing a climate-friendly economic structure that prevents climate-damaging greenhouse gas emissions; (ii) promote measures for climate change adaptation by supporting appropriate national programs in selected partner countries that are especially vulnerable to climate change; and (iii) promote and finance measures for preservation and sustainable use of carbon reservoirs/REDD+.19 Total project volume since 2008 amounts to €1.7 billion.20
15 UN-REDD Programme. http://www.un-redd.org/ 16 UN-REDD Programme. Donors. http://www.un-redd.org/donors 17 Global Environment Facility. Special Climate Change Fund. https://www.thegef.org/topics/special-climate-change-fund-
sccf 18 Global Environment Facility. Progress Report on the Least Development Countries Fund and the Special Climate Change
Fund. https://www.thegef.org/sites/default/files/council-meeting-documents/EN_GEF.LDCF_.SCCF_.21.03_Progress_Report_LDCF_SCCF.pdf
19 Climate Funds Update. Germany’s International Climate Initiative. http://www.climatefundsupdate.org/listing/international-climate-initiative
20 Federal Ministry for the Environment, Nature Conservation, Building and Nuclear Safety. International Climate Initiative. https://www.international-climate-initiative.com/en/about-the-iki/project-portfolio/

102
United Kingdom’s International Climate FundEstablished in 2011, the United Kingdom set up the International Climate Fund (ICF)21 to promote sustainable economic growth and poverty reduction in three key areas: (i) supporting sustainable and inclusive economic growth, (ii) building resilience to manage risks, and (iii) improving stewardship of natural resources such as the forests. In addition to the £3.86 billion it provided to set up the ICF, the United Kingdom is providing an additional £5.8 billion between April 2016 and March 2021 to the IFC.
Norway’s International Climate and Forest InitiativeEstablished in 2008, Norway’s International Climate and Forest Initiative (NICFI) aims at supporting efforts to slow, halt, and eventually reduce greenhouse gas emissions resulting from REDD+. 22 Pledges and deposits to NICFI amount to $517 million.23 NICFI key objectives are to:
• contribute to the inclusion of “REDD+” reduction of greenhouse gas emissions from forests in developing countries,
• contribute to early actions for measurable emission reductions from deforestation and forest degradation, and
• promote the conservation of primary forests, due to their particular importance as carbon stores and for their biological diversity.
Global Climate Change AllianceIn 2017, the Global Climate Change Alliance (GCCA) was established by the European Union to strengthen dialogue and cooperation with developing countries, in particular least developed countries and small island development states.24 GCCA helps ensure that poor and most vulnerable developing countries increase their capacities to adapt to the effects of climate change. GCCA focuses its technical support on: (i) climate change mainstreaming and poverty reduction, (ii) increasing resilience to climate-related stresses and shocks, and (iii) sector-based climate change adaptation and mitigation strategies. GCCA’s initial period covered 3 years, i.e., 2008–2010. It is still operational and trying to identify new projects. Total pledges and deposits to the GCCA have reached $326.1 million.25
21 Government of United Kingdom. Policy Paper: International Climate Fund. 2017. https://www.gov.uk/government/publications/international-climate-fund/international-climate-fund#links-to-further-information
22 Norwegian Agency for Development Cooperation. https://www.norad.no/en/front/thematic-areas/climate-change-and-environment/norways-international-climate-and-forest-initiative/
23 Climate Funds Update. Norway’s International Climate and Forest Initiative. http://www.climatefundsupdate.org/listing/norway-s-international-climate-and-forest-initiative
24 Global Climate Change Alliance. http://www.gcca.eu/about-the-gcca/what-is-the-gcca 25 Climate Funds Update. Global Climate Change Alliance. http://www.climatefundsupdate.org/listing/global-climate-
change-allianc
Appendix 3

103
Fast Start Finance At the 15th Conference of the Parties held in Copenhagen in December 2009, developed countries made a pledge, known as “Fast Start Finance,” to provide new and additional resources of $30 billion for the period 2010-2012, with balanced allocation between mitigation and adaptation.
Commitments and Pledges: Japan26 $15 billion in pledges US27 $12.6 billion European Union28 €7.2 billionNorway29 $2.34 billion
Green Climate FundThe Green Climate Fund30 was adopted as a financial mechanism of the United Nations Framework Convention on Climate Change at the end of 2011. It aims to make an ambitious contribution to attaining the climate goals of the international community by assisting developing countries on adaptation and mitigation measures to counter climate change. It targets to raise climate finance of $100 billion per year by 2020. As of November 2016, the Green Climate Fund has raised $10.3 billion in pledges.31
26 Climate Funds Update. Japan’s Fast Start Finance. http://www.climatefundsupdate.org/listing/hatoyama-Initiative 27 Climate Funds Update. Fast Start Finance. http://www.climatefundsupdate.org/about-climate-fund/fast-start-finance 28 European Union. Fast Start Finance Report. http://unfccc.int/files/cooperation_support/financial_mechanism/fast_
start_finance/application/pdf/ie-05-29_-_fsf_report.pdf 29 Norwegian Climate Finance 2012. http://unfccc.int/files/cooperation_support/financial_mechanism/fast_start_
finance/application/pdf/norwegian_fast_start_finance_report_2012final08august13.pdf 30 Green Climate Fund. https://www.greenclimate.fund/home 31 Green Climate Fund. https://www.greenclimate.fund/partners/contributors/resources-mobilized
A Brief Overview of the Available International Climate Financing

104
Appendix 4: Description of Some Suggested Adaptation
Technologies for Pakistan
Based on the needs and demands of Pakistan’s agriculture and water sectors, adaptation technologies are identified and explained briefly in the subsequent section. The list includes:
(i) Integrated early warning system(ii) High efficiency irrigation systems(iii) Laser land-leveling technology(iv) Managed aquifer recharge(v) Development of drought- and heat-tolerant crops
Integrated Early Warning SystemIn Pakistan, the Pakistan Meteorological Department (PMD) is responsible for the early warning dissemination and information system. PMD has a specialized Flood Forecasting Division in the city of Lahore. Pakistan’s hydrometeorological warning systems are reasonably satisfactory due to donor-funded support in the last 2 decades from the Asian Development Bank (ADB) and the Japan International Cooperation Agency for the installation and upgrading of powerful weather surveillance radars in Lahore, Sialkot, Karachi, Islamabad, Rahim Yar Khan, and Dera Ismail Khan. These radars monitor and warn the approaching flood-producing monsoon weather systems from India. The PMD is presently setting up a specialized medium-range weather forecasting center in Islamabad which is expected to be operational by 2017, that will add to PMD’s technical capacity in the field of multihazard warning systems.
The early warning system covers the Integrated Flood Analysis System and flood hazard maps generated by the runoff-inundation model. Currently, the Integrated Flood Analysis System covers only 39 out of the 145 districts of Pakistan, and the flood hazard maps serve 32 districts located in the lower Indus River basin area. The flash flood warning system is, however, established and operative only at “Nalla Lai,” a hill torrent flowing through Islamabad and Rawalpindi, that represents the catchment area of the Margallah Hills. The system was supposed to be replicated in other flash flood-prone areas of the country but the plan has not yet materialized. Similarly, there is a Disease Early Warning System introduced after the disastrous earthquake in 2005. The Disease Early Warning System aims to minimize communicable diseases particularly in a post-disaster environment. The system presently covers 93 districts of Pakistan.1
1 LEAD, Pakistan. 2015. Early Warning Systems and Disaster Risk Information. National Briefing. Target 7. http://www.lead.org.pk/lead/attachments/briefings/LPNB7.pdf

105Description of Some Suggested Adaptation Technologies for Pakistan
Many issues and challenges are associated with the reach of these systems. The district level disaster management bodies are not functional in many areas of Pakistan, thus, the dissemination of disaster risk information is likely paralyzed at the local level. Furthermore, the content of risk alerts is in English and not understood by a large segment of the rural and urban population with a low level of education who consequently remain beyond the reach of the disaster management authorities.2
High Efficiency Irrigation SystemsThe need for a high efficiency irrigation system (HEIS) arises from the realization and acknowledgement of huge water losses from the irrigation water distribution systems at the canal, water channel, and field levels. In the province of Punjab, for example, available water at the farm level is 90 million acre feet (MAF) that combines 50 MAF from surface water, 33 MAF from groundwater sources, and 7 MAF from rainfall. After water losses at various irrigation levels, only 45 MAF is available to the plants at the field level, taking the water deficit gap to 20 MAF.
The situation is not different in other provinces where unsustainable use of water has led to water scarcity. In Balochistan, for instance, the high amount of groundwater abstraction threatens the sustainable survival of aquifers in this region.
HEISs such as drip and sprinkler are both water- and nutrient-efficient with very high water-use efficiency.3 The system has benefits of high application efficiency, high yield with quality, with reduced energy and salinity hazards. Punjab has the largest land area under the use of this technology: by the end of 2014, it was estimated that out of 29 million acres of the total irrigated land size in the province, 22,000 acres used a form of HEIS technology. In Sindh, by 2013, the
2 Disaster Emergency Committee. 2012. Disaster Risk Reduction in Pakistan: The Contribution of DEC Member Agencies, 2010–2012. http://www.dec.org.uk/sites/default/files/files/Evaluations/Pakistan/DEC%20Pakistan%20DRR%20Report.pdf
3 Normally this covers both the pressurized and surface irrigation systems, but here we take only pressurized irrigation systems (HEIS) such as drip and sprinkler.
Figure A5.1: Early Warning System’s Reach in Pakistan
3953 24
15
25
18
4
36
30
23
10
Punjab
Balochistan
Khyper Pakhtunkhwa
Sindh
AJK
Flood
PakistanTotal Districts Flash Flood
88
14550
Districts with Potential Floods RiskDistricts with flood riskCurrent Status of EWSTotal Districts in Province/RegionDistrict with Flood RiskDistricts
covered by EWS
million peoplecovered byRRI Model
EWS = early warning system, RRI = runoff-inundation.Source: LEAD, Pakistan. 2015. Early Warning Systems and Disaster Risk Information. National Briefing. Target 7. http://www.lead.org.pk/lead/attachments/briefings/LPNB7.pdf

106 Appendix 4
total area under HEIS was 5,911 acres: sprinkler systems installed on 2,590 acres, drip systems on 1,025 acres, and rain guns on 2,296 acres, mostly using locally manufactured systems.4
To promote a water conservation culture through the HEIS technology, provincial governments offered high subsidy rates on the purchase and/or installation of the system. The government of Punjab, for example, subsidizes 60% of the total system installation cost for up to 15 acres land size, and also provides PRs10,000 per acre of scheme area for the construction of water storage ponds.5 The governments of Sindh and Balochistan are offering an even higher subsidy rate of 80% to the farmers for the adoption of this technology.
The adoption and success rate of this technology in the country is mixed despite high subsidies offered by the government. The water sector of Balochistan, for instance, shows a very high potential for the adoption of HEIS due to its scarce water resources and the low energy efficiency of tube-well irrigated farms (around 35%), but the available research data on the number of functional drip irrigation systems point to a high failure rate in technology adoption and diffusion (Table A5.1).6
4 Data obtained from the archives of Dawn Newspaper of 10 March 2014.5 On Farm Water Management, Directorate General Agriculture. High Efficiency Irrigation Systems. http://www.ofwm.
agripunjab.gov.pk/services_heis 6 M. Ashraf. 2012. Overview of Drip Irrigation System: Potential, Issues, and Constraints. International Centre for
Agricultural Research in the Dry Areas. http://www.pec.org.pk/sCourse_files/DDIS/Lectures/Drip%20overview.pdf
Figure A5.2: Punjab Water Balance Sheet
SURFACE CANALS
FIELDRAINFALL
AVAILABILITY (MAF) LOSSES (MAF)
WATER COURSES
OFWMDOMAIN
32
GROUNDWATER
50 13
11
21
90 4533
7
Crop Water Requirement65 MAF
for43 MA Cropped Area
45 MAFNet Availability
20 MAFDeficit
MA = million acre, MAF = million acre foot, OFWM = on-farm water management.Source: Directory General Agriculture, Water Management Wing. 2015. Briefing to the Secretary Agriculture on Water Management Wing Projects and Performance. Punjab Agriculture Department. Lahore.

107
Table A5.1: Status of Drip Irrigation Systems in Balochistan
Donor Agencies No. of Systems Operational Non-Operational
Percentage of Nonfunctional
SystemsADB 89 29 69 77FAO and UNDP 11 6 5 45PCRWR 6 4 2 33Total 106 30 76 71
ADB = Asian Development Bank, FAO = Food and Agriculture Organization of the United Nations, PCRWR = Pakistan Council of Research in Water Resources, UNDP = United Nations Development Programme.Source: M. Ashraf. 2012. Overview of Drip Irrigation System: Potential, Issues and Constraints. International Centre for Agricultural Research in the Dry Areas. http://www.pec.org.pk/sCourse_files/DDIS/Lectures/Drip%20overview.pdf
Some of the important barriers in the adoption and implementation of technology are high capital and operational costs, inadequate training of the beneficiaries, small landholdings, difference in quality and price of the irrigation system component offered in the market, lack of knowledge about irrigation scheduling, the short life of drip irrigation systems (10 years only), and the one-time subsidy program that does not cover the rest of the system’s expenses7 nor the high subsidy rate (e.g., around 90% in Balochistan) offered to the farmers on the bill of electric-operated tube wells.
Laser Land-Leveling TechnologyMuch of the water losses in agriculture results from unnecessary runoff from the fields. An important approach to reducing runoff is ensuring that agriculture fields are as level as possible. Recent technologies, including the use of laser technology, improved the precision of field leveling before planting. Laser land-leveling is the use of lasers mounted on a tripod or tower and used in combination with a tractor to flatten or level agriculture fields in an effort to conserve irrigated water. This precisely flat land aids in runoff control and water use efficiency.
This technology is in high demand in the country due to the multiple benefits it offers such as reducing water consumption up to 31% per hectare (ha) and increase in crop yield (30% for wheat and 47% for maize). In Punjab, the area that requires leveling is estimated at 29 million acres.8 Table A5.2 below shows the technology need gap for the province.
7 S. Ahmed. 2007. Framework for Targeting Subsidy and Costing High Efficiency Irrigation Systems under the National Program. Policy Brief. 3 (3). Water for Balochistan. http://waterinfo.net.pk/sites/default/files/knowledge/Policy%20Briefing%20-%203.3%20-%20Framework%20for%20Targeting%20Subsidy%20and%20Costing%20High%20Efficiency%20Irrigation%20Systems%20under%20the%20National%20Program%20-%20Dr.%20Shahid%20Ahmad%20-%202007.pdf
8 Directory General Agriculture, Water Management Wing. 2015. Briefing to the Secretary Agriculture on Water Management Wing Projects and Performance. Punjab Agriculture Department. Islamabad.
Description of Some Suggested Adaptation Technologies for Pakistan

108
Table A5.2: Laser Land-Leveler Need in Punjab
Laser Land Leveler Need in PunjabArea requiring leveling (million acres) 29Annual leveling capacity per laser unit (acres) 300Required units (no.) 25,000Available units (no.) 6,000Gap (unit no.) 19,000
Source: Director General Agriculture, Water Management Wing. Punjab Agriculture Department. Briefing to the Secretary Agriculture on Water Management Wing Projects and Performance. January 2015.
However, the high cost of the machine and the need for proper training makes this technology out of reach for many small- to medium-size landholders.9 To address this issue, provincial governments offer subsidized laser leveler units to the farmers. The governments of Punjab and Sindh provinces offer subsidies of PR225,000 and PR245,000, respectively, per unit of laser lever.10
Managed Aquifer RechargeManaged Aquifer Recharge (MAR) manages and stores water using various methods, depending on the type of water sources, availability of water, geology, and socioeconomic structure. It is increasingly linked with the integrated water and catchment management strategy due to the many benefits ranging from surface water and soil management, flood management, erosion and pollution control, to environmental management through change of land use.
MAR has great potential in arid and semiarid regions but its uptake has been limited due to the lack of understanding of hydrology and/or knowledge of MAR globally.11 In Pakistan, some of the techniques are in use but these primarily address water storage and use for irrigation purposes instead of focusing on ground water recharge. Rainwater harvesting, for instance, is one of the techniques of the MAR area that employs both dry land farming and rooftop water harvesting. The dry land farming represents a centuries-old indigenous spate irrigation system in the country while rooftop rainwater harvesting is currently restricted to some demonstration projects and feasibility studies.
Traditionally, in the Dry Land Farming System, water is diverted from open channels close to the foothills or (further down in the plains) with the help of earthen diversion bunds built across the dry riverbeds. Pakistan has the largest area of any country globally under this spate irrigation system. It is estimated that it constitutes 3%–10% of the total irrigated area in the country, however, spate irrigation largely remains an unknown quantity and not well understood.12 It occurs in the areas
9 As of 2014, the cost was PRs620,000 per machine. 10 Sale of Laser Land-Leveling Equipment under Subsidized Rates. http://sindhagri.gov.pk/laser%20land.html 11 United Nations Educational, Scientific and Cultural Organization. 2005. Strategies for Managed Aquifer Recharge in Semi-
Arid Regions. http://unesdoc.unesco.org/images/0014/001438/143819e.pdf 12 S. Ahmed and F. V. Steenbergen. The Potential for the Development of Spate Irrigation Systems in Pakistan. http://waterinfo.
net.pk/sites/default/files/knowledge/The%20Potential%20for%20the%20Development%20of%20Spate%20Irrigation%20Systems%20in%20Pakistan.pdf
Appendix 4

109
west of Indus in all four provinces and is called “Nai” in Sindh, “Salilaba” in Balochistan, and “Rod Kohi” in the Northwest Frontier Province and Punjab.
This farming system in general uses only 15% and 30% of rainfall while the remaining rain evaporates (30%–50%) and/or is lost through surface runoff (10%–25%). Only a small fraction of rain is used for groundwater recharge (10%–30%). The farming system uses various interventions such as field bunds, and floodwater diversion into bunded cropping area with principal aim to reduce runoff and concentrate the water to be stored in the soil profile for better crop yield.
The current spate-irrigated area in Pakistan is estimated at 0.34 million ha during dry years and 1.28 million ha in wet years, and a maximum developed command area of 2.02 million ha. It represents 10% of the country’s total irrigated land. There is some institutional development to promote dry land farming though the spate irrigation system such as establishment of the Pakistan Spate Irrigation Network, an organization that aims to promote improvement in spate irrigation in the country through its vast connectivity with other spate irrigation networks in the world.
Efforts were made in the past decade to organize this system to reap its full benefits, but so far, efforts have remained fragmented and uncoordinated. The past projects mainly aimed to modernize the system by replacing the traditional diversion with permanent headwork. The cost of investment ranged from $1,051 to $2,350 per ha. Success has been mixed, and the risk of failure is high in modernization projects because of the challenges of managing sedimentation, dealing with occasional high floods, and capturing shifting low flow canals.
The literature on spate irrigation in Pakistan highlights the importance of institutional and management aspects in determining the success rate of this technique. Currently, a dominant institutional theme associated with this system is decentralization and participatory management which, as stated in the United Nations Educational, Scientific and Cultural Organization (UNESCO) report: “…implies a new way of doing business—channeling funds; managing projects; taking decisions, etc.—for a range of stakeholders involved in building the new coalitions. It also implies changes in the locus of decision-making. But there is vested interest and existing power relation makes it highly contested.”
Some of the important institutional and management aspects that should be taken into consideration when designing and/or implementing a large-scale rainwater harvesting system are water rights; land ownership; legal and regulatory issues; who pays and who benefits; who manages, e.g., community or nongovernment organization; who owns, e.g., local, central government, government-owned company, or a municipality-owned company.
Development of Drought- and Heat-Tolerant CropsSince climate change is projected to increase the temperature and reduce the precipitation amount in this region, it will adversely impact the crop productivity and yield by intensifying drought and heat stress specifically in the country’s semiarid and rain-fed areas. There is a need to develop drought- and heat-tolerant crops that show optimum performance even with changes in climate patterns.
Description of Some Suggested Adaptation Technologies for Pakistan

110
Several research institutes in the country work on wheat, rice, and cotton to produce drought- and heat-tolerant varieties through gene modification, such as Ayub Agriculture Research Institute, Faisalabad;13 the National Institute of Genomics and Advanced Biotechnology, Islamabad; and the National Institute for Biotechnology and Genetic Engineering, Faisalabad.
13 Ayub Agricultural Research Institute. http://www.aari.punjab.gov.pk/research/verities?start=45
Leaky Check Dam in Balochistan for Groundwater Recharge.
Source: UNESCO. 2005. Strategies for Managed Aquifer Recharge in Semi-Arid Regions. http://unesdoc.unesco.org/images/0014/001438/143819e.pdf
Appendix 4

111
Appendix 5: Classification of Climate Change Relevant Activities
High relevance Rationale
Clear primary objective of delivering specific outcomes that improve climate resilience or contribute to mitigation.
Climate relevance weight: 75%+
Examples • Energy mitigation (e.g., renewable, hydropower, nuclear, and energy efficiency).
• Disaster risk reduction and disaster management capacity, particularly flood and drought risk reduction and management actions.
• Forestation and conservation of protected areas.• Management, research, and construction of water resources and
infrastructure including water reservoirs to combat increasing variability in drought and floods.
• Actions taken in response to recent flooding, drought, because these will have added benefits for future extreme events.
• Relocating villages to give protection against climate stresses (drought, floods, and sea-level rise).
• Healthcare directly associated with climate-sensitive diseases.• Building institutional capacity to plan and manage climate change,
including early warning and monitoring.• Climate change awareness-raising.• Actions meeting the criteria of climate change funds (e.g., Green
Climate Fund, Global Environment Fund, Pilot Program for Climate Resilience).
Medium relevance Rationale
Either secondary objectives related to building climate resilience or contributing to mitigation, or mixed programs with a range of
activities that are not easily separated but include at least some that promote climate resilience or mitigation.
Climate relevance weight: 50% to 74%
Examples • Forestry and agroforestry that is motivated primarily by economic or conservation objectives, because these will have some mitigation effects.
• Watershed management, water works rehabilitation, water storages, water efficiency, water conservation, irrigation, and canal lining motivated primarily by improved livelihoods, but will also provide protection against drought.
• Biodiversity and conservation, unless explicitly aimed at increasing resilience of ecosystems to climate change (or mitigation).
• Population control programs, livelihood and social protection programs, motivated by poverty reduction, but also for building household reserves and assets, and reducing vulnerability.
• Civil defense facilities enhancement actions that can contribute toward disaster risk reduction.
• Restructuring of production technology in industry, building, and transportation toward low carbon intensity.
• Education and research in the area of agriculture, veterinary or animals field, and environmental sciences since these contribute to food security under climatic stresses.
• Energy distribution system improvements.

112
Low relevance Rationale
Activities that display attributes where indirect adaptation and mitigation benefits may arise.
Climate relevance weight: 25% to 49%
Examples • Water supply and water quality schemes, unless the improvements in water quality aim to reduce problems from extreme rainfall events, in which case the relevance would be high.
• Sanitation–sewerage scheme. Space, marine, and dairy animals research programs and education in hard-pressed areas.
• General planning capacity enhancement, either at the national or local level, unless explicitly linked to climate change, in which case it would be high.
• Road construction with identifiable elements of climate proofing. • Livelihood and social protection programs motivated by poverty
reduction (Zakat, Poverty Alleviation Fund, Benazir Income Support Program), but also for building household reserves and assets, and reducing vulnerability. Strengthening, improvement, and rehabilitation of road infrastructure. Roads and bridges reduce the distance traveled. Roads in difficult areas, i.e., mountain areas, coastal areas.
• Rehabilitation of flood damage. Urban storm drainage schemes.• Food security, drought recovery, and satellite programs.• Mass transit system, railway.• Bridges over rivers to reduce distances between places.
Marginal relevance Rationale
Activities that have only very indirect and theoretical links to climate resilience, or small elements and components of the investment
which have a direct effect on climate change.Climate relevance weight: less than 25%
Examples • International trade promotion.• Education, research, and health initiatives that do not have an explicit
climate change element.• Road investment with no particular climate proofing.• Infrastructure development where particular and small aspects of the
project require climate proofing.• Energy with no explicit objective of reducing emissions.• People work and Tameer-e-watan programs or area development
funds.
Source: Q. Z. Chaudhry. 2015. Climate Public Expenditure and Institutional Review Study for Pakistan. Islamabad: United Nations Development Programme.
Appendix 5

113
Rank No. Province District Flood RiskLandslide
RiskEarthquake
RiskTsunami
RiskCyclone
RiskDrought
Risk AvalancheGLOF
RiskPDMAPolicy Total
1 S7 Sindh Karachi 4 1 5 5 5 5 1 1 5 30
2 A9 A.J.K Hattian 5 5 5 – 2 3 4 1 5 25
3 A5 A.J.K Muzaffarabad 5 5 5 – 2 3 5 5 5 25
4 K5 Khyber Pakhtunkhawa
Charsadda 5 3 5 – 2 3 5 1 5 23
5 K21 Khyber Pakhtunkhawa
Shangla 5 4 5 – 2 4 5 5 3 23
6 K20 Khyber Pakhtunkhawa
Sawat 5 5 4 – 2 ² 5 5 5 23
7 K18 Khyber Pakhtunkhawa
Nowshera 5 3 5 – 2 3 4 1 5 23
8 A8 A.J.K Sudhnoti 5 5 5 – 2 5 1 1 1 23
9 A7 A.J.K Poonzh 5 5 5 – 2 5 1 1 1 23
10 A10 A.J.K Haveli 5 5 5 – 2 5 5 1 1 23
11 A1 A.J.K Bagh 5 5 5 – 2 5 5 1 1 23
12 K16 Khyber Pakhtunkhawa
Mansehra 4 5 4 – 2 1 4 5 5 21
13 S4 Sindh Hyderabad 5 1 4 – 4 5 1 1 1 20
14 S22 Sindh Thatta 4 1 ² 3 4 1 1 1 5 20
15 S20 Sindh Tando Muhammad
Khan
5 1 4 – 4 5 1 1 1 20
16 S2 Sindh Dadu 5 1 ² – 2 5 1 1 5 20
17 S15 Sindh Qamber and Shahdadkot
5 1 3 – 2 4 1 1 5 20
18 S1 Sindh Badin 4 1 3 – 5 ² 1 1 5 20
19 P30 Punjab Rawalpindi 4 5 5 – 2 3 1 1 1 20
20 K4 Khyber Pakhtunkhawa
Buner 5 4 4 – 2 4 4 1 1 20
21 F1 FATA Bajaur Agenzy 3 3 5 – 2 ² 5 1 5 20
22 B3 Balochistan Bolan 4 3 3 – 2 3 1 1 5 20
23 A6 A.J.K Neelum 4 4 4 – 1 ² 4 4 5 20
24 A3 A.J.K Kotli 4 3 5 – 2 5 1 1 1 20
25 S19 Sindh Tando Allahyar 4 1 4 – 4 5 1 1 1 19
26 K19 Khyber Pakhtunkhawa
Peshawar 5 3 5 – 2 3 4 1 1 19
Appendix 6: Pakistan District Level Climate Risk and Hazard
Assessment Classification
continued on next page

114
Rank No. Province District Flood RiskLandslide
RiskEarthquake
RiskTsunami
RiskCyclone
RiskDrought
Risk AvalancheGLOF
RiskPDMAPolicy Total
27 F4 FATA Mohmand Agency
3 4 4 – 1 2 3 1 5 19
28 B7 Balochistan Jaffarabad 5 1 3 – 2 3 1 1 5 18
29 S11 Sindh Matiari 5 1 4 – 2 5 1 1 1 18
30 P33 Punjab Sheikhupura 5 2 4 – 2 4 1 1 1 18
31 K24 Khyber Pakhtunkhawa
Upper Dir 4 5 4 – 2 2 4 5 1 18
32 K22 Khyber Pakhtunkhawa
Swabi 5 3 5 – 2 2 5 1 1 18
33 K2 Khyber Pakhtunkhawa
Bannu 4 2 5 – 2 4 1 1 1 18
34 K1 Khyber Pakhtunkhawa
Abbottabad 3 5 5 – 2 2 5 1 1 18
35 F2 FATA Khyber Agenzy 3 4 3 – 1 2 3 1 5 18
36 B20 Balochistan Nasirabad 5 1 3 – 2 2 1 1 5 18
37 A4 A.J.K Mirpur 3 3 4 – 2 5 1 1 1 18
38 S8 Sindh Kashmore 5 1 3 – 2 5 1 1 1 17
39 S6 Sindh Jamshoro 5 1 ² – 3 5 1 1 1 17
40 S5 Sindh Jacobabad 5 1 3 – 2 5 1 1 1 17
41 S17 Sindh Shikarpur 5 1 3 – 2 5 1 1 1 17
42 S14 Sindh Nawabshah 5 1 ² – 3 5 1 1 1 17
43 S13 Sindh Naushahro Feroze
5 1 3 – 2 5 1 1 1 17
44 S12 Sindh Mirpur Khas 4 1 3 – 4 4 1 1 1 17
45 P28 Punjab Rahim Tar Khan 5 1 3 – 2 5 1 1 1 17
46 P22 Punjab Multan 4 1 4 – 2 5 1 1 1 17
47 K7 Khyber Pakhtunkhawa
D. I. Khan 5 1 2 – 2 2 1 1 5 17
48 K3 Khyber Pakhtunkhawa
Batagram 3 4 4 – 2 3 4 5 1 17
49 K17 Khyber Pakhtunkhawa
Mardan 5 3 5 – 2 1 5 1 1 17
50 K14 Khyber Pakhtunkhawa
Lower Dir 4 4 5 – 2 1 5 1 1 17
51 B24 Balochistan Quetta 3 1 5 – 2 5 1 1 1 17
52 S9 Sindh Khairpur 5 1 2 – 2 5 1 1 1 16
53 S3 Sindh Ghotki 5 1 2 – 2 5 1 1 1 16
54 S18 Sindh Sukkur 5 1 2 – 2 5 1 1 1 16
55 P9 Punjab Gujranwala 5 2 4 – 2 2 1 1 1 16
56 P26 Punjab Okara 3 1 5 – 2 4 1 1 1 16
57 P24 Punjab Nankana Sahib 3 2 4 – 2 4 1 1 1 16
58 P23 Punjab Muzaffargarh 5 1 3 – 2 4 1 1 1 16
59 P21 Punjab Mianwali 4 4 3 – 2 2 1 1 1 16
60 P10 Punjab Gujrat 5 2 5 – 2 1 1 1 1 16
61 K9 Khyber Pakhtunkhawa
Haripur 3 5 4 – 2 1 4 1 1 16
continued on next page
Appendix Table continued
Appendix 6

115Pakistan District Level Climate Risk and Hazard Assessment Classification
Rank No. Province District Flood RiskLandslide
RiskEarthquake
RiskTsunami
RiskCyclone
RiskDrought
Risk AvalancheGLOF
RiskPDMAPolicy Total
62 K8 Khyber Pakhtunkhawa
Hangu 3 3 4 – 2 3 1 1 1 16
63 K15 Khyber Pakhtunkhawa
Malakand 4 3 5 – 2 1 4 1 1 16
64 I1 Capital Territory
Islamabad 2 3 5 – 2 3 1 1 1 16
65 F6 FATA Orakzai Agency 2 4 3 – 2 4 1 1 1 16
66 B8 Balochistan Jhal Magsi 4 1 2 – 2 2 1 1 5 16
67 A2 A.J.K Bhimber 4 2 3 – 2 4 1 1 1 16
68 S21 Sindh Tharparkar 3 1 2 – 4 4 1 1 1 15
69 S10 Sindh Larkana 5 1 2 – 2 4 1 1 1 15
70 P8 Punjab Faisalabad 3 1 4 – 2 4 1 1 1 15
71 P35 Punjab Toba Tek Singh 3 1 4 – 2 4 1 1 1 15
72 P34 Punjab Sialkot 5 1 5 – 2 1 1 1 1 15
73 P31 Punjab Sahiwal 3 1 4 – 2 4 1 1 1 15
74 P25 Punjab Narowal 5 1 5 – 2 1 1 1 1 15
75 P12 Punjab Jhang 5 1 3 – 2 3 1 1 1 15
76 K23 Khyber Pakhtunkhawa
Tank 4 1 3 – 2 4 1 1 1 15
77 B25 Balochistan Sibi 3 1 2 – 1 3 1 1 5 15
78 B17 Balochistan Loralai 3 2 3 – 2 4 1 1 1 15
79 P7 Punjab D. G. Khan 5 1 2 – 2 3 1 1 1 14
80 P32 Punjab Sargodha 4 2 3 – 2 2 1 1 1 14
81 P29 Punjab Rajanpur 5 1 2 – 2 3 1 1 1 14
82 P19 Punjab Lodhran 3 1 3 – 2 4 1 1 1 14
83 P18 Punjab Leiah 5 1 2 – 2 3 1 1 1 14
84 P16 Punjab Khushab 4 2 3 – 2 2 1 1 1 14
85 P15 Punjab Khanewal 3 1 3 – 2 4 1 1 1 14
86 P14 Punjab Kasur 3 1 4 – 2 3 1 1 1 14
87 P13 Punjab Jhelum 3 2 4 – 2 2 1 1 1 14
88 F12 FATA FR Peshawar 2 3 3 – 2 3 1 1 1 14
89 B14 Balochistan Killa Saifullah 3 3 3 – 1 3 1 1 1 14
90 B10 Balochistan Kech 3 1 1 – 4 4 1 1 1 14
91 S23 Sindh Umerkot 3 1 2 – 3 3 1 1 1 13
92 S16 Sindh Sanghar 4 1 2 – 3 2 1 1 1 13
93 P6 Punjab Chiniot 3 1 3 – 2 3 1 1 1 13
94 P36 Punjab Vehari 3 1 3 – 2 3 1 1 1 13
95 P27 Punjab Pakpattan 3 1 3 – 2 3 1 1 1 13
96 P20 Punjab Mandi Bahauddin 3 1 4 – 2 2 1 1 1 13
97 P17 Punjab Lahore 3 1 4 – 2 2 1 1 1 13
98 K12 Khyber Pakhtunkhawa
Kohistan 3 4 3 – 1 1 4 4 1 13
99 K11 Khyber Pakhtunkhawa
Kohat 3 2 3 – 2 2 1 1 1 13
100 F7 FATA South Waziristan Agency
2 2 2 – 1 1 1 1 5 13
Appendix Table continued
continued on next page

116
Rank No. Province District Flood RiskLandslide
RiskEarthquake
RiskTsunami
RiskCyclone
RiskDrought
Risk AvalancheGLOF
RiskPDMAPolicy Total
101 P2 Punjab Bahawalnagar 3 1 2 – 2 3 1 1 1 12102 P11 Punjab Hafizabad 3 1 3 – 2 2 1 1 1 12103 K6 Khyber
PakhtunkhawaChitral 3 4 2 – 1 1 2 3 1 12
104 F9 FATA FR D. I. Khan 1 1 2 – 1 2 1 1 5 12105 B9 Balochistan Kalat 3 3 3 – 1 1 1 1 1 12106 B23 Balochistan Pishin 2 1 4 – 1 3 1 1 1 12107 B1 Balochistan Awaran 2 1 1 – 3 4 1 1 1 12108 P3 Punjab Bahawalpur 2 1 2 – 2 3 1 1 1 11109 K13 Khyber
PakhtunkhawaLakki Marwat 3 1 3 – 2 1 1 1 1 11
112 F10 FATA FR Kohat 2 3 3 – 1 1 1 1 1 11113 B29 Balochistan Harnai 3 1 2 – 1 3 1 1 1 11114 B2 Balochistan Barkhan 3 1 3 – 1 2 1 1 1 11115 B18 Balochistan Mastung 2 2 3 – 1 2 1 1 1 11116 B13 Balocistan Killa Abdullah 3 1 3 – 1 2 1 1 1 11117 B12 Balochistan Khuzdar 3 1 1 – 1 4 1 1 1 11118 P5 Punjab Chakwal 2 1 3 – 1 2 1 1 1 10119 P1 Punjab Attock 2 2 3 – 1 1 1 1 1 10124 F8 FATA FR Bannu 1 2 2 – 1 1 1 1 3 10125 F5 FATA North Waziristan
Agency2 2 2 – 1 2 1 1 1 10
126 F3 FATA Kurrum Agency 3 2 2 – 1 1 2 1 1 10127 B6 Balochistan Gwadar 1 1 2 1 3 1 1 1 1 10128 B16 Balochistan Lasbela 2 1 1 1 3 1 1 1 1 10129 B27 Balochistan Ziarat 1 1 4 – 1 1 1 1 1 9130 P4 Punjab Bhakkar 3 1 2 – 1 1 1 1 1 9131 K10 Khyber
PakhtunkhawaKarak 2 2 2 – 1 1 1 1 1 9
133 B15 Balochistan Kohlu 2 2 2 – 1 1 1 1 1 9134 F13 FATA FR Tank 1 1 1 – 1 1 1 1 3 8135 B4 Balochistan Chagai 2 1 1 – 1 2 1 1 1 8136 B28 Balochistan Washuk 2 1 2 – 1 1 1 1 1 8137 B26 Balochistan Zhob 2 1 2 – 1 1 1 1 1 8138 B22 Balochistan Panjgur 1 1 1 – 1 3 1 1 1 8139 B21 Balochistan Nushki 2 1 2 – 1 1 1 1 1 8140 B11 Balochistan Kharan 2 1 2 – 1 1 1 1 1 8141 F11 FATA FR Lakki Marwat 1 1 2 – 1 1 1 1 1 7142 B5 Balochistan Dera Bugti 1 1 2 – 1 1 1 1 1 7143 B30 Balochistan Sherani 1 1 2 – 1 1 1 1 1 7144 B19 Balochistan Musakhel 1 1 2 – 1 1 1 1 1 7145 D1 Disputed Area Disputed Area – 3 – – – – – – 1 4
Scoring Key Very High High Medium Low Very Low Non Hazard
5 4 3 2 1 -
FATA = Federally Administered Tribal Area, GLOF = glacial lake outburst flood, PDMA = Provincial Disaster Management Authority.Source: Government of Pakistan, Ministry of Climate Change. 2012. National Disaster Management Plan. Islamabad: National Disaster Management Authority. p. 31.
Appendix Table continued
Appendix 6

ASIAN DEVELOPMENT BANK6 ADB Avenue, Mandaluyong City1550 Metro Manila, Philippineswww.adb.org
ASIAN DEVELOPMENT BANK
CLIMATE CHANGE PROFILE OF PAKISTAN
Climate Change Profi le of Pakistan
Catastrophic fl oods, droughts, and cyclones have plagued Pakistan in recent years. The 2010 fl ood killed 1,600 people and caused around $10 billion in damage. The 2015 Karachi heat wave led to the death of more than 1,200 people. Climate change-related natural hazards may increase in frequency and severity in the coming decades. Climatic changes are expected to have wide-ranging impacts on Pakistan, a� ecting agricultural productivity, water availability, and increased frequency of extreme climatic events. Addressing these risks requires climate change to be mainstreamed into national strategy and policy. This publication provides a comprehensive overview of climate change science and policy in Pakistan.
About the Asian Development Bank
ADB’s vision is an Asia and Pacifi c region free of poverty. Its mission is to help its developing member countries reduce poverty and improve the quality of life of their people. Despite the region’s many successes, it remains home to a large share of the world’s poor. ADB is committed to reducing poverty through inclusive economic growth, environmentally sustainable growth, and regional integration.
Based in Manila, ADB is owned by 67 members, including 48 from the region. Its main instruments for helping its developing member countries are policy dialogue, loans, equity investments, guarantees, grants, and technical assistance.
Top Related