


Languages
Pages
Legal


CITY OF WATERLOO
Water amp Sanitary Sewer
Rate Design Study Final Report
amp Financial Plan No 112-301
April 1st 2016
DFA Infrastructure International Inc
dfa DFA Infrastructure International Inc 33 Raymond Street St Catharines Ontario Canada L2R 2T3
Telephone (905) 938 -0965 Fax (905) 937-6568
April 1 2016
The Corporation of the City of Waterloo
100 Regina St S
PO Box 337 Station Waterloo
Waterloo ON
N2J 4A8
Re City of Waterloo
Water amp Sanitary Sewer Rate Design Study Final Report
amp Water Financial Plan No 112-301
We are pleased to submit our final report entitled City of Waterloo Water amp Sanitary Sewer
Rate Design Study Final Report amp Water Financial Plan No 112-301 This report presents the
full costs associated with managing the City of Waterloos water and sanitary sewer systems
the options for cost recovery including a recommended option and the water system financial
statements required under OReg 45307
Please do not hesitate to call if you have any questions
Yours truly
DFA Infrastructure International Inc
Derek Ali MBA PEng
President
City of Waterloo Water amp Sanitary Sewer Rate Design Study Final Report amp Water Financial Plan No 112-301
April 1 2016
Executive Summary
ES-1 Purpose of Report
The purpose of the rate study is to
bull Identify the full cost of services for the Cityrsquos drinking water and sanitary sewer systems
based on the most recent information The period for this study is 24 years from 2016 to
2039 inclusive
bull Develop water and sanitary sewer rate structures that would not only recover the full
cost of delivering these services but also provide sustainable financing over the long-
term and address the issue of declining water consumption and revenue stability
bull Prepare an updated Water System Financial Plan (No112-301) in accordance with the
requirements of OReg 45307 for the renewal of the licence for the Cityrsquos water
distribution system The existing licence expires on July 1 2016 and submission of the
financial plan as part of the licence renewal application process is due to the Ministry of
the Environment (MOE) by June 1 2016 and
bull Prepare a Sanitary Sewer System Financial Plan similar to that required for water under
OReg 45307
ES-2 Background Information
The City of Waterloo (City) owns and operates a water distribution system (431 km) and a
sanitary sewer (wastewater collection) system (407 km) that service approximately 131000
residents but purchases water and wastewater treatment services from the Region of Waterloo
(Region) The City is responsible for ensuring that management of these systems are financially
sustainable over the long-term
The Regionrsquos annual charges to the City for water and wastewater treatment services comprise
a significant portion of the annual cost of service for each system The City recovers its annual
costs through monthly service charges for water based on meter size plus consumption charges
based on the respective water and sanitary sewer uniform rate per cubic metre for the volume
of water consumed
The annual customer growth is projected to be approximately 246 new customers per year
each with a demand of approximately 170 m3 per customer This annual customer growth is
consistent with 2013-2014 building permits issued and is conservative from an additional
revenue generation perspective The Cityrsquos annual water and wastewater volumes projected to
be treated by the Region and revenue volumes over the next 6 years are shown in the following
table Projections for the entire 24-year study period are provided in Appendix B
i DFA Infrastructure International Inc
City of Waterloo Water amp Sanitary Sewer Rate Design Study Final Report amp Water Financial Plan No 112-301
April 1 2016
ES-1 Water amp Sanitary Sewage Volumes (m3)
Volumes 2016 2017 2018 2019 2020 2021
Water Volume to be
Purchased from the 12285662 12274432 12268381 12318894 12368688 12426243
Region (msup3)
Revenue Volume (msup3) 10535117 10451447 10354586 10397572 10440558 10483544
Non-Revenue Water
(msup3) 1750545 1822985 1913795 1921323 1928130 1942700
Citys Volume to be
Treated by Region (msup3) 16264573 16193060 16358051 16084050 15779218 16135790
Sanitary Sewage
Revenue Volume (msup3) 10325928 10279351 10208507 10251845 10295183 10338521
ES-3 Stakeholder Consultation
A Council Workshop was held on February 22 2016 and a Public Open House on February 25
2016 to obtain feedback on the rate structure design guiding principles reserve strategies
capital financing and timing of implementation Based on the feedback received the following
guiding principles were used to develop the rate structure alternatives
1 Full Cost Recovery All costs are to be recovered through the utility rates
2 Revenue Stability Provide stable and adequate annual revenue to minimize the occurrence of annual deficits
3 User Pay Recover more revenue from those who use more water
4 Fairness and Equity Ensure to the extent possible that each customer class pays
its fair share with minimal cross subsidization
5 Uniform Rate Structure Rate structure to remain a uniform volumetric (consumption) rate with no inclining or declining block (ie same consumption
rate for all users) However a rate option based on an inclining block rate
structure should be developed for further consideration
6 Water Conservation Water rate to be designed to facilitate ongoing water
conservation
7 Capital Financing To be through a combination of reserve rates debt (in
accordance with the Cityrsquos debt policy)
8 Ease of Administration Rate calculations are to be transparent and easily
explainable to customers Rate structure must be compatible with existing billing software capabilities and minimize costs due to rate structure changes
9 Affordability Customer affordability and assistance programs to be considered
as part of the study
ii DFA Infrastructure International Inc
City of Waterloo Water amp Sanitary Sewer Rate Design Study Final Report amp Water Financial Plan No 112-301
April 1 2016
The following were also confirmed
bull Use of debt financing for capital needs will be utilized for up to 30 of the estimated
annual capital needs Water and sanitary sewer projects are exempt from the City Debt
Management Policy (FC-009) However a maximum debt funding limit of up to 30 of
the annual capital funding needs was used for the purposes of this study and rate
forecast as per the policy debt limits This is seen as an acceptable debt levelstrategy in
accordance with the Council approved tax base debt policy
bull Targeting capital reserve balances of approximately 1 of the estimated asset
replacement value as inflated each year according to the Construction Price Inflations
Index
bull Targeting rate stabilization reserve balances of 5 of annual operating costs each year
bull Implementing the new rate structure in 2019
ES-4 Full Cost Assessment - Water
Table ES-2 is a summary of the projected costs related to the water system over the study
period including the next 5 years It shows that the average annual cost of managing the water
system is approximately $306 million over the next 24 years compared to current (2016)
annual costs of approximately $205 million Debt repayment accounts for 3 of the annual
costs Operations cost are estimated to be approximately $76 million (25) and the capital
costs $39 million (13) These are fixed costs that account for approximately 41 of the total
annual costs The purchase of water from the Region is estimated to be approximately $181
million (59) of the overall net cost over the study period These are variable costs because of
the Regionrsquos rate structure for water treatment which is 100 volumetric However most of the
Regionrsquos water treatment costs are also fixed Therefore if the Region were to change its
current rate structure then most of Regionrsquos cost would become a fixed cost to the City The
average annual full cost of service is approximately $220 million over the next 5 years
ES-2 Average Annual Full Cost of Water System
iii DFA Infrastructure International Inc
-
-
-
-
Cost Component
(Water) 2016 2016 ()
Average ($)
(2016 2020)
Average ()
(2016 2020)
Average ($)
(2016 2039)
Average ()
(2016 2039)
Capital Reserve $ 2777481 14 $ 3100679 14 $ 3962470 13
Transfers
Regional Charges $12303913 60 $13058563 59 $18083887 59
Operating $ 5466741 27 $ 5811017 26 $ 7580721 25
Expenses
$ Debt Repayment 0 $ 11417 0 $ 972520 3
-
Total $20548135 $21981676 $ 30599598
City of Waterloo Water amp Sanitary Sewer Rate Design Study Final Report amp Water Financial Plan No 112-301
April 1 2016
The projected costs and net revenue requirements for each year over the next 24 years are
used as the basis for developing the rates The projected annual net full costs of managing the
water system over the period are presented in Appendix F
Table ES-3 is a summary of the projected costs for the sanitary sewer system over the study
period It shows that the average annual cost of managing the sanitary sewer system is
approximately $383 million over the next 24 years compared to 2016 costs of approximately
$245 million The annual transfers to reserve are expected to decrease from approximately
$32 million in 2016 to an average annual amount of approximately $29 million over the next
24 years as most of the sanitary sewer system needs are beyond 2035 There are currently no
debt related costs based on the Cityrsquos current capital needs However debt will play a future
role in the long-term capital financing strategy for the sanitary sewer network and is estimated
at approximately $052 million (1) of annual costs Operations cost are estimated to be
approximately $59 million (15) and the capital costs $29 million (8) These are fixed costs
that account for approximately 24 of the total annual costs The treatment of wastewater by
the Region is estimated to be approximately $29 million and accounts for 76 of the overall net
cost These are variable costs because the Regionrsquos current rate structure for wastewater
treatment is 100 volumetric However most of the treatment costs are fixed Therefore if the
Region were to change its current rate structure then most of Regionrsquos cost would become a
fixed cost to the City
The projected costs and net revenue requirements for each year over the next 24 years are
used as the basis for developing the rates The projected annual net costs of managing the
sanitary sewer system over the period are presented in Appendix F
Table ES-3 Average Annual Full Cost of Sanitary Sewer System
iv DFA Infrastructure International Inc
Cost Component
(Sanitary Sewer) 2016 2016 ()
Average ($)
- (2016 2020)
Average ()
- (2016 2020)
Average ($)
- (2016 2039)
Average ()
- (2016 2039)
Capital Reserve $ 3227783 13 $ 2954049 11 $ 2895828 8
Transfers
Regional Charges $16248249 66 $18382061 70 $28981774 76
Operating Expenses $ 5057612 21 $ 5083741 19 $ 5915288 15
Debt Repayment $ - 0 $ - 0 $ 524342 1
Total $24533644 $26419851 $38317232
City of Waterloo Water amp Sanitary Sewer Rate Design Study Final Report amp Water Financial Plan No 112-301
April 1 2016
ES-5 Financing the System Costs
The existing rate structure plus two (2) alternative structures are considered for cost recovery
based on the guiding principles and feedback received from the Council Workshop and Public
Open House
bull Option 1 Continue using the existing rate structure and develop the rates required
for full cost recovery However one of the main issues identified is the increased risk
of not collecting sufficient rate revenues to fully offset the cost of service because
94 of the revenues depend on water consumption This can result in annual
deficits if not addressed
bull Option 2 A Sanitary Sewer Service Charge is introduced and 15 of the respective
water and sanitary sewer system revenue requirements would be recovered from
the respective service charges
bull Option 3 An inclining block rate structure is introduced Under this option higher
Water and Sanitary Sewer Rates would apply as consumption increases The
features of this structure include the following for both water and sanitary sewer
- A Bi-Monthly Service Charge that includes consumption of 14 msup3 for no
additional volumetric rate
- A First Consumption Block (Block 1) for bi-monthly consumption greater than
14 msup3 but not to exceed 34 msup3
- A Second Consumption Block (Block 2) for bi-monthly consumption greater
than 34 msup3
Table ES-4 shows the potential cost impacts of each option to the various customer types by
moving from 2018 to 2019 rates and charges It is important to note that the change in cost in
2019 is a one-time adjustment to reflect the change in rate structure and full cost recovery
Option 1 is projected to have a relatively consistent cost impact to all customer classes ie
700-751 in 2019 Option 2 is projected to have a much greater cost impact on the
residential sector (2619 for residential small and 1347 for average residential customers)
than on the non-residential sector Large commercial and industrial customers would benefit
from reductions of 375 to 598 Option 3 is projected to result in reductions to the small
and average residential customers (approximately 641 and 364 respectively) but would
result in major increase to the other large customer classes ranging from approximately 2087
to 3248 for the Residential Small Apartments and Non-Residential Customers These are
significant increases that would require more specific consultation with the impacted customer
classes prior to considering implementation Under all three (3) options the annual increases
beyond 2019 would be approximately 3-5 for all customer classes ie after the 2019 increase
and rate structure changes are made and become the new baseline
v DFA Infrastructure International Inc
City of Waterloo Water amp Sanitary Sewer Rate Design Study Final Report amp Water Financial Plan No 112-301
April 1 2016
Table ES-4 Annual 2019 vs 2018 Costs to Customers
Description 2018 Option 1
(2019)
Option 2
(2019)
Option 3
(2019)
Small Residential - Single Family Homes
Meter Size - 15 mm (Equivalency Unit - 100)
Average Consumption - 120 msup3year
Annual Increase to Total Bill () 7 26
Annual Increase to Total Bill ($) $3758 $14059
Annual Bill ($) $53676 $57434 $67735
-6
-$3443
$50233
Average Residential - Single Family Homes
Meter Size - 15 mm (Equivalency Unit - 100)
Average Consumption - 204 msup3year
Annual Increase to Total Bill () 7 13
Annual Increase to Total Bill ($) $6382 $11934
Annual Bill ($) $88620 $95002 $100554
-4
-$3223
$85397
Residential - Small Apartments
Meter Size - 25 mm (Equivalency Unit - 202)
Average Consumption - 1060 msup3year
Annual Increase to Total Bill () 7 2
Annual Increase to Total Bill ($) $33125 $7706
Annual Bill ($) $448544 $481669 $456250
23
$102687
$551231
Small Commercial and Industrial
Meter Size - 40 mm (Equivalency Unit - 369)
Average Consumption - 1215 msup3year
Annual Increase to Total Bill () 7 6
Annual Increase to Total Bill ($) $37983 $32403
Annual Bill ($) $519312 $557295 $551715
32
$168648
$687960
vi DFA Infrastructure International Inc
Description 2018 Option 1
(2019)
Option 2
(2019)
Option 3
(2019)
Large Commercial and Industrial
Meter Size - 50 mm (Equivalency Unit - 462)
Average Consumption - 8227 msup3year
Annual Increase to Total Bill () 7 -4 23
Annual Increase to Total Bill ($) $256961 -$128984 $803285
Annual Bill ($) $3439672 $3696634 $3310689 $4242957
Largest Commercial and Industrial
Meter Size - 50 mm (Equivalency Unit - 462)
Average Consumption - 192000 msup3year
Annual Increase to Total Bill () 8 -6 21
Annual Increase to Total Bill ($) $5996030 -$4776829 $16668939
Annual Bill ($) $79889376 $85885406 $75112547 $96558315
City of Waterloo Water amp Sanitary Sewer Rate Design Study Final Report amp Water Financial Plan No 112-301
April 1 2016
ES-6 Conclusions and Recommendations
Based on the information reviewed and analyses completed the following are the main
conclusions
1 The average annual full cost of managing the Cityrsquos water system over the study period
(next 24 years) is anticipated to be $306 million compared to current (2016) annual costs
of approximately $205 million Therefore water rate and service charge increases are
necessary to ensure that the system costs are fully funded and financially sustainable over
the long-term as required by O Reg 45307
2 The Regionrsquos Charges estimated at $181 million (annual average cost) for water treatment
represent the largest portion of system costs (59) over the next 24 years Contributions
to the capital reserve account for $39 million (13) OampM activities related to the Cityrsquos
operations account for $76 million (25) and debt repayment accounts for $097 million
(3)
3 A water infrastructure funding gap of approximately $33 million over the next 20 years
would continue to exist if rates and service charges are not adjusted to generate sufficient
funding levels
4 The financial statements for the water system prepared based on the results of the ratestudy analyses and projections indicate the following
vii DFA Infrastructure International Inc
City of Waterloo Water amp Sanitary Sewer Rate Design Study Final Report amp Water Financial Plan No 112-301
April 1 2016
- The accumulated surplus is projected to increase from approximately $726
million in 2016 to approximately $863 million by 2021
- The operating surplus ratio is projected to decrease from 15 in 2016 to 12 by
2021
- The cash position is projected to increase from $68 million in 2016 to $72
million in 2021
These indicate that the financial outlook for the water system over the 6-year period 2016
to 2021 is good
5 The average annual full cost of managing the Cityrsquos sanitary sewer system over the study
period (next 24 years) is anticipated to be $383 million compared to 2016 costs of
approximately $245 million Therefore sanitary sewer rate increases are necessary to
ensure that the system costs are fully funded and financially sustainable over the long-
term
6 The Regionrsquos Charges estimated at $29 million (annual average cost) for wastewater
treatment represent the largest portion of system costs (76) over the next 24 years
Contributions to the capital reserve account for $29 million (8) OampM activities related
to the Cityrsquos operations account for $59 million (15) and debt repayment accounts for
$05 million (1)
7 The current funding levels are sufficient for meeting the projected needs over the next 20
years However an infrastructure funding gap in excess of $72 million is projected beyond
2035 to 2065 Debt financing should be considered as part of the funding strategy to
address this infrastructure funding gap which is projected to occur just beyond the study
period
8 The financial statements for the sanitary sewer system prepared based on the results of
the rate study analyses and projections indicate the following
- The accumulated surplus is projected to increase from approximately $1139
million in 2016 to approximately $1265 million by 2021
- The operating surplus ratio is projected to decrease from 17 in 2016 to 4 by
2021
- The cash position is projected to increase from $137 million in 2016 to $182
million in 2021
These indicate that the financial outlook for the sanitary sewer system over the 6-year
period 2016 to 2021 is good
9 Based on a qualitative review all options would provide the level of funding to be fully
sustainable over the long-term Although Option 3 is best from a water conservation and
user pay guiding principle perspective it has significant disadvantages including but not
limited to
viii DFA Infrastructure International Inc
City of Waterloo Water amp Sanitary Sewer Rate Design Study Final Report amp Water Financial Plan No 112-301
April 1 2016
- Revenue uncertainty resulting from conservation d ue to the higher Block 2 rate
- Potentially high impacts (201 to 325 increases) to the non-residential
customers that m ay affect the attraction and retention o f b usiness These levels
of increases are significant and w ould r equire further dialogue with t he business
community and volume data analysis prior to confirming the thresholds for each
block and t he factor to be used f or setting the Block 2 rate and
- The risk of shifting a much larger portion o f costs to the residential sector should
business customers relocate or discontinue operations
Option 2 offers the most predictable revenues and would ensure that at least 15 of the
annual water revenues would be guaranteed while providing sufficient incentive for
customers to conserve
Option 1 still offers a fair and reasonable rate structure because the amount paid varies
almost directly with consumption due to the low fixed water charges (none for sanitary
sewer) Under Option 1 from a high level equity perspective the residential and non-
residential sectors pay their fair share Residential customers consume approximately
55 of the water and contribute 55 of the annual revenue while the non-residential
consumers account for the remaining 45 of consumption and revenues The major
disadvantage of the existing rate structure is the low level of revenue stability as only a
marginal amount of the annual revenue is collected via fixed fees This lack of revenue
stability will be offset to some extent by the introduction of the rate stabilization
reserves Therefore Option 1 could be remain a viable option moving forward should
Council not wish to proceed with Option 2 due to the large impact to the small and
average residential customers
11 Recommendations
The following are the primary recommendations for consideration by the City
10 Implement the rate structure described as Option 2 in this report effective 2019 to achieve
full cost recovery and ensure that 15 revenue recovery from the Water and Sanitary
Sewer Service Charges This would provide the best level of revenue stability compared to
the other options However if the potential cost increases to the small and average
residential customers under this option is of concern then it would be reasonable to
maintain the existing rate structure (Option 1) provided that the new rate stabilization
reserve funds discussed in this report are established The funds that would be available
from these reserves would reduce the financial risks due to revenue volatility
11 Increase transfers to the Water Capital Reserve Fund to the levels noted in Section 612 of
this report and included in Appendix D to meet the minimum target balance of 1 of
asset value adjusted for annual inflation each year subject to annual reviews of the water
systemrsquos asset needs to fully fund the capital requirements
ix DFA Infrastructure International Inc
City of Waterloo Water amp Sanitary Sewer Rate Design Study Final Report amp Water Financial Plan No 112-301
April 1 2016
12 Maintain transfers to the Sanitary Sewer Capital Reserve Fund at the levels noted in
Section 622 of this report and included in Appendix D to meet the minimum target
balance of 1 of asset value adjusted for annual inflation each year subject to annual
reviews of the sanitary sewer systemrsquos asset needs to fully fund the capital requirements
13 Utilize debt financing in the near term to help address the existing water capital shortfall
and sanitary sewer capital shortfall projected in the longer term in an effort to reduce the
burden placed on the rates
14 Establish a separate rate stabilization reserve fund for both water and sanitary sewer to be
used for offsetting any deficits and stabilizing rates and service charges These reserves to
be phased-in at a rate of 1 of annual operating cost from 2019-2023 until the target
balance of 5 of annual revenues is achieved
15 Continue to take steps to identify and address the causes of non-revenue water and inflow
and infiltration to the sanitary sewer system
16 That the OReg 45307 Water System Financial Plan No 112-301 including the Financial
Statements contained herein be approved by Council and submitted to the Province of
Ontario on or before June 1 2016 in accordance with the Drinking Water System Licence
renewal requirements and O Reg 45307
That a copy of this document entitled ldquoWater and Sanitary Sewer Rate Design Final
Report amp Water Financial Plan No 112-301rdquo be posted on the Cityrsquos website
(httpwwwwaterloocaratereview) and made available to the public at no charge
17 That the Sanitary Sewer System Financial Plan including the Financial Statements
contained herein be received by Council
18 The City should actively pursue Grant funding opportunities based on recent Federal
Budget announcements to increase funding to municipalities for infrastructure and lsquogreenrsquo
projects
x DFA Infrastructure International Inc
City of Waterloo Water amp Sanitary Sewer Rate Design Study Final Report amp Water Financial Plan No 112-301
April 1 2016
Table of Contents
1 Introduction 2
11 Background 212 Purpose 3
2 Regulatory Requirements 3
21 Provincial Regulations 322 City of Waterloo By-laws 5
3 Methodology 5
31 Guiding Principles 532 Study Components 6
4 Stakeholder Feedback 8
41 Committee of the Whole (COW) Feedback 841 Customer Feedback 11
5 Existing Systems 11
51 Water System 1152 Sanitary Sewer System 1153 Customer Growth 1154 Water Volumes 1255 Wastewater Volumes 13
6 Cost of Services 14
61 Cost Components 1461 Full Cost Assessment ndash Water System 19
611 Water System Capital Costs 19612 Water System Reserve Fund Requirements20613 Debt Related Costs 21614 Water System Operations amp Maintenance (OampM) Cost 21615 Net Full Cost of Water System 22
62 Full Cost Assessment ndash Sanitary Sewer System 23621 Sanitary Sewer System Capital Costs 23622 Sanitary Sewer Reserve Fund Requirements 24623 Debt Related Costs 25624 Sanitary Sewer System Operations amp Maintenance (OampM) Cost 25625 Net Full Cost of Sanitary Sewer System 27
7 Financing the Water amp Sanitary Sewer System Costs 28
71 Sources of Financing 2872 Existing Rate Structure amp Rates 29
721 Service Charges 30722 Uniform Consumption Rate 31
xi DFA Infrastructure International Inc
City of Waterloo Water amp Sanitary Sewer Rate Design Study Final Report amp Water Financial Plan No 112-301
April 1 2016
73 Alternative Rate Structures amp Rates 31731 Rate Structure Option 1 ndash Existing Structure 32732 Rate Structure Option 2 ndash 15 of Revenue from Service Charges33733 Rate Structure Option 3 ndash Inclining Block Rate Structure 35734 Potential Customer Impacts38735 Options Analysis amp Preferred Option 42
8 OReg 45307 Water System Financial Plan No 112-301 47
81 Tangible Capital Assets (TCA) Analysis 4782 Financial Statements 48
821 Statement of Financial Position 49822 Statement of Operations50823 Statement of Cash Flow 52824 Lead Service Pipe Removal52
9 Sanitary Sewer System Financial Plan 54
91 Tangible Capital Assets (TCA) Analysis 5492 Statement of Financial Position 5593 Statement of Operations 5794 Statement of Cash Flow 58
10 Conclusions and Recommendations 60
101 Conclusions 60102 Recommendations 62
References
Appendices
Appendix A Excerpt of City of Waterloo By-Law 2016-001
Appendix B Water amp Wastewater Volumes and Growth Projections
Appendix C Projected Capital Budget Requirements
Appendix D Projected Reserves Continuity Schedules
Appendix E System Costs and Revenue Requirements
Appendix F Projected Net Full Cost of Service
Appendix G Annual Cash-Flows
Appendix H Requirements of Ontario Regulation 45307
Appendix I Service Charges amp Rates Projections
xii DFA Infrastructure International Inc
City of Waterloo Water amp Sanitary Sewer Rate Design Study Final Report amp Water Financial Plan No 112-301
April 1 2016
Tables
Table 3-1 Rate Study Data Sources 7 Table 4-1 Council Feedback 9 Table 5-1 Water Volume Projections (2016-2021) 12 Table 5-2 Sanitary Sewage Volume Projections (2016-2021) 13 Table 6-1 Cost R elated A ssumptions 16 Table 6-2 Operating and Maintenance Costs (Water) 21 Table 6-3 Average Annual Full Cost o f Water System 23 Table 6-4 Operating and M aintenance Costs (Sanitary Sewer) 26 Table 6-5 Average Annual Full Cost o f Sanitary Sewer System 28 Table 7-1 Funding Sources 29 Table 7-2 Meter Equivalent R atios 30 Table 7-3 Existing (2016) Water amp Sanitary Sewer Rates and Charges 31 Table 7-4 Projected S ervice Charges amp Rates ndash Option 1 33 Table 7-5 Projected W ater Service Charges amp Rates - Option 2 34 Table 7-6 Projected S anitary Sewer Service Charges amp Rates ndash Option 2 34 Table 7-7 Projected W ater Service Charges amp Rates ndash Option 3 37 Table 7-8 Projected S anitary Sewer Service Charges amp Rates ndash Option 3 38 Table 7-9 Number of C ustomers in Each Consumption Block ( Option 3 ) 39 Table 7-10 Annual 2019 vs 2018 Costs to Customers 40 Table 7-11 Annual 2019 vs 2018 Costs to Customers 41 Table 7-12 Qualitative Analysis of R ate Options 43 Table 8-1 Asset Amortization a nd 2015 Net Book Value (NBV) 48 Table 8-2 Statement of F inancial Position 51 Table 8-3 Statement of O perations 52 Table 8-4 Statement of C ash Flow 53 Table 9-1 Asset Amortization a nd 2015 Net Book Value (NBV) 55 Table 9-2 Statement of F inancial Position 57 Table 9-3 Statement of O perations 58 Table 9-4 Statement of C ash Flows 59
Figures
Figure 6-1 Capital Funding Gap ( in $ 2015) ndash Water 19 Figure 6-2 Capital Funding Gap ( in $ 2015) ndash Sanitary Sewer 24
xiii DFA Infrastructure International Inc
City of Waterloo Water amp Sanitary Sewer Rate Design Study Final Report amp Water Financial Plan No 112-301
April 1 2016
1 Introduction 11 Background
The City of Waterloo (City) owns and operates a water distribution system and a sanitary
sewage (wastewater) collection system that service approximately 131000 residents The City
is responsible for ensuring that these systems are financially sustainable over the long-term
The delivery of water and sanitary sewage collection services in the Waterloo Region is a two-
tier structure whereby the Region of Waterloo (the Region) is responsible for water treatment
and transmission and wastewater treatment The Area Municipalities purchase water and
wastewater treatment services from the Region and are responsible for the water distribution
services to and sanitary sewage collection from their respective customers
The Regionrsquos annual charges to the City for water and wastewater treatment services are based
on actual water volume supplied to the City and the wastewater volume treated These are
calculated by applying the respective Regional water and wastewater volumetric rates to the
water and wastewater volumes as measured by the Region The Region is the ldquowholesalerrdquo and
the City is the ldquoretailerrdquo of water and wastewater services in the City of Waterloo Therefore
the Regionrsquos charges are a major part of the Cityrsquos annual service delivery costs The Regionrsquos
charges are more fully explained in Section 661 Cost Components Service
The total cost of the Cityrsquos water distribution and sanitary sewage collection services including
payments made to the Region are recovered from daily operating (non-rate) revenues (eg
administrative fees etc) and through direct billing to customers (rate revenues) The Citys
water bill to customers is comprised of monthly service charges based on meter size for water
plus consumption charges based on the respective water and sanitary sewage uniform rate per
cubic metre for volume of water consumed The sanitary sewer portion of the bill does not
include monthly service charges These revenues are required to cover the full costs of the
managing the water and wastewater systems including annual operating and capital costs and
long-term asset renewal costs net of any non-rate revenues However there is an increasing
risk to revenue recovery because consumption is volatile while many of the system costs are
fixed Consumption in recent years has been trending downwards despite continued growth
Therefore a more stable rate structure is required to improve the level of revenue recovery
over the long-term Accordingly there is a need for the City to update its rate structures and
rates to ensure that it remains on course to sustainable system financing The City is also
required to prepare and submit an updated Water System Financial Plan (No 112-301) to meet
the requirements of the Drinking Water Quality Management System as defined under OReg
45307 for renewal of its water distribution system licence
2 DFA Infrastructure International Inc
City of Waterloo Water amp Sanitary Sewer Rate Design Study Final Report amp Water Financial Plan No 112-301
April 1 2016
12 Purpose
The purpose of the rate study is to
bull Identify the full cost of services for the Cityrsquos drinking water and sanitary sewer systems
based on the most recent information
bull Develop water and sanitary sewer rate structures that would not only recover the full
cost of delivering these services but also provide sustainable financing over the long-
term and address the issue of declining water consumption and revenue stability
bull Prepare an updated Water System Financial Plan (No112-301) in accordance with the
requirements of OReg 45307 for the renewal of the licence for the Cityrsquos water
distribution system The existing licence expires on July 1 2016 and submission of the
financial plan as part of the licence renewal application to the Ministry of the
Environment (MOE) is required by June 1 2016 and
bull Prepare a Sanitary Sewer System Financial Plan similar to that required for water under
OReg 45307
2 Regulatory Requirements 21 Provincial Regulations
The primary Provincial legislation governing drinking water and sanitary sewer services include
the following
bull The Environmental Assessment (EA) Act 1990
bull The Environmental Protection (EP) Act 1990
bull The Safe Drinking Water Act 2002
bull The Municipal Act 2001
bull The Development Charges Act 1997
bull The Sustainable Water amp Sewer Systems Act 2002 and
bull The Water Opportunities amp Conservation Act 2010
The first two (2) set out the technical requirements related to service delivery The EA Act
applies to expansion of existing facilities and establishment of new capacity such as the
installation of new pipes The EP Act establishes the minimum requirements for the operations
of water and sanitary systems in terms of the potential environmental impacts
The Safe Drinking Water Act 2002 (SDWA) has significant implications to the daily water system
operations as it sets out the water sampling and other requirements (in OReg 17003) for
ensuring that the water delivered to consumers is high quality and safe for consumption This
Act has been a major influence over the past decade in terms of adjustments to operational
practices and quality expectations regarding both the Region and the City operations In
addition there is also a requirement under this Act (OReg 18807) for drinking water providers
3 DFA Infrastructure International Inc
City of Waterloo Water amp Sanitary Sewer Rate Design Study Final Report amp Water Financial Plan No 112-301 April 1 2016
to establish a Drinking Water Quality Management System (DWQMS) and obtain a licence for their respective water systems As part of this DWQMS and as required under O Reg 45307 (Financial Plans Regulation) operating authorities must submit a financial plan in order to renew their drinking water system licences These requirements are further described in Section 8 - OReg 45307 Water System Financial Plan No 112-301 There are also many other regulations and guidelines that deal with design and operation standards that mandate certain activities be undertaken as part of service delivery
The Municipal Act also sets out the financial requirements for managing the water and sanitary sewer systems including the assessment and recovery of full costs The Municipal Act Part VII Section 293 requires municipalities to establish reserves for dealing with long-term liabilities This applies directly to the pipe networks and the future liabilities associated with their age and condition The Municipal Act also permits the City to establish fees for cost recovery and requires public input prior to any fee adjustments The Development Charges Act and regulations establishes the requirements for the recovery of portions of future growth related capital expenditures to be incurred by the City
The Sustainable Water amp Sewer Systems Act 2002 (SWSSA)
The Sustainable Water and Wastewater Systems Act 2002 (SWSSA) was established based on the recommendations made by Justice OrsquoConnor on improvements to the management and operation of water and wastewater systems Under the SWSSA municipalities are required to submit reports on the full cost of service and method of cost recovery to the Province of Ontario as follows
A report prepared by a Professional Engineer identifying the full cost of water and sanitary sewer services
A report identifying a sustainable method by which the full cost would be recovered
The comments made by the Cityrsquos Auditor following a review of both reports and
Copies of Council resolutions accepting the recommendation of reports
Regulations under the SWSSA are still pending However these requirements have evolved over the years into best practice approaches taken by municipalities for sustainable water and sanitary sewer financial planning
The Water Opportunities and Conservation Act 2010 (WOA)
The WOA was enacted in November 2010 This legislation promotes water conservation and requires municipalities to prepare the following reports
Water conservation plans
Sustainability plans for water sanitary sewage amp stormwater management and
4 DFA Infrastructure International Inc
City of Waterloo Water amp Sanitary Sewer Rate Design Study Final Report amp Water Financial Plan No 112-301
April 1 2016
bull Asset management plans
Financial plans are required as a component of the water and sanitary sewer sustainability and
asset management plans Therefore more municipalities are now preparing sanitary sewer
financial plans as a best practise These financial plans that are similar to those required for
water systems in accordance with OReg 45307
22 City of Waterloo By-laws
By-Law 2016-001 establishes the Cityrsquos 2016 to 2018 water and sanitary sewer rates and
charges to its customers The rates and charges will be updated in 2019 through an update of
By-Law 2016-001 Excerpts of the by-law related to the drinking water and sanitary sewer rates
and charges are included in Appendix A
3 Methodology
This section outlines the study methodology which considers the feedback received from City
Council and customers as further described in Section 4
31 Guiding Principles
The water and sanitary sewer rate structure design is based on the guiding principles noted
below These reflect the feedback received from Council and customers described in Section 4
1 Full Cost Recovery All costs are to be recovered through the utility rates
2 Revenue Stability Provide stable and adequate annual revenue to minimize the
occurrence of annual deficits
3 User Pay Recover more revenue from those who use more water
4 Fairness and Equity Ensure to the extent possible that each customer class pays
its fair share with minimal cross subsidization
5 Uniform Rate Structure Rate structure to remain a uniform volumetric
(consumption) rate with no inclining or declining block (ie same consumption
rate for all users) However a rate option based on an inclining block rate
structure should be developed for further consideration
6 Water Conservation Water rate to be designed to facilitate ongoing water
conservation
7 Capital Financing To be through a combination of reserve rates debt (in accordance with the Cityrsquos debt policy)
8 Ease of Administration Rate calculations are to be transparent and easily
explainable to customers Rate structure must be compatible with existing billing
software capabilities and minimize costs due to rate structure changes
9 Affordability Customer affordability and assistance programs to be considered
as part of the study
5 DFA Infrastructure International Inc
City of Waterloo Water amp Sanitary Sewer Rate Design Study Final Report amp Water Financial Plan No 112-301
April 1 2016
32 Study Components
This study consists of three (3) main parts
bull Full Cost of Service This identifies the full costs (net of non-rate revenues) associated
with managing the water and sanitary sewer systems over a twenty-four (24) year study
period from 2016 to 2039
bull Rate Structure Alternatives (ie Full Cost Recovery) This identifies the rate structure
alternatives and the preferred option for recovery of costs (ie a revenue plan) through
proposed new rate structures and rates and charges to customers and
bull OReg45307 Financial Plans Section 8 presents the Water System Financial Plan (No
076-301) financial statements and other information required to meet the requirements
of OReg 45307 The financial statements are based on the information developed as
part of the full cost and revenue analyses completed for the rate study Similar financial
statements are also presented for the sanitary sewer system in Section 9
Full Cost Methodology
Calculation of the Cityrsquos full cost of managing the water and wastewater systems is based on
estimating and projecting the respective annual costs related to each system over the study
period These include
bull Annual operations and maintenance (OampM) costs related to water distribution and
sanitary sewage collection
bull Regional charges for water supply and wastewater treatment
bull Watermain and sewer replacement costs over the twenty four (24) year period based on
the renewal needs according to life expectancy as identified in the Cityrsquos Asset
Inventory
bull Capital funding for growth related projects over and above funding available through
the Development Charges Reserve Fund and direct contributions by developers as
presented in the Cityrsquos Capital Budget Forecast
bull Funding required for studies and non-growth operational improvement projects as
presented in the Cityrsquos Capital Budget Forecast
bull Annual contributions to a capital reserve fund for financing capital projects with a
minimum target of 1 of asset replacement value
bull Annual contributions to a rate stabilization reserve fund to offset major peaks and
valleys in rate requirements due to annual fluctuations in consumption as a result of
unpredictable weather patterns with a target of 5 phased in at a rate of 1 per year
beginning in 2019 over a 5-year period such that the 5 target is achieved by 2023 and
bull Repayment of existing and proposed future debt Debt will be utilized to address the
water network capital backlog and sanitary sewer system needs in accordance with the
Cityrsquos debt policy (maximum 30 of project cost to be funded by debt)
6 DFA Infrastructure International Inc
City of Waterloo Water amp Sanitary Sewer Rate Design Study Final Report amp Water Financial Plan No 112-301
April 1 2016
The assumptions made with respect to these cost items are presented in Table 6-1 The annual
costs are calculated in 2015 dollars and inflated over the study period
Cost Recovery Methodology
The fundamental components of the Cityrsquos current rate structure ie a fixed monthly charge
according to the customerrsquos meter size plus a consumption rate per cubic metre is maintained
as the basis for the water and sanitary sewer rate structures However options for improved
revenue security are provided and assessed against the guiding principles to identify a
preferred option Prior to completing this part of the study feedback from Council and
customers was obtained and incorporated into development of the options The base option is
the Cityrsquos 2015 rate structure with annual increases to the respective rates for full cost
recovery Two (2) additional options include adjusting the rate structure such that
approximately 15 of the annual revenue would be generated by the fixed charges and an
inclining block structure to promote conservation The current rate structure and rates for 2016
to 2018 as approved by Council under By-Law 2016-001 would continue to apply Therefore the
implementation year for the preferred rate structure option is 2019 The respective water and
sanitary rates over the study period and potential impacts to customers under each option are
modeled using DFArsquos Financial Planning Model A more detailed description of the Cityrsquos
current rate structure and the rate options for cost recovery are presented in Section 7
Data Sources
The primary sources of data used to prepare this rate study are listed in Table 3-1 In addition
information was also developed from discussions with and input from the Cityrsquos staff as
required
Table 3-1 Rate Study Data Sources
7 DFA Infrastructure International Inc
Item Data Source
Asset Life Expectancy bull The Cityrsquos Water amp Wastewater Asset Inventory
bull The Cityrsquos Water amp Wastewater Asset Inventory
Asset Replacement Cost bull bull
Unit Prices Provided by the City
Cityrsquos 2016 Capital Budget and 10-Year Capital
Forecast
Net Book Value (2014) Depreciation Historical Cost etc
bull The Cityrsquos PSAB 3150 Data for Water amp Wastewater
bull Cityrsquos 2013-2014 record of Building Permit Activity amp
actual development
Customer Growth bull Development Charges Study
bull People and Jobs Forecast 2015 to 2029
bull The revenues noted in the 2016 to 2018 annual
operating budgets
Item Data Source
OampM Costs bull Cityrsquos 2016 Budget
bull Regionrsquos 2016 Projected Rates amp Charges
Non-Rate Revenues bull Cityrsquos 2016 Budget Operating
bull Cityrsquos 2016 Budget Operating
Non TCA Capital Projections bull Cityrsquos 2016 Capital Budget and 10-Year Capital
Forecast
Water amp Wastewater Treatment bull Cityrsquos Historical Records
Volumes bull Cityrsquos Water Supply Master Plan
Water Volume Sold to Customers bull Cityrsquos 2016 Operating Budget Data
Existing Debt bull There is no existing water or wastewater debt
City of Waterloo Water amp Sanitary Sewer Rate Design Study Final Report amp Water Financial Plan No 112-301
April 1 2016
4 Stakeholder Feedback
The study process included obtaining feedback from members of Council and customers
through the following
bull A workshop session held on February 22 2016 with members of Council (Committee of
the Whole)
bull A Public Open House held on February 25 2016 in conjunction with the AssetManagement Plan and Water Master Plan public meeting requirements
The comments and feedback received was used to refine the guiding principles reserve
strategies and rate structure options for consideration
41 Committee of the Whole (COW) Feedback
The workshop session involved a presentation to COW outlining background information on the
water and sanitary sewer systems and the projected cost of service over the next 24 years
Survey questions were completed by members of Council during the workshop An overview of
the feedback is provided in Table 4-1
8 DFA Infrastructure International Inc
City of Waterloo Water amp Sanitary Sewer Rate Design Study Final Report amp Water Financial Plan No 112-301
April 1 2016
Table 4-1 Council Feedback
Workshop Item Feedback
Guiding P rinciples
Council was asked to rate the importance of e ach principle bull There was overall support for all principles
bull Consideration should be given to financing
capital projects not only from the respective
water and sanitary sewer capital reserve
funds but also through the use of d ebt
bull Although there was general support for
maintaining a uniform volumetric rate
structure the feedback suggested that an
inclining block structure should also be
examined to support water conservation and
user pay
Rate Structure Options
Council was asked to rank four (4) potential rate structure
options that would facilitate higher portions of r evenue
recovery from the fixed charges versus the volumetric charge
for both water and sanitary sewer
bull Option 1The existing rate structure
bull Option 2 6 revenue recovery from the fixed charges bull Options 2 and 3 were the most preferred 94 from the volumetric charge bull Options 1 and 4 were the least preferred
bull Option 3 20 revenue recovery from the fixed charges
80 from the volumetric charge bull Option 4 40 revenue recovery from the fixed charges
60 from the volumetric charge
Capital Reserve Strategies
Council was asked to rank four (4) potential capital reserve
strategies
bull Option 1Target a minimum reserve balance of 1 of
asset replacement value bull Option 1 was the most preferred
bull Option 2 Target a minimum reserve balance of less than bull Option 4 was the least preferred
1 of a sset replacement value bull Preference for Options 2 and 3 were mixed
bull Option 3 Target a reserve balance of 2 of a sset
replacement value
bull Option 4 Target a reserve balance of greater than 2 of
asset replacement value
9 DFA Infrastructure International Inc
Workshop Item Feedback
Rate Stabilization Reserve Strategies
Council was asked to rank four (4) potential capital reserve
strategies
bull Option 1Target a minimum reserve balance of 5 of
annual operating costs
bull Option 2 Target a minimum reserve balance of less than
5 of annual operating costs
bull Option 3 Target a reserve balance of 10 of annual
operating costs
bull Option 4 Target a reserve balance of greater than 10
of annual operating costs
Implementation Strategies
Council was asked to indicate a preference for implementing
the new rate structure
bull As part of the Asset Management Plan Implementation
(estimated to be 2019 for the purposes of this study)
bull As part of the next Water Services Utility rate report
(2017)
Affordability Program
Council was asked to indicate a support for establishing a
region wide affordability program for water and sanitary
sewer
bull bull
bull
bull
bull
Option 1 was the most preferred
Option 4 was the least preferred
Preference for Options 2 and 3 were mixed
Implementation in 2019 to align with the
Asset Management Plan Implementation was
preferred
There was strong support for this initiative
City of Waterloo Water amp Sanitary Sewer Rate Design Study Final Report amp Water Financial Plan No 112-301
April 1 2016
The following were also confirmed
bull Use of debt financing for capital needs will be utilized for up to 30 of the estimated
annual capital needs Water and sanitary sewer projects are exempt from the City Debt
Management Policy (FC-009) However a maximum debt funding limit of up to 30 of
the annual capital funding needs was used for the purposes of this study and rate
forecast as per the policy debt limits This is seen as an acceptable debt levelstrategy in
accordance with the Council approved tax base debt policy
bull Targeting capital reserve balances to be minimum 1 of the estimated asset
replacement value adjusted each year for inflation
bull Targeting rate stabilization reserve balances of 5 of annual operating costs each year
bull Implementing the new rate structure in 2019
10 DFA Infrastructure International Inc
City of Waterloo Water amp Sanitary Sewer Rate Design Study Final Report amp Water Financial Plan No 112-301
April 1 2016
41 Customer Feedback
A single combined Public Open House was hosted to obtain feedback on the rate design study
asset management plan and the master plan Attendees had the opportunity to view
information on display boards indicate their preferences regarding the guiding principles and
provide written feedback on comment sheets There were approximately ten (10) attendees
not including staff representing mainly the residential customers There was general support for
the guiding principles and the need for higher levels of revenue stability Only one comment
sheet was returned indicating a willingness to pay more for less future risk with respect to
water and sanitary sewer assets
5 Existing Systems
51 Water System
The water distribution system is operated by the Cityrsquos operations staff with support from
external contractors and consultants as needed The City provides water directly to its
customers through its water distribution system which is fed from the Regionrsquos water supply
system The distribution system generally consists of approximately 431 kilometres of
watermain of various ages materials and sizes 30050 water meters 2429 hydrants and 3995
valves Water use is metered for almost all customers
52 Sanitary Sewer System
The sanitary sewer system is operated by the Cityrsquos operations staff with support from external
contractors and consultants as needed The collection system consists of approximately 407
kilometres of sewer mains of various ages 5991 manholes and 6 pumping stations that are
monitored by City staff using a Supervisory Control and Data Acquisition (SCADA) system
53 Customer Growth
According to the Cityrsquos billing records the number of water and wastewater customers in 2016
is 30182 and 29906 respectively The annual customer growth for both water and wastewater
is estimated to be 246 residential customers for the study period beginning in 2019This is
consistent with 2013-2014 building permits issued and is conservative from an additional
revenue generation perspective Projections contained in the Development Charges Study and
People and Jobs Forecast 2015-2029 are considered to be relatively high for the purposes of
the rate study and would likely result in an over estimate of future revenues Note that all
growth is assigned to residential customers ie single family homes with a 15mm water meter
to be conservative with the revenue projections Growth for the period 2016 to 2018 is
assumed to be zero to match the revenue projections contained in the Cityrsquos annual budgets
forecasted for this period Annually any actual growth achieved will be captured by staff as part
11 DFA Infrastructure International Inc
City of Waterloo Water amp Sanitary Sewer Rate Design Study Final Report amp Water Financial Plan No 112-301
April 1 2016
of the annual consumption patterns update Appendix B presents the customer growth
projections over the study period
54 Water Volumes
The Cityrsquos historical and projected water volumes to be supplied annually by the Region and
sold to customers over the study period are shown in Appendix B The estimated water
volumes to be purchased and sold each year over the next six (6) years are shown in Table 5-1
The projected treatment volumes are based on a rolling 5-year average calculation which
includes a 1 annual increase that accounts for additional demand due to growth The annual
volume of water to be purchased from the Region each year is projected to increase from
approximately 12285662 m3 in 2016 to 13177504 by 2039 based on the Regionrsquos Water
Supply Master Plan This includes water that is supplied by the City of Waterloo to the City of
Kitchener and Bridgeport on a charge back basis estimated to be approximately 14400 m3 in
2016
The volumes projected to be sold to customers are based on a rolling 5-year average
calculation which includes a 1 annual reduction until 2018 This accounts for ongoing
conservation efforts and the overall downward trend in consumption despite annual customer
growth However an increase in the volume sold is projected to begin in 2019 to account for
growth The annual increases due to annual growth are estimated to be approximately 43050
m3 per year based on annual growth of 246 new customers per year and an average
consumption of 175 m3 per customer projected for 2019 The annual volumes to be consumed
by (ie sold to) customers are estimated to be approximately 10354586 m3 in 2018 increasing
to 11257292 m3 by2039 These are the ldquorevenuerdquo volumes used to calculate the annual
revenue from the metered consumption The difference between the purchase volumes and
the consumption volumes is the ldquounaccounted forrdquo or non-revenue water volume
Table 5-1 Water Volume Projections (2016-2021)
Water Volumes 2016 2017 2018 2019 2020 2021
Volume to be
Purchased from the 12285662 12274432 12268381 12318894 12368688 12426243
Region (msup3)
Revenue Volume (msup3) 10535117 10451447 10354586 10397572 10440558 10483544
Non-Revenue Water 1750545 1822985 1913795 1921323 1928130 1942700
(msup3)
12 DFA Infrastructure International Inc
City of Waterloo Water amp Sanitary Sewer Rate Design Study Final Report amp Water Financial Plan No 112-301
April 1 2016
55 Wastewater Volumes
The sanitary sewage collected by the City is not measured at the source but is metered by the
Region at the wastewater treatment plant These volumes include sanitary sewage
contributions from customers (as estimated based on metered water consumption) and inflow
and infiltration (IampI) into the sanitary sewer system
The historical and forecasted volumes of wastewater to be treated by the Region annually over
the 24-year study period are also shown in Appendix B These are based on the Cityrsquos forecast
for the period 2016 to 2018 which reflects the historical rolling 5-year average The annual
volume of wastewater to be treated by the Region each year is projected to increase from
approximately 16358051 m3 in 2018 to 16063727 by 2039 This includes IampI volumes and
additional wastewater generation due to growth
The revenue volumes for sanitary sewer billing are the metered water volumes for those
customers that also have water services This method of applying the sanitary sewer rates to
the metered water consumption volumes for billing purposes is standard industry practise
because sanitary sewage is typically not metered by municipalities The annual revenue
volumes including new customer growth are estimated to be approximately 10208507 m3 in
2018 increasing to 11118605 m3 by 2039 Note that there are customers that receive water
services only Therefore the revenue volumes for sanitary sewage are different from the
revenue volumes for water because of the difference between the number water and sanitary
sewer customers The 2016 annual treatment volume is 16264573 m3 compared to the
estimated sanitary sewage volume generated by customers of 10325928 m3 ie assuming that
all water consumed b y customers would be returned t o the wastewater system
The estimated volumes to be treated each year over the next six (6) years are shown in Table
5-2
Table 5-2 Sanitary Sewage Volume Projections (2016-2021)
13 DFA Infrastructure International Inc
Wastewater
Volumes 2016 2017 2018 2019 2020 2021
Citys Volume to be
Treated by Region 16264573 16193060 16358051 16084050 15779218 16135790
(msup3)
Sanitary Sewage
Revenue Volume (msup3) 10325928 10279351 10208507 10251845 10295183 10338521
City of Waterloo Water amp Sanitary Sewer Rate Design Study Final Report amp Water Financial Plan No 112-301
April 1 2016
6 Cost of Services
The respective full cost of managing the Cityrsquos water and sanitary systems takes into account all
factors that have a bearing on the level of effort and costs required to ensure a safe and reliable
supply of potable water to customers and public health and environmental protection
regarding sanitary sewage over the long-term These include both current and future
considerations that would influence the cost of managing the systems throughout their
respective lifetimes which can be several decades for water and sanitary sewer systems
Examples include replacement and rehabilitation of the distribution pipe network and the
sanitary sewer mains The cost implications of some of these factors are more predictable and
therefore more readily estimated than those of other factors eg the Cityrsquos OampM cost for the
distribution system is more predictable than the cost of purchasing water from the Region due
to varying weather conditions and consumption patterns Similarly the cost of sanitary sewage
treatment tends to increase with wet weather but revenues may decline due to lower water
consumption
Higher costs are expected in the future as the water and sanitary sewage business environment
changes However the impact can be mitigated by fully understanding assessing and planning
for future system costs The following sections identify the main drivers of cost the
assumptions made in quantifying costs and an estimate of the full cost of managing the water
and sanitary sewer systems The period used for this assessment is twenty-four (24) years
(2016 to 2039)
The respective full cost of managing the water and sanitary sewer systems is the total operating
and capital costs less non-rate revenues which are the revenues that are routinely generated
each year through the daily operations These include administrative revenues such as service
fees for turn-off charges lateral installations etc but do not include the revenues generated by
the water and sanitary sewer rates (ie from the sale of water) Accordingly the ldquonetrdquo full cost
of service represents the amount to be recovered from customers through the water and
sanitary sewer rates
61 Cost Components
The costs components related to the water system include the following
bull Operations and Maintenance (OampM) Costs of the Water Distribution Systems This
includes the costs of administration pipe repairs and maintenance water meter
maintenance hydrant maintenance water service installations and maintenance
sampling and testing and regulatory reporting
bull Regional Charges for the Supply of Treated Water to the City The cost of water
treatment and supply as billed by the Region is based on a uniform volumetric rate This
cost would vary depending on consumption and water loss within the Cityrsquos system and
14 DFA Infrastructure International Inc
City of Waterloo Water amp Sanitary Sewer Rate Design Study Final Report amp Water Financial Plan No 112-301
April 1 2016
is calculated as the product of the actual (metered) water volume purchased by the City
and the Regionrsquos uniform water rate
bull Capital Expenditures Capital expenditures are incurred primarily to replace and or
rehabilitate existing water related infrastructure each year as part of the Cityrsquos asset
management program and increase system capacity to accommodate new growth The
costs associated with studies design and construction are included in the capital
expenditures The capital costs associated with growth are normally recovered through
developer contributions and financing from the Development Charges Reserve
established by the City However depending on the project a portion of development
related costs may be funded from the capital reserve Annual contributions to the
capital reserve are required to ensure that sufficient funds are available to finance
projects as needed
bull Debt Repayment This is an annual cost for the repayment of debentures issued to
partially or fully fund capital projects There are no existing water system related debts
to be repaid However the City does intends to finance up to 30 of the water capital
backlog through debt in accordance with its current debt management policy and
discussions with staff
The sanitary sewer system cost components are similar to those for water
bull Operations and Maintenance (OampM) Costs of the Sanitary Sewer System This includes
the costs of administration pipe repairs and maintenance manhole repairs and service
lateral installations maintenance amp repairs
bull Regional Charges for the Treatment of the Cityrsquos Wastewater The cost of wastewater
treatment as billed by the Region is based on a uniform volumetric rate This cost would
vary depending on the volume of wastewater including inflow and infiltration
generated by the City It is calculated as the product of the actual treated wastewater
volume (as metered by the Region) and the Regionrsquos uniform wastewater rate This cost
tends to increase with wet weather due to the higher IampI volume
bull Capital Expenditures Capital expenditures are incurred primarily to replace and or
rehabilitate existing sanitary sewer related infrastructure each year as part of the Cityrsquos
asset management program and increase system capacity to accommodate new growth
The costs associated with studies design and construction are included in the capital
expenditures Annual contributions to the capital reserve are required to ensure that
sufficient funds are available to finance projects as needed
bull Debt Repayment There is no existing sanitary sewer system related debt at this time
However the City does intends to finance up to 30 of future capital projects (beyond
2025) through debt in accordance with its current financial policy and discussions with
staff
The assumptions made with respect to these cost components are summarized in Table 6-1
15 DFA Infrastructure International Inc
City of Waterloo Water amp Sanitary Sewer Rate Design Study Final Report amp Water Financial Plan No 112-301
April 1 2016
Table 6-1 Cost Related Assumptions
16 DFA Infrastructure International Inc
Applicable Factor Assumptions Regarding Future Costs
Water System amp Sanitary Sewer bull The current OampM costs are reflective of regulatory requirements
System Operations and Maintenance There would be no significant increase in the level of effort required
to operate and maintain the water system in the future The 2016 to
2018 OampM costs are the budget amounts already approved by the
City for this period However an increase of 3 per year is allowed
for inflation and any minor adjustments that may be required due to
future regulatory changes from 2019 onward
bull The Cityrsquos annual contribution to capital and rate stabilization
reserves is typically included in the annual OampM costs However
these contributions would be adjusted to suit the capital
requirements and target reserve levels and would vary as needed
over the study period
Region of Waterloo Water Supply bull The Regionrsquos rate structure is 100 volumetric and would continue
Charges indefinitely
bull The Regionrsquos Uniform Rate would increase in accordance with the
rate projections provided by the Region - 2016 - 2017 - +39 - 2017 onward - +29
bull The annual volume of water to be supplied by the Region would be as
projected by the City (ie a 5-Year Historical Rolling Average less 1
per year until 2018 to account for the decline in consumption)
bull The Regionrsquos projected Uniform Rate is inclusive of annual amounts
that may be required to fund any future rebate program for low
income water customers Discussions are ongoing with the Region
Region of Waterloo Wastewater bull The Regionrsquos rate structure is 100 volumetric and would continue
Treatment Charges indefinitely
bull The Regionrsquos Uniform Rate would increase in accordance with the
rate projections provided by the Region as follows up to 2025 Rates
for 2026-2064 are currently outside the Regionrsquos 10 year forecast
window but thought to be reasonable estimates based on the current
wholesale trend
- 2016-2018 - +69 - 2019-2021 - +59 - 2022-2025 - +49 - 2026-2030 - +39 - 2031-2064 - +29
bull The annual volume of wastewater to be treated by the Region would
be as projected by the City (ie a 5-Year Historical Rolling Average)
bull The Regionrsquos projected Uniform Rate is inclusive of annual amounts
that may be required to fund any future rebate program for low
income sanitary customers
Applicable Factor Assumptions Regarding Future Costs
Water amp Sanitary Sewer Revenue
Volumes (Volume to be Sold to
Customers)
Effective Date of Annual Regional amp
City Water Rates
Annual Variations in Revenue
Volumes (Volume Consumed) Due to
Weather Conditions
Water Consumption and Sanitary
Sewage Increases Due to the Addition
of New Customers
New and Emerging Regulations and
Guidelines Related to Water Quality
and Sanitary Sewer Management
Existing Asset Preservation and
Renewal
bull
bull
bull
bull
bull
bull
bull
bull
bull
bull
bull
bull
bull
bull
Volume of water used to calculate the Cityrsquos annual water revenues
and rates from 2016 to 2018 is based on the Regions Supply Master
Plan A 1 decline in consumption is applied to the previous five year
average consumption to reflect conservation
The revenue water volumes from 2019 onward would increase 3
annually due to growth from 10354586 m in 2018 based on the
assumption that the decline would level off by 2018
Because of the difference between the number of water and sanitary
sewer customers the volume of water used to calculate the Cityrsquos
annual sanitary sewer revenues and rates is based on the Regions
Supply Master Plan The historical rolling 5-year average treated
volume is used to project volumes from 2016 to 2018
For the purposes of the study the annual Region and the City water
rates are assumed to take effect on January 1st each year
Annual variations in weather conditions are unpredictable Therefore
an annual allowance is required as contributions to separate rate
stabilization reserves for water and sanitary sewer to account for
potential fluctuations in revenue due to consumption variations The
target balance for each rate stabilization reserve would be equal to
5 of the Cityrsquos annual operating cost for each system and be phased-
in at a rate of 1 per year over the course of 2019-2023
There are approximately 30360 water customers and 29819 sanitary
sewer customers in 2016
No increase in customers is projected for 2016 to 2018 to match the
revenue assumptions in the Cityrsquos 2016 to 2018 budgets
Approximately 246 new residential customers would be added
annually from 2019 onward based realized growth from 2013 to 2014
(conservative assumption) 3
Residential customers would consume approximately 175 m per
customer based on the Cityrsquos 2018 consumption projection This is an 3
additional 43050 per year m
There would be no Non-residential customer growth (conservative
assumption)
The implications of the Safe Drinking Water Act and the Water
Opportunities Act have already been realized for the most part Any
further cost implications of emerging regulations would be taken into
account in the annual 3 increase for OampM costs
The timing of pipe and other asset replacement would be based on
age and life expectancies contained in the Citys Asset Inventory
Capital expenditures would also be driven by the Cityrsquos 10-year capital
forecast for the period 2016 to 2025
Water related asset backlog (ie replacements due as of 2015 or
City of Waterloo Water amp Sanitary Sewer Rate Design Study Final Report amp Water Financial Plan No 112-301
April 1 2016
17 DFA Infrastructure International Inc
Applicable Factor Assumptions Regarding Future Costs
New growth related infrastructure
Inflation
Capital Financing
Market Competition and Pricing
bull
bull
bull
bull
bull bull
bull
bull
bull
bull
earlier) is spread over a 21-year period starting in 2019
Sanitary sewer related asset backlog is assumed to be already
captured in the Citys capital replacement plan
The growth related capital projects are based on the information
contained in the Cityrsquos 2016 ndash 2025 capital budget forecast
All project costs that are due to be funded directly by developer
contributions and from DC Reserve Fund are not considered as direct
cost to the City ie only the net cost to the City is considered in the
future cost projections
The Inflation index is estimated at 3 per annum for construction
related costs
The City has no existing debt related to water and sanitary sewer
Future capital financing for addressing the water backlog will be
through a combination of capital reserves and debt financing as
indicated through Councilrsquos feedback in accordance with the Cityrsquos
debt management policy as recommended by staff
Future capital financing for sanitary sewer projects would also be
through a combination of capital reserves and debt (beyond 2025)
The City also plans to issue debentures to partially fund some growth
related projects
Third party funding is only considered where the funds are confirmed
to be available
All outsourced services will be secured through a competitive bid
process thereby benefiting from market pricing and competition Any
market price increases would be covered of by the annual inflation
assumption
The factors described in Table 6-1 have different cost implications Some are directly within the
Cityrsquos control while others are not (eg Regional rates water demand fluctuations due to
weather variations) depending on the factor For example there is flexibility with capital
expenditures as upgrades can be planned and timed to suit a particular budget strategy Lost
revenues due to unaccounted for water and costs related to demand fluctuations are more
difficult to control It is also assumed that expansion of the water and sanitary sewer systems
will be limited to within the existing approved service areas
City of Waterloo Water amp Sanitary Sewer Rate Design Study Final Report amp Water Financial Plan No 112-301
April 1 2016
18 DFA Infrastructure International Inc
City of Waterloo Water amp Sanitary Sewer Rate Design Study Final Report amp Water Financial Plan No 112-301
April 1 2016
61 Full Cost Assessment ndash Water System
611 Water System Capital Costs
The water system capital budget requirements over the study period are presented in Appendix
C This reflects the projects identified in the Cityrsquos 10-year Capital Budget Forecast in
conjunction with the replacement of existing water system assets based on the asset inventory
and life expectancies and age It should be noted that some of the projects identified in the 10-
year Capital Budget Forecast include asset replacement Therefore these projects were
rationalized with the projected asset replacement needs to ensure that there was no
duplication in the projections There is also an existing backlog of asset replacement
requirements related to the water system estimated at approximately $33 million (in 2015
dollars) based on life expectancy These capital needs are spread over the 21-year period from
(2019 to 2039 inclusive) for better affordability due to the magnitude of the costs
A comparison of the capital needs to the existing level of capital funding indicates that there is
a funding gap which is estimated to be approximately $128 million over the next 20 years
However beyond 2036 current funding levels appear to be sufficient as shown in Figure 6-1
The 2016 budget for existing asset replacement related capital expenditures is $3687134 This
annual amount needs to be increased over the next twenty (20) years to close the funding gap
If the capital investment is not increased in the short-term to the levels noted in Appendix C
then the funding gap would continue to exist beyond 2035 and the water system would not be
financially sustainable
Figure 6-1 Capital Funding Gap (in $2015) ndash Water
45000000
40000000
35000000
30000000
25000000
20000000
15000000
10000000
5000000
-2016 to 2025 2026 to 2035 2036 to 2045 2046 to 2055 2056 to 2065
Existing Asset Funding 33582130 33582130 33582130 33582130 33582130
Asset Replacement Summary 40453995 39517821 21299913 31184756 22362999
Appendix C also shows the projected sources financing for the annual expenditures Capital
financing will be through the capital reserve and debt (to a maximum 30) Other sources of
financing such as provincial and or federal grants are unpredictable and are therefore not
19 DFA Infrastructure International Inc
City of Waterloo Water amp Sanitary Sewer Rate Design Study Final Report amp Water Financial Plan No 112-301
April 1 2016
considered over the long-term However the City is encouraged to aggressively pursue these
funding opportunities as they become available to reduce the overall amount to be funded
from the rates and Water Capital Reserve Fund The reserve fund requirements are discussed in
Section 612
612 Water System Reserve Fund Requirements
There are two (2) reserve funds being recommended as part of this study
bull The Water Capital Reserve Fund and
bull The Water Rate Stabilization Reserve
Appendix D shows the projected continuity schedules for both reserves This shows the
transfers to and from the respective reserves and the opening and closing balances Reserves
are assumed to earn zero annual interest on balances
Water Capital Reserve Fund
The Water Capital Reserve Fund which had an opening balance of approximately $44 million
at the beginning of 2016 will be a source of financing along with debt for future projects This
requires that annual contributions be made to the Water Capital Reserve Fund to ensure that
sufficient funds are available particularly for the asset replacement rehabilitation projects
required over the long-term These annual contributions (to be raised through the water rates
each year) are generally projected to range between $28 million starting in 2016 to
approximately $48 million by 2027 The 2016 transfer includes an annual amount of
$1000000 from the Sanitary Sewer Capital Reserve Fund for repayment of a loan from water
The loan is expected to be fully repaid by 2019 The reserve closing balance is targeted to be a
minimum of 1 of the asset replacement value adjusted for inflation each year over the study
period The annual reserve balance is projected to be $45 million at the close of 2016
decreasing to approximately $34 million by 2019 and increasing again to approximately $38 by
2027
Water Rate Stabilization (Operating) Reserve Fund
The Water Rate Stabilization Reserve Fund is required to provide a source of funding to offset
any year-end operating deficits that may occur during the period and avoid unplanned rate
spikes in the subsequent year The annual contributions (to be raised through the water rates
each year) are based on maintaining a target balance of 5 of the total operating expenditures
ie the revenue requirements (approximately $12 million on average over 24 years) Transfers
to this reserve fund are targeted to begin in 2019 and phased in at a rate of 1 per year until
2023 Annual contributions over the 24-year period are projected to range between $0 in 2016
and $245241 depending on the reserve balance and its utilization
20 DFA Infrastructure International Inc
City of Waterloo Water amp Sanitary Sewer Rate Design Study Final Report amp Water Financial Plan No 112-301
April 1 2016
613 Debt Related Costs
There is no existing water system debt However based on feedback from Council the City will
utilize debt to finance future asset renewal projects which will tend to smooth the rates The
City also plans to incur some growth related debt to supplement the Water amp Sanitary
Development Charges Reserve Fund to be used to finance the growth portions of projects This
future growth related debt and resulting debt repayment does not affect the costs to be
recovered from the water rates but are considered in the financial statements included in
Section 8
614 Water System Operations amp Maintenance (OampM) Cost
The annual operating budget is based on the operations and maintenance needs of the water
system The annual budget reflects the costs as shown in Table 6-2 These costs include the
Regionrsquos charges for supplying water to the City but do not include transfers to reserves as the
capital related costs are addressed separately in Section 612 The OampM costs are offset by
non-rate revenues with the resulting net costs to be recovered from rates
The gross 2016 OampM cost including the Regionrsquos charges are estimated to be $178 million This
cost would be offset by $044 million in non-rate revenues for a Net OampM cost of approximately
$173 million The purchase of water from the Region budgeted to cost $123 million in 2016
accounts for a significant portion (approximately 60) of the Cityrsquos annual OampM costs
The annual OampM costs (except for the Regionrsquos charges) and the non-rate revenues are
assumed to increase by 3 each year to allow for inflation plus any operational changes that
may be required The Regionrsquos charges would increase based on the Regionrsquos projected uniform
rates and the volume of water supplied to the City The assumptions respecting the Regionrsquos
charges are noted in Table 6-1 Appendix E presents the gross operating costs non-rate
revenues and net costs to be recovered from users through the Citys fixed and consumption
charges
Table 6-2 Operating and Maintenance Costs (Water)
21 DFA Infrastructure International Inc
Operating and Maintenance Costs 2016 Budget Operating Expenditures
Water Administration $ 2704238
Water Meters
Water Meter ReplacementInstallation $ 354693
Hydrants $ 10621
Valves $ 12724
Water-City
Infrastructure Management $
12047
Miscellaneous $ 280305
Operating and Maintenance Costs 2016 Budget Service Calls $ 135987
Subdivision Work $ 4307
Watermains $ 942058
Testing $ 23396
Hydrants $ 225876
Meters $ 250277
Service Repairs $ 172431
Vacuum Excavations $ 46878
Non Potable Pumping Station $ 1338
Water-Duel
Miscellaneous $
2264
Watermains $ 19290
Administration $ 138711
Prog-Water $ 129300
Wholesale Water Purchase from Region $ 12303913
Gross $ 17770654
Non-Rate Revenues
Water Administration $ 202132
Interdepartmental Repayment $ 121132
Water Meter $ 99595
Water-City $ 4295
Recoveries-Regional Water $ 10777
Net $ 17332723
City of Waterloo Water amp Sanitary Sewer Rate Design Study Final Report amp Water Financial Plan No 112-301
April 1 2016
615 Net Full Cost of Water System
The net full cost of managing the water system over the next twenty four (24) years is a
reasonable estimate of full costs to be recovered through the rates and is comprised of
bull Net Annual OampM Costs (ie after non-rate revenues are considered)
bull Net Capital costs (pipe replacement growth and non growth projects) ie not including
contributions from developers or grants
bull Water treatment (Regional) costs
bull Rate stabilization allowance
bull Capital reserve contributions and
bull Debt financing cost
Table 6-3 is a summary of the projected costs related to the water system over the study period
including the next 5 years It shows that the average annual cost of managing the water system
is approximately $306 million over the next 24 years compared to current (2016) annual costs
of approximately $205 million Debt repayment accounts for 3 of the annual costs
Operations cost are estimated to be approximately $76 million (25) and the capital costs $39
22 DFA Infrastructure International Inc
City of Waterloo Water amp Sanitary Sewer Rate Design Study Final Report amp Water Financial Plan No 112-301
April 1 2016
million (13) These are fixed costs that account for approximately 41 of the total annual
costs The purchase of water from the Region is estimated to be approximately $181 million
(59) of the overall net cost over the study period These are variable costs because of the
Regionrsquos rate structure for water treatment which is 100 volumetric However most of the
water treatment costs are fixed Therefore if the Region were to change its current rate
structure then most of Regionrsquos cost would become a fixed cost to the City The average
annual full cost of service is approximately $220 million over the next 5 years
The projected costs and net revenue requirements for each year over the next 24 years are
used as the basis for developing the rates The projected annual net full costs of managing the
water system over the period are presented in Appendix F
Table 6-3 Average Annual Full Cost of Water System
Cost Component
(Water) 2016 2016 ()
Average ($)
- (2016 2020)
Average ()
- (2016 2020)
Average ($)
- (2016 2039)
Average ()
- (2016 2039)
Capital Reserve $ 2777481 14 $ 3100679 14 $ 3962470 13
Transfers
Regional Charges $12303913 60 $13058563 59 $18083887 59
Operating $ 5466741 27 $ 5811017 26 $ 7580721 25
Expenses
$ Debt Repayment 0 $ 11417 0 $ 972520 3
-
Total $20548135 $21981676 $ 30599598
62 Full Cost Assessment ndash Sanitary Sewer System
621 Sanitary Sewer System Capital Costs
The sanitary sewer system capital budget requirements over the study period are presented in
Appendix C This reflects the projects identified in the Cityrsquos 10-year Capital Budget Forecast in
conjunction with the replacement of existing sanitary sewer assets based on the asset inventory
and life expectancies and age It should be noted that some of the projects identified in the 10-
year Capital Budget Forecast include asset replacement Therefore these projects were
rationalized with the projected asset replacement needs to ensure that there was no
duplication in the projections
A comparison of the capital needs to the existing level of capital spending indicates that current
funding levels are sufficient over the next 20 years until approximately 2035 as shown in Figure
6-2 However a funding gap in excess of $726 million is projected beyond 2035 (ie between
2036 and 2065 which is outside the window of this study) but a prime candidate for the
utilization of debt financing in the long-term The 2016 budget for capital expenditures is $38
23 DFA Infrastructure International Inc
City of Waterloo Water amp Sanitary Sewer Rate Design Study Final Report amp Water Financial Plan No 112-301
April 1 2016
million This annual amount should be sufficient for the next few years but should be increased
over the 24-year period to address the increasing sanitary sewer needs
If the capital investment is not increased to the levels noted in Appendix C then the funding
gap beyond 2035 would not be addressed and the sanitary sewer system would not be
financially sustainable
Figure 6-2 Capital Funding Gap (in $2015) ndash Sanitary Sewer
80000000
70000000
60000000
50000000
40000000
30000000
20000000
10000000
-2016 to 2025 2026 to 2035 2036 to 2045 2046 to 2055 2056 to 2065
Existing Asset Funding 32145413 32145413 32145413 32145413 32145413
Asset Replacement Summary 25702070 26719721 45344152 55111845 68602022
Appendix C also shows the projected sources financing for the annual expenditures Capital
financing will be through the Sanitary Sewer Capital Reserve Fund and debt (beyond 2025) in
the long term Other sources of financing such as provincial and or federal grants are
unpredictable and are therefore not considered over the long-term However the City is
encouraged to aggressively pursue these funding opportunities as they become available to
reduce the overall amount to be funded from the rates and capital reserve The reserve fund
requirements are discussed in Section 622
622 Sanitary Sewer Reserve Fund Requirements
There are two (2) reserve funds being recommended as part of this study
bull The Sanitary Sewer Capital Reserve Fund and
bull The Sanitary Sewer Rate Stabilization (Operating) Reserve
Appendix D shows the projected continuity schedules for both reserves This shows the
transfers to and from the respective reserves and the opening and closing balances
24 DFA Infrastructure International Inc
City of Waterloo Water amp Sanitary Sewer Rate Design Study Final Report amp Water Financial Plan No 112-301
April 1 2016
Sanitary Sewer Capital Reserve Fund
The Sanitary Sewer Capital Reserve Fund which had an opening balance of approximately $79
million at the beginning of 2016 will be a source of financing in conjunction with debt (beyond
2025) for future projects This requires that annual contributions be made to the Sanitary
Sewer Capital Reserve Fund to ensure that sufficient funds are available for the asset
replacement rehabilitation projects These annual contributions (to be raised through the
sanitary sewer rates each year) are generally projected to range from $40 million in 2016 to
approximately $30 million by 2026 The reserve closing balance is targeted to be a minimum of
1 of the asset replacement value adjusted for inflation each year over the study period The
annual reserve balance is projected to be $86 million at the close of 2016 increasing to $96
million by 2026
Sanitary Sewer Rate Stabilization (Operating) Reserve Fund
The Sanitary Sewer Rate Stabilization Reserve Fund is required to provide a source of funding to
offset any year-end operating deficits that may occur during the period and avoid unplanned
rate spikes in the subsequent year The annual contributions (to be raised through the sanitary
sewer rates each year) are based on maintaining a target balance of 5 of the annual operating
expenditures (approximately $17 million on average over 24 years) Transfers to this reserve
fund are targeted to begin in 2019 and phased in at a rate of 1 per year until 2023 Annual
contributions over the 24-year period are projected to range between $0 in 2016 and $346196
depending on the reserve balance and its utilization
623 Debt Related Costs
Similar to water there is no existing sanitary sewer system debt However based on feedback
from Council the City will utilize debt to finance future asset renewal projects which will tend to
smooth the rates Debt financing is expected to play a major role in funding projects beyond
the next 24 years when much of the sanitary sewer system becomes due for replacement The
City also plans to incur some growth related debt to supplement the Water amp Sanitary Sewer
Development Charges Reserve Fund to be used to finance the growth portions of projects This
future growth related debt and resulting debt repayment does not affect the costs to be
recovered from the water rates but are considered in the financial statements included in
Section 9
624 Sanitary Sewer System Operations amp Maintenance (OampM) Cost
The annual operating budget is based on the operations and maintenance needs of the sanitary
sewer system The annual budget reflects the costs as shown in Table 6-4 These costs include
the Regionrsquos charges wastewater treatment but do not include transfers to reserves because
the capital related costs are addressed separately in Sections 622 The OampM costs are offset
by non-rate revenues with the resulting net costs to be recovered from rates
25 DFA Infrastructure International Inc
City of Waterloo Water amp Sanitary Sewer Rate Design Study Final Report amp Water Financial Plan No 112-301
April 1 2016
Table 6-4 Operating and Maintenance Costs (Sanitary Sewer)
Operating and Maintenance Costs 2016 Budget
Operating Expenditures
Sewer Administration $2346514
Sewer Maintenance
Zoom Camera
$179476
Infrastructure Management $19543
Sanitary Sewer Flow Monitoring $51000
Laterals $640135
Sanitary Sewers $341400
Forcemain $2412
Pumping Station $247743
Prog-Sewer $120757
Interdepartmental Repayment $1108632
Net Operating Surplus $3081999
Regional Sewage Treatment Cost $16248249
Gross $24387860
Non-Rate Revenues
Sewer Administration $370088
Interdepartmental Repayment $12500
Sewage Rev-Extra Sewage $798050
Net $23207222
The gross 2016 OampM cost including the Regionrsquos charge is estimated to be $24387860 This
cost would be offset by $1180638 in non-rate revenues for a Net OampM cost of approximately
$23207222 Approximately $798000 in revenue is expected to be received from the City of
Kitchener annually for sanitary sewage that flows through the City of Waterloorsquos system
Wastewater treatment budgeted to cost $16248249 in 2016 accounts for a significant portion
(approximately 67) of the Cityrsquos annual OampM costs
The annual OampM costs (except for the Regionrsquos charges) and the non-rate revenues are
assumed to increase by 3 each year to allow for inflation plus any potential regulatory
changes The Regionrsquos charges would increase based on the Regionrsquos projected uniform rates
and the volume of wastewater treated from the City The assumptions respecting the Regionrsquos
charges are noted in Table 6-1 Appendix E summarizes the gross operating costs non-rate
revenues and net costs to be recovered from users through the Citys fixed and consumption
charges
26 DFA Infrastructure International Inc
City of Waterloo Water amp Sanitary Sewer Rate Design Study Final Report amp Water Financial Plan No 112-301
April 1 2016
625 Net Full Cost of Sanitary Sewer System
The net full cost of managing the sanitary sewer system over the next twenty-four (24) years is
a reasonable estimate of full costs to be recovered through the rates and is comprised of
bull Net Annual OampM Costs (ie after non-rate revenues are considered)
bull Net Capital costs (pipe replacement growth and non growth projects) ie not including
contributions from developers or grants
bull Wastewater treatment (Regional) costs
bull Rate stabilization allowance and
bull Capital reserve contributions
Table 6-5 is a summary of the projected costs for all the sanitary sewer system cost
components over the study period It shows that the average annual cost of managing the
sanitary sewer system is approximately $383 million over the next 24 years compared to 2016
costs of approximately $245 million The annual transfers to reserve are expected to decrease
from approximately $32 million in 2016 to an average annual amount of approximately $29
million over the next 24 years as most of the sanitary sewer system needs are beyond 2035
There are currently no debt related costs based on the Cityrsquos current capital needs However as
indicated in Section 623 debt will play a future role in the long-term capital financing strategy
(beyond 2025) for the sanitary sewer network and are estimated at approximately $524000
(1) Operations cost are estimated to be approximately $59 million (15) and the capital
costs $29 million (8) These are fixed costs that account for approximately 24 of the total
annual costs The treatment of wastewater by the Region is estimated to be approximately $29
million and accounts for 76 of the overall net cost These are variable costs because the
Regionrsquos current rate structure for wastewater treatment is 100 volumetric However most of
the treatment costs are fixed Therefore if the Region were to change its current rate structure
then most of Regionrsquos cost would become a fixed cost to the City
The projected costs and net revenue requirements for each year over the next 24 years are
used as the basis for developing the rates The projected annual net full costs of managing the
sanitary sewer system over the period are presented in Appendix F
27 DFA Infrastructure International Inc
Table 6-5 Average Annual Full Cost of Sanitary Sewer System
Cost Component
(Sanitary Sewer) 2016 2016 ()
Average ($)
- (2016 2020)
Average ()
- (2016 2020)
Average ($)
- (2016 2039)
Average ()
- (2016 2039)
Capital Reserve $ 3227783 13 $ 2954049 11 $ 2895828 8
Transfers
Regional Charges $16248249 66 $18382061 70 $28981774 76
Operating Expenses $ 5057612 21 $ 5083741 19 $ 5915288 15
Debt Repayment $ - 0 $ - 0 $ 524342 1
Total $24533644 $26419851 $38317232
City of Waterloo Water amp Sanitary Sewer Rate Design Study Final Report amp Water Financial Plan No 112-301
April 1 2016
7 Financing the Water amp Sanitary Sewer System Costs
This Section presents an analysis of the rate structure options the preferred structure and the
rates and charges required to provide sufficient revenues to recover the full costs associated
with the management of the Cityrsquos water and sanitary sewer systems
71 Sources of Financing
The current methods of financing for each cost component are summarized in Table 7-1 In
general capital projects are funded through rates and reserves The reserve funds are built
through annual contributions included in the water and sanitary sewer rates and charges each
year The City also intends to use debt along with reserves to finance future capital needs
Growth related projects are funded primarily through the Development Charges (DC) Reserve
and direct developer contributions Any additional funding from the City for growth related
projects is usually from the capital reserve fund Therefore only the ldquonetrdquo funding required
through the capital reserve funds is considered for growth related projects in this study as
identified in the 2016 capital budget forecast All other costs are recovered through the annual
rates and charges Periodically specific projects and activities may be funded by grants
available through Federal and Provincial Government funding programs and cost sharing
arrangements with the Region However this type of financing is not always available and only
considered in the study where funding has been confirmed
28 DFA Infrastructure International Inc
City of Waterloo Water amp Sanitary Sewer Rate Design Study Final Report amp Water Financial Plan No 112-301
April 1 2016
Table 7-1 Funding Sources
Item Funding Source
OampM bull Rates
bull DC Reserve Fund
bull Developer Contributions
Growth Projects bull Water Capital Reserve Fund for Water Projects
bull Sanitary Sewer Capital Reserve Fund for Sanitary Sewer Projects
bull Debt Financing (in the future)
bull Water Capital Reserve Fund for Water Projects
bull Sanitary Sewer Capital Reserve Fund for Sanitary Sewer Projects
Capital Replacement bull Debt Financing (in the future)
bull Transfers from Operating
bull Grants (as applicable)
Reserve Contributions bull Rates
Regional Charges bull Rates
72 Existing Rate Structure amp Rates
The Citys current rate structure for water includes a Water Service Charge (ie a base or fixed
charge component) that is set according to the customerrsquos meter size and a Water Rate (ie a
uniform consumption rate) The key features of this rate structure are
bull The revenues from the Service Charges are guaranteed because they are fixed
charges and can bring stability to the overall revenue stream and
bull This structure has all of the benefits of a uniform rate (eg promoting water
conservation) but without the extreme volatility of relying 100 on consumption
revenues However in the Cityrsquos case the portion of revenue from the service
charges is relatively small (approximately 6 for water and 0 for sanitary sewer)
and is only a minor benefit to revenue stability
The sanitary sewer rate structure includes only a volumetric rate that is applied to water
consumption but does not include a Sanitary Sewer Service Charge component Therefore 100
of the revenues are dependent on water use which can lead to revenue uncertainty and deficits
due to lower consumption The water and sanitary sewer rates are shown in Table 7-3
In general the current rate structure recovers only approximately 6 of the annual water
revenue and 0 of the annual sanitary sewer revenues from the fixed charges making revenues
heavily dependent upon consumption This increases the risk of incurring deficits especially in
wet years when water consumption tends to be lower than predicted This is particularly the
case for sanitary sewer revenues which are based on water consumption The revenue tends to
29 DFA Infrastructure International Inc
City of Waterloo Water amp Sanitary Sewer Rate Design Study Final Report amp Water Financial Plan No 112-301
April 1 2016
be lower in wet years but the cost of treatment tends to be higher due to inflow and
infiltration Most of the water and sanitary sewer costs are fixed (approximately 41 for water
and 24 for sanitary sewer as noted in Section 615 and Section 625 respectively) whereas
the revenue recovery tends to be more volatile ie the revenue structure does not match the
cost structure Although the Regionrsquos charges are volumetric most of the costs of treatment are
fixed except for hydro and chemical costs If the Region were to change its rate structure from
100 volumetric then the Cityrsquos rate structure would need to be revisited and changed to suit
the new cost structure Therefore the existing rate structure is exposed to revenue volatility
unless changes are made to recover a greater portion of revenues from the fixed charges (ie
guaranteed revenue regardless of consumption) The creation of respective Water and Sanitary
Sewer Rate Stabilization Reserve Funds is one way to mitigate some of the revenue volatility
risk resulting from the current rate structure
721 Service Charges
The Service Charges are calculated according to the size of the customerrsquos meter using meter
equivalency ratios The smallest meter (15mm) which is typical for residential customers has a
Meter Equivalency Ratio of 1 The charge for this meter size is calculated first and is used the
baseline charge for calculating the service charges for the larger meter sizes These are
determined by multiplying the baseline charge by the respective equivalency ratio for each
meter size This method of calculating base or fixed charges for water and sanitary sewer is
widely used in Ontario and is consistent with the American Water Works Association (AWWA)
guidelines for fees and charges The equivalency ratios are shown in Table 7-2
Table 7-2 Meter Equivalent Ratios
Meter Size Equivalency Ratio
15 mm 100
25 mm 202
40 mm 369
50 mm 462
75 mm 966
100 mm 1424
150 mm 2402
200 mm 3627
250 mm 4823
These ratios are also considered in the development of the alternative rate structures and rates
discussed in this section Under the existing rate structure there are services charges for the
water system but not for the sanitary sewer system as shown in Table 7-3
30 DFA Infrastructure International Inc
722 Uniform Consumption Rate
The uniform consumption rate is a water rate that is applied to each customerrsquos metered
consumption regardless of the type of customer the size of the meter and volume consumed
ie a single rate as opposed to multiple rates that vary depending on consumption or customer
type This portion of the charge is consistent with the concept of user pay because the cost to
the customer increases with consumption and is generally within the control of the customer
Under the current structure there are separate uniform rates for water and sanitary sewer (ie
a Water Rate and a Sanitary Sewer Rate) as shown in Table 7-3
Table 7-3 Existing (2016) Water amp Sanitary Sewer Rates and Charges
Meter Size (mm) 2016
Annual Water Service Charges ($year)
15 mm $ 3576
25 mm $ 7213
40 mm $ 13198
50 mm $ 16528
75 mm $ 34543
100 mm $ 50924
150 mm $ 85910
200 mm $ 129695
250 mm $ 172459
Uniform Rate ($msup3)
Water Rate ($msup3) $ 170
Sanitary Sewer Rate ($msup3) $ 217
City of Waterloo Water amp Sanitary Sewer Rate Design Study Final Report amp Water Financial Plan No 112-301
April 1 2016
73 Alternative Rate Structures amp Rates
This section presents the projected future rates for the existing rate structure plus two (2)
alternative structures developed based on the guiding principles discussed in Section 31 and
feedback received from the Council Workshop and Public Open House The future rates under
each option are required to meet the water and sanitary sewer revenue requirements (ie to
recover the full cost of managing the water and sanitary sewer systems based on the
assessment of system costs over the study period) The cost impacts of each option to the
different customer types are discussed and the preferred rate structure option and rates
identified
The first option is to continue using the existing rate structure and develop the rates required
for full cost recovery This is the rate structure described in Section 731 However one of the
main issues identified is the historical decline in water consumption and the resulting increased
risk of not collecting sufficient rate revenues to fully offset the cost of service This can result in
annual deficits if not addressed The existing structure is exposed to this risk as most of the
31 DFA Infrastructure International Inc
City of Waterloo Water amp Sanitary Sewer Rate Design Study Final Report amp Water Financial Plan No 112-301
April 1 2016
revenues are derived from consumption charges Therefore the two (2) alternative rate
structures are geared towards increasing revenue stability while at the same time maintaining
consistency with the other guiding principles to the extent possible In all three (3) options
implementation would begin in 2019 when the existing 2016 to 2018 rates become due for
renewal This is consistent with the feedback received from Council regarding the
implementation strategy
The rates required under each option over the 24-year study period are based on cash flow
analyses undertaken
731 Rate Structure Option 1 ndash Existing Structure
This option is the current structure used by the City to recover the costs of the water and
sanitary sewer systems The service charges and rates approved under By-Law 2016-001 will
continue to apply for the period 2016 to 2018 In 2019 the service charges and rates are
increased as needed to reflect full cost recovery for both systems Under this option the City
would continue to recover approximately 6 of the required water system revenues from the
Water Service Charges (ie guaranteed revenue) and 94 from consumption based on the
Water Rates This means that there would continue to be a heavy reliance on the consumption
based revenues each year which poses risk to revenue recovery Sanitary sewer system costs
would also continue to be recovered through the volumetric Sanitary Sewer Rate only ie
without a service charge component The 6-year water and sanitary sewer rate projections for
Option 1 are provided in Table 7-4
The Water Service Charges are projected to increase by 029 915 and 261 in 2019 (over
2018) 2020 and 2021 respectively The water rate is projected to increase by 878 948 and
291 in 2019 2020 and 2021 Similarly the Sanitary Sewer Rate is projected to increase by
approximately 655 each year from 2019 to 2021 inclusive These increases are necessary to
recover the full cost of service Rate and service charge projections for the study period are
presented in Appendix I
32 DFA Infrastructure International Inc
Table 7-4 Projected Service Charges amp Rates ndash Option 1
Rate
Component 2016 2017 2018 2019 2020 2021
Annual Water Service Charges
Annual Increase () 241
15 mm $3576
25 mm $7224
40 mm $13200
50 mm $16548
75 mm $34572
100 mm $50568
150 mm $85992
200 mm $129816
250 mm $172620
Uniform Wastewater Rate $217
($msup3)
235
$3660
$7404
$13536
$16956
$35436
$51828
$88140
$133056
$176940
262
$3756
$7584
$13872
$17376
$36324
$53124
$90348
$136380
$181368
915 261
$4111 $4219
$8302 $8518
$15185 $15580
$19020 $19516
$39761 $40797
$58151 $59666
$98898 $101474
$149286 $153175
$198531 $203703
$269 $287
Annual Increase () 241 235 287 878 948 291
Uniform Water Rate
($msup3) $170 $174 $179 $195 $213 $219
Annual Increase () 333 323 580 655 655 655
Uniform Rate
$224 $237
029
$3767
$7606
$13912
$17426
$36428
$53276
$90607
$136771
$181888
$253
City of Waterloo Water amp Sanitary Sewer Rate Design Study Final Report amp Water Financial Plan No 112-301
April 1 2016
732 Rate Structure Option 2 ndash 15 of Revenue from Service Charges
Under this option a Sanitary Sewer Service Charge is introduced and 15 of the respective
water and sanitary sewer system revenue requirements would be recovered from the
respective service charges in 2019 The existing rate structure and rates remain in effect until
2018 Note that the new service charges will result in a revenue shift away from the
consumption based revenue resulting in slight decrease in the Water Rate and the Sanitary
Sewer Rate All water and sanitary sewer service charges and rates are increased as needed
beyond 2019 such that the service charges provide approximately 15 of the annual revenues
for the remainder of the study period
This option is intended to improve revenue stability beginning in 2019 After 2019 both sets of
service charges and rates would increase as needed for full cost recovery As a result the base
Water Service Charge (ie for the 15mm meter) is projected to increase from $3756 in 2018 to
$9417 in 2019 (ie an increase of 1501) and 91 thereafter The Water Rate decreases
from $179 msup3 in 2018 to $176 msup3 in 2019 (-16) and 95 thereafter Similarly the Sanitary
Sewer Service Charge is estimated to be $11433 in 2019 but Sanitary Sewer Rate would
decrease to from $237 in 2018 to $215 msup3 in 2019 Table 7-5 and Table 7-6 show the projected
6-year rates for water and sanitary sewer respectively
33 DFA Infrastructure International Inc
Table 7-5 Projected Water Service Charges amp Rates - Option 2
Rate
Component 2016 2017 2018 2019 2020 2021
Annual Water
Service Charges
Annual Increase () 241 235 262 15072 915 261
15 mm $3576 $3660 $3756 $9417 $10279 $10546
25 mm $7224 $7404 $7584 $19014 $20754 $21295
40 mm $13200 $13536 $13872 $34779 $37962 $38951
50 mm $16548 $16956 $17376 $43565 $47551 $48790
75 mm $34572 $35436 $36324 $91070 $99403 $101993
100 mm $50568 $51828 $53124 $133191 $145378 $149165
150 mm $85992 $88140 $90348 $226518 $247244 $253686
200 mm $129816 $133056 $136380 $341928 $373214 $382938
250 mm $172620 $176940 $181368 $454720 $496327 $509258
Uniform Rate
Annual Increase () 241 235 287 -164 948 291
Uniform Water Rate
($msup3) $170 $174 $179 $176 $193 $198
Rate
Component 2016 2017 2018 2019 2020 2021
Annual Wastewater Service Charges
Annual Increase ()
15 mm -
25 mm -
40 mm -
50 mm -
75 mm -
100 mm -
150 mm -
200 mm -
250 mm -
333
Uniform
Wastewater Rate $217
($msup3)
-
-
-
-
-
-
-
-
-
-
-
-
-
-
-
-
-
-
Uniform Rate
323 580
$224 $237
$11433
$23085
$42224
$52890
$110565
$161702
$275007
$415122
$552059
-943
$215
623 624
$12145 $12902
$24523 $26052
$44855 $47653
$56186 $59689
$117454 $124779
$171777 $182489
$292141 $310360
$440986 $468487
$586456 $623028
655 655
$229 $244
Annual Increase ()
City of Waterloo Water amp Sanitary Sewer Rate Design Study Final Report amp Water Financial Plan No 112-301
April 1 2016
Table 7-6 Projected Sanitary Sewer Service Charges amp Rates ndash Option 2
34 DFA Infrastructure International Inc
City of Waterloo Water amp Sanitary Sewer Rate Design Study Final Report amp Water Financial Plan No 112-301
April 1 2016
733 Rate Structure Option 3 ndash Inclining Block Rate Structure
Under this option higher Water and Sanitary Sewer Rates would apply as consumption
increases The features of this structure include the following for both water and sanitary
sewer
bull A Bi-Monthly Service Charge that includes consumption of 14 msup3
This volume allows customers to meet their basic water use needs without
additional consumption (volumetric) charges and is referred to as basic
consumption The full charge applies whether or not the maximum of 14 msup3 is used
bull A First Consumption Block (Block 1) for bi-monthly consumption greater than 14 msup3
but not to exceed 34 msup3
This maximum volume represents the bi-monthly consumption for the average
residential customer The respective water and sanitary volumetric rates apply to
the volume consumed within Block 1 (ie in excess of 14 msup3 to a maximum of 34 msup3)
as measured by the customerrsquos water meter This is in addition to the Bi-Monthly
Service Charges
bull A Second Consumption Block (Block 2) for bi-monthly consumption greater than 34
msup3
The respective water and sanitary volumetric rates applicable to the volume
consumed within Block 2 (ie in excess of 34 msup3) as measured by the customerrsquos
water meter are 12 times the respective rates for the Second Consumption Block
The Bi-Monthly Service Charges also apply
The thresholds defining the volumetric blocks are based on reasonable use by the average
residential customer The Block 2 Rate being set using a factor of 12 times the Block 1 Rate is
intended to provide price point incentive for customers using water within the Block 2 to
conserve According to the AWWA Manual AWWAM1 Principles of Water Rates Fees and
Charges there are no set criteria for establishing the factor except that it must be significant in
order to have an effect on customer behaviour and trigger conservation Note that in some
jurisdictions this price premium is much higher eg City of Hamiltonrsquos block 2 rate is 2 times the
block 1 rate However for the purposes of this rate design study a lower factor of 12 is used to
assess what the impacts might be to the higher consumption customers under a more
moderate premium recognizing that a higher premium would result in even greater impacts
35 DFA Infrastructure International Inc
City of Waterloo Water amp Sanitary Sewer Rate Design Study Final Report amp Water Financial Plan No 112-301
April 1 2016
Inclining block rates are typically considered for use when the following applies
bull The billing system can handle different customer classes and has the capacity to
calculate the consumption within each block for each customer In the Cityrsquos case
adjustments to the existing billing system would be required to incorporate the
block billing
bull The water andor sanitary system is approaching its operating capacity and there is a
need to avoid or defer expansion Note that the issue of plant capacity falls under
the jurisdiction of the Region If inclining rates are to have an impact on deferring
plant capacity expansion then there would need to be a concerted effort by the
Region in collaboration with all the local area municipalities ie the Cityrsquos efforts on
its own would not be sufficient to defer plant capacity expansion
bull There is a desire to promote water conservation through pricing and
bull There is a willingness to incur the extra effort required to communicate and explain
the rationale behind the inclining block rates to customers and administer the
system
Although this structure provides greater portion of the annual revenue through the Service
Charges promotes conservation and facilitates user pay there are some major drawbacks
bull The customers that require high volumes of water as part of their normal business
would pay the higher Block 2 Rate but would not be able to reduce consumption to
benefit from the lower Block 1 Rate
bull There would be very little incentive for the low volume customers to conserve as
most of their consumption would fall within the volume included as part of the fixed
service charge
bull Greater revenue instability because higher revenues expected from the Block 2 may
not materialize as some customers conserve and reduce consumption within that
block or have all their consumption fall within Block 1 at the lower rate
bull The potential loss of higher consumption users that pay the premium Block 2 rate
would mean the loss revenues that would need to be recovered from the lower
consumption users This would require an increase to the Block 1 rate to ensure that
sufficient revenues are recovered Research suggests that reductions in consumption
can be 18 or greater (Ref 17) To address the reduction in consumption it is
assumed that a more conservative reduction of 10 would occur in the Block 2
volumes under Option 3
bull The complexity of administering the data collection and billing to align with the
inclining block as part of the ongoing operations This would increase the annual
operating cost The amount of this increase was not available at the time of
preparing this report
36 DFA Infrastructure International Inc
This option would become effective in 2019 As a result the base Water Service Charge (ie
for the 15mm meter) is projected to increase from $3756 in 2018 to $15841in 2019 (ie an
increase of 32175) However the Water Rate for Block 1 is projected to increase from
$179 in 2018 to $189 in 2019 ie an increase of 535 Both the service charges and rates
would increase by approximately 950 and 293 in 2020 and 2021 respectively but the
average increases needed for full cost recovery are projected to be approximately 3
annually over the study period Similarly the Sanitary Sewer Service Charge is estimated to
be $19822 in 2019 but Sanitary Sewer Rate for Block 1 would decrease by 294 Both the
service charges and rates would increase by 657 in 2020 and 2021 Table 7-7 and
Table 7-8 show the projected 6-year rates for water and sanitary sewer respectively
The annual service charges and rates and their respective increases for each year between 2021
and 2039 are shown in Appendix I
Table 7-7 Projected Water Service Charges amp Rates ndash Option 3
Rate
Component 2016 2017 2018 2019 2020 2021
Annual Increase
()
15 mm
25 mm
40 mm
50 mm
75 mm
100 mm
150 mm
200 mm
250 mm
Annual Increase
()
Block 1 ($msup3)
Block 2 ($msup3)
241
$3576
$7224
$13200
$16548
$34572
$50568
$85992
$129816
$172620
241
$170
Annual Water Service Charges
235 262 32175
$3660 $3756 $15841
$7404 $7584 $31985
$13536 $13872 $58505
$16956 $17376 $73283
$35436 $36324 $153196
$51828 $53124 $224050
$88140 $90348 $381042
$133056 $136380 $575182
$176940 $181368 $764919
Uniform Rate
235 287 535
$174 $179 $189
$226
950
$17345
$35023
$64062
$80244
$167747
$245330
$417233
$629812
$837569
950
$206
$248
293
$17853
$36049
$65938
$82593
$172659
$252515
$429452
$648256
$862098
293
$213
$255
City of Waterloo Water amp Sanitary Sewer Rate Design Study Final Report amp Water Financial Plan No 112-301
April 1 2016
37 DFA Infrastructure International Inc
Table 7-8 Projected Sanitary Sewer Service Charges amp Rates ndash Option 3
Rate
Component 2016 2017 2018 2019 2020 2021
Annual Sanitary Sewer Service Charges
Annual Increase
()
15 mm -
25 mm -
40 mm -
50 mm -
75 mm -
100 mm -
150 mm -
200 mm -
250 mm -
Uniform Rate
Annual Increase 333
()
Block 1 ($msup3) $217
Block 2 ($msup3)
-
-
-
-
-
-
-
-
-
323
$224
-
-
-
-
-
-
-
-
-
580
$237
$19322
$39015
$71363
$89389
$186865
$273291
$464787
$701594
$933030
-294
$230
$276
657
$20591
$41577
$76050
$95260
$199137
$291239
$495311
$747670
$994305
657
$245
$294
657
$21944
$44309
$81046
$101517
$212219
$310371
$527848
$796784
$1059622
657
$261
$313
City of Waterloo Water amp Sanitary Sewer Rate Design Study Final Report amp Water Financial Plan No 112-301
April 1 2016
734 Potential Customer Impacts
The potential cost impacts to customers are driven by the following
bull The 2016-2018 rates are not at the point at which they provide sustainable levels of
revenues to recover the full cost of service Therefore rate increases are required
beginning in 2019 to bring revenues up to sustainable levels regardless of the rate
structure option Council approves
bull Changes to the rate structure to obtain more revenues from the services charges to
improve revenue security As the base service charges increase there is a greater
impact to the low consumption user than the higher consumption user Therefore it is
recommended that staff continue to investigate the Region-wide affordability program
to help offset this impact to eligible users
bull The inclining rates of Option 3 which tends to increase costs to the high consumption
user compared the low consumption user The number of customers estimated to be in
each consumption block based on current billing and consumption data is shown in
38 DFA Infrastructure International Inc
City of Waterloo Water amp Sanitary Sewer Rate Design Study Final Report amp Water Financial Plan No 112-301
April 1 2016
Table 7-9 This indicates that approximately 31 of the customers would be exposed to
the higher Block 2 rate
Table 7-9 Number of Customers in Each Consumption Block (Option 3)
Customers
Block Number
Service Charge Only 5798 19
Service Charge + Block 1 15045 50
Service Charge + Block 1 + Block 2 9517 31
Total 30360 100
The potential customer impacts under each option are assessed by determining the annual
amount the average customer in each customer class would pay in 2019 for both water and
wastewater compared to 2018 The average customers are defined as follows
bull Small Residential - with a 15mm water meter and average annual
consumption of 120 msup3 per year
bull Average Residential - with a 15mm water meter and average
annual consumption of 204 msup3 per year
bull Residential Small Apartments - with a 25mm water meter and
average annual consumption of 1060 msup3 per year
bull Small Commercial amp Industrial - with a 40mm water meter and average annual consumption of 1215 msup3 per year
bull Large Commercial amp Industrial - with a 50 mm water meter and average annual consumption of 8227 msup3 per year
bull Largest Commercial amp Industrial - with a 50 mm water meter and
average annual consumption of 192000 msup3 per year
The average Large Commercial and Industrial customer is determined by the most common
meter size and the average consumption for that meter size Table 7-10 illustrates the 2019
annual cost to the average customer in each customer class and percentage increase compared
to 2018 under the three (3) rate structure options It is important to note that the change in
cost in 2019 is a one-time adjustment to reflect the change in rate structure and full cost
recovery Option 1 is projected to have a relatively consistent cost impact to all customer
classes ie 700-751 in 2019 Option 2 is projected to have a much greater cost impact on
the residential sector (2619 for residential small and 1347 for average residential
customers) than on the non-residential sector Large commercial and industrial customers
39 DFA Infrastructure International Inc
would benefit from reductions of 375 to 598 Option 3 is projected to result in reductions
to the small and average residential customers (approximately 641 and 364 respectively)
but would result in major increase to the other large customer classes ranging from
approximately 2087 to 3248 for the Residential Small Apartments and Non-Residential
Customers These are significant increases that would require more specific consultation with
the impacted customer classes prior to considering implementation Under all three (3) options
the annual increases beyond 2019 would be approximately 3-5 for all customer classes ie
after the 2019 increase and rate structure changes are made and become the new baseline
Table 7-10 Annual 2019 vs 2018 Costs to Customers
Description 2018 Option 1
(2019)
Option 2
(2019)
Option 3
(2019)
Small Residential - Single Family Homes
Meter Size - 15 mm (Equivalency Unit - 100)
Average Consumption - 120 msup3year
Annual Increase to Total Bill () 7 26 -6
Annual Increase to Total Bill ($) $3758 $14059 -$3443
Annual Bill ($) $53676 $57434 $67735 $50233
Average Residential - Single Family Homes
Meter Size - 15 mm (Equivalency Unit - 100)
Average Consumption - 204 msup3year
Annual Increase to Total Bill () 7 13 -4
Annual Increase to Total Bill ($) $6382 $11934 -$3223
Annual Bill ($) $88620 $95002 $100554 $85397
Residential - Small Apartments
Meter Size - 25 mm (Equivalency Unit - 202)
Average Consumption - 1060 msup3year
Annual Increase to Total Bill () 7 2 23
Annual Increase to Total Bill ($) $33125 $7706 $102687
Annual Bill ($) $448544 $481669 $456250 $551231
Small Commercial and Industrial
Meter Size - 40 mm (Equivalency Unit - 369)
Average Consumption - 1215 msup3year
Annual Increase to Total Bill () 7 6 32
City of Waterloo Water amp Sanitary Sewer Rate Design Study Final Report amp Water Financial Plan No 112-301
April 1 2016
40 DFA Infrastructure International Inc
Description 2018 Option 1
(2019)
Option 2
(2019)
Option 3
(2019)
Annual Increase to Total Bill ($) $37983 $32403 $168648
Annual Bill ($) $519312 $557295 $551715 $687960
Large Commercial and Industrial
Meter Size - 50 mm (Equivalency Unit - 462)
Average Consumption - 8227 msup3year
Annual Increase to Total Bill () 7 -4 23
Annual Increase to Total Bill ($) $256961 -$128984 $803285
Annual Bill ($) $3439672 $3696634 $3310689 $4242957
Largest Commercial and Industrial
Meter Size - 50 mm (Equivalency Unit - 462)
Average Consumption - 192000 msup3year
Annual Increase to Total Bill () 8 -6 21
Annual Increase to Total Bill ($) $5996030 -$4776829 $16668939
Annual Bill ($) $79889376 $85885406 $75112547 $96558315
Table 7-11 summarizes the customer impacts under each option and compares the potential
impacts under Options 2 and 3 to Option 1 ie the base option
Table 7-11 Annual 2019 vs 2018 Costs to Customers
Customer
Type Option 1
Current Rate Structure
Customer Impacts (2019 Compared to 2018)
Option 2
15 Revenue from Service
Charges
Option 3
Inclining Block
bull Annual cost would bull Annual cost would increase by
bull Annual cost would decrease by
Small increase by $3758 $14059 (2619) or $1172 $3443 (641) or $287 per
Residential (700) or $313 per per month in 2019 month in 2019
Single Family month in 2019 bull In 2019 customers would pay bull In 2019 customers would pay
Homes bull Rate increases beyond approximately $858 more per approximately $600 less per
120 msup3 per 2019 are an average of month compared to Option 1 month compared to Option 1
year 3 per year bull Rate increases beyond 2019 bull Rate increases beyond 2019 are
are an average of 3 per year an average of 3 per year
Average bull Annual cost would bull Annual cost would increase by bull Annual cost would decrease by
Residential increase by $6382 $11934 (1347) or $995 per $3223 (364) or $269 per
Single Family (720) or $532 per month in 2019 month in 2019
Homes month in 2019 bull In 2019 customers would pay bull In 2019 customers would pay
204 msup3 per bull Rate increases beyond approximately $463 more per approximately $800 less per
year 2019 are an average of month compared to Option 1 month compared to Option 1
City of Waterloo Water amp Sanitary Sewer Rate Design Study Final Report amp Water Financial Plan No 112-301
April 1 2016
41 DFA Infrastructure International Inc
Customer Impacts (2019 Compared to 2018)
Customer
Type Option 1
Current Rate Structure
Option 2
15 Revenue from Service
Charges
Option 3
Inclining Block
3 per year bull Rate increases beyond 2019 bull Rate increases beyond 2019 are
are an average of 3 per year an average of 3 per year
bull Annual cost would bull Annual cost would increase by
increase by $33125 $7706 (172) or $642 per Residential
(738) or $2760 per month in 2019 Small
month in 2019 bull In 2019 customers would pay Apts
bull Rate increases beyond approximately $2118 less per 1060 msup3 per
2019 are an average of month compared to Option 1 year
3 per year bull Rate increases beyond 2019
are an average of 3 per year
bull Annual cost would bull Annual cost would increase by
increase by $37983 $32403 (624) or $2700 per Small
(731) or $3165 per month in 2019 Commercial amp
month in 2019 bull In 2019 customers would pay Industrial
bull Rate increases beyond approximately $465 less per 1215 msup3 per
2019 are an average of month compared to Option 1 year
3 per year bull Increases beyond 2019
average of 3 per year
bull Annual cost would bull Annual cost would decrease
increase by $256961 by $128984 (375) or
Large (747) or $21413 per $10749 per month in 2019
Commercial amp month in 2019 bull In 2019 customers would pay
Industrial bull Rate increases beyond approximately $32162 less
8227 msup3 per 2019 are an average of per month compared to year 3 per year Option 1
bull Rate increases beyond 2019
are an average of 3 per year
bull Annual cost would bull Annual cost would decrease
increase by $5996030 by $4776829 (598) or
Largest (751) or $499669 per $398069per month in 2019
Commercial amp month in 2019 bull In 2019 customers would pay
Industrial bull Rate increases beyond approximately $897738 less
192000 msup3 per 2019 are an average of per month compared to
year 3 per year Option 1
bull Rate increases beyond 2019
are an average of 3 per year
bull Annual cost would increase by
$102687 (2289) or $8557
per month in 2019
bull In 2019 customers would pay
approximately $5797 more per
month compared to Option 1
bull Rate increases beyond 2019 are
an average of 3 per year
bull Annual cost would increase by
$168648 (3248) or $14054
per month in 2019
bull In 2019 customers would pay
approximately $10889 more
per month compared to Option
1
bull Increases beyond 2019 are an
average of 3 per year
bull Annual cost would increase by
$803285 (2335) or $66940
per month in 2019
bull In 2019 customers would pay
approximately $45527 more
per month compared to Option
1
bull Rate increases beyond 2019 are
an average of 3 per year
bull Annual cost would increase by
$16668939 (2087) or
$1389078 per month in 2019
bull In 2019 customers would pay
approximately $889409 more
per month compared to Option
1
bull Rate increases beyond 2019 are
an average of 3 per year
City of Waterloo Water amp Sanitary Sewer Rate Design Study Final Report amp Water Financial Plan No 112-301
April 1 2016
735 Options Analysis amp Preferred Option
A qualitative assessment of how well each option aligns with the Guiding Principles in Section
31 is presented in this Section Table 7-12 shows the results using full or partial circles Full
42 DFA Infrastructure International Inc
alignment with the respective guiding principle is depicted by a full circle some alignment by a
partial circle and no alignment by no circle
Table 7-12 Qualitative Analysis of Rate Options
Guiding Principles Option 1 Option 2 Option 3
Full Cost Recovery
Revenue Stability
User Pay
Fairness and Equity
Uniform Rate Structure
Water Conservation
Capital Financing
Ease of Administration
Affordability
City of Waterloo Water amp Sanitary Sewer Rate Design Study Final Report amp Water Financial Plan No 112-301
April 1 2016
Full Cost Recovery
bull All options are designed to recover the full costs of managing the water and sanitary
sewer systems over the study period
Revenue Stability
bull None of the three (3) options have fixed charge structures that fully align with the cost
structures for water and sanitary sewer but they all provide a portion of revenues
through the fixed charges
bull Option 1 offers the least revenue stability as only 6 of water revenues and 0 of the
sanitary sewer revenues would be guaranteed This is especially important given that
the majority of costs to manage the water and sanitary sewer systems are for the most
part fixed
bull Under Option 3 a larger portion of revenue (25 -27) would be recovered from the
service charges However there is added revenue instability because the higher
revenues expected from Block 2 at the higher rate may not materialize as some
43 DFA Infrastructure International Inc
City of Waterloo Water amp Sanitary Sewer Rate Design Study Final Report amp Water Financial Plan No 112-301
April 1 2016
customers conserve and reduce consumption within that block or have all their
consumption fall within Block 1 at the lower rate This would result in a reduction of
total revenue notwithstanding the portion that is guaranteed from the Service Charges
There is also the risk of losing one or more high volume users and the revenues
generated from those customers The revenue loss would have to be recovered from
the low volume users
bull Option 2offers the best revenue stability of the three (3) options with 15 from the
fixed charges and does not have the added revenue risks associated with Option 3
regarding Block 2 revenues
User Pay
bull The concept of user pay is based on the philosophy that those who use more water
should pay more Under all three (3) options customers would pay more if their
consumption increases as they all have a consumption rate component However
Option 3 aligns the best with this principle due to the higher rate charged for Block 2
Fairness and Reasonableness
bull All options promote fairness and equity as the service charges plus a consumption
charge is a reasonably fair approach to cost recovery to both the City as the
owneroperator and the customers This is the structure that is most common across
Ontario
bull Each class of customers is exposed to the same ratios in the calculation of their service
charges regardless of the rate structure option
bull All customers would pay the same consumption rate that applies under each option ie
the customers are exposed to the same consumption rate regardless of customer class
However customers that consume high volumes because of their business practices
may not be able to realistically reduce their consumption to benefit from the lower
Block 1 rate under Option 3 This may be considered to be unfair to these customers
because they may be unable to reduce their consumption The cost increase to the non-
residential sector (estimated to be 31 of the customers) is expected to be in the range
of 20 to 32 This is significant even at a relatively low price premium of 12 times the
Block 1 rate and could have adverse effects on attracting or retaining business within
the City
bull Under Option 1 from a high level equity perspective the residential and non-residential
sectors would pay their fair share Residential customers consume approximately 55
of the water and contribute 55 of the annual revenue while the ICI consumers
account for the remaining 45 of consumption and revenues This is because the
amount paid varies almost directly with consumption due to the low fixed charges
Under Option 2 the residential sector would pay approximately 5 more than they
44 DFA Infrastructure International Inc
City of Waterloo Water amp Sanitary Sewer Rate Design Study Final Report amp Water Financial Plan No 112-301
April 1 2016
consume while the non-residential sector would pay 5 less The reverse is true under
Option 3 where the non-residential sector would pay approximately 5 more than they
consume Therefore Option 1 is a fair and reasonable rate structure
Uniform Rate Structure
bull Options 1 and 2 have a uniform rate whereas Option 3 has inclining block rates
However Option 3 partially meets this principle because it addresses Councilrsquos request
to investigate an inclining block option
Water Conservation
bull All options promote water conservation as a significant proportion of the overall
revenue would be derived from consumption Option 3 provides the greatest incentive
to reduce consumption due to the inclining block However Options 1 and 2 offer a
reasonable incentive for customers to reduce consumption with 85 to 94 of
revenues from consumption for Options 2and 1 respectively
Capital Financing
bull All options are based on a combination of reserve and debt financing for capital projects
based on the feedback received from Council via the workshop Debt financing was
incorporated to assist with addressing the water capital backlog over the next 20 years
Easy to of Administration
bull Option 1 is the easiest to administer because it is the existing rate structure Option 2
will require some modifications to establish a service charge for sanitary sewer Option
3 will have the greatest impact on administration due to the complexity of managing the
information and billing requirements and the added cost to implement and administer
Affordability
bull Eligible customers stand to benefit from the affordability program when it is established
regardless of the rate structure option
Summary
Based on a qualitative review all options would provide the level of funding to be fully
sustainable over the long-term Although Option 3 is best for water conservation and user pay
it has significant disadvantages including
- Revenue uncertainty resulting from conservation due to the higher Block 2 rate
45 DFA Infrastructure International Inc
City of Waterloo Water amp Sanitary Sewer Rate Design Study Final Report amp Water Financial Plan No 112-301
April 1 2016
- Potentially high impacts (20 to 32 increases) to the non-residential customers
that may affect t he attraction and r etention of b usiness These levels of
increases are significant a nd would r equire further dialogue with t he business
community and volume data analysis prior to confirming the thresholds for each
block and t he factor to be used f or setting the Block 2 rate and
- The risk of shifting a much larger portion o f costs to the residential sector should
business customers relocate or discontinue operations
Option 2 offers the most predictable revenues and would ensure that at least 15 of the
annual water revenues would be guaranteed while providing sufficient incentive for customers
to conserve Therefore Option 2 would be best strictly from a revenue stability perspective
Option 1 (existing rate structure) seems to be the best based on fairness and reasonableness
Its major disadvantage is the low level of revenue stability as only a marginal amount of the
annual revenue is collected via fixed fees This lack of revenue stability would be offset to some
extent by the introduction of the rate stabilization reserves Therefore Option 1 could be
remain a viable option moving forward should Council not wish to proceed with Option 2 due
to the relatively large impact to the small and average residential customers in 2019 compared
to 2018
46 DFA Infrastructure International Inc
City of Waterloo Water amp Sanitary Sewer Rate Design Study Final Report amp Water Financial Plan No 112-301
April 1 2016
8 OReg 45307 Water System Financial Plan No 112-301
Regulation 18807 under the Safe Drinking Water Act requires Ontario municipalities to apply
for and obtain Drinking Water System Licences as part of their overall DWQMS One of the
requirements of holding a valid drinking water licence is preparing and submitting to the
Province an updated financial plan in accordance with OReg 45307 The financial plan must
include financial statements on the following
bull The proposed or projected financial position of the drinking water systems
bull The proposed or projected gross cash receipts and gross cash payments
bull The proposed or projected financial operations of the drinking water system and
bull Details on the extent to which the above information applies to the replacement of
lead service pipes if applicable
Appendix H lists each requirement of the regulation and references the respective financial
statements and other relevant information required under each regulatory requirement The
financial plan must apply to a period of at least six (6) years with the first year being the year
the existing license expires In the Cityrsquos case an updated Water System Financial Plan No112-
301 is required for the period 2016 to 2021 This plan is based on the results of the rate study
Upon Councilrsquos approval the financial plan would be made available to the public at no charge
and posted on the Cityrsquos website It will also be submitted to the Province as part of the Cityrsquos
drinking water license renewal application The license renewal application deadline is June 1
2016
81 Tangible Capital Assets (TCA) Analysis
The results of the rate study contained in this report are used as the basis for preparing the
water system financial plan The Cityrsquos Tangible Capital Asset inventories were also used in the
preparation of the water system financial plan The amortization of the tangible capital assets is
shown as a ldquonon-cashrdquo annual cost that reflects the annual ldquouserdquo of assets until the end of their
respective useful lives Allowances are made to finance the replacement and or rehabilitation
of the existing assets once they ldquoexpirerdquo and can no longer play a role in providing the required
drinking water service to customers It should be noted however that since amortization is
based on the original (historical) cost at the time the asset was placed in service it does not
account for inflation since the year of installation Therefore basing asset replacement costs on
amortization alone is not sufficient to cover the future replacement needs
The TCA projections contained in the Cityrsquos water financial plan are based on the following
assumptions
47 DFA Infrastructure International Inc
City of Waterloo Water amp Sanitary Sewer Rate Design Study Final Report amp Water Financial Plan No 112-301
April 1 2016
bull Amortization of existing assets is based on the Cityrsquos Tangible Capital Assets Policies and
Procedures Amortization of new infrastructure investments is based on straight line
depreciation with full year depreciation charged in the year of acquisition
bull Historical costs life expectancy and remaining useful life are as identified in the TCA
data provided by the City
bull Fully depreciated assets continue to be used in service ie no asset removals and
bull New assets to be acquired are based on the capital forecast presented The forecast
includes projects in the Cityrsquos Capital Budget Forecast and asset replacement projections
based on the Cityrsquos Asset Management Plan
Asset Value
The water system is comprised of the following capital asset classes
bull Water Mains
bull Hydrants and
bull Valves
Table 8-1 shows the current capital asset value based on historical cost and accumulated
amortization to 2015 This is reflected as the net book value (NBV) ie the ldquoaccountingrdquo value
and indicates that the water system as a whole is approximately 30 depreciated or has
approximately 70 remaining life based on the TCA data This suggests that the water system
assets are relatively new
Table 8-1 Asset Amortization and 2015 Net Book Value (NBV)
2015 Water Asset Details
Historical Cost $93412072 100
Accumulated Amortization $27992677 30
Net Book Value (2015) $65419394 70
82 Financial Statements
This financial plan involves the review analysis and assessment of financial information
contained in the rate study including costs revenues debt cash transactions and Tangible
Capital Assets (TCA) to prepare the following three (3) financial statements covering the period
2016 - 2021 as required under OReg 45307
bull Statement of Financial Position
bull Statement of Operations and
bull Statement of Cash Flow
48 DFA Infrastructure International Inc
City of Waterloo Water amp Sanitary Sewer Rate Design Study Final Report amp Water Financial Plan No 112-301
April 1 2016
821 Statement of Financial Position
The Statement of Financial Position is presented in Table 8-2 This statement summarizes the
Cityrsquos water-related financial and non-financial assets ie Tangible Capital Assets (TCA) and
liabilities and provides the net financial asset (or net debt) position and accumulated surplus
related to managing the water system The financial assets are primarily cash balances in the
water reserves and reserve funds Liabilities consist of development charge reserve fund
balances (ie deferred revenues) and long-term debt The non-financial assets (TCA) include the
Cityrsquos water infrastructure The historical costs are amortized over the asset life to arrive at the
net book value each year from 2016 to 2021 New assets are added in the years acquired
developed or built Contributed assets are primarily new infrastructure and facilities that would
be transferred to the Cityrsquos ownership and control by developers as they are completed
However this is assumed to be zero It is also assumed that other non-financial assets such as
inventory and prepaid expenses are zero
Contained within the Statement of Financial Position are important indicators the first being
net financial assets (or net debt) which is defined as the difference between financial assets and
liabilities This indicator provides a measure of the water systems future revenue
requirement Another important indicator in the Statement of Financial Position is the
accumulated surplus This indicator provides a measure of the resources available to the City
for managing its water system The accumulated surplus is projected to increase from
approximately $726 million in 2016 to approximately $863 million by 2021 The accumulated
surplus consists of the net financial assets that are available to fund future operations plus the
non-financial assets that are made up of net TCA balance representing past investments in
water infrastructure It is important to note that the non-financial assets (TCA) cannot be
readily monetized without affecting the delivery of water operations
Table 8-2 indicates that in 2016 the Citys water system will be in a net financial asset position
of $42 million This will be reduced to a net financial asset position of $25 million by 2021 The
net financial asset position indicates that financial resources will be available to fund future
operations The reduced net financial assets is due to a combination of a increase in the cash
position that is more than offset by an increase in liabilities with increases in deferred revenue
balances and the introduction of debt in 2019
The next important indicator contained in the Statement of Financial Position is the net book
value of TCA Another important indicator in the Statement of Financial Position is the
accumulated surplus This indicator provides a measure of the resources available to the City
for managing its water system The accumulated surplus is projected to increase from
approximately $726 million in 2016 to approximately $863 million by 2021 The accumulated
surplus consists of the net financial assets that are available to fund future operations plus the
non-financial assets that are made up of net TCA balance representing past investments in
water infrastructure It is important to note that the non-financial assets (TCA) cannot be
readily monetized without affecting the delivery of water operations
49 DFA Infrastructure International Inc
City of Waterloo Water amp Sanitary Sewer Rate Design Study Final Report amp Water Financial Plan No 112-301
April 1 2016
The next important indicator contained in the Statement of Financial Position is the net book
value of TCA Another important indicator in the Statement of Financial Position is the
accumulated surplus This indicator provides a measure of the resources available to the City
for managing its water system The accumulated surplus is projected to increase from
approximately $726 million in 2016 to approximately $863 million by 2021 The accumulated
surplus consists of the net financial assets that are available to fund future operations plus the
non-financial assets that are made up of net TCA balance representing past investments in
water infrastructure It is important to note that the non-financial assets (TCA) cannot be
readily monetized without affecting the delivery of water operations
Table 8-2 shows that net TCA are expected to grow by $154 million over the forecast period or
from $684 million in 2016 to $838 million 2021 This indicates that the City has plans to invest
in significant tangible capital assets in excess of the consumption of existing assets Further a
consumption ratio consisting of the accumulated amortization of the Citys TCA as a percent of
historical cost ratio highlights the aged condition of the assets and their potential replacement
needs The Citys Water Asset Consumption Ratio actually declines over the forecast period
from 30 to 28 as newly acquired or constructed assets would more than offset the
consumption of existing assets
Another important indicator in the Statement of Financial Position is the accumulated surplus
This indicator provides a measure of the resources available to the City for managing its water
system The accumulated surplus is projected to increase from approximately $726 million in
2016 to approximately $863 million by 2021 The accumulated surplus consists of the net
financial assets that are available to fund future operations plus the non-financial assets that
are made up of net TCA balance representing past investments in water infrastructure It is
important to note that the non-financial assets (TCA) cannot be readily monetized without
affecting the delivery of water operations
50 DFA Infrastructure International Inc
City of Waterloo Water amp Sanitary Sewer Rate Design Study Final Report amp Water Financial Plan No 112-301
April 1 2016
Table 8-2 Statement of Financial Position
Statement of Financial Position 2016 2017 2018 2019 2020 2021
Financial Assets
CashReceivables and Investment $6767426 $6080033 $6563808 $7004435 $6711995 $7206337
Total Financial Assets $6767426 $6080033 $6563808 $7004435 $6711995 $7206337
Financial Liabilities
Accounts Payable amp Deferred Revenue $2068633 $1525462 $1732356 $2364790 $2872351 $3366692
Long-term Liabilities $534197 $481614 $427454 $858621 $1169636 $1380142
Total Financial Liabilities $2602831 $2007076 $2159810 $3223411 $4041987 $4746835
Net Financial Assets (Net Debt) $4164595 $4072958 $4403999 $3781024 $2670009 $2459502
Non-Financial Assests
Tangible Capital Assets $97235501 $101396201 $104426305 $108247701 $112142203 $116085079
Accumulated Amortization ($28800415) ($29534931) ($30410031) ($31003111) ($31622734) ($32265603)
Total Non-Financial Assets $68435086 $71861270 $74016275 $77244590 $80519469 $83819476
Accumulated Surplus $72599681 $75934228 $78420273 $81025614 $83189478 $86278979
Financial Indicators 2016 2017 2018 2019 2020 2021
Increase (Decrease) in Net Financial Assets $392962 ($91637) $331041 ($622974) ($1111016) ($210506)
Increase (Decrease) in Net Tangible Capital Assets $3015692 $3426184 $2155004 $3228316 $3274879 $3300007
Increase (Decrease) in Accumulated Surplus $3408654 $3334547 $2486045 $2605341 $2163864 $3089501
Water Asset Consumption Ratio 30 29 29 29 28 28
822 Statement of Operations
The Statement of Operations is presented in Table 8-3 It summarizes the annual revenues and
expenses associated with managing the Cityrsquos water system It provides a report on the
transactions and events that have an influence on the accumulated surplus The main revenue
items included are
bull Revenues from Water Rates and Charges
bull Earned Revenues (earned development charges) and
bull Other Revenues (miscellaneous fees and charges recoveries etc)
The main expense items are
bull The annual cost of operating and maintaining the water system including the cost of
water purchases from the Region and
bull Amortization expenses on existing and added TCA
The operating surplus (or deficit) is an important indicator contained in the Statement of
Operations An operating surplus (deficit) measures whether operating revenues generated in a
year were sufficient to cover operating expenses incurred in that year It is important to note
that an annual surplus is necessary to ensure funds will be available to address non-expense
items such as TCA acquisitions over and above amortization expenses reservereserve fund
contributions for asset replacement and rate stabilization and repayment of outstanding debt
principal A ratio of operating surplus to total revenue is shown in Table 8-3 to reflect the
percent of total revenue that can be allocated to funding the non-expense items noted above
51 DFA Infrastructure International Inc
City of Waterloo Water amp Sanitary Sewer Rate Design Study Final Report amp Water Financial Plan No 112-301
April 1 2016
This ratio decreases from 15 in 2016 to 12 in 2021 The higher the ratio the greater
proportion of operating revenues that are available for paying down debt purchasing capital
assets and setting aside in reserve for future use Cash generated from operations is discussed
in the Statement of Cash Flows section
Table 8-3 Statement of Operations
Statement of Operations 2016 2017 2018 2019 2020 2021
Water Revenue
User Revenue $19471007 $20143317 $20623089 $21822413 $23024080 $24610398
Earned Revenue $1763719 $1649661 $859546 $490371 $497236 $504197
Other Revenue $1437931 $1445213 $1452652 $1463926 $475536 $487492
Total Revenues $22672657 $23238191 $22935287 $23776710 $23996852 $25602087
Water Expenses
Gross $5466741 $5569487 $5679838 $5902122 $6034310 $6171363
Water Purchased from Region $12404140 $12875909 $13262328 $13703114 $14157651 $14635550
Operating Expenses $17870881 $18445396 $18942166 $19605236 $20191961 $20806913
Interest on Debt $0 $0 $0 $0 $25759 $35089
Amortization 1393123 1458248 1507076 1566133 1615269 1670585
Total Expenses $19264004 $19903645 $20449242 $21171369 $21832989 $22512586
Annual Surplus(Deficit) $3408654 $3334547 $2486045 $2605341 $2163864 $3089501
Accumulated Surplus(Deficit) Beginning of Year $69191027 $72599681 $75934228 $78420273 $81025614 $83189478
Accumulated Surplus (Deficit) End of Year $72599681 $75934228 $78420273 $81025614 $83189478 $86278978
Financial Indicators 2016 2017 2018 2019 2020 2021
Increase (Decrease) in Total Revenues ($580510) $565534 ($302904) $841422 $220142 $1605235
Increase (Decrease) in Total Expenses $879750 $639641 $545597 $722127 $661620 $679598
Increase (Decrease) in Annual Surplus ($1460260) ($74107) ($848501) $119296 ($441478) $925637
Operating Surplus Ratio 15 14 11 11 9 12
823 Statement of Cash Flow
The Statement of Cash Flow is presented in Table 8-4 This statement summarizes the main
cash inflows and outflows related to the water system in four (4) main areas - operating
capital investing and financing and shows the annual changes in cash
The operating cash transactions begin with the surplus or deficit identified in the Statement of
Operations This figure is adjusted to add or subtract non-cash items that were included as
revenues or expenses (eg amortization expenses) It is assumed that there are no ldquoinvesting
activitiesrdquo over the period The capital section indicates the amounts to be spent to acquire
capital assets (TCA) or to be received from the sale of assets In the Cityrsquos case it is assumed
that there are no assets to be sold to generate cash The financing section identifies the funds
to be received from development charges receipts ProvincialFederal Grants and proceeds
from the issuance of debenture as cash inflows and the portion of debt repaid as cash
outflows No grant funding is projected over the forecast period
Table 8-4 indicates that cash is generated from operations which is used in funding the
acquisition of TCA and towards building internal reserves The Citys cash position is projected
to increase over the forecast period from $67 million in 2016 to $72 million in 2021
52 DFA Infrastructure International Inc
City of Waterloo Water amp Sanitary Sewer Rate Design Study Final Report amp Water Financial Plan No 112-301
April 1 2016
Table 8-4 Statement of Cash Flow
Statement of Cashflows 2016 2017 2018 2019 2020 2021
Cash Provided by
Operating Activities
Annual Surplus(Deficit) $3408654 $3334547 $2486045 $2605341 $2163864 $3089501
Non-Cash Items
Amortization $1393123 $1458248 $1507076 $1566133 $1615269 $1670585
Earned Revenue ($1763719) ($1649661) ($859546) ($490371) ($497236) ($504197)
Net Change in Cash Provided by Operating Activities $3038057 $3143134 $3133575 $3681103 $3281896 $4255888
Capital Activities
Purchase of TCA ($4408815) ($4884432) ($3662081) ($4794449) ($4890148) ($4970592)
Net Change in Cash Used in Capital Activities ($4408815) ($4884432) ($3662081) ($4794449) ($4890148) ($4970592)
Financing Activities
DC Collections $1088065 $1106489 $1066441 $1122805 $1004797 $998539
ProvincialFederal Grants $0 $0 $0 $0 $0 $0
Proceeds From Long-Term Debt $0 $0 $0 $486953 $410951 $349288
Repayment of Long-Term Debt ($51052) ($52583) ($54161) ($55785) ($99936) ($138782)
Net Change in Cash Used in Financing Activities $1037013 $1053906 $1012280 $1553972 $1315812 $1209045
Net Change in Cash and Cash Equivalents ($333744) ($687392) $483775 $440627 ($292440) $494342
Cash and Cash Equivalents Beginning of the Year $7101170 $6767426 $6080033 $6563808 $7004435 $6711995
Cash and Cash Equivalents End of the Year $6767426 $6080033 $6563808 $7004435 $6711995 $7206337
824 Lead Service Pipe Removal
The financial plan is also required to detail the extent to which the information described above
relates directly to the replacement of lead service pipes
The City of Waterloo 2016-2025 Capital Budget outlines the proposed rehabilitation and
reconstruction projects for the next 10 years Lead services are replaced as part of watermain
rehabilitation projects andor road reconstruction projects when undertaken Although not all
the streets contain lead services all of the water services to the property line are replaced for
every rehabilitation and reconstruction project
Lead services are also replaced individually when they are found in the field or if requested by
the owner if the full rehabilitation project and reconstruction project has not been identified in
the capital forecast and if the new service can be connected to the customer side
53 DFA Infrastructure International Inc
City of Waterloo Water amp Sanitary Sewer Rate Design Study Final Report amp Water Financial Plan No 112-301
April 1 2016
9 Sanitary Sewer System Financial Plan
Preparing a Sanitary Sewer System Financial Plan is not mandatory but has become a municipal
best practice over the past few years It is typically prepared in accordance with the
requirements of OReg 45307 which applies to water systems
This financial plan involves the review analysis and assessment of financial information
contained in the rate study including costs revenues debt cash transactions and Tangible
Capital Assets (TCA) to prepare the following three (3) financial statements covering the period
2016 to 2021 as required under OReg 45307
bull Statement of Financial Position
bull Statement of Operations and
bull Statement of Cash Flow
Appendix H lists each requirement of the regulation and references the respective financial
statements and other items that contain relevant information required under each item The
financial plan applies to a period of (6) six years from 2016 to 2021 to be consistent with the
period covered by the Water System Financial Plan It is anticipated that the financial plan
would be made available to the public at no charge on the Cityrsquos website following final
approval of the rate study and financial plan by Council
91 Tangible Capital Assets (TCA) Analysis
The results of the rate study contained in this report are used as the basis for preparing the
wastewater system financial plan The Cityrsquos Asset Inventories were also used in the
preparation of the wastewater system financial plan The amortization of the tangible capital
assets is shown as a ldquonon-cashrdquo annual cost that reflects the annual ldquouserdquo of assets until the
end of their respective useful lives Allowances are made to finance the replacement and or
rehabilitation of the existing assets once they ldquoexpirerdquo and can no longer play a role in
providing the required wastewater service to customers However it should be noted that since
amortization is based on the original (historical) cost at the time the asset was placed in service
it does not account for inflation since the year of installation Therefore basing asset
replacement costs on amortization alone is not sufficient to cover the future replacement
needs
The TCA projections contained in the Cityrsquos wastewater financial plan are based on the
following assumptions
bull Amortization of existing assets is based on the Cityrsquos Tangible Capital Assets policies and
procedures Amortization of new infrastructure investments is based on straight line
depreciation with full year depreciation charged in the year of acquisition
54 DFA Infrastructure International Inc
City of Waterloo Water amp Sanitary Sewer Rate Design Study Final Report amp Water Financial Plan No 112-301
April 1 2016
bull Historical costs life expectancy and remaining useful life as per the TCA data provided
by the City
bull Fully depreciated assets continue to be used in service ie no asset removals and
bull New assets to be acquired are based on the capital forecast The forecast includes
projects in the Cityrsquos Capital Budget Forecast and asset replacement projections based
on the Cityrsquos Asset Management Plan
Asset Value
The wastewater system is comprised of the following capital asset classes
bull Sanitary Sewer Gravity Mains
bull Sanitary Sewer Forcemains
bull Manholes and
bull Pumping Stations
Table 9-1 shows the current capital asset value based on historical cost and accumulated
amortization to 2015 This is reflected as the net book value (NBV) ie the ldquoaccountingrdquo value
and indicates that the wastewater system as a whole is approximately 29 depreciated or has
approximately 71 remaining life based on the TCA data This suggests that the wastewater
system assets are relatively new
Table 9-1 Asset Amortization and 2015 Net Book Value (NBV)
2015 Sanitary Sewer Asset Details
Historical Cost $135873861 29
Accumulated Amortization $39335177 71
Net Book Value (2015) $96538684 100
92 Statement of Financial Position
The Statement of Financial Position is presented in Table 9-2 This statement summarizes the
Cityrsquos sanitary sewer related financial and non-financial assets (Tangible Capital Assets ndash TCA)
and liabilities and provides the net financial asset (net debt) position and accumulated surplus
related to managing the sanitary sewer system The financial assets are primarily cash balances
in the sanitary sewer reserves and reserve funds Liabilities consist of development charge
reserve fund balances (ie deferred revenues) The City does not have any outstanding long-
term debt for the Cityrsquos sanitary sewer systemThe non-financial assets (TCA) include the Cityrsquos
sanitary sewer infrastructure The historical costs are amortized over the asset life to arrive at
the net book value each year from 2016 to 2021 New assets are added in the years acquired
developed or built Contributed assets are primarily new infrastructure that would be
transferred to the Cityrsquos ownership and control by developers as they are completed However
55 DFA Infrastructure International Inc
City of Waterloo Water amp Sanitary Sewer Rate Design Study Final Report amp Water Financial Plan No 112-301
April 1 2016
asset (net debt) position and accumulated surplus related to managing the sanitary sewer
system The financial assets are primarily cash balances in the sanitary sewer reserves and
reserve funds Liabilities consist of development charge reserve fund balances (ie deferred
revenues) The City does not have any outstanding long-term debt for the Cityrsquos sanitary sewer
systemThe non-financial assets (TCA) include the Cityrsquos sanitary sewer infrastructure The
historical costs are amortized over the asset life to arrive at the net book value each year from
2016 to 2021 New assets are added in the years acquired developed or built Contributed
assets are primarily new infrastructure that would be transferred to the Cityrsquos ownership and
control by developers as they are completed However this is assumed to be zero It is also
assumed that other non-financial assets such as inventory and prepaid expenses are zero
Contained within the Statement of Financial Position are important indicators the first being
net financial assets (or net debt) which is defined as the difference between financial assets and
liabilities This indicator provides a measure of the sanitary sewer systems future revenue
requirement Another important indicator in the Statement of Financial Position is the
accumulated surplus This indicator provides measure of the resources available to the City for
managing its system The accumulated surplus is projected to increase from approximately
$1139 million in 2016 to approximately $1265 million by 2021 The accumulated surplus is
made up of the net TCA balance representing past investments in the sanitary sewer
infrastructure and net financial assets It is important to note that the non-financial assets (TCA)
cannot be readily monetized without affecting the sanitary sewer operations
Table 9-2 indicates that in 2016 the Citys sanitary sewer system will be in a net financial asset
position in the amount of $128 million This will be increased to a net financial asset position of
$141 million by 2021 The net financial asset position indicates that financial resources will be
available to fund future operations The increased net financial assets position is due to a
combination of an increase in the cash position that is offset by increases in liabilities mainly
through an increase in a deferred revenue balance The next important indicator contained in
the Statement of Financial Position is the net book value of TCA Another important indicator in
the Statement of Financial Position is the accumulated surplus This indicator provides measure
of the resources available to the City for managing its system The accumulated surplus is
projected to increase from approximately $1139 million in 2016 to approximately $1265
million by 2021 The accumulated surplus is made up of the net TCA balance representing past
investments in the sanitary sewer infrastructure and net financial assets It is important to note
that the non-financial assets (TCA) cannot be readily monetized without affecting the sanitary
sewer operations
Table 9-2 shows that net TCA are expected to grow by $113 million over the forecast period or
from $1010 million in 2016 to $1123 million 2021 This indicates that the City has plans to
invest significant dollars in tangible capital assets in excess of the consumption of existing
assets Further a consumption ratio consisting of the accumulated amortization of the Citys
TCA as a percent of historical cost ratio highlights the aged condition of the assets and their
potential replacement needs The Citys Sanitary Sewer Asset Consumption Ratio remains fairly
56 DFA Infrastructure International Inc
City of Waterloo Water amp Sanitary Sewer Rate Design Study Final Report amp Water Financial Plan No 112-301
April 1 2016
stable over the forecast period ranging from 29 - 30 as newly acquired or constructed
assets essentially offset the consumption of existing assets
Another important indicator in the Statement of Financial Position is the accumulated surplus
This indicator provides measure of the resources available to the City for managing its system
The accumulated surplus is projected to increase from approximately $1139 million in 2016 to
approximately $1265 million by 2021 The accumulated surplus is made up of the net TCA
balance representing past investments in the sanitary sewer infrastructure and net financial
assets It is important to note that the non-financial assets (TCA) cannot be readily monetized
without affecting the sanitary sewer operations
Table 9-2 Statement of Financial Position
Statement of Financial Position 2016 2017 2018 2019 2020 2021
Financial Assets
CashReceivables and Investment $13731061 $13895204 $12164873 $13378657 $16515184 $18166448
Total Financial Assets $13731061 $13895204 $12164873 $13378657 $16515184 $18166448
Financial Liabilities
Accounts Payable amp Deferred Revenue $894210 $883620 $513420 $233149 $1760764 $3968923
Long-term Liabilities $0 $0 $0 $0 $0 $0
Total Financial Liabilities $894210 $883620 $513420 $233149 $1760764 $3968923
Net Financial Assets (Net Debt) $12836851 $13011585 $11651453 $13145508 $14754420 $14197524
Non-Financial Assests
Tangible Capital Assets $141770533 $145955938 $151059146 $154957662 $157415679 $160653548
Accumulated Amortization ($40756475) ($42198525) ($43520590) ($45264718) ($46892049) ($48329678)
Total Non-Financial Assets $101014058 $103757414 $107538555 $109692943 $110523630 $112323870
Accumulated Surplus $113850909 $116768999 $119190008 $122838451 $125278050 $126521394
Financial Indicators 2016 2017 2018 2019 2020 2021
Increase (Decrease) in Net Financial Assets $966414 $174733 ($1360132) $1494055 $1608912 ($556895)
Increase (Decrease) in Net Tangible Capital Assets $4475375 $2743356 $3781142 $2154388 $830687 $1800240
Increase (Decrease) in Accumulated Surplus $5441789 $2918089 $2421010 $3648443 $2439598 $1243345
Water Asset Consumption Ratio 29 29 29 29 30 30
93 Statement of Operations
The Statement of Operations is presented in Table 9-3 It summarizes the annual revenues and
expenses associated with managing the Cityrsquos sanitary sewer system It provides a report on the
transactions and events that have an influence on the accumulated surplus The main revenue
items included are
bull Revenues from Sanitary Sewer Rates and Charges
bull Earned Revenues (earned development charges capital contributions and sewer post
period capacity recovery) and
bull Other Revenues (miscellaneous fees and charges additional sewage revenues
(Kitchener) etc)
The main expense items are
57 DFA Infrastructure International Inc
City of Waterloo Water amp Sanitary Sewer Rate Design Study Final Report amp Water Financial Plan No 112-301
April 1 2016
bull The annual cost of operating and maintaining the sanitary sewer system including
Regional charges for treating wastewater and
bull Amortization expenses on existing and new TCA
The operating surplus (deficit) is an important indicator contained in the Statement of
Operations An operating surplus (deficit) measures whether operating revenues generated in
a year were sufficient to cover operating expenses incurred in that year It is important to note
that an annual surplus is necessary to ensure funds will be available to address non-expense
items such as TCA acquisitions over and above amortization expenses reservereserve fund
contributions for asset replacement and rate stabilization and repayment of outstanding debt
principal A ratio of operating surplus to total revenue is shown in Table 9-3 to reflect the
percent of total revenue that can be allocated to funding the non-expense items noted above
The higher the ratio the greater proportion of operating revenues that are available for paying
down debt purchasing capital assets and setting aside in reserves for future use Cash
generated from operations is discussed in the Statement of Cash Flows section
Table 9-3 Statement of Operations
Statement of Operations 2016 2017 2018 2019 2020 2021
Water Revenue
User Revenue $22639530 $23642507 $24500418 $26620392 $27414835 $28741194
Earned Revenue $4955280 $2749781 $3010247 $3059851 $959828 $263792
Other Revenue $1180638 $1100638 $1019638 $1056580 $1081060 $1121094
Total Revenues $28775448 $27492926 $28530303 $30736823 $29455723 $30126080
Water Expenses
Gross $5057612 $5191245 $5263715 $5388699 $4517432 $4650027
Wastewater Treated $16248249 $17291318 $18673935 $19469577 $20227227 $21906220
Operating Expenses $21305861 $22482563 $23937650 $24858276 $24744659 $26556247
Interest on Debt $0 $0 $0 $0 $0 $0
Amortization 2027798 2092273 2171644 2230104 2271466 2326489
Total Expenses $23333660 $24574836 $26109293 $27088380 $27016124 $28882736
Annual Surplus(Deficit) $5441789 $2918089 $2421010 $3648443 $2439598 $1243345
Accumulated Surplus(Deficit) Beginning of Year $108409121 $113850909 $116768999 $119190008 $122838451 $125278050
Accumulated Surplus (Deficit) End of Year $113850909 $116768999 $119190008 $122838451 $125278050 $126521394
Financial Indicators 2016 2017 2018 2019 2020 2021
Increase (Decrease) in Total Revenues $3103799 ($1282523) $1037378 $2206520 ($1281100) $670357
Increase (Decrease) in Total Expenses $3392720 $1241177 $1534457 $979087 ($72256) $1866611
Increase (Decrease) in Annual Surplus ($288921) ($2523700) ($497079) $1227433 ($1208844) ($1196254)
Operating Surplus Ratio 19 11 8 12 8 4
94 Statement of Cash Flow
The Statement of Cash Flow is presented in Table 9-4 This statement summarizes the main
cash inflows and outflows related to the sanitary sewer system in four (4) main areas -
operating capital investing and financing and shows the annual changes in cash Contained
within the 2016 cash position is a receivable of approximately $395 million to be fully collected
by 2021 from the Develop Charges Reserve Fund for capacity related projects funded in prior
years from the Sanitary Sewer Capital Reserve Fund
58 DFA Infrastructure International Inc
City of Waterloo Water amp Sanitary Sewer Rate Design Study Final Report amp Water Financial Plan No 112-301
April 1 2016
The operating cash transactions begin with the surplus or deficit identified in the Statement of
Operations This figure is adjusted to add or subtract non-cash items that were included as
revenues or expenses (eg amortization expenses) It is assumed that there were no ldquoinvesting
activitiesrdquo over the period The capital section indicates the amounts spent to acquire capital
assets (TCA) or received from the sale of assets In the Cityrsquos case it is assumed that there are
no assets to be sold to generate cash The financing section identifies the funds received from
development charges receipts ProvincialFederal Grants and proceeds from the issuance of
long-term debt as cash inflows offset by the portion of debt repaid as cash outflows No debt
however is projected over the forecast period
Table 9-4 indicates that cash has been generated from operations which is used in funding the
acquisition of TCA and towards building internal reserves over the forecast period The Citys
cash position is projected to increase over the forecast period from $137 million in 2016 to
$182 million in 2021
Table 9-4 Statement of Cash Flows
Statement of Cashflows 2016 2017 2018 2019 2020 2021
Cash Provided by
Operating Activities
Annual Surplus(Deficit) $5441789 $2918089 $2421010 $3648443 $2439598 $1243345
Non-Cash Items
Amortization $2027798 $2092273 $2171644 $2230104 $2271466 $2326489
Earned Revenue ($4955280) ($2749781) ($3010247) ($3059851) ($959828) ($263792)
Net Change in Cash Provided by Operating Activities $2514307 $2260582 $1582406 $2818696 $3751236 $3306041
Capital Activities
Purchase of TCA ($6503173) ($4835629) ($5952785) ($4384491) ($3102152) ($4126728)
Net Change in Cash Used in Capital Activities ($6503173) ($4835629) ($5952785) ($4384491) ($3102152) ($4126728)
Financing Activities
Other Municipal Sources
DC Collections $2693579 $2739190 $2640048 $2779579 $2487443 $2471951
ProvincialFederal Grants $411623 $0 $0 $0 $0 $0
Proceeds From Long-Term Debt $0 $0 $0 $0 $0 $0
Repayment of Long-Term Debt $0 $0 $0 $0 $0 $0
Net Change in Cash Used in Financing Activities $3105203 $2739190 $2640048 $2779579 $2487443 $2471951
Net Change in Cash and Cash Equivalents ($883664) $164143 ($1730331) $1213784 $3136527 $1651264
Cash and Cash Equivalents Beginning of the Year $14614725 $13731061 $13895204 $12164873 $13378657 $16515184
Cash and Cash Equivalents End of the Year $13731061 $13895204 $12164873 $13378657 $16515184 $18166448
59 DFA Infrastructure International Inc
City of Waterloo Water amp Sanitary Sewer Rate Design Study Final Report amp Water Financial Plan No 112-301
April 1 2016
10 Conclusions and Recommendations 101 Conclusions
Based on the information reviewed and analyses completed the following are the main
conclusions
1 The average annual full cost of managing the Cityrsquos water system over the study period
(next 24 years) is anticipated to be $306 million compared to current (2016) annual costs
of approximately $205 million Therefore water rate and service charge increases are
necessary to ensure that the system costs are fully funded and financially sustainable over
the long-term as required by O Reg 45307
2 The Regionrsquos Charges estimated at $181 million (annual average cost) for water treatment
represent the largest portion of system costs (59) over the next 24 years Contributions
to the capital reserve account for $39 million (13) OampM activities related to the Cityrsquos
operations account for $76 million (25) and debt repayment accounts for $097 million
(3)
3 A water infrastructure funding gap of approximately $33 million over the next 20 years
would continue to exist if rates and service charges are not adjusted to generate sufficient
funding levels
4 The financial statements for the water system prepared based on the results of the ratestudy analyses and projections indicate the following
- The accumulated surplus is projected to increase from approximately $726
million in 2016 to approximately $863 million by 2021
- The operating surplus ratio is projected to decrease from 15 in 2016 to 12 by
2021
- The cash position is projected to increase from $68 million in 2016 to $72
million in 2021
These indicate that the financial outlook for the water system over the 6-year period 2016
to 2021 is good
5 The average annual full cost of managing the Cityrsquos sanitary sewer system over the study
period (next 24 years) is anticipated to be $383 million compared to 2016 costs of
approximately $245 million Therefore sanitary sewer rate increases are necessary to
ensure that the system costs are fully funded and financially sustainable over the long-
term
6 The Regionrsquos Charges estimated at $29 million (annual average cost) for wastewater
treatment represent the largest portion of system costs (76) over the next 24 years
Contributions to the capital reserve account for $29 million (8) OampM activities related
60 DFA Infrastructure International Inc
City of Waterloo Water amp Sanitary Sewer Rate Design Study Final Report amp Water Financial Plan No 112-301
April 1 2016
to the Cityrsquos operations account for $59 million (15) and debt repayment accounts for
$05 million (1)
7 The current funding levels are sufficient for meeting the projected needs over the next 20
years However an infrastructure funding gap in excess of $72 million is projected beyond
2035 to 2065 Debt financing should be considered as part of the funding strategy to
address this infrastructure funding gap which is projected to occur just beyond the study
period
8 The financial statements for the sanitary sewer system prepared based on the results of
the rate study analyses and projections indicate the following
- The accumulated surplus is projected to increase from approximately $1139
million in 2016 to approximately $1265 million by 2021
- The operating surplus ratio is projected to decrease from 17 in 2016 to 4 by
2021
- The cash position is projected to increase from $137 million in 2016 to $182
million in 2021
These indicate that the financial outlook for the sanitary sewer system over the 6-year
period 2016 to 2021 is good
9 Based on a qualitative review all options would provide the level of funding to be fully
sustainable over the long-term Although Option 3 is best from a water conservation and
user pay guiding principle perspective it has significant disadvantages including but not
limited to
- Revenue uncertainty resulting from conservation due to the higher Block 2 rate
- Potentially high impacts (201 to 325 increases) to the non-residential
customers that may affect the attraction and retention of business These levels
of increases are significant and would require further dialogue with the business
community and volume data analysis prior to confirming the thresholds for each
block and the factor to be used for setting the Block 2 rate and
- The risk of shifting a much larger portion of costs to the residential sector should
business customers relocate or discontinue operations
Option 2 offers the most predictable revenues and would ensure that at least 15 of the
annual water revenues would be guaranteed while providing sufficient incentive for
customers to conserve
Option 1 still offers a fair and reasonable rate structure because the amount paid varies
almost directly with consumption due to the low fixed water charges (none for sanitary
sewer) Under Option 1 from a high level equity perspective the residential and non-
residential sectors pay their fair share Residential customers consume approximately
55 of the water and contribute 55 of the annual revenue while the non-residential
61 DFA Infrastructure International Inc
City of Waterloo Water amp Sanitary Sewer Rate Design Study Final Report amp Water Financial Plan No 112-301
April 1 2016
consumers account for the remaining 45 of consumption and revenues The major
disadvantage of the existing rate structure is the low level of revenue stability as only a
marginal amount of the annual revenue is collected via fixed fees This lack of revenue
stability will be offset to some extent by the introduction of the rate stabilization
reserves Therefore Option 1 could be remain a viable option moving forward should
Council not wish to proceed with Option 2 due to the large impact to the small and
average residential customers
102 Recommendations
The following are the primary recommendations for consideration by the City
10 Implement the rate structure described as Option 2 in this report effective 2019 to achieve
full cost recovery and ensure that 15 revenue recovery from the Water and Sanitary
Sewer Service Charges This would provide the best level of revenue stability compared to
the other options However if the potential cost increases to the small and average
residential customers under this option is of concern then it would be reasonable to
maintain the existing rate structure (Option 1) provided that the new rate stabilization
reserve funds discussed in this report are established The funds that would be available
from these reserves would reduce the financial risks due to revenue volatility
11 Increase transfers to the Water Capital Reserve Fund to the levels noted in Section 612 of
this report and included in Appendix D to meet the minimum target balance of 1 of
asset value adjusted for annual inflation each year subject to annual reviews of the water
systemrsquos asset needs to fully fund the capital requirements
12 Maintain transfers to the Sanitary Sewer Capital Reserve Fund at the levels noted in
Section 622 of this report and included in Appendix D to meet the minimum target
balance of 1 of asset value adjusted for annual inflation each year subject to annual
reviews of the sanitary sewer systemrsquos asset needs to fully fund the capital requirements
13 Utilize debt financing in the near term to help address the existing water capital shortfall
and sanitary sewer capital shortfall projected in the longer term in an effort to reduce the
burden placed on the rates
14 Establish a separate rate stabilization reserve fund for both water and sanitary sewer to be
used for offsetting any deficits and stabilizing rates and service charges These reserves to
be phased-in at a rate of 1 of annual operating cost from 2019-2023 until the target
balance of 5 of annual revenues is achieved
15 Continue to take steps to identify and address the causes of non-revenue water and inflow
and infiltration to the sanitary sewer system
16 That the OReg 45307 Water System Financial Plan No 112-301 including the Financial
Statements contained herein be approved by Council and submitted to the Province of
62 DFA Infrastructure International Inc
City of Waterloo Water amp Sanitary Sewer Rate Design Study Final Report amp Water Financial Plan No 112-301
April 1 2016
Ontario on or before June 1 2016 in accordance with the Drinking Water System Licence
renewal requirements and O Reg 45307
That a copy of this document entitled ldquoWater and Sanitary Sewer Rate Design Final
Report amp Water Financial Plan No 112-301rdquo be posted on the Cityrsquos website
(httpwwwwaterloocaratereview) and made available to the public at no charge
17 That the Sanitary Sewer System Financial Plan including the Financial Statements
contained herein be received by Council
18 The City should actively pursue Grant funding opportunities based on recent Federal
Budget announcements to increase funding to municipalities for infrastructure and lsquogreenrsquo
projects
63 DFA Infrastructure International Inc
City of Waterloo Water amp Sanitary Sewer Rate Design Study Final Report amp Water Financial Plan No 112-301
April 1 2016
References
1 Development Charges Background Study November 16 2012 Hemson Consulting Ltd
2 People amp Jobs Forecast 2015 -2025
3 City of Waterloo 2015- 2024 Capital Budget (10 year program)
4 Water Production and Supply Volumes Records ndashCity of Waterloo
5 Wastewater Treatment Volumes Forecast ndash City of Waterloo
6 Water amp Wastewater Treatment Rates Forecast ndash Region of Waterloo
7 City of Waterloo PSAB 3150 TCA Data (2014)
8 City of Waterloo 2015 and 2016 Operating Budgets
9 City of Waterloo By-Law Number 2015-24
10 City of Waterloo Debt Repayment Schedules (Growth)
11 City of Waterloo DC Reserves Continuity Schedule
12 City of Waterloo Water Capital Reserve Continuity Schedule
13 City of Waterloo Sanitary Sewer Capital Reserve Continuity Schedule
14 City of Waterloo Asset Management Plan (2014)
15 City of Waterloo Water amp Sanitary Sewer Asset Inventories
16 City of Waterloo Debt Management Policy FC-009 Revised May 12 2014
17 Working Paper Do Increasing Block Rate Water Budgets Reduce Residential Water
Demand A Case Study in Southern California Water Science amp Policy Centre University
of California Riverside K Baerenklau K Schwabe A Dinar September 1 2013
18Environment Canada (2011) 2011 Municipal Water Pricing Report Full-Cost Rates for
Water and the Chimera of ldquoAffordabilityrdquo C Bodimeade amp S Renzetti March 1 2013
64 DFA Infrastructure International Inc
Appendix A
EXCERPT OF CITY OF WATERLOO
BY-LAW 2015-079
THE CORPORATION OF THE CITY OF WATERLOO
BY-LAW NUMBER 2015-079
BEING a by-law to impose fees and charges on persons
WHEREAS section 391(1) of the Municipal Act 2001 SO 2001 c 25 as amended authorizes a municipality to impose fees or charges on persons for services or activities provided or done by or on behalf of it for costs payable by it for services or activities provided or done by or on behalf of any other municipality or any local board and for use of its property including property under its control
AND WHEREAS section 391(2) of the Municipal Act 2001 SO 2001 c 25 as amended states that a fee or charge imposed for capital costs related to services or activities may be imposed on persons not receiving an immediate benefit from the services or activities but who will receive a benefit at some later point in time
AND WHEREAS section 391(3) of the Municipal Act 2001 SO 2001 c 25 as amended states that the costs included in a fee or charge may include costs incurred by the municipality or local board related to administration enforcement and the establishment acquisition and replacement of capital assets
AND WHEREAS section 391(4) of the Municipal Act 2001 SO 2001 c 25 as amended states that a fee or charge may be imposed whether or not it is mandatory for the municipality or local board imposing the fee or charge to provide or do the service or activity pay the costs or allow the use of its property
AND WHEREAS section 391(5) of the Municipal Act 2001 SO 2001 c 25 as amended states that in the event of a conflict between a fee or charge by-law and the Municipal Act 2001 SO 2001 c 25 as amended or any other act or regulation made under any other act the by-law prevails
AND WHEREAS section 69(1) of the Planning Act RSO 1990 c P13 as amended states that the council of a municipality by by-law and a planning board by resolution may establish a tariff of fees for the processing of applications made in respect of planning matters which tariff shall be designed to meet only the anticipated cost to the municipality or to a committee of adjustment or land division committee constituted by the council of the municipality in respect of the processing of each type of application provided for in the tariff
AND WHEREAS section 69(2) of the Planning Act RSO 1990 c P13 as amended states that despite a tariff of fees established under subsection (1) the council of a municipality a planning board a committee of adjustment or a land division committee in processing an application may reduce the amount of or waive the requirement for the payment of a fee in respect of the application where the council planning board or committee is satisfied that it would be unreasonable to require payment in accordance with the tariff
AND WHEREAS section 69(3) of the Planning Act RSO 1990 c P13 as amended states that any person who is required to pay a fee under subsection (1) for the processing of an application in respect of a planning matter may pay the amount of the fee under protest and thereafter appeal to the Ontario Municipal Board against the levying of the fee or the amount of the fee by giving written notice of appeal to the Ontario Municipal Board within thirty days of payment of the fee
AND WHEREAS section 7(1)(c) of the Building Code Act 1992 SO 1992 c 23 as amended states that the council of a municipality may require the payment of fees on applications for and on the issuance of permits requiring the payment of fees for maintenance inspections and prescribing the amounts of the fees
AND WHEREAS section 7(2) of the Building Code Act 1992 SO 1992 c 23 as amended states that the total amount of the fees authorized under section 7(1)(c) must not exceed the anticipated reasonable costs of the principal authority to administer and enforce the Building Code Act 1992 SO 1992 c 23 as amended in its area of jurisdiction
AND WHEREAS section 7(3) of the Building Code Act 1992 SO 1992 c 23 as amended states that a regulation by-law or resolution establishing fees under section 7(1)(c) must provide for reduced fees to be payable in respect of the construction of a building for which a registered code agency is appointed under section 42 of the Building Code Act 1992 SO 1992 c 23 as amended
NOW THEREFORE BE IT ENACTED by the Council of The Corporation of the City of Waterloo as follows
10 CITATION
11 This by-law shall be known as the ldquoFees and Charges By-Lawrdquo ldquoFee Guiderdquo or ldquoFee Schedulerdquo of The Corporation of the City of Waterloo (the ldquoCityrdquo)
12 Should any by-law refer to the Cityrsquos or a department of the Cityrsquos ldquoFee Guiderdquo or ldquoFee Schedulerdquo the aforesaid by-law in using any of the aforementioned terms shall be interpreted to mean this by-law regardless of any definition to the contrary contained within that by-law
20 DEFINITIONS
For the purposes of this by-law
21 ldquoBuilding Code Actrdquo means Building Code Act 1992 SO 1992 c 23 as amended
22 ldquoBuilding Coderdquo means Ontario Regulation 35006 as amended
23 ldquoChief Building Officialrdquo means the chief building official of the City or his or her designate appointed or constituted under sections 3 or 4 of the Building Code Act
24 ldquoCityrdquo means The Corporation of the City of Waterloo
25 ldquoCouncilrdquo means the municipal Council of the City
2
26 ldquoCommissionerrdquo means a commissioner of a department of the City and shall include the Chief Financial OfficerTreasurer and the Chief Human Resources Officer or his or her designate
27 ldquoMunicipal Actrdquo means the Municipal Act 2001 SO 2001 c 25 as amended
28 ldquopersonrdquo includes an individual unincorporated association sole proprietorship partnership corporation or municipality and
29 ldquoPlanning Actrdquo means the Planning Act RSO 1990 c P13 as amended
30 FEES AND CHARGES
31 The City hereby imposes the fees and charges outlined in Schedule ldquoArdquo to this by-law pursuant to the provisions of the Municipal Act
311 The fees and charges imposed on a person by the City as outlined in Schedule ldquoArdquo to this by-law constitute a debt of the person to the City
312 The Treasurer of the City may add fees and charges imposed by the City as outlined in Schedule ldquoArdquo to this by-law to the tax roll for the following property in the City and collect them in the same manner as municipal taxes
3121 in the case of fees and charges for the supply of a public utility the property to which the public utility was supplied and
3122 in all other cases any property for which all of the owners are responsible for paying the fees and charges
313 If the City uses a registered collection agency in good standing under the Collection Agencies Act to recover a debt including taxes payable to the City the collection agency may also recover its reasonable costs of collecting the debt but those costs shall not exceed an amount approved by the City
314 The City may sell any prescribed debt payable to the City to any other person in accordance with the rules and conditions prescribed under the Municipal Act
3141 A person who acquires a debt outlined in section 314 has the priority of the City with respect to the debt
315 The powers of a Commissioner to increase decrease or waive a fee outlined in section 316 below should only be used in exceptional circumstances as determined by the Commissioner
316 The fees and charges imposed on a person by the City as outlined in Schedule ldquoArdquo to this by-law may be increased decreased or waived completely by the Commissioner to whose department the fee or charge relates in the following circumstances
3161 where there is a material change to the program or service being offered
3
3162 where a large-scale event such as a conference or trade show is being held at a City facility or on City-owned or City-operated property and where a negotiated agreement is required
3163 where by imposing a fee or charge the City is decreasing access or imposing a barrier to a person with a disability or their support person
3164 where a fee is set incorrectly by way of an administrative error or
3165 where imposing a fee or charge would be in the opinion of the Commissioner unreasonable given the circumstances
317 A Commissioner may only increase the amount of a fee or charge pursuant to section 316 of this by-law in order to recover or partially recover the Cityrsquos actual costs in delivering the applicable program or service
318 A Commissioner may impose a new fee or charge not outlined in Schedule ldquoArdquo to this by-law but still under the provisions of the Municipal Act where a new program or service is being offered by the City The new fee or charge imposed by a Commissioner shall
3181 not exceed the Cityrsquos actual cost to deliver the new program or service and
3182 shall be included in Schedule ldquoArdquo of this by-law as soon as is practicable
319 Should a Commissioner increase decrease or waive a fee or charge pursuant to section 316 of this by-law or should a Commissioner impose a new fee or charge pursuant to section 318 of this by-law the Commissioner shall report to Council on an annual basis and outline the specific actions taken and the rationale for so doing
32 The City hereby imposes a tariff of fees outlined in Schedule ldquoBrdquo pursuant to the provisions of the Planning Act
321 Any person may apply to Council in a manner or form prescribed by the City if that person feels that there are particular circumstances which would make it unreasonable for the City to require payment in accordance with the tariff of fees outlined in Schedule ldquoBrdquo
322 Following its consideration of the aforementioned application Council may reduce the amount of or waive the requirement for the payment of a fee pursuant to Schedule ldquoBrdquo
33 The City hereby imposes the fees and charges outlined in Schedule ldquoCrdquo pursuant to the provisions of the Building Code Act
331 Every twelve (12) months the Chief Building Official shall prepare a report that contains such information as may be prescribed in the Building Code Act and its regulations about the fees and charges outlined in Schedule ldquoCrdquo and the costs
4
of the City to administer and enforce the Building Code Act in its area of jurisdiction
332 The City shall make its report pursuant to section 331 available to the public in the manner required by regulation under the Building Code Act
333 If the City proposes to change any fee or charge imposed under Schedule ldquoCrdquo the City shall
3331 give notice of the proposed changes in fees or charges to such persons as may be prescribed by regulation under the Building Code Act and
3332 hold a public meeting concerning the proposed changes in a manner determined by the Chief Building Official
334 The notice of proposed changes in fees or charges outlined in section 3331 of this by-law must contain the information prescribed by the regulations under the Building Code Act including information about the public meeting and must be given in the manner prescribed by the regulations under the Building Code Act
335 The public meeting concerning proposed changes in fees or charges outlined in section 3332 of this by-law must be held within the period specified by regulation under the Building Code Act before the regulation by-law or resolution to implement the proposed changes is made
336 Section 398 of the Municipal Act applies with necessary modifications to fees established by the City under Schedule ldquoCrdquo and with the approval of the Treasurer of the City to fees established under section 7(1)(c) of the Building Code Act by a conservation authority whose area of jurisdiction includes any part of the local municipality
34 All fees and charges imposed by this by-law including all fees and charges outlined in the schedules to this by-law shall
341 not include applicable taxes unless otherwise indicated and
342 be in full force and effect on the effective date noted in the schedule unless no effective date is noted in which case they shall be in full force and effect immediately following their passage by Council
40 SEVERABILITY
41 If a Court of competent jurisdiction should declare any section or part of a section of this by-law to be invalid such section or part of a section shall not be construed as having persuaded or influenced Council to pass the remainder of this by-law and it is hereby declared that the remainder of this by-law shall be valid and shall remain in full force and effect
50 REPEAL amp AMENDMENT
51 By-Law 2015-051 is hereby repealed
5
_________________________________
__________________________________
52 Should this by-law conflict with any other by-law or resolution of Council or any staff report approved by Council in relation to fees and charges imposed under the Municipal Act Planning Act Building Code Act or any other act this by-law shall take precedence unless specifically stated to the contrary
60 COMING INTO FORCE
61 This by-law shall come into force on the date of its passage by Council
Read a FIRST SECOND and THIRD time this 14th day of December 2015
Signed by
MAYOR ndash David Jaworsky
Signed by
CITY CLERK ndash Olga Smith
6
Integrated Planning amp Public Works Department ndash Water-Sewer-Stormwater Services Division Schedule ldquoArdquo to Fees and Charges Bylaw
WATER AND SANITARY SEWER Effective Effective
Water Rate Fee Date of Fee Fee Date of Fee
(per cubic metre) $ 160 1-Jan-2014 $ 166 1-Feb-2015 Sanitary Sewer Rate
(per cubic metre) $ 200 1-Jan-2014 $ 210 1-Feb-2015
Service Charges
Water Meters
Water Meters - New
Fire Protection Charge (large commercial accounts)
15mm Water Meter Charge (single family residential accounts)
25mm Water Meter Charge (small apartments ie Triplex accounts)
40mm Water Meter Charge (small commercial industrial accounts)
50mm Water Meter Charge (large commercial industrial accounts)
75mm Water Meter Charge (large commercial industrial accounts)
100mm Water Meter Charge (large commercial industrial accounts)
150mm Water Meter Charge (large commercial industrial accounts)
200mm Water Meter Charge (large commercial industrial accounts)
250mm Water Meter Charge (large commercial industrial accounts)
Meter Pit Charge
$ 2048 1-Jan-2014 $ 2089 1-Feb-2015
$ 285 1-Jan-2014 $ 291 1-Feb-2015
$ 575 1-Jan-2014 $ 587 1-Feb-2015
$ 1053 1-Jan-2014 $ 1074 1-Feb-2015
$ 1319 1-Jan-2014 $ 1345 1-Feb-2015
$ 2756 1-Jan-2014 $ 2811 1-Feb-2015
$ 4030 1-Jan-2014 $ 4111 1-Feb-2015
$ 6854 1-Jan-2014 $ 6991 1-Feb-2015
$ 10347 1-Jan-2014 $ 10554 1-Feb-2015
$ 13759 1-Jan-2014 $ 14034 1-Feb-2015
$ 3517 1-Jan-2014 $ 3587 1-Feb-2015
Water Meter Accuracy Deposit
Water Meter Replacement Fee - (Damaged Frozen or Missing) plus Meter Cost
RemoteMounting Bracket Assembly
Tail Piece Replacement
Remote Re-wiring
15mm Meter Kit (complete)
Verification Administration
Miscellaneous Minor Repairs
Security Tag Replacement
$ 12755 1-Jan-2014 $ 15000 1-Feb-2015
$ 7200 1-Jan-2014 $ 7310 1-Feb-2015
$ 3815 1-Jan-2014 $ 3873 1-Feb-2015
$ 1905 1-Jan-2014 $ 1934 1-Feb-2015
$ 15275 1-Jan-2014 $ 15509 1-Feb-2015
$ 16145 1-Jan-2014 $ 16392 1-Feb-2015
$ 3815 1-Jan-2014 $ 3873 1-Feb-2015
$ 7635 1-Jan-2014 $ 7752 1-Feb-2015
$ 6325 1-Jan-2014 $ 6422 1-Feb-2015
15 mm
25 mm
40 mm
50 mm
75 mm
100 mm compound
100 mm fire rated
150 mm compound
150 mm fire rated
200 mm compound
200 mm fire rated
250 mm compound
250 mm fire rated
$ 10250 1-Jan-2014 $ 10680 1-Feb-2015
$ 22500 1-Jan-2014 $ 19920 1-Feb-2015
$ 45100 1-Jan-2014 $ 59400 1-Feb-2015
$ 60200 1-Jan-2014 $ 71400 1-Feb-2015
$ 264900 1-Jan-2014 $ 219600 1-Feb-2015
na - new $ 372000 1-Feb-2015
$ 1002000 1-Jan-2014 $ 828000 1-Feb-2015
na - new $ 633000 1-Feb-2015
$ 1140000 1-Jan-2014 $ 1104000 1-Feb-2015
na - new $ 1020000 1-Feb-2015
$ 1545100 1-Jan-2014 $ 1680000 1-Feb-2015
na - new $ 1320000 1-Feb-2015
$ 2188100 1-Jan-2014 $ 2359200 1-Feb-2015
Appendix B
WampWW VOLUMES AND GROWTH PROJECTIONS
Appendix B - WampWW Volumes and Growth Projections
Water Volumes and Growth Projections
Description 2016 2017 2018 2019 2020 2021 2022 2023 2024 2025 2026 2027 2028 2029 2030 2031 2032 2033 2034 2035 2036 2037 2038 2039
Volume Purchased by Waterloo from Region (1000 msup3)
12286 12274 12268 12319 12369 12426 12455 12491 12536 12580 12623 12662 12704 12747 12790 12832 12875 12917 12961 13004 13047 13090 13134 13178
Volume Sold to Customers (1000 msup3) 10535 10451 10355 10398 10441 10484 10527 10570 10613 10655 10698 10741 10784 10827 10870 10913 10956 10999 11042 11085 11128 11171 11214 11257
Non-Revenue Water (1000 msup3) 1751 1823 1914 1921 1928 1943 1928 1922 1924 1924 1924 1921 1920 1920 1919 1919 1918 1918 1918 1918 1919 1919 1919 1920
Non-Revenue Water () 14 15 16 16 16 16 15 15 15 15 15 15 15 15 15 15 15 15 15 15 15 15 15 15
Number of Customer Accounts
30360 30360 30360 30606 30852 31098 31344 31590 31836 32082 32328 32574 32820 33066 33312 33558 33804 34050 34296 34542 34788 35034 35280 35526
Description 2016 2017 2018 2019 2020 2021 2022 2023 2024 2025 2026 2027 2028 2029 2030 2031 2032 2033 2034 2035 2036 2037 2038 2039
Waterloo Volume Treated by the
32033
32279
32525
32771
33017
33263
33509
33755
34001
34247
34493
34739
34985
Region (1000 msup3)
Number of Customers
16265
29819
16193
29819
16358
29819
16084
30065
15779
30311
16136
30557
16110
30803
16093
31049
16041
31295
16032
31541
16082 16072 16064 16058 16062 16067 16065 16063 16063 16064 16064 16064 16064 16064 Billable Wastewater Volume
from Customers (1000 msup3) 10326 10279 10209 10252 10295 10339 10382 10425 10469 10512 10555 10599 10642 10685 10729 10772 10815 10859 10902 10945 10989 11032 11075 11119
31787
Sanitary Sewer Volumes and Growth Projections
Appendix C
PROJECTED CAPITAL BUDGET REQUIREMENTS
Appendix C - Projected Capital Budget Requirements
Projected Capital Budget Requirements - Water Capital Projections
Water Capital Projections ($000)
2016 2017 2018 2019 2020 2021 2022 2023 2024 2025 2026 2027 2028 2029 2030 2031 2032 2033 2034 2035 2036 2037 2038 2039
Capital 6503 4836 5953 4384 3102 4127 2131 2259 3238 4053 4210 4210 4210 4210 4210 4210 4210 4210 4210 4210 4210 4210 4210 4210
Backlog - - - - - - - - - - - - - - - - - - - - - - - -
Total Capital
6503 4836 5953 4384 3102 4127 2131 2259 3238 4053 4210 4210 4210 4210 4210 4210 4210 4210 4210 4210 4210 4210 4210 4210
Capital Financing ($000) 2016 2017 2018 2019 2020 2021 2022 2023 2024 2025 2026 2027 2028 2029 2030 2031 2032 2033 2034 2035 2036 2037 2038 2039
ProvincialFederal Grants - - - - - - - - - - - - - - - - - - - - - - - -
Gas Tax Allocation - - - - - - - - - - - - - - - - - - - - - - - -
Additional Gas Tax Allocation - - - - - - - - - - - - - - - - - - - - - - - -
Recoveries - - - - - - - - - - - - - - - - - - - - - - - -
Other Reserve - - - - - - - - - - - - - - - - - - - - - - - -
Contribution from Contingency - - - - - - - - - - - - - - - - - - - - - - - -
Reserve
Development Charges 1764 1650 860 490 497 504 511 518 526 533 - - - - - - - - - - - - - -
Non-Growth Related - - - 487 411 349 788 682 463 853 1868 1868 1868 1868 1868 1868 1868 1868 1868 1868 1868 1868 1868 1868
Debenture Requirements Growth Related Debenture
- - - - - - - - - - - - - - - - - - - - - - - - Requirements
Water Capital Reserve 2645 3235 2803 3817 3982 4117 4044 4193 4143 3974 4358 4358 4358 4358 4358 4358 4358 4358 4358 4358 4358 4358 4358 4358
Total Capital Financing 4409 4884 3662 4794 4890 4971 5343 5393 5132 5360 6226 6226 6226 6226 6226 6226 6226 6226 6226 6226 6226 6226 6226 6226
Projected Capital Budget Requirements - Water Capital Financing
Appendix C - Projected Capital Budget Requirements
Projected Capital Budget Requirements - Sanitary Sewer Capital Projections
Sanitary Sewer Capital Projections ($000)
2016 2017 2018 2019 2020 2021 2022 2023 2024 2025 2026 2027 2028 2029 2030 2031 2032 2033 2034 2035 2036 2037 2038 2039
Capital 6503 4836 5953 4384 3102 4127 2131 2259 3238 4053 4210 4210 4210 4210 4210 4210 4210 4210 4210 4210 4210 4210 4210 4210
Backlog - - - - - - - - - - - - - - - - - - - - - - - -
Total Capital
6503 4836 5953 4384 3102 4127 2131 2259 3238 4053 4210 4210 4210 4210 4210 4210 4210 4210 4210 4210 4210 4210 4210 4210
Capital Financing ($000) 2016 2017 2018 2019 2020 2021 2022 2023 2024 2025 2026 2027 2028 2029 2030 2031 2032 2033 2034 2035 2036 2037 2038 2039
ProvincialFederal Grants - - - - - - - - - - - - - - - - - - - - - - - -
Gas Tax Allocation 412 - - - - - - - - - - - - - - - - - - - - - - -
Additional Gas Tax Allocation - - - - - - - - - - - - - - - - - - - - - - - -
Recoveries - - - - - - - - - - - - - - - - - - - - - - - -
Other Reserve - - - - - - - - - - - - - - - - - - - - - - - -
Contribution from Contingency - - - - - - - - - - - - - - - - - - - - - - - -
Reserve
Development Charges 3763 1929 2185 2235 260 264 267 271 570 1959 - - - - - - - - - - - - - -
Non-Growth Related - - - - - - - - - - 1263 1263 1263 1263 1263 1263 1263 1263 1263 1263 1263 1263 1263 1263
Debenture Requirements Growth Related Debenture
- - - - - - - - - - - - - - - - - - - - - - - - Requirements
Sanitary Sewer Reserve 2329 2906 3767 2150 2842 3863 1863 1988 2669 2093 2947 2947 2947 2947 2947 2947 2947 2947 2947 2947 2947 2947 2947 2947
Total Capital Financing 6503 4836 5953 4384 3102 4127 2131 2259 3238 4053 4210 4210 4210 4210 4210 4210 4210 4210 4210 4210 4210 4210 4210 4210
Projected Capital Budget Requirements - Sanitary Sewer Capital Financing
Appendix D
PROJECTED RESERVES CONTINUITY SCHEDULE
Appendix D - Projected Reserves Continuity Schedule
Projected Reserves Continuity Schedule - Water Capital Reserve
Capital Reserve ($000)
Opening Balance
Transfer from Operating
2016
4357
1777
2017
4489
1674
2018
3928
1170
2019
3718
2478
2020
3379
3982
2021
3379
4117
2022
3379
4044
2023
3379
4193
2024
3379
4143
2025
3379
3974
2026
3379
4358
2027
3379
4829
2028
3850
4474
2029
3965
4477
2030
4084
4481
2031
4207
4484
2032
4333
4488
2033
4463
4492
2034
4597
4496
2035
4734
4500
2036
4877
4504
2037
5023
4509
2038
5173
4513
2039
5329
4518
Transfer from Operating-Sewer Loan
1000 1000 1000 1000
Transfer to Capital 2645 3235 2803 3817 3982 4117 4044 4193 4143 3974 4358 4358 4358 4358 4358 4358 4358 4358 4358 4358 4358 4358 4358 4358
Transfer to Operating - - - - - - - - - - - - - - - - - - - - - - - -
Closing Balance 4489 3928 3718 3379 3379 3379 3379 3379 3379 3379 3379 3850 3965 4084 4207 4333 4463 4597 4734 4877 5023 5173 5329 5489
Interest
- - - - - - - - - - - - - - - - - - - - - - - -
Projected Reserves Continuity Schedule - Water Rate Stabilizations Reserve
Rate Stabilization ($000) 2016 2017 2018 2019 2020 2021 2022 2023 2024 2025 2026 2027 2028 2029 2030 2031 2032 2033 2034 2035 2036 2037 2038 2039
Total Operating Cost 17771 18219 18689 19539 20129 20748 21353 21987 22415 23101 23836 24588 25368 26174 27004 27861 28744 29656 30597 31567 32568 33602 34668 35768
RSR Target ( of Net Costs to 0 0 0 1 2 3 4 5 5 5 5 5 5 5 5 5 5 5 5 5 5 5 5 5
Be Recovered from Users)
RSR Target ($) - - - 195 403 622 854 1099 1121 1155 1192 1229 1268 1309 1350 1393 1437 1483 1530 1578 1628 1680 1733 1788
Year End RSR Balance - - - 195 403 622 854 1099 1121 1155 1192 1229 1268 1309 1350 1393 1437 1483 1530 1578 1628 1680 1733 1788
Shortfall from Target - - - 0 0 0 0 0 0 0 0 0 0 0 0 0 0 0 0 0 0 0 0 0
Surplus from Target - - - - - - - - - - - - - - - - - - - - - - - -
Appendix D - Projected Reserves Continuity Schedule
Projected Reserves Continuity Schedule - Sanitary Sewer Capital Reserve
Transfer from Operating
Capital Reserve ($000) 2016
Opening Balance 7919
3228
2017
8599
2644
2018
8157
2276
2019
6491
2835
2020
7001
3788
2021
8646
3898
2022
8681
2828
2023
9646
1988
2024
9646
2669
2025
9646
2093
2026
9646
2947
2027
9646
2947
2028
9646
2947
2029
9646
2947
2030
9646
2947
2031
9646
2947
2032
9646
2947
2033
9646
2947
2034
9646
2947
2035
9646
2947
2036
9646
2947
2037
9646
2947
2028
9646
2947
2039
9646
2947
SPPC Repayment 781 820 825 825 700
Transfer to Capital 2329 2906 3767 2150 2842 3863 1863 1988 2669 2093 2947 2947 2947 2947 2947 2947 2947 2947 2947 2947 2947 2947 2947 2947
Transfer to Operating 1000 1000 1000 1000 - - - - - - - - - - - - - - - - - - - -
Closing Balance 8599 8157 6491 7001 8646 8681 9646 9646 9646 9646 9646 9646 9646 9646 9646 9646 9646 9646 9646 9646 9646 9646 9646 9646
Interest - - - - - - - - - - - - - - - - - - - - - - - -
Rate Stabilization ($000) 2016 2017 2018 2019 2020 2021 2022 2023 2024 2025 2026 2027 2028 2029 2030 2031 2032 2033 2034 2035 2036 2037 2038 2039
Total Operating Cost 21306 22483 23938 25109 24993 26862 28108 29125 30245 31938 32978 34204 35474 36795 38185 39346 40484 41662 42876 44129 45417 46740 48102 49505
RSR Target ( of Net Costs to 0 0 0 1 2 3 4 5 5 5 5 5 5 5 5 5 5 5 5 5 5 5 5 5
Be Recovered from Users)
RSR Target ($) - - - 251 500 806 1124 1456 1512 1597 1649 1710 1774 1840 1909 1967 2024 2083 2144 2206 2271 2337 2405 2475
Year End RSR Balance - - - 251 500 806 1152 1273 1273 1597 1649 1710 1774 1840 1909 1967 2024 2083 2144 2206 2271 2337 2405 2475
Shortfall from Target - - - 0 0 0 - 183 239 0 0 0 0 0 0 0 0 0 0 0 0 0 0 0
Surplus from Target - - - - - - 28 - - - - - - - - - - - - - - - - -
Projected Reserves Continuity Schedule - Sanitary Sewer Rate Stabilization Reserve
Appendix E
SYSTEM COSTS AND REVENUE REQUIREMENTS
Appendix E - System Costs and Revenue Requirements
System Costs and Revenue Requirements - Water System
CostRevenue Item ($000) 2016 2017 2018 2019 2020 2021 2022 2023 2024 2025 2026 2027 2028 2029 2030 2031 2032 2033 2034 2035 2036 2037 2038 2039
Municipal Capital Forecast 4409 4884 3662 3171 3520 3806 2715 3121 3588 2517 - - - - - - - - - - - - - -
Replacement Costs from Asset - - - - - - 371 - 22 1531 4892 5038 5190 3508 3613 3722 3833 3948 1823 1878 1934 1992 2052 2561
Replacement Summary
Backlog - - - 1623 1370 1164 2257 2272 1521 1313 1334 1187 1036 2718 2613 2504 2392 2277 4403 4348 4292 4234 4174 3665
Total Capital Requirements 4409 4884 3662 4794 4890 4971 5343 5393 5132 5360 6226 6226 6226 6226 6226 6226 6226 6226 6226 6226 6226 6226 6226 6226
Debt Financing - - - 487 411 349 788 682 463 853 1868 1868 1868 1868 1868 1868 1868 1868 1868 1868 1868 1868 1868 1868
Capital Reserve Financing 2645 3235 2803 3817 3982 4117 4044 4193 4143 3974 4358 4358 4358 4358 4358 4358 4358 4358 4358 4358 4358 4358 4358 4358
Transfer from Operating - - - - - - - - - - - - - - - - - - - - - - - -
Other Financing (Grants Third - - - - - - - - - - - - - - - - - - - - - - - -
Party etc)
DC Reserve Financing 1764 1650 860 490 497 504 511 518 526 533 - - - - - - - - - - - - - -
Total Capital Financing 4409 4884 3662 4794 4890 4971 5343 5393 5132 5360 6226 6226 6226 6226 6226 6226 6226 6226 6226 6226 6226 6226 6226 6226
Operating and Maintenance 17771 18219 18689 19539 20129 20748 21353 21987 22415 23101 23836 24588 25368 26174 27004 27861 28744 29656 30597 31567 32568 33602 34668 35768
Transfer to Capital Reserves 1777 1674 1170 2478 3982 4117 4044 4193 4143 3974 4358 4829 4474 4477 4481 4484 4488 4492 4496 4500 4504 4509 4513 4518
Debt Repayment - - - - 57 105 146 239 319 373 473 692 911 1130 1292 1462 1640 1767 1906 2071 2190 2190 2190 2190
Less Non-Rate Revenue 1438 1445 1453 1464 476 487 500 512 526 539 555 571 588 605 623 641 660 667 687 708 729 751 773 796
Revenue Requirements (from Users)
Revenue from Base Charge
Revenue from Uniform Rate
20986
1218
17878
21338
1247
18186
21312
1279
18535
23481
1292
20245
24644
1421
22256
25458
1468
22999
26042
1502
23524
26931
1553
24335
27403
1580
24753
27987
1613
25277
29222
1686
26407
30680
1771
27747
31340
1809
28336
32386
1869
29285
33399
1928
30204
34448
1989
31155
35532
2051
32138
36582
2113
33111
37686
2177
34110
38846
2244
35161
39991
2310
36198
41051
2371
37152
42144
2434
38136
43272
2499
39152
Annual Increase ($)
Annual Increase ()
617
3
337
2
382
2
1723
9
2139
10
790
3
559
2
863
3
445
2
557
2
1203
4
1425
5
626
2
1010
3
978
3
1012
3
1045
3
1035
3
1063
3
1118
3
1103
3
1015
3
1047
3
1081
3
Appendix E - System Costs and Revenue Requirements
System Costs and Revenue Requirements - Water System
CostRevenue Item ($000) 2016 2017 2018 2019 2020 2021 2022 2023 2024 2025 2026 2027 2028 2029 2030 2031 2032 2033 2034 2035 2036 2037 2038 2039
Municipal Capital Forecast 6503 4836 5953 4384 3102 4127 2131 2259 3238 4053 - - - - - - - - - - - - - -
Replacement Costs from Asset - - - - 0 - - - - 0 4210 4210 4210 4210 4210 4210 4210 4210 4210 4210 4210 4210 4210 4210
Replacement Summary
Total Capital Requirements 6503 4836 5953 4384 3102 4127 2131 2259 3238 4053 4210 4210 4210 4210 4210 4210 4210 4210 4210 4210 4210 4210 4210 4210
Debt Financing - - - - - - - - - - 1263 1263 1263 1263 1263 1263 1263 1263 1263 1263 1263 1263 1263 1263
Capital Reserve Financing 2329 2906 3767 2150 2842 3863 1863 1988 2669 2093 2947 2947 2947 2947 2947 2947 2947 2947 2947 2947 2947 2947 2947 2947
Transfer from Operating - - - - - - - - - - - - - - - - - - - - - - - -
Other Financing (Grants Third 412 - - - - - - - - - - - - - - - - - - - - - - -
Party etc)
DC Reserve Financing 3763 1929 2185 2235 260 264 267 271 570 1959 - - - - - - - - - - - - - -
Total Capital Financing 6503 4836 5953 4384 3102 4127 2131 2259 3238 4053 4210 4210 4210 4210 4210 4210 4210 4210 4210 4210 4210 4210 4210 4210
Operating and Maintenance 21306 22483 23938 25109 24993 26862 28108 29125 30245 31938 32978 34204 35474 36795 38185 39346 40484 41662 42876 44129 45417 46740 48102 49505
Transfer to Capital Reserves 3228 2644 2276 2835 3788 3898 2828 1988 2669 2093 2947 2947 2947 2947 2947 2947 2947 2947 2947 2947 2947 2947 2947 2947
Debt Repayment - - - - - - - - - - - 148 296 444 592 740 888 1036 1184 1332 1480 1480 1480 1480
Less Non-Rate Revenue 1181 1101 1020 1057 1081 1121 1160 1199 1239 1260 1297 1336 1375 1416 1458 1502 1546 1580 1627 1676 1726 1778 1832 1886
Revenue Requirements (from Users)
Revenue from Base Charge
25714
-
26227
-
27233
-
29001
-
29862
-
31881
-
32096
-
32311
-
34153
-
35291
-
37222
-
38634
-
40092
-
41602
-
43182
-
44535
-
45866
-
47225
-
48635
-
50084
-
51571
-
52945
-
54361
-
55819
-
Revenue from Uniform Rate 22353 23026 24194 25888 27700 29639 29776 29914 31675 32772 34628 35963 37341 38769 40265 41531 42773 44065 45380 46732 48118 49389 50698 52046
Annual Increase ($) 1139 673 1168 1694 1812 1939 137 137 1762 1096 1856 1335 1378 1428 1496 1266 1242 1292 1315 1352 1386 1271 1309 1348
Annual Increase () 5 3 5 7 7 7 0 0 6 3 6 4 4 4 4 3 3 3 3 3 3 3 3 3
Appendix F
PROJECTED FULL COST OF SERVICE
Appendix F - Projected Full Cost of Service
Projected Full Cost of Service - Water System
Cost Component 2016 2017 2018 2019 2020 2021 2022 2023 2024 2025 2026 2027 2028 2029 2030 2031 2032 2033 2034 2035 2036 2037 2038 2039
OampM 5467 5569 5680 6098 6242 6391 6545 6706 6635 6806 7011 7221 7438 7661 7891 8128 8372 8623 8882 9149 9423 9706 9997 10297
Regional Charge 12304 12649 13010 13442 13888 14357 14808 15281 15780 16295 16825 17367 17930 18512 19113 19732 20372 21032 21715 22419 23145 23896 24671 25470
Capital Expenditure 1777 1674 1170 2478 3982 4117 4044 4193 4143 3974 4358 4829 4474 4477 4481 4484 4488 4492 4496 4500 4504 4509 4513 4518
Debt Repayment -
Total 19548
-
19893
-
19859
-
22017
57
24169
105
24971
146
25543
239
26419
319
26877
373
27448
473
28667
692
30109
911
30752
1130
31781
1292
32777
1462
33807
1640
34872
1767
35915
1906
36999
2071
38138
2190
39262
2190
40300
2190
41371
2190
42475
Cost Component 2016 2017 2018 2019 2020 2021 2022 2023 2024 2025 2026 2027 2028 2029 2030 2031 2032 2033 2034 2035 2036 2037 2038 2039
OampM 5058 5191 5264 5640 4766 4956 5133 5048 5072 5545 5430 5601 5769 5943 6123 6293 6479 6673 6873 7080 7292 7511 7736 7968
Regional Charge 16248 17291 18674 19470 20227 21906 22975 24076 25173 26393 27548 28603 29705 30852 32062 33053 34006 34989 36003 37049 38125 39229 40366 41537
Capital Expenditure 3228 2644 2276 2835 3788 3898 2828 1988 2669 2093 2947 2947 2947 2947 2947 2947 2947 2947 2947 2947 2947 2947 2947 2947
Debt Repayment - - - - - - - - - - - 148 296 444 592 740 888 1036 1184 1332 1480 1480 1480 1480
Total 24534
25126 26214 27944 28781 30760 30936 31112 32914 34031 35925 37299 38717 40185 41724 43033 44319 45645 47008 48408 49844 51167 52529 53932
Projected Full Cost of Service - Sanitary Sewer System
Appendix G
ANNUAL CASH FLOW
Appendix G - Annual Cash Flow
Annual Cash Flow - Water System
Annual Cash Flow ($000) 2016 2017 2018 2019 2020 2021 2022 2023 2024 2025 2026 2027 2028 2029 2030 2031 2032 2033 2034 2035 2036 2037 2038 2039
Annual Opening Balance - - - - - - - - - - - - - - - - - - - - - - - -
Revenue from Base Charge 1218 1247 1279 1292 1421 1468 1502 1553 1580 1613 1686 1771 1809 1869 1928 1989 2051 2113 2177 2244 2310 2371 2434 2499
Revenue from Uniform Rate 17878 18186 18535 20245 22256 22999 23524 24335 24753 25277 26407 27747 28336 29285 30204 31155 32138 33111 34110 35161 36198 37152 38136 39152
Non-Rate Revenues 1438 1445 1453 1464 476 487 500 512 526 539 555 571 588 605 623 641 660 667 687 708 729 751 773 796
Operating Expenditures 17771 18219 18689 19539 20129 20748 21353 21987 22415 23101 23836 24588 25368 26174 27004 27861 28744 29656 30597 31567 32568 33602 34668 35768
(Contributions to) Capital 1777 1674 1593 2478 3982 4117 4044 4193 4143 3974 4358 4829 4474 4477 4481 4484 4488 4492 4496 4500 4504 4509 4513 4518
Reserve - 1 - (Cash Budget) (Contributions to) Capital
1000 1000 1000 1000 - - - - - - - - - - - - - - - - - - - - Reserve - 2 - (Cash Budget)
(Contributions to) Lifecycle - - - - - - - - - - - - - - - - - - - - - - - -
Reserve - (Cash Budget) Debt Repayment - (Cash
- - - - 57 105 146 239 319 373 473 692 911 1130 1292 1462 1640 1767 1906 2071 2190 2190 2190 2190 Outflow)
Annual Closing Balance - - - - - - - - - - - - - - - - - - - - - - - -
Annual Cash Flow ($000) 2016 2017 2018 2019 2020 2021 2022 2023 2024 2025 2026 2027 2028 2029 2030 2031 2032 2033 2034 2035 2036 2037 2038 2039
Annual Opening Balance - - - - - - - - - - - - - - - - - - - - - - - -
Revenue from Base Charge - - - - - - - - - - - - - - - - - - - - - - - -
Non-Rate Revenues
Loan Repayment
Revenue from Uniform Rate 22353
1181
23026 24194
1101
1020
1000
25888 27700
1057
1081
-
29639 29776
1121
1160
-
29914 31675
1199
1239
-
32772
1260
-
34628
1297
-
35963
1336
-
37341
1375
-
38769
1416
-
40265
1458
-
41531
1502
-
42773
1546
-
44065
1580
-
45380
1627
-
46732
1676
-
48118
1726
-
49389
1778
-
50698
1832
-
52046
1886
-
Operating Expenditures
(Contributions to) Capital Reserve - 1 - (Cash Budget)
(Contributions to) Capital
1000
21306
3228
-
-
-
1000
22483
2644
-
-
-
23938
2276
-
-
-
1000
25109
2835
-
-
-
24993
3788
-
-
-
-
26862
3898
-
-
-
28108
2828
-
-
-
-
29125
1988
-
-
-
30245
2669
-
-
-
31938
2093
-
-
-
32978
2947
-
-
-
34204
2947
-
35474
2947
-
36795
2947
-
38185
2947
-
39346
2947
-
40484
2947
-
41662
2947
-
42876
2947
-
44129
2947
-
45417
2947
-
46740
2947
-
48102
2947
-
49505
2947
- Reserve - 2 - (Cash Budget)
(Contributions to) Lifecycle Reserve - (Cash Budget)
Debt Repayment - (Cash Outflow)
Annual Closing Balance
- - - - - - - - - - - - - - - - - - - - - - - -
148 296 444 592 740 888 1036 1184 1332 1480 1480 1480 1480
- - - - - - - - - - - - -
Annual Cash Flow - Sanitary Sewer
Appendix H
REQUIREMENTS OF ONTARIO REGULATIONS 45307
Appendix A Requirements of OReg 45307
Requirements How Requirements are Met
1 The financial plans that is passed by
must be approved by a resolution
i The council of the municipality if the owner of the drinking water system is a municipality
It is expected the Council will approve the Updated Financial Plan prior to June 1st 2016
ii The governing body of the owner if the owner of the drinking water system has a governing body
and is not a municipality
NA
2 The financial plans must apply to a period of at least six Applies for 6 years from 2016 to 2021 inclusive years
3 The first year to which the financial plans must apply must be the year determined in accordance with the
following rules
i If the financial plans are required by subsection 2 the first year to which the financial plans must
apply must be the year in which the drinking water systemrsquos existing municipal drinking water
licence would otherwise expire
The licence expires in 2016 for the water systems (No112-301) Therefore the first year
of the Updated Financial Plan is 2016
ii If the financial plans are required by a condition that was included in a municipal drinking water
licence under subsection 1 (3) the first year to which the financial plans must apply must be the
later of 2010 and the year in which the first licence for the system was issued
NA
4 Subject to subsection financial plans apply
the following
(2) the
for each year financial plans
to which the must include
i Details of the proposed or projected financial position of the drinking water system itemized by
See Statement of Financial Position for all water systems combined in Financial Plan
a Total financial assets See Statement of Financial Position for all water systems combined in Financial Plan
b Total liabilities See Statement of Financial Position for all water systems combined in Financial Plan
c Net financial assets (debt) See Statement of Financial Position for all water systems combined in Financial Plan
d Non-financial assets that are tangible capital assets tangible capital assets
under construction inventories of supplies and prepaid expenses
See Statement of Financial Position for all water systems combined in Financial Plan TCA
Projections in Financial Plan
e Changes in tangible capital assets that are additions donations write downs
and disposals
See Statement of Financial Position for all water systems combined in Financial Plan TCA
Projections in Financial Plan
Appendix A Requirements of OReg 45307
ii Details of the proposed or projected financial operations of the drinking water system itemized by
See Statement of Operations for all water systems combined in Financial Plan
a Total revenues further itemized by water rates user charges and other revenues
See Statement of Operations for all water systems combined in Financial Plan
b Total expenses further itemized by amortization expenses interest expenses and other expenses
See Statement of Operations for all water systems combined in Financial Plan
c Annual surplus or deficit and See Statement of Operations for all water systems combined in Financial Plan
d Accumulated surplus or deficit See Statement of Operations for all water systems combined in Financial Plan
iii Details of the drinking water systemrsquos proposed or projected gross cash receipts and gross cash payments itemized by
See Statement of Cash Flow for all water systems combined in Financial Plan
a Operating transactions that are cash received from revenues cash paid for operating expenses and finance charges - done in full cost report
See Statement of Cash Flow for all water systems combined in Financial Plan
b Capital transactions that are proceeds on the sale of tangible capital assets and cash used to acquire capital assets
See Statement of Cash Flow for all water systems combined in Financial Plan
c Investing transactions that are acquisitions and disposal of investments
See Statement of Cash Flow for all water systems combined in Financial Plan
d Financing transactions that are proceeds from the issuance of debt and debt repayment
See Statement of Cash Flow for all water systems combined in Financial Plan
e Changes in cash and cash equivalents during the year
See Statement of Cash Flow for all water systems combined in Financial Plan
f Cash and cash equivalents at the beginning and end of the year
See Statement of Cash Flow for all water systems combined in Financial Plan
iv Details of the extent to which the information described in subparagraphs i ii and iii relates directly to the replacement of lead service pipes as defined in section 151- 3 of Schedule 151 to Ontario Regulation 17003 (Drinking Water Systems) made under the Act
Lead services are replaced as part of watermain rehabilitation projects andor road reconstruction projects when undertaken Although not all the streets contain lead services all of the water services to the property line are replaced for every rehabilitation and reconstruction project
5 The owner of the drinking water system must
i Make the financial plans available on request to members of the public who are served by the drinking water system without charge
This will be done by the municipality following Council approval
ii Make the financial plans available to members of the public without charge through publication on the Internet if the owner maintains a website on the Internet
The Financial Plan will be posted on the municipalityrsquos website and made available for public review at no charge
Appendix A Requirements of OReg 45307
iii Provide notice advising the public of the availability of the financial plans under
subparagraphs i and ii if applicable in a manner that in the opinion of the owner will bring the
notice to the attention of members of the public who are served by the drinking water system
A notice will be issued following Council approval
6 The owner of the drinking water system must give a copy of the financial plans to the Ministry of Municipal
Affairs and Housing O Reg 45307 s 3 (1)
Will be submitted following Council approval
Each of the following sub-subparagraphs applies only if the information referred to in the sub-
subparagraph is known to the owner at the time the financial plans are prepared
The Financial Plan was prepared using available information at the time of preparation and may
not contain all desired items Reasonable assumptions were made and these are noted in
the Financial Plan
1 Sub-subparagraphs 4 i A B and C of subsection (1)
The Financial Plan was prepared using available information at the time of preparation and may
not contain all desired items Reasonable assumptions were made and these are noted in
the Financial Plan
2 Sub-subparagraphs 4 iii A C E subsection (1) O Reg 45307 s 3 (2)
and F of The Financial Plan was prepared using available information at the time of preparation and may
not contain all desired items Reasonable assumptions were made and these are noted in
the Financial Plan
Appendix I
SERVICE CHARGES amp RATE PROJECTIONS
Appendix I - Service Charges and Rate Projections
Service Charges amp Rate Projections - Option 1
Rate Component
2016 2017 2018 2019 2020 2021 2022 2023 2024 2025 2026 2027 2028 2029 2030 2031 2032 2033 2034 2035 2036 2037 2038 2039
Annual Water Service Charges
Annual Increase ()
241 235 262 029 915 261 157 273 101 141 376 436 143 266 245 247 248 236 235 242 229 198 200 202
15 mm
3576
3660
3756
3767
4111
4219
4285
4402
4446
4509
4678
4882
4952
5084
5209
5337
5470
5598
5730
5869
6003
6122
6245
6371
25 mm
7224
7404
7584
7606
8302
8518
8651
8887
8977
9104
9447
9859
10000
10266
10518
10777
11044
11304
11570
11850
12121
12362
12609
12864
40 mm
13200
13536
13872
13912
15185
15580
15825
16256
16421
16653
17279
18032
18291
18777
19238
19713
20201
20677
21163
21675
22171
22611
23063
23529
50 mm
16548
16956
17376
17426
19020
19516
19822
20362
20569
20859
21643
22587
22911
23520
24097
24692
25304
25900
26509
27150
27771
28322
28889
29473
75 mm
34572
35436
36324
36428
39761
40797
41437
42567
42998
43605
45245
47218
47895
49169
50374
51618
52896
54142
55415
56755
58055
59207
60392
61612
100 mm
50568
51828
53124
53276
58151
59666
60601
62254
62885
63773
66171
69056
70046
71909
73673
75491
77361
79183
81045
83005
84906
86590
88324
90107
150 mm
85992
88140
90348
90607
98898
101474
103065
105876
106948
108459
112537
117444
119127
122296
125295
128387
131568
134667
137834
141167
144399
147263
150212
153246
200 mm
129816
133056
136380
136771
149286
153175
155576
159819
161438
163718
169874
177282
179822
184606
189133
193800
198602
203279
208060
213091
217970
222294
226744
231324
250 mm
172620
176940
181368
181888
198531
203703
206896
212539
214692
217724
225911
235762
239141
245502
251522
257729
264115
270335
276693
283383
289872
295622
301541
307631
Uniform Rate
Annual Increase ()
241 235 287 878 948 291 187 303 131 170 405 465 171 294 273 274 275 262 262 268 255 224 226 227
Uniform Water Rate ($msup3) 170 174 179 195 213 219 223 230 233 237 247 258 263 270 278 285 293 301 309 317 325 333 340 348
Annual Increase ()
333 323 580 655 655 655 004 004 545 303 523 343 341 340 344 273 258 261 258 257 256 224 225 226
Uniform
Wastewater 217 224
Rate ($msup3)
237
253
269 287
287
287
303
312
328
339
351
363
375
386
395
406
416
427
438
448
458
468
Appendix I - Service Charges and Rate Projections
Service Charges amp Rate Projections - Option 2
Rate 2016 2017 2018 2019 2020 2021 2022 2023 2024 2025 2026 2027 2028 2029 2030 2031 2032 2033 2034 2035 2036 2037 2038 2039
Component
Annual Water Service Charges
Annual Increase 241 235 262 15072 915 261 157 273 101 141 376 436 143 266 245 247 248 236 235 242 229 198 200 202
()
15 mm
3576 3660 3756 9417 10279 10546 10712 11004 11115 11272 11696 12206 12381 12710 13022 13343 13674 13996 14325 14672 15008 15305 15612 15927
25 mm
7224 7404 7584 19014 20754 21295 21629 22219 22444 22761 23616 24646 24999 25665 26294 26943 27610 28261 28925 29625 30303 30904 31523 32159
40 mm
13200 13536 13872 34779 37962 38951 39561 40640 41052 41632 43197 45081 45727 46943 48094 49281 50502 51692 52907 54187 55427 56527 57659 58823
50 mm
16548 16956 17376 43565 47551 48790 49554 50906 51422 52148 54109 56468 57277 58801 60243 61730 63259 64749 66272 67874 69428 70805 72223 73682
75 mm
34572 35436 36324 91070 99403 101993 103592 106417 107495 109013 113112 118045 119737 122922 125936 129044 132241 135356 138539 141889 145137 148017 150980 154029
100 mm
50568 51828 53124 133191 145378 149165 151503 155636 157212 159432 165427 172641 175115 179773 184182 188727 193403 197958 202613 207513 212264 216475 220809 225268
150 mm
85992 88140 90348 226518 247244 253686 257662 264689 267371 271147 281342 293611 297818 305741 313238 320968 328921 336667 344585 352917 360997 368159 375530 383114
200 mm
129816 133056 136380 341928 373214 382938 388939 399548 403596 409295 424685 443205 449556 461515 472832 484500 496505 508198 520149 532727 544924 555734 566861 578309
250 mm
172620 176940 181368 454720 496327 509258 517240 531348 536731 544310 564777 589406 597852 613756 628806 644324 660288 675838 691732 708458 724679 739056 753852 769078
Uniform Rate
Annual Increase 241 235 287 -164 948 291 187 303 131 170 405 465 171 294 273 274 275 262 262 268 255 224 226 227
()
Uniform Water Rate ($msup3) 170 174 179 176 193 198 202 208 211 215 223 234 238 245 251 258 265 272 279 287 294 301 308 314
Rate
2016 2017 2018 2019 2020 2021 2022 2023 2024 2025 2026 2027 2028 2029 2030 2031 2032 2033 2034 2035 2036 2037 2038 2039 Component
Annual Wastewater Service Charges
Annual Increase 623 624 -025 -025 515 274 494 314 313 312 316 246 231 234 231 231 230 198 200 201
()
15 mm
- - - 11433 12145 12902 12870 12839 13500 13870 14555 15012 15482 15965 16470 16875 17264 17669 18077 18495 18921 19296 19681 20077
25 mm
- - - 23085 24523 26052 25987 25924 27258 28006 29389 30313 31260 32237 33256 34073 34859 35676 36501 37344 38204 38962 39740 40538
40 mm
- - - 42224 44855 47653 47534 47417 49859 51226 53755 55445 57179 58964 60829 62323 63762 65256 66765 68307 69879 71265 72689 74149
50 mm
- - - 52890 56186 59689 59541 59394 62453 64166 67333 69451 71622 73858 76194 78066 79867 81739 83629 85561 87530 89266 91049 92879
75 mm
- - - 110565 117454 124779 124468 124162 130556 134137 140758 145185 149723 154399 159281 163195 166961 170874 174824 178864 182979 186609 190336 194161
100 mm
- - - 161702 171777 182489 182035 181588 190938 196176 205859 212333 218970 225809 232949 238673 244180 249903 255681 261589 267608 272916 278367 283961
150 mm
- - - 275007 292141 310360 309588 308826 324729 333637 350105 361115 372403 384033 396176 405911 415278 425011 434837 444884 455121 464148 473419 482932
200 mm
- - - 415122 440986 468487 467321 466172 490177 503624 528482 545102 562141 579697 598026 612721 626860 641552 656384 671551 687003 700630 714624 728984
250 mm
- - - 552059 586456 623028 621478 619950 651872 669755 702814 724916 747576 770923 795298 814841 833644 853182 872907 893077 913626 931748 950359 969456
Uniform Rate
Annual Increase 333 323 580 -943 655 655 004 004 545 303 523 343 341 340 344 273 258 261 258 257 256 224 225 226
()
Uniform
Wastewater 217 224 237 215 229 244 244 244 257 265 279 288 298 308 319 328 336 345 354 363 372 381 389 398
Rate ($msup3)
Appendix I - Service Charges and Rate Projections
Service Charges amp Rate Projections - Option 3
Rate Component
2016 2017 2018 2019 2020 2021 2022 2023 2024 2025 2026 2027 2028 2029 2030 2031 2032 2033 2034 2035 2036 2037 2038 2039
Annual Water Service Charges
Annual Increase ()
241 235 262 32175 950 293 188 304 132 172 407 467 173 296 275 276 276 264 263 270 256 226 227 229
15 mm
3576
3660
3756
15841
17345
17853
18190
18743
18991
19317
20104
21042
21406
22039
22644
23268
23912
24543
25189
25868
26531
27130
27746
28380
25 mm
7224
7404
7584
31985
35023
36049
36728
37846
38346
39005
40592
42488
43222
44500
45722
46983
48282
49556
50860
52232
53571
54779
56023
57304
40 mm
13200
13536
13872
58505
64062
65938
67180
69225
70140
71345
74248
77715
79059
81396
83631
85937
88313
90643
93029
95538
97988
100198
102473
104815
50 mm
16548
16956
17376
73283
80244
82593
84149
86711
87857
89366
93003
97345
99028
101957
104755
107644
110620
113539
116528
119670
122739
125507
128357
131291
75 mm
34572
35436
36324
153196
167747
172659
175912
181267
183662
186817
194420
203497
207016
213137
218988
225027
231248
237351
243599
250167
256582
262369
268327
274460
100 mm
50568
51828
53124
224050
245330
252515
257272
265103
268606
273220
284339
297615
302762
311714
320271
329103
338202
347126
356264
365870
375253
383715
392429
401399
150 mm
85992
88140
90348
381042
417233
429452
437542
450861
456818
464666
483576
506154
514907
530132
544685
559706
575180
590358
605899
622235
638192
652585
667404
682659
200 mm
129816
133056
136380
575182
629812
648256
660468
680574
689565
701412
729957
764038
777250
800232
822199
844874
868232
891143
914602
939261
963349
985075
1007443
1030471
250 mm
172620
176940
181368
764919
837569
862098
878338
905076
917034
932788
970749
1016073
1033643
1064206
1093420
1123574
1154638
1185107
1216304
1249098
1281132
1310023
1339771
1370395
Uniform Rate
Annual Increase ()
241 235 287 535 950 293 188 304 132 172 407 467 173 296 275 276 276 264 263 270 256 226 227 229
Block 1 ($msup3)
170
174
179
189
206
213
217
223
226
230
239
251
255
262
270
277
285
292
300
308
316
323
330
338
Block 2 ($msup3)
226
248
255
260
268
271
276
287
301
306
315
323
332
342
351
360
370
379
388
396
405
Rate
Component 2016 2017 2018 2019 2020 2021 2022 2023 2024 2025 2026 2027 2028 2029 2030 2031 2032 2033 2034 2035 2036 2037 2038 2039
Annual Sanitary Sewer Service Charges
Annual Increase ()
15 mm
25 mm
40 mm
50 mm
75 mm
100 mm
150 mm
200 mm
250 mm
Uniform Rate
Annual Increase ()
-
-
-
-
-
-
-
-
-
333
-
-
-
-
-
-
-
-
-
323
-
-
-
-
-
-
-
-
-
580
19322
39015
71363
89389
186865
273291
464787
701594
933030
-294
657
20591
41577
76050
95260
199137
291239
495311
747670
994305
657
657
21944
44309
81046
101517
212219
310371
527848
796784
1059622
657
006
21957
44335
81095
101579
212347
310558
528167
797266
1060262
006
006
21970
44362
81143
101639
212474
310744
528483
797743
1060897
006
547
23172
46788
85580
107197
224092
327736
557380
841363
1118906
547
305
23879
48215
88191
110468
230930
337736
574388
867036
1153048
305
525
25132
50745
92819
116264
243047
355457
604526
912531
1213549
525
345
25998
52495
96019
120272
251426
367712
625367
943990
1255386
345
343
26889
54293
99307
124392
260038
380306
646787
976322
1298384
343
342
27808
56149
102703
128645
268929
393309
668901
1009704
1342777
342
345
28769
58089
106251
133090
278220
406898
692011
1044588
1389169
345
275
29558
59684
109168
136743
285858
418068
711008
1073265
1427305
275
259
30325
61231
111998
140288
293267
428905
729438
1101085
1464302
259
263
31121
62838
114938
143971
300967
440165
748589
1129992
1502746
263
259
31927
64466
117916
147701
308764
451568
767982
1159266
1541676
259
259
32753
66133
120965
151521
316749
463247
787845
1189249
1581549
259
257
33596
67836
124079
155421
324902
475171
808123
1219859
1622257
257
225
34353
69364
126874
158922
332222
485876
826329
1247340
1658803
225
226
35130
70934
129747
162520
339743
496876
845037
1275580
1696358
226
227
35929
72547
132696
166215
347467
508171
864247
1304578
1734923
227
Block 1 ($msup3)
217
224
237
230
245
261
261
262
276
284
299
310
320
331
342
352
361
370
380
390
400
409
418
428
Block 2 ($msup3)
276
294
313
314
314
331
341
359
371
384
397
411
422
433
445
456
468
480
491
502
513

City of Waterloo Water amp Sanitary Sewer Rate Design Study Final Report amp Water Financial Plan No 112-301
April 1 2016
The following were also confirmed
bull Use of debt financing for capital needs will be utilized for up to 30 of the estimated
annual capital needs Water and sanitary sewer projects are exempt from the City Debt
Management Policy (FC-009) However a maximum debt funding limit of up to 30 of
the annual capital funding needs was used for the purposes of this study and rate
forecast as per the policy debt limits This is seen as an acceptable debt levelstrategy in
accordance with the Council approved tax base debt policy
bull Targeting capital reserve balances of approximately 1 of the estimated asset
replacement value as inflated each year according to the Construction Price Inflations
Index
bull Targeting rate stabilization reserve balances of 5 of annual operating costs each year
bull Implementing the new rate structure in 2019
ES-4 Full Cost Assessment - Water
Table ES-2 is a summary of the projected costs related to the water system over the study
period including the next 5 years It shows that the average annual cost of managing the water
system is approximately $306 million over the next 24 years compared to current (2016)
annual costs of approximately $205 million Debt repayment accounts for 3 of the annual
costs Operations cost are estimated to be approximately $76 million (25) and the capital
costs $39 million (13) These are fixed costs that account for approximately 41 of the total
annual costs The purchase of water from the Region is estimated to be approximately $181
million (59) of the overall net cost over the study period These are variable costs because of
the Regionrsquos rate structure for water treatment which is 100 volumetric However most of the
Regionrsquos water treatment costs are also fixed Therefore if the Region were to change its
current rate structure then most of Regionrsquos cost would become a fixed cost to the City The
average annual full cost of service is approximately $220 million over the next 5 years
ES-2 Average Annual Full Cost of Water System
iii DFA Infrastructure International Inc
-
-
-
-
Cost Component
(Water) 2016 2016 ()
Average ($)
(2016 2020)
Average ()
(2016 2020)
Average ($)
(2016 2039)
Average ()
(2016 2039)
Capital Reserve $ 2777481 14 $ 3100679 14 $ 3962470 13
Transfers
Regional Charges $12303913 60 $13058563 59 $18083887 59
Operating $ 5466741 27 $ 5811017 26 $ 7580721 25
Expenses
$ Debt Repayment 0 $ 11417 0 $ 972520 3
-
Total $20548135 $21981676 $ 30599598
City of Waterloo Water amp Sanitary Sewer Rate Design Study Final Report amp Water Financial Plan No 112-301
April 1 2016
The projected costs and net revenue requirements for each year over the next 24 years are
used as the basis for developing the rates The projected annual net full costs of managing the
water system over the period are presented in Appendix F
Table ES-3 is a summary of the projected costs for the sanitary sewer system over the study
period It shows that the average annual cost of managing the sanitary sewer system is
approximately $383 million over the next 24 years compared to 2016 costs of approximately
$245 million The annual transfers to reserve are expected to decrease from approximately
$32 million in 2016 to an average annual amount of approximately $29 million over the next
24 years as most of the sanitary sewer system needs are beyond 2035 There are currently no
debt related costs based on the Cityrsquos current capital needs However debt will play a future
role in the long-term capital financing strategy for the sanitary sewer network and is estimated
at approximately $052 million (1) of annual costs Operations cost are estimated to be
approximately $59 million (15) and the capital costs $29 million (8) These are fixed costs
that account for approximately 24 of the total annual costs The treatment of wastewater by
the Region is estimated to be approximately $29 million and accounts for 76 of the overall net
cost These are variable costs because the Regionrsquos current rate structure for wastewater
treatment is 100 volumetric However most of the treatment costs are fixed Therefore if the
Region were to change its current rate structure then most of Regionrsquos cost would become a
fixed cost to the City
The projected costs and net revenue requirements for each year over the next 24 years are
used as the basis for developing the rates The projected annual net costs of managing the
sanitary sewer system over the period are presented in Appendix F
Table ES-3 Average Annual Full Cost of Sanitary Sewer System
iv DFA Infrastructure International Inc
Cost Component
(Sanitary Sewer) 2016 2016 ()
Average ($)
- (2016 2020)
Average ()
- (2016 2020)
Average ($)
- (2016 2039)
Average ()
- (2016 2039)
Capital Reserve $ 3227783 13 $ 2954049 11 $ 2895828 8
Transfers
Regional Charges $16248249 66 $18382061 70 $28981774 76
Operating Expenses $ 5057612 21 $ 5083741 19 $ 5915288 15
Debt Repayment $ - 0 $ - 0 $ 524342 1
Total $24533644 $26419851 $38317232
City of Waterloo Water amp Sanitary Sewer Rate Design Study Final Report amp Water Financial Plan No 112-301
April 1 2016
ES-5 Financing the System Costs
The existing rate structure plus two (2) alternative structures are considered for cost recovery
based on the guiding principles and feedback received from the Council Workshop and Public
Open House
bull Option 1 Continue using the existing rate structure and develop the rates required
for full cost recovery However one of the main issues identified is the increased risk
of not collecting sufficient rate revenues to fully offset the cost of service because
94 of the revenues depend on water consumption This can result in annual
deficits if not addressed
bull Option 2 A Sanitary Sewer Service Charge is introduced and 15 of the respective
water and sanitary sewer system revenue requirements would be recovered from
the respective service charges
bull Option 3 An inclining block rate structure is introduced Under this option higher
Water and Sanitary Sewer Rates would apply as consumption increases The
features of this structure include the following for both water and sanitary sewer
- A Bi-Monthly Service Charge that includes consumption of 14 msup3 for no
additional volumetric rate
- A First Consumption Block (Block 1) for bi-monthly consumption greater than
14 msup3 but not to exceed 34 msup3
- A Second Consumption Block (Block 2) for bi-monthly consumption greater
than 34 msup3
Table ES-4 shows the potential cost impacts of each option to the various customer types by
moving from 2018 to 2019 rates and charges It is important to note that the change in cost in
2019 is a one-time adjustment to reflect the change in rate structure and full cost recovery
Option 1 is projected to have a relatively consistent cost impact to all customer classes ie
700-751 in 2019 Option 2 is projected to have a much greater cost impact on the
residential sector (2619 for residential small and 1347 for average residential customers)
than on the non-residential sector Large commercial and industrial customers would benefit
from reductions of 375 to 598 Option 3 is projected to result in reductions to the small
and average residential customers (approximately 641 and 364 respectively) but would
result in major increase to the other large customer classes ranging from approximately 2087
to 3248 for the Residential Small Apartments and Non-Residential Customers These are
significant increases that would require more specific consultation with the impacted customer
classes prior to considering implementation Under all three (3) options the annual increases
beyond 2019 would be approximately 3-5 for all customer classes ie after the 2019 increase
and rate structure changes are made and become the new baseline
v DFA Infrastructure International Inc
City of Waterloo Water amp Sanitary Sewer Rate Design Study Final Report amp Water Financial Plan No 112-301
April 1 2016
Table ES-4 Annual 2019 vs 2018 Costs to Customers
Description 2018 Option 1
(2019)
Option 2
(2019)
Option 3
(2019)
Small Residential - Single Family Homes
Meter Size - 15 mm (Equivalency Unit - 100)
Average Consumption - 120 msup3year
Annual Increase to Total Bill () 7 26
Annual Increase to Total Bill ($) $3758 $14059
Annual Bill ($) $53676 $57434 $67735
-6
-$3443
$50233
Average Residential - Single Family Homes
Meter Size - 15 mm (Equivalency Unit - 100)
Average Consumption - 204 msup3year
Annual Increase to Total Bill () 7 13
Annual Increase to Total Bill ($) $6382 $11934
Annual Bill ($) $88620 $95002 $100554
-4
-$3223
$85397
Residential - Small Apartments
Meter Size - 25 mm (Equivalency Unit - 202)
Average Consumption - 1060 msup3year
Annual Increase to Total Bill () 7 2
Annual Increase to Total Bill ($) $33125 $7706
Annual Bill ($) $448544 $481669 $456250
23
$102687
$551231
Small Commercial and Industrial
Meter Size - 40 mm (Equivalency Unit - 369)
Average Consumption - 1215 msup3year
Annual Increase to Total Bill () 7 6
Annual Increase to Total Bill ($) $37983 $32403
Annual Bill ($) $519312 $557295 $551715
32
$168648
$687960
vi DFA Infrastructure International Inc
Description 2018 Option 1
(2019)
Option 2
(2019)
Option 3
(2019)
Large Commercial and Industrial
Meter Size - 50 mm (Equivalency Unit - 462)
Average Consumption - 8227 msup3year
Annual Increase to Total Bill () 7 -4 23
Annual Increase to Total Bill ($) $256961 -$128984 $803285
Annual Bill ($) $3439672 $3696634 $3310689 $4242957
Largest Commercial and Industrial
Meter Size - 50 mm (Equivalency Unit - 462)
Average Consumption - 192000 msup3year
Annual Increase to Total Bill () 8 -6 21
Annual Increase to Total Bill ($) $5996030 -$4776829 $16668939
Annual Bill ($) $79889376 $85885406 $75112547 $96558315
City of Waterloo Water amp Sanitary Sewer Rate Design Study Final Report amp Water Financial Plan No 112-301
April 1 2016
ES-6 Conclusions and Recommendations
Based on the information reviewed and analyses completed the following are the main
conclusions
1 The average annual full cost of managing the Cityrsquos water system over the study period
(next 24 years) is anticipated to be $306 million compared to current (2016) annual costs
of approximately $205 million Therefore water rate and service charge increases are
necessary to ensure that the system costs are fully funded and financially sustainable over
the long-term as required by O Reg 45307
2 The Regionrsquos Charges estimated at $181 million (annual average cost) for water treatment
represent the largest portion of system costs (59) over the next 24 years Contributions
to the capital reserve account for $39 million (13) OampM activities related to the Cityrsquos
operations account for $76 million (25) and debt repayment accounts for $097 million
(3)
3 A water infrastructure funding gap of approximately $33 million over the next 20 years
would continue to exist if rates and service charges are not adjusted to generate sufficient
funding levels
4 The financial statements for the water system prepared based on the results of the ratestudy analyses and projections indicate the following
vii DFA Infrastructure International Inc
City of Waterloo Water amp Sanitary Sewer Rate Design Study Final Report amp Water Financial Plan No 112-301
April 1 2016
- The accumulated surplus is projected to increase from approximately $726
million in 2016 to approximately $863 million by 2021
- The operating surplus ratio is projected to decrease from 15 in 2016 to 12 by
2021
- The cash position is projected to increase from $68 million in 2016 to $72
million in 2021
These indicate that the financial outlook for the water system over the 6-year period 2016
to 2021 is good
5 The average annual full cost of managing the Cityrsquos sanitary sewer system over the study
period (next 24 years) is anticipated to be $383 million compared to 2016 costs of
approximately $245 million Therefore sanitary sewer rate increases are necessary to
ensure that the system costs are fully funded and financially sustainable over the long-
term
6 The Regionrsquos Charges estimated at $29 million (annual average cost) for wastewater
treatment represent the largest portion of system costs (76) over the next 24 years
Contributions to the capital reserve account for $29 million (8) OampM activities related
to the Cityrsquos operations account for $59 million (15) and debt repayment accounts for
$05 million (1)
7 The current funding levels are sufficient for meeting the projected needs over the next 20
years However an infrastructure funding gap in excess of $72 million is projected beyond
2035 to 2065 Debt financing should be considered as part of the funding strategy to
address this infrastructure funding gap which is projected to occur just beyond the study
period
8 The financial statements for the sanitary sewer system prepared based on the results of
the rate study analyses and projections indicate the following
- The accumulated surplus is projected to increase from approximately $1139
million in 2016 to approximately $1265 million by 2021
- The operating surplus ratio is projected to decrease from 17 in 2016 to 4 by
2021
- The cash position is projected to increase from $137 million in 2016 to $182
million in 2021
These indicate that the financial outlook for the sanitary sewer system over the 6-year
period 2016 to 2021 is good
9 Based on a qualitative review all options would provide the level of funding to be fully
sustainable over the long-term Although Option 3 is best from a water conservation and
user pay guiding principle perspective it has significant disadvantages including but not
limited to
viii DFA Infrastructure International Inc
City of Waterloo Water amp Sanitary Sewer Rate Design Study Final Report amp Water Financial Plan No 112-301
April 1 2016
- Revenue uncertainty resulting from conservation d ue to the higher Block 2 rate
- Potentially high impacts (201 to 325 increases) to the non-residential
customers that m ay affect the attraction and retention o f b usiness These levels
of increases are significant and w ould r equire further dialogue with t he business
community and volume data analysis prior to confirming the thresholds for each
block and t he factor to be used f or setting the Block 2 rate and
- The risk of shifting a much larger portion o f costs to the residential sector should
business customers relocate or discontinue operations
Option 2 offers the most predictable revenues and would ensure that at least 15 of the
annual water revenues would be guaranteed while providing sufficient incentive for
customers to conserve
Option 1 still offers a fair and reasonable rate structure because the amount paid varies
almost directly with consumption due to the low fixed water charges (none for sanitary
sewer) Under Option 1 from a high level equity perspective the residential and non-
residential sectors pay their fair share Residential customers consume approximately
55 of the water and contribute 55 of the annual revenue while the non-residential
consumers account for the remaining 45 of consumption and revenues The major
disadvantage of the existing rate structure is the low level of revenue stability as only a
marginal amount of the annual revenue is collected via fixed fees This lack of revenue
stability will be offset to some extent by the introduction of the rate stabilization
reserves Therefore Option 1 could be remain a viable option moving forward should
Council not wish to proceed with Option 2 due to the large impact to the small and
average residential customers
11 Recommendations
The following are the primary recommendations for consideration by the City
10 Implement the rate structure described as Option 2 in this report effective 2019 to achieve
full cost recovery and ensure that 15 revenue recovery from the Water and Sanitary
Sewer Service Charges This would provide the best level of revenue stability compared to
the other options However if the potential cost increases to the small and average
residential customers under this option is of concern then it would be reasonable to
maintain the existing rate structure (Option 1) provided that the new rate stabilization
reserve funds discussed in this report are established The funds that would be available
from these reserves would reduce the financial risks due to revenue volatility
11 Increase transfers to the Water Capital Reserve Fund to the levels noted in Section 612 of
this report and included in Appendix D to meet the minimum target balance of 1 of
asset value adjusted for annual inflation each year subject to annual reviews of the water
systemrsquos asset needs to fully fund the capital requirements
ix DFA Infrastructure International Inc
City of Waterloo Water amp Sanitary Sewer Rate Design Study Final Report amp Water Financial Plan No 112-301
April 1 2016
12 Maintain transfers to the Sanitary Sewer Capital Reserve Fund at the levels noted in
Section 622 of this report and included in Appendix D to meet the minimum target
balance of 1 of asset value adjusted for annual inflation each year subject to annual
reviews of the sanitary sewer systemrsquos asset needs to fully fund the capital requirements
13 Utilize debt financing in the near term to help address the existing water capital shortfall
and sanitary sewer capital shortfall projected in the longer term in an effort to reduce the
burden placed on the rates
14 Establish a separate rate stabilization reserve fund for both water and sanitary sewer to be
used for offsetting any deficits and stabilizing rates and service charges These reserves to
be phased-in at a rate of 1 of annual operating cost from 2019-2023 until the target
balance of 5 of annual revenues is achieved
15 Continue to take steps to identify and address the causes of non-revenue water and inflow
and infiltration to the sanitary sewer system
16 That the OReg 45307 Water System Financial Plan No 112-301 including the Financial
Statements contained herein be approved by Council and submitted to the Province of
Ontario on or before June 1 2016 in accordance with the Drinking Water System Licence
renewal requirements and O Reg 45307
That a copy of this document entitled ldquoWater and Sanitary Sewer Rate Design Final
Report amp Water Financial Plan No 112-301rdquo be posted on the Cityrsquos website
(httpwwwwaterloocaratereview) and made available to the public at no charge
17 That the Sanitary Sewer System Financial Plan including the Financial Statements
contained herein be received by Council
18 The City should actively pursue Grant funding opportunities based on recent Federal
Budget announcements to increase funding to municipalities for infrastructure and lsquogreenrsquo
projects
x DFA Infrastructure International Inc
City of Waterloo Water amp Sanitary Sewer Rate Design Study Final Report amp Water Financial Plan No 112-301
April 1 2016
Table of Contents
1 Introduction 2
11 Background 212 Purpose 3
2 Regulatory Requirements 3
21 Provincial Regulations 322 City of Waterloo By-laws 5
3 Methodology 5
31 Guiding Principles 532 Study Components 6
4 Stakeholder Feedback 8
41 Committee of the Whole (COW) Feedback 841 Customer Feedback 11
5 Existing Systems 11
51 Water System 1152 Sanitary Sewer System 1153 Customer Growth 1154 Water Volumes 1255 Wastewater Volumes 13
6 Cost of Services 14
61 Cost Components 1461 Full Cost Assessment ndash Water System 19
611 Water System Capital Costs 19612 Water System Reserve Fund Requirements20613 Debt Related Costs 21614 Water System Operations amp Maintenance (OampM) Cost 21615 Net Full Cost of Water System 22
62 Full Cost Assessment ndash Sanitary Sewer System 23621 Sanitary Sewer System Capital Costs 23622 Sanitary Sewer Reserve Fund Requirements 24623 Debt Related Costs 25624 Sanitary Sewer System Operations amp Maintenance (OampM) Cost 25625 Net Full Cost of Sanitary Sewer System 27
7 Financing the Water amp Sanitary Sewer System Costs 28
71 Sources of Financing 2872 Existing Rate Structure amp Rates 29
721 Service Charges 30722 Uniform Consumption Rate 31
xi DFA Infrastructure International Inc
City of Waterloo Water amp Sanitary Sewer Rate Design Study Final Report amp Water Financial Plan No 112-301
April 1 2016
73 Alternative Rate Structures amp Rates 31731 Rate Structure Option 1 ndash Existing Structure 32732 Rate Structure Option 2 ndash 15 of Revenue from Service Charges33733 Rate Structure Option 3 ndash Inclining Block Rate Structure 35734 Potential Customer Impacts38735 Options Analysis amp Preferred Option 42
8 OReg 45307 Water System Financial Plan No 112-301 47
81 Tangible Capital Assets (TCA) Analysis 4782 Financial Statements 48
821 Statement of Financial Position 49822 Statement of Operations50823 Statement of Cash Flow 52824 Lead Service Pipe Removal52
9 Sanitary Sewer System Financial Plan 54
91 Tangible Capital Assets (TCA) Analysis 5492 Statement of Financial Position 5593 Statement of Operations 5794 Statement of Cash Flow 58
10 Conclusions and Recommendations 60
101 Conclusions 60102 Recommendations 62
References
Appendices
Appendix A Excerpt of City of Waterloo By-Law 2016-001
Appendix B Water amp Wastewater Volumes and Growth Projections
Appendix C Projected Capital Budget Requirements
Appendix D Projected Reserves Continuity Schedules
Appendix E System Costs and Revenue Requirements
Appendix F Projected Net Full Cost of Service
Appendix G Annual Cash-Flows
Appendix H Requirements of Ontario Regulation 45307
Appendix I Service Charges amp Rates Projections
xii DFA Infrastructure International Inc
City of Waterloo Water amp Sanitary Sewer Rate Design Study Final Report amp Water Financial Plan No 112-301
April 1 2016
Tables
Table 3-1 Rate Study Data Sources 7 Table 4-1 Council Feedback 9 Table 5-1 Water Volume Projections (2016-2021) 12 Table 5-2 Sanitary Sewage Volume Projections (2016-2021) 13 Table 6-1 Cost R elated A ssumptions 16 Table 6-2 Operating and Maintenance Costs (Water) 21 Table 6-3 Average Annual Full Cost o f Water System 23 Table 6-4 Operating and M aintenance Costs (Sanitary Sewer) 26 Table 6-5 Average Annual Full Cost o f Sanitary Sewer System 28 Table 7-1 Funding Sources 29 Table 7-2 Meter Equivalent R atios 30 Table 7-3 Existing (2016) Water amp Sanitary Sewer Rates and Charges 31 Table 7-4 Projected S ervice Charges amp Rates ndash Option 1 33 Table 7-5 Projected W ater Service Charges amp Rates - Option 2 34 Table 7-6 Projected S anitary Sewer Service Charges amp Rates ndash Option 2 34 Table 7-7 Projected W ater Service Charges amp Rates ndash Option 3 37 Table 7-8 Projected S anitary Sewer Service Charges amp Rates ndash Option 3 38 Table 7-9 Number of C ustomers in Each Consumption Block ( Option 3 ) 39 Table 7-10 Annual 2019 vs 2018 Costs to Customers 40 Table 7-11 Annual 2019 vs 2018 Costs to Customers 41 Table 7-12 Qualitative Analysis of R ate Options 43 Table 8-1 Asset Amortization a nd 2015 Net Book Value (NBV) 48 Table 8-2 Statement of F inancial Position 51 Table 8-3 Statement of O perations 52 Table 8-4 Statement of C ash Flow 53 Table 9-1 Asset Amortization a nd 2015 Net Book Value (NBV) 55 Table 9-2 Statement of F inancial Position 57 Table 9-3 Statement of O perations 58 Table 9-4 Statement of C ash Flows 59
Figures
Figure 6-1 Capital Funding Gap ( in $ 2015) ndash Water 19 Figure 6-2 Capital Funding Gap ( in $ 2015) ndash Sanitary Sewer 24
xiii DFA Infrastructure International Inc
City of Waterloo Water amp Sanitary Sewer Rate Design Study Final Report amp Water Financial Plan No 112-301
April 1 2016
1 Introduction 11 Background
The City of Waterloo (City) owns and operates a water distribution system and a sanitary
sewage (wastewater) collection system that service approximately 131000 residents The City
is responsible for ensuring that these systems are financially sustainable over the long-term
The delivery of water and sanitary sewage collection services in the Waterloo Region is a two-
tier structure whereby the Region of Waterloo (the Region) is responsible for water treatment
and transmission and wastewater treatment The Area Municipalities purchase water and
wastewater treatment services from the Region and are responsible for the water distribution
services to and sanitary sewage collection from their respective customers
The Regionrsquos annual charges to the City for water and wastewater treatment services are based
on actual water volume supplied to the City and the wastewater volume treated These are
calculated by applying the respective Regional water and wastewater volumetric rates to the
water and wastewater volumes as measured by the Region The Region is the ldquowholesalerrdquo and
the City is the ldquoretailerrdquo of water and wastewater services in the City of Waterloo Therefore
the Regionrsquos charges are a major part of the Cityrsquos annual service delivery costs The Regionrsquos
charges are more fully explained in Section 661 Cost Components Service
The total cost of the Cityrsquos water distribution and sanitary sewage collection services including
payments made to the Region are recovered from daily operating (non-rate) revenues (eg
administrative fees etc) and through direct billing to customers (rate revenues) The Citys
water bill to customers is comprised of monthly service charges based on meter size for water
plus consumption charges based on the respective water and sanitary sewage uniform rate per
cubic metre for volume of water consumed The sanitary sewer portion of the bill does not
include monthly service charges These revenues are required to cover the full costs of the
managing the water and wastewater systems including annual operating and capital costs and
long-term asset renewal costs net of any non-rate revenues However there is an increasing
risk to revenue recovery because consumption is volatile while many of the system costs are
fixed Consumption in recent years has been trending downwards despite continued growth
Therefore a more stable rate structure is required to improve the level of revenue recovery
over the long-term Accordingly there is a need for the City to update its rate structures and
rates to ensure that it remains on course to sustainable system financing The City is also
required to prepare and submit an updated Water System Financial Plan (No 112-301) to meet
the requirements of the Drinking Water Quality Management System as defined under OReg
45307 for renewal of its water distribution system licence
2 DFA Infrastructure International Inc
City of Waterloo Water amp Sanitary Sewer Rate Design Study Final Report amp Water Financial Plan No 112-301
April 1 2016
12 Purpose
The purpose of the rate study is to
bull Identify the full cost of services for the Cityrsquos drinking water and sanitary sewer systems
based on the most recent information
bull Develop water and sanitary sewer rate structures that would not only recover the full
cost of delivering these services but also provide sustainable financing over the long-
term and address the issue of declining water consumption and revenue stability
bull Prepare an updated Water System Financial Plan (No112-301) in accordance with the
requirements of OReg 45307 for the renewal of the licence for the Cityrsquos water
distribution system The existing licence expires on July 1 2016 and submission of the
financial plan as part of the licence renewal application to the Ministry of the
Environment (MOE) is required by June 1 2016 and
bull Prepare a Sanitary Sewer System Financial Plan similar to that required for water under
OReg 45307
2 Regulatory Requirements 21 Provincial Regulations
The primary Provincial legislation governing drinking water and sanitary sewer services include
the following
bull The Environmental Assessment (EA) Act 1990
bull The Environmental Protection (EP) Act 1990
bull The Safe Drinking Water Act 2002
bull The Municipal Act 2001
bull The Development Charges Act 1997
bull The Sustainable Water amp Sewer Systems Act 2002 and
bull The Water Opportunities amp Conservation Act 2010
The first two (2) set out the technical requirements related to service delivery The EA Act
applies to expansion of existing facilities and establishment of new capacity such as the
installation of new pipes The EP Act establishes the minimum requirements for the operations
of water and sanitary systems in terms of the potential environmental impacts
The Safe Drinking Water Act 2002 (SDWA) has significant implications to the daily water system
operations as it sets out the water sampling and other requirements (in OReg 17003) for
ensuring that the water delivered to consumers is high quality and safe for consumption This
Act has been a major influence over the past decade in terms of adjustments to operational
practices and quality expectations regarding both the Region and the City operations In
addition there is also a requirement under this Act (OReg 18807) for drinking water providers
3 DFA Infrastructure International Inc
City of Waterloo Water amp Sanitary Sewer Rate Design Study Final Report amp Water Financial Plan No 112-301 April 1 2016
to establish a Drinking Water Quality Management System (DWQMS) and obtain a licence for their respective water systems As part of this DWQMS and as required under O Reg 45307 (Financial Plans Regulation) operating authorities must submit a financial plan in order to renew their drinking water system licences These requirements are further described in Section 8 - OReg 45307 Water System Financial Plan No 112-301 There are also many other regulations and guidelines that deal with design and operation standards that mandate certain activities be undertaken as part of service delivery
The Municipal Act also sets out the financial requirements for managing the water and sanitary sewer systems including the assessment and recovery of full costs The Municipal Act Part VII Section 293 requires municipalities to establish reserves for dealing with long-term liabilities This applies directly to the pipe networks and the future liabilities associated with their age and condition The Municipal Act also permits the City to establish fees for cost recovery and requires public input prior to any fee adjustments The Development Charges Act and regulations establishes the requirements for the recovery of portions of future growth related capital expenditures to be incurred by the City
The Sustainable Water amp Sewer Systems Act 2002 (SWSSA)
The Sustainable Water and Wastewater Systems Act 2002 (SWSSA) was established based on the recommendations made by Justice OrsquoConnor on improvements to the management and operation of water and wastewater systems Under the SWSSA municipalities are required to submit reports on the full cost of service and method of cost recovery to the Province of Ontario as follows
A report prepared by a Professional Engineer identifying the full cost of water and sanitary sewer services
A report identifying a sustainable method by which the full cost would be recovered
The comments made by the Cityrsquos Auditor following a review of both reports and
Copies of Council resolutions accepting the recommendation of reports
Regulations under the SWSSA are still pending However these requirements have evolved over the years into best practice approaches taken by municipalities for sustainable water and sanitary sewer financial planning
The Water Opportunities and Conservation Act 2010 (WOA)
The WOA was enacted in November 2010 This legislation promotes water conservation and requires municipalities to prepare the following reports
Water conservation plans
Sustainability plans for water sanitary sewage amp stormwater management and
4 DFA Infrastructure International Inc
City of Waterloo Water amp Sanitary Sewer Rate Design Study Final Report amp Water Financial Plan No 112-301
April 1 2016
bull Asset management plans
Financial plans are required as a component of the water and sanitary sewer sustainability and
asset management plans Therefore more municipalities are now preparing sanitary sewer
financial plans as a best practise These financial plans that are similar to those required for
water systems in accordance with OReg 45307
22 City of Waterloo By-laws
By-Law 2016-001 establishes the Cityrsquos 2016 to 2018 water and sanitary sewer rates and
charges to its customers The rates and charges will be updated in 2019 through an update of
By-Law 2016-001 Excerpts of the by-law related to the drinking water and sanitary sewer rates
and charges are included in Appendix A
3 Methodology
This section outlines the study methodology which considers the feedback received from City
Council and customers as further described in Section 4
31 Guiding Principles
The water and sanitary sewer rate structure design is based on the guiding principles noted
below These reflect the feedback received from Council and customers described in Section 4
1 Full Cost Recovery All costs are to be recovered through the utility rates
2 Revenue Stability Provide stable and adequate annual revenue to minimize the
occurrence of annual deficits
3 User Pay Recover more revenue from those who use more water
4 Fairness and Equity Ensure to the extent possible that each customer class pays
its fair share with minimal cross subsidization
5 Uniform Rate Structure Rate structure to remain a uniform volumetric
(consumption) rate with no inclining or declining block (ie same consumption
rate for all users) However a rate option based on an inclining block rate
structure should be developed for further consideration
6 Water Conservation Water rate to be designed to facilitate ongoing water
conservation
7 Capital Financing To be through a combination of reserve rates debt (in accordance with the Cityrsquos debt policy)
8 Ease of Administration Rate calculations are to be transparent and easily
explainable to customers Rate structure must be compatible with existing billing
software capabilities and minimize costs due to rate structure changes
9 Affordability Customer affordability and assistance programs to be considered
as part of the study
5 DFA Infrastructure International Inc
City of Waterloo Water amp Sanitary Sewer Rate Design Study Final Report amp Water Financial Plan No 112-301
April 1 2016
32 Study Components
This study consists of three (3) main parts
bull Full Cost of Service This identifies the full costs (net of non-rate revenues) associated
with managing the water and sanitary sewer systems over a twenty-four (24) year study
period from 2016 to 2039
bull Rate Structure Alternatives (ie Full Cost Recovery) This identifies the rate structure
alternatives and the preferred option for recovery of costs (ie a revenue plan) through
proposed new rate structures and rates and charges to customers and
bull OReg45307 Financial Plans Section 8 presents the Water System Financial Plan (No
076-301) financial statements and other information required to meet the requirements
of OReg 45307 The financial statements are based on the information developed as
part of the full cost and revenue analyses completed for the rate study Similar financial
statements are also presented for the sanitary sewer system in Section 9
Full Cost Methodology
Calculation of the Cityrsquos full cost of managing the water and wastewater systems is based on
estimating and projecting the respective annual costs related to each system over the study
period These include
bull Annual operations and maintenance (OampM) costs related to water distribution and
sanitary sewage collection
bull Regional charges for water supply and wastewater treatment
bull Watermain and sewer replacement costs over the twenty four (24) year period based on
the renewal needs according to life expectancy as identified in the Cityrsquos Asset
Inventory
bull Capital funding for growth related projects over and above funding available through
the Development Charges Reserve Fund and direct contributions by developers as
presented in the Cityrsquos Capital Budget Forecast
bull Funding required for studies and non-growth operational improvement projects as
presented in the Cityrsquos Capital Budget Forecast
bull Annual contributions to a capital reserve fund for financing capital projects with a
minimum target of 1 of asset replacement value
bull Annual contributions to a rate stabilization reserve fund to offset major peaks and
valleys in rate requirements due to annual fluctuations in consumption as a result of
unpredictable weather patterns with a target of 5 phased in at a rate of 1 per year
beginning in 2019 over a 5-year period such that the 5 target is achieved by 2023 and
bull Repayment of existing and proposed future debt Debt will be utilized to address the
water network capital backlog and sanitary sewer system needs in accordance with the
Cityrsquos debt policy (maximum 30 of project cost to be funded by debt)
6 DFA Infrastructure International Inc
City of Waterloo Water amp Sanitary Sewer Rate Design Study Final Report amp Water Financial Plan No 112-301
April 1 2016
The assumptions made with respect to these cost items are presented in Table 6-1 The annual
costs are calculated in 2015 dollars and inflated over the study period
Cost Recovery Methodology
The fundamental components of the Cityrsquos current rate structure ie a fixed monthly charge
according to the customerrsquos meter size plus a consumption rate per cubic metre is maintained
as the basis for the water and sanitary sewer rate structures However options for improved
revenue security are provided and assessed against the guiding principles to identify a
preferred option Prior to completing this part of the study feedback from Council and
customers was obtained and incorporated into development of the options The base option is
the Cityrsquos 2015 rate structure with annual increases to the respective rates for full cost
recovery Two (2) additional options include adjusting the rate structure such that
approximately 15 of the annual revenue would be generated by the fixed charges and an
inclining block structure to promote conservation The current rate structure and rates for 2016
to 2018 as approved by Council under By-Law 2016-001 would continue to apply Therefore the
implementation year for the preferred rate structure option is 2019 The respective water and
sanitary rates over the study period and potential impacts to customers under each option are
modeled using DFArsquos Financial Planning Model A more detailed description of the Cityrsquos
current rate structure and the rate options for cost recovery are presented in Section 7
Data Sources
The primary sources of data used to prepare this rate study are listed in Table 3-1 In addition
information was also developed from discussions with and input from the Cityrsquos staff as
required
Table 3-1 Rate Study Data Sources
7 DFA Infrastructure International Inc
Item Data Source
Asset Life Expectancy bull The Cityrsquos Water amp Wastewater Asset Inventory
bull The Cityrsquos Water amp Wastewater Asset Inventory
Asset Replacement Cost bull bull
Unit Prices Provided by the City
Cityrsquos 2016 Capital Budget and 10-Year Capital
Forecast
Net Book Value (2014) Depreciation Historical Cost etc
bull The Cityrsquos PSAB 3150 Data for Water amp Wastewater
bull Cityrsquos 2013-2014 record of Building Permit Activity amp
actual development
Customer Growth bull Development Charges Study
bull People and Jobs Forecast 2015 to 2029
bull The revenues noted in the 2016 to 2018 annual
operating budgets
Item Data Source
OampM Costs bull Cityrsquos 2016 Budget
bull Regionrsquos 2016 Projected Rates amp Charges
Non-Rate Revenues bull Cityrsquos 2016 Budget Operating
bull Cityrsquos 2016 Budget Operating
Non TCA Capital Projections bull Cityrsquos 2016 Capital Budget and 10-Year Capital
Forecast
Water amp Wastewater Treatment bull Cityrsquos Historical Records
Volumes bull Cityrsquos Water Supply Master Plan
Water Volume Sold to Customers bull Cityrsquos 2016 Operating Budget Data
Existing Debt bull There is no existing water or wastewater debt
City of Waterloo Water amp Sanitary Sewer Rate Design Study Final Report amp Water Financial Plan No 112-301
April 1 2016
4 Stakeholder Feedback
The study process included obtaining feedback from members of Council and customers
through the following
bull A workshop session held on February 22 2016 with members of Council (Committee of
the Whole)
bull A Public Open House held on February 25 2016 in conjunction with the AssetManagement Plan and Water Master Plan public meeting requirements
The comments and feedback received was used to refine the guiding principles reserve
strategies and rate structure options for consideration
41 Committee of the Whole (COW) Feedback
The workshop session involved a presentation to COW outlining background information on the
water and sanitary sewer systems and the projected cost of service over the next 24 years
Survey questions were completed by members of Council during the workshop An overview of
the feedback is provided in Table 4-1
8 DFA Infrastructure International Inc
City of Waterloo Water amp Sanitary Sewer Rate Design Study Final Report amp Water Financial Plan No 112-301
April 1 2016
Table 4-1 Council Feedback
Workshop Item Feedback
Guiding P rinciples
Council was asked to rate the importance of e ach principle bull There was overall support for all principles
bull Consideration should be given to financing
capital projects not only from the respective
water and sanitary sewer capital reserve
funds but also through the use of d ebt
bull Although there was general support for
maintaining a uniform volumetric rate
structure the feedback suggested that an
inclining block structure should also be
examined to support water conservation and
user pay
Rate Structure Options
Council was asked to rank four (4) potential rate structure
options that would facilitate higher portions of r evenue
recovery from the fixed charges versus the volumetric charge
for both water and sanitary sewer
bull Option 1The existing rate structure
bull Option 2 6 revenue recovery from the fixed charges bull Options 2 and 3 were the most preferred 94 from the volumetric charge bull Options 1 and 4 were the least preferred
bull Option 3 20 revenue recovery from the fixed charges
80 from the volumetric charge bull Option 4 40 revenue recovery from the fixed charges
60 from the volumetric charge
Capital Reserve Strategies
Council was asked to rank four (4) potential capital reserve
strategies
bull Option 1Target a minimum reserve balance of 1 of
asset replacement value bull Option 1 was the most preferred
bull Option 2 Target a minimum reserve balance of less than bull Option 4 was the least preferred
1 of a sset replacement value bull Preference for Options 2 and 3 were mixed
bull Option 3 Target a reserve balance of 2 of a sset
replacement value
bull Option 4 Target a reserve balance of greater than 2 of
asset replacement value
9 DFA Infrastructure International Inc
Workshop Item Feedback
Rate Stabilization Reserve Strategies
Council was asked to rank four (4) potential capital reserve
strategies
bull Option 1Target a minimum reserve balance of 5 of
annual operating costs
bull Option 2 Target a minimum reserve balance of less than
5 of annual operating costs
bull Option 3 Target a reserve balance of 10 of annual
operating costs
bull Option 4 Target a reserve balance of greater than 10
of annual operating costs
Implementation Strategies
Council was asked to indicate a preference for implementing
the new rate structure
bull As part of the Asset Management Plan Implementation
(estimated to be 2019 for the purposes of this study)
bull As part of the next Water Services Utility rate report
(2017)
Affordability Program
Council was asked to indicate a support for establishing a
region wide affordability program for water and sanitary
sewer
bull bull
bull
bull
bull
Option 1 was the most preferred
Option 4 was the least preferred
Preference for Options 2 and 3 were mixed
Implementation in 2019 to align with the
Asset Management Plan Implementation was
preferred
There was strong support for this initiative
City of Waterloo Water amp Sanitary Sewer Rate Design Study Final Report amp Water Financial Plan No 112-301
April 1 2016
The following were also confirmed
bull Use of debt financing for capital needs will be utilized for up to 30 of the estimated
annual capital needs Water and sanitary sewer projects are exempt from the City Debt
Management Policy (FC-009) However a maximum debt funding limit of up to 30 of
the annual capital funding needs was used for the purposes of this study and rate
forecast as per the policy debt limits This is seen as an acceptable debt levelstrategy in
accordance with the Council approved tax base debt policy
bull Targeting capital reserve balances to be minimum 1 of the estimated asset
replacement value adjusted each year for inflation
bull Targeting rate stabilization reserve balances of 5 of annual operating costs each year
bull Implementing the new rate structure in 2019
10 DFA Infrastructure International Inc
City of Waterloo Water amp Sanitary Sewer Rate Design Study Final Report amp Water Financial Plan No 112-301
April 1 2016
41 Customer Feedback
A single combined Public Open House was hosted to obtain feedback on the rate design study
asset management plan and the master plan Attendees had the opportunity to view
information on display boards indicate their preferences regarding the guiding principles and
provide written feedback on comment sheets There were approximately ten (10) attendees
not including staff representing mainly the residential customers There was general support for
the guiding principles and the need for higher levels of revenue stability Only one comment
sheet was returned indicating a willingness to pay more for less future risk with respect to
water and sanitary sewer assets
5 Existing Systems
51 Water System
The water distribution system is operated by the Cityrsquos operations staff with support from
external contractors and consultants as needed The City provides water directly to its
customers through its water distribution system which is fed from the Regionrsquos water supply
system The distribution system generally consists of approximately 431 kilometres of
watermain of various ages materials and sizes 30050 water meters 2429 hydrants and 3995
valves Water use is metered for almost all customers
52 Sanitary Sewer System
The sanitary sewer system is operated by the Cityrsquos operations staff with support from external
contractors and consultants as needed The collection system consists of approximately 407
kilometres of sewer mains of various ages 5991 manholes and 6 pumping stations that are
monitored by City staff using a Supervisory Control and Data Acquisition (SCADA) system
53 Customer Growth
According to the Cityrsquos billing records the number of water and wastewater customers in 2016
is 30182 and 29906 respectively The annual customer growth for both water and wastewater
is estimated to be 246 residential customers for the study period beginning in 2019This is
consistent with 2013-2014 building permits issued and is conservative from an additional
revenue generation perspective Projections contained in the Development Charges Study and
People and Jobs Forecast 2015-2029 are considered to be relatively high for the purposes of
the rate study and would likely result in an over estimate of future revenues Note that all
growth is assigned to residential customers ie single family homes with a 15mm water meter
to be conservative with the revenue projections Growth for the period 2016 to 2018 is
assumed to be zero to match the revenue projections contained in the Cityrsquos annual budgets
forecasted for this period Annually any actual growth achieved will be captured by staff as part
11 DFA Infrastructure International Inc
City of Waterloo Water amp Sanitary Sewer Rate Design Study Final Report amp Water Financial Plan No 112-301
April 1 2016
of the annual consumption patterns update Appendix B presents the customer growth
projections over the study period
54 Water Volumes
The Cityrsquos historical and projected water volumes to be supplied annually by the Region and
sold to customers over the study period are shown in Appendix B The estimated water
volumes to be purchased and sold each year over the next six (6) years are shown in Table 5-1
The projected treatment volumes are based on a rolling 5-year average calculation which
includes a 1 annual increase that accounts for additional demand due to growth The annual
volume of water to be purchased from the Region each year is projected to increase from
approximately 12285662 m3 in 2016 to 13177504 by 2039 based on the Regionrsquos Water
Supply Master Plan This includes water that is supplied by the City of Waterloo to the City of
Kitchener and Bridgeport on a charge back basis estimated to be approximately 14400 m3 in
2016
The volumes projected to be sold to customers are based on a rolling 5-year average
calculation which includes a 1 annual reduction until 2018 This accounts for ongoing
conservation efforts and the overall downward trend in consumption despite annual customer
growth However an increase in the volume sold is projected to begin in 2019 to account for
growth The annual increases due to annual growth are estimated to be approximately 43050
m3 per year based on annual growth of 246 new customers per year and an average
consumption of 175 m3 per customer projected for 2019 The annual volumes to be consumed
by (ie sold to) customers are estimated to be approximately 10354586 m3 in 2018 increasing
to 11257292 m3 by2039 These are the ldquorevenuerdquo volumes used to calculate the annual
revenue from the metered consumption The difference between the purchase volumes and
the consumption volumes is the ldquounaccounted forrdquo or non-revenue water volume
Table 5-1 Water Volume Projections (2016-2021)
Water Volumes 2016 2017 2018 2019 2020 2021
Volume to be
Purchased from the 12285662 12274432 12268381 12318894 12368688 12426243
Region (msup3)
Revenue Volume (msup3) 10535117 10451447 10354586 10397572 10440558 10483544
Non-Revenue Water 1750545 1822985 1913795 1921323 1928130 1942700
(msup3)
12 DFA Infrastructure International Inc
City of Waterloo Water amp Sanitary Sewer Rate Design Study Final Report amp Water Financial Plan No 112-301
April 1 2016
55 Wastewater Volumes
The sanitary sewage collected by the City is not measured at the source but is metered by the
Region at the wastewater treatment plant These volumes include sanitary sewage
contributions from customers (as estimated based on metered water consumption) and inflow
and infiltration (IampI) into the sanitary sewer system
The historical and forecasted volumes of wastewater to be treated by the Region annually over
the 24-year study period are also shown in Appendix B These are based on the Cityrsquos forecast
for the period 2016 to 2018 which reflects the historical rolling 5-year average The annual
volume of wastewater to be treated by the Region each year is projected to increase from
approximately 16358051 m3 in 2018 to 16063727 by 2039 This includes IampI volumes and
additional wastewater generation due to growth
The revenue volumes for sanitary sewer billing are the metered water volumes for those
customers that also have water services This method of applying the sanitary sewer rates to
the metered water consumption volumes for billing purposes is standard industry practise
because sanitary sewage is typically not metered by municipalities The annual revenue
volumes including new customer growth are estimated to be approximately 10208507 m3 in
2018 increasing to 11118605 m3 by 2039 Note that there are customers that receive water
services only Therefore the revenue volumes for sanitary sewage are different from the
revenue volumes for water because of the difference between the number water and sanitary
sewer customers The 2016 annual treatment volume is 16264573 m3 compared to the
estimated sanitary sewage volume generated by customers of 10325928 m3 ie assuming that
all water consumed b y customers would be returned t o the wastewater system
The estimated volumes to be treated each year over the next six (6) years are shown in Table
5-2
Table 5-2 Sanitary Sewage Volume Projections (2016-2021)
13 DFA Infrastructure International Inc
Wastewater
Volumes 2016 2017 2018 2019 2020 2021
Citys Volume to be
Treated by Region 16264573 16193060 16358051 16084050 15779218 16135790
(msup3)
Sanitary Sewage
Revenue Volume (msup3) 10325928 10279351 10208507 10251845 10295183 10338521
City of Waterloo Water amp Sanitary Sewer Rate Design Study Final Report amp Water Financial Plan No 112-301
April 1 2016
6 Cost of Services
The respective full cost of managing the Cityrsquos water and sanitary systems takes into account all
factors that have a bearing on the level of effort and costs required to ensure a safe and reliable
supply of potable water to customers and public health and environmental protection
regarding sanitary sewage over the long-term These include both current and future
considerations that would influence the cost of managing the systems throughout their
respective lifetimes which can be several decades for water and sanitary sewer systems
Examples include replacement and rehabilitation of the distribution pipe network and the
sanitary sewer mains The cost implications of some of these factors are more predictable and
therefore more readily estimated than those of other factors eg the Cityrsquos OampM cost for the
distribution system is more predictable than the cost of purchasing water from the Region due
to varying weather conditions and consumption patterns Similarly the cost of sanitary sewage
treatment tends to increase with wet weather but revenues may decline due to lower water
consumption
Higher costs are expected in the future as the water and sanitary sewage business environment
changes However the impact can be mitigated by fully understanding assessing and planning
for future system costs The following sections identify the main drivers of cost the
assumptions made in quantifying costs and an estimate of the full cost of managing the water
and sanitary sewer systems The period used for this assessment is twenty-four (24) years
(2016 to 2039)
The respective full cost of managing the water and sanitary sewer systems is the total operating
and capital costs less non-rate revenues which are the revenues that are routinely generated
each year through the daily operations These include administrative revenues such as service
fees for turn-off charges lateral installations etc but do not include the revenues generated by
the water and sanitary sewer rates (ie from the sale of water) Accordingly the ldquonetrdquo full cost
of service represents the amount to be recovered from customers through the water and
sanitary sewer rates
61 Cost Components
The costs components related to the water system include the following
bull Operations and Maintenance (OampM) Costs of the Water Distribution Systems This
includes the costs of administration pipe repairs and maintenance water meter
maintenance hydrant maintenance water service installations and maintenance
sampling and testing and regulatory reporting
bull Regional Charges for the Supply of Treated Water to the City The cost of water
treatment and supply as billed by the Region is based on a uniform volumetric rate This
cost would vary depending on consumption and water loss within the Cityrsquos system and
14 DFA Infrastructure International Inc
City of Waterloo Water amp Sanitary Sewer Rate Design Study Final Report amp Water Financial Plan No 112-301
April 1 2016
is calculated as the product of the actual (metered) water volume purchased by the City
and the Regionrsquos uniform water rate
bull Capital Expenditures Capital expenditures are incurred primarily to replace and or
rehabilitate existing water related infrastructure each year as part of the Cityrsquos asset
management program and increase system capacity to accommodate new growth The
costs associated with studies design and construction are included in the capital
expenditures The capital costs associated with growth are normally recovered through
developer contributions and financing from the Development Charges Reserve
established by the City However depending on the project a portion of development
related costs may be funded from the capital reserve Annual contributions to the
capital reserve are required to ensure that sufficient funds are available to finance
projects as needed
bull Debt Repayment This is an annual cost for the repayment of debentures issued to
partially or fully fund capital projects There are no existing water system related debts
to be repaid However the City does intends to finance up to 30 of the water capital
backlog through debt in accordance with its current debt management policy and
discussions with staff
The sanitary sewer system cost components are similar to those for water
bull Operations and Maintenance (OampM) Costs of the Sanitary Sewer System This includes
the costs of administration pipe repairs and maintenance manhole repairs and service
lateral installations maintenance amp repairs
bull Regional Charges for the Treatment of the Cityrsquos Wastewater The cost of wastewater
treatment as billed by the Region is based on a uniform volumetric rate This cost would
vary depending on the volume of wastewater including inflow and infiltration
generated by the City It is calculated as the product of the actual treated wastewater
volume (as metered by the Region) and the Regionrsquos uniform wastewater rate This cost
tends to increase with wet weather due to the higher IampI volume
bull Capital Expenditures Capital expenditures are incurred primarily to replace and or
rehabilitate existing sanitary sewer related infrastructure each year as part of the Cityrsquos
asset management program and increase system capacity to accommodate new growth
The costs associated with studies design and construction are included in the capital
expenditures Annual contributions to the capital reserve are required to ensure that
sufficient funds are available to finance projects as needed
bull Debt Repayment There is no existing sanitary sewer system related debt at this time
However the City does intends to finance up to 30 of future capital projects (beyond
2025) through debt in accordance with its current financial policy and discussions with
staff
The assumptions made with respect to these cost components are summarized in Table 6-1
15 DFA Infrastructure International Inc
City of Waterloo Water amp Sanitary Sewer Rate Design Study Final Report amp Water Financial Plan No 112-301
April 1 2016
Table 6-1 Cost Related Assumptions
16 DFA Infrastructure International Inc
Applicable Factor Assumptions Regarding Future Costs
Water System amp Sanitary Sewer bull The current OampM costs are reflective of regulatory requirements
System Operations and Maintenance There would be no significant increase in the level of effort required
to operate and maintain the water system in the future The 2016 to
2018 OampM costs are the budget amounts already approved by the
City for this period However an increase of 3 per year is allowed
for inflation and any minor adjustments that may be required due to
future regulatory changes from 2019 onward
bull The Cityrsquos annual contribution to capital and rate stabilization
reserves is typically included in the annual OampM costs However
these contributions would be adjusted to suit the capital
requirements and target reserve levels and would vary as needed
over the study period
Region of Waterloo Water Supply bull The Regionrsquos rate structure is 100 volumetric and would continue
Charges indefinitely
bull The Regionrsquos Uniform Rate would increase in accordance with the
rate projections provided by the Region - 2016 - 2017 - +39 - 2017 onward - +29
bull The annual volume of water to be supplied by the Region would be as
projected by the City (ie a 5-Year Historical Rolling Average less 1
per year until 2018 to account for the decline in consumption)
bull The Regionrsquos projected Uniform Rate is inclusive of annual amounts
that may be required to fund any future rebate program for low
income water customers Discussions are ongoing with the Region
Region of Waterloo Wastewater bull The Regionrsquos rate structure is 100 volumetric and would continue
Treatment Charges indefinitely
bull The Regionrsquos Uniform Rate would increase in accordance with the
rate projections provided by the Region as follows up to 2025 Rates
for 2026-2064 are currently outside the Regionrsquos 10 year forecast
window but thought to be reasonable estimates based on the current
wholesale trend
- 2016-2018 - +69 - 2019-2021 - +59 - 2022-2025 - +49 - 2026-2030 - +39 - 2031-2064 - +29
bull The annual volume of wastewater to be treated by the Region would
be as projected by the City (ie a 5-Year Historical Rolling Average)
bull The Regionrsquos projected Uniform Rate is inclusive of annual amounts
that may be required to fund any future rebate program for low
income sanitary customers
Applicable Factor Assumptions Regarding Future Costs
Water amp Sanitary Sewer Revenue
Volumes (Volume to be Sold to
Customers)
Effective Date of Annual Regional amp
City Water Rates
Annual Variations in Revenue
Volumes (Volume Consumed) Due to
Weather Conditions
Water Consumption and Sanitary
Sewage Increases Due to the Addition
of New Customers
New and Emerging Regulations and
Guidelines Related to Water Quality
and Sanitary Sewer Management
Existing Asset Preservation and
Renewal
bull
bull
bull
bull
bull
bull
bull
bull
bull
bull
bull
bull
bull
bull
Volume of water used to calculate the Cityrsquos annual water revenues
and rates from 2016 to 2018 is based on the Regions Supply Master
Plan A 1 decline in consumption is applied to the previous five year
average consumption to reflect conservation
The revenue water volumes from 2019 onward would increase 3
annually due to growth from 10354586 m in 2018 based on the
assumption that the decline would level off by 2018
Because of the difference between the number of water and sanitary
sewer customers the volume of water used to calculate the Cityrsquos
annual sanitary sewer revenues and rates is based on the Regions
Supply Master Plan The historical rolling 5-year average treated
volume is used to project volumes from 2016 to 2018
For the purposes of the study the annual Region and the City water
rates are assumed to take effect on January 1st each year
Annual variations in weather conditions are unpredictable Therefore
an annual allowance is required as contributions to separate rate
stabilization reserves for water and sanitary sewer to account for
potential fluctuations in revenue due to consumption variations The
target balance for each rate stabilization reserve would be equal to
5 of the Cityrsquos annual operating cost for each system and be phased-
in at a rate of 1 per year over the course of 2019-2023
There are approximately 30360 water customers and 29819 sanitary
sewer customers in 2016
No increase in customers is projected for 2016 to 2018 to match the
revenue assumptions in the Cityrsquos 2016 to 2018 budgets
Approximately 246 new residential customers would be added
annually from 2019 onward based realized growth from 2013 to 2014
(conservative assumption) 3
Residential customers would consume approximately 175 m per
customer based on the Cityrsquos 2018 consumption projection This is an 3
additional 43050 per year m
There would be no Non-residential customer growth (conservative
assumption)
The implications of the Safe Drinking Water Act and the Water
Opportunities Act have already been realized for the most part Any
further cost implications of emerging regulations would be taken into
account in the annual 3 increase for OampM costs
The timing of pipe and other asset replacement would be based on
age and life expectancies contained in the Citys Asset Inventory
Capital expenditures would also be driven by the Cityrsquos 10-year capital
forecast for the period 2016 to 2025
Water related asset backlog (ie replacements due as of 2015 or
City of Waterloo Water amp Sanitary Sewer Rate Design Study Final Report amp Water Financial Plan No 112-301
April 1 2016
17 DFA Infrastructure International Inc
Applicable Factor Assumptions Regarding Future Costs
New growth related infrastructure
Inflation
Capital Financing
Market Competition and Pricing
bull
bull
bull
bull
bull bull
bull
bull
bull
bull
earlier) is spread over a 21-year period starting in 2019
Sanitary sewer related asset backlog is assumed to be already
captured in the Citys capital replacement plan
The growth related capital projects are based on the information
contained in the Cityrsquos 2016 ndash 2025 capital budget forecast
All project costs that are due to be funded directly by developer
contributions and from DC Reserve Fund are not considered as direct
cost to the City ie only the net cost to the City is considered in the
future cost projections
The Inflation index is estimated at 3 per annum for construction
related costs
The City has no existing debt related to water and sanitary sewer
Future capital financing for addressing the water backlog will be
through a combination of capital reserves and debt financing as
indicated through Councilrsquos feedback in accordance with the Cityrsquos
debt management policy as recommended by staff
Future capital financing for sanitary sewer projects would also be
through a combination of capital reserves and debt (beyond 2025)
The City also plans to issue debentures to partially fund some growth
related projects
Third party funding is only considered where the funds are confirmed
to be available
All outsourced services will be secured through a competitive bid
process thereby benefiting from market pricing and competition Any
market price increases would be covered of by the annual inflation
assumption
The factors described in Table 6-1 have different cost implications Some are directly within the
Cityrsquos control while others are not (eg Regional rates water demand fluctuations due to
weather variations) depending on the factor For example there is flexibility with capital
expenditures as upgrades can be planned and timed to suit a particular budget strategy Lost
revenues due to unaccounted for water and costs related to demand fluctuations are more
difficult to control It is also assumed that expansion of the water and sanitary sewer systems
will be limited to within the existing approved service areas
City of Waterloo Water amp Sanitary Sewer Rate Design Study Final Report amp Water Financial Plan No 112-301
April 1 2016
18 DFA Infrastructure International Inc
City of Waterloo Water amp Sanitary Sewer Rate Design Study Final Report amp Water Financial Plan No 112-301
April 1 2016
61 Full Cost Assessment ndash Water System
611 Water System Capital Costs
The water system capital budget requirements over the study period are presented in Appendix
C This reflects the projects identified in the Cityrsquos 10-year Capital Budget Forecast in
conjunction with the replacement of existing water system assets based on the asset inventory
and life expectancies and age It should be noted that some of the projects identified in the 10-
year Capital Budget Forecast include asset replacement Therefore these projects were
rationalized with the projected asset replacement needs to ensure that there was no
duplication in the projections There is also an existing backlog of asset replacement
requirements related to the water system estimated at approximately $33 million (in 2015
dollars) based on life expectancy These capital needs are spread over the 21-year period from
(2019 to 2039 inclusive) for better affordability due to the magnitude of the costs
A comparison of the capital needs to the existing level of capital funding indicates that there is
a funding gap which is estimated to be approximately $128 million over the next 20 years
However beyond 2036 current funding levels appear to be sufficient as shown in Figure 6-1
The 2016 budget for existing asset replacement related capital expenditures is $3687134 This
annual amount needs to be increased over the next twenty (20) years to close the funding gap
If the capital investment is not increased in the short-term to the levels noted in Appendix C
then the funding gap would continue to exist beyond 2035 and the water system would not be
financially sustainable
Figure 6-1 Capital Funding Gap (in $2015) ndash Water
45000000
40000000
35000000
30000000
25000000
20000000
15000000
10000000
5000000
-2016 to 2025 2026 to 2035 2036 to 2045 2046 to 2055 2056 to 2065
Existing Asset Funding 33582130 33582130 33582130 33582130 33582130
Asset Replacement Summary 40453995 39517821 21299913 31184756 22362999
Appendix C also shows the projected sources financing for the annual expenditures Capital
financing will be through the capital reserve and debt (to a maximum 30) Other sources of
financing such as provincial and or federal grants are unpredictable and are therefore not
19 DFA Infrastructure International Inc
City of Waterloo Water amp Sanitary Sewer Rate Design Study Final Report amp Water Financial Plan No 112-301
April 1 2016
considered over the long-term However the City is encouraged to aggressively pursue these
funding opportunities as they become available to reduce the overall amount to be funded
from the rates and Water Capital Reserve Fund The reserve fund requirements are discussed in
Section 612
612 Water System Reserve Fund Requirements
There are two (2) reserve funds being recommended as part of this study
bull The Water Capital Reserve Fund and
bull The Water Rate Stabilization Reserve
Appendix D shows the projected continuity schedules for both reserves This shows the
transfers to and from the respective reserves and the opening and closing balances Reserves
are assumed to earn zero annual interest on balances
Water Capital Reserve Fund
The Water Capital Reserve Fund which had an opening balance of approximately $44 million
at the beginning of 2016 will be a source of financing along with debt for future projects This
requires that annual contributions be made to the Water Capital Reserve Fund to ensure that
sufficient funds are available particularly for the asset replacement rehabilitation projects
required over the long-term These annual contributions (to be raised through the water rates
each year) are generally projected to range between $28 million starting in 2016 to
approximately $48 million by 2027 The 2016 transfer includes an annual amount of
$1000000 from the Sanitary Sewer Capital Reserve Fund for repayment of a loan from water
The loan is expected to be fully repaid by 2019 The reserve closing balance is targeted to be a
minimum of 1 of the asset replacement value adjusted for inflation each year over the study
period The annual reserve balance is projected to be $45 million at the close of 2016
decreasing to approximately $34 million by 2019 and increasing again to approximately $38 by
2027
Water Rate Stabilization (Operating) Reserve Fund
The Water Rate Stabilization Reserve Fund is required to provide a source of funding to offset
any year-end operating deficits that may occur during the period and avoid unplanned rate
spikes in the subsequent year The annual contributions (to be raised through the water rates
each year) are based on maintaining a target balance of 5 of the total operating expenditures
ie the revenue requirements (approximately $12 million on average over 24 years) Transfers
to this reserve fund are targeted to begin in 2019 and phased in at a rate of 1 per year until
2023 Annual contributions over the 24-year period are projected to range between $0 in 2016
and $245241 depending on the reserve balance and its utilization
20 DFA Infrastructure International Inc
City of Waterloo Water amp Sanitary Sewer Rate Design Study Final Report amp Water Financial Plan No 112-301
April 1 2016
613 Debt Related Costs
There is no existing water system debt However based on feedback from Council the City will
utilize debt to finance future asset renewal projects which will tend to smooth the rates The
City also plans to incur some growth related debt to supplement the Water amp Sanitary
Development Charges Reserve Fund to be used to finance the growth portions of projects This
future growth related debt and resulting debt repayment does not affect the costs to be
recovered from the water rates but are considered in the financial statements included in
Section 8
614 Water System Operations amp Maintenance (OampM) Cost
The annual operating budget is based on the operations and maintenance needs of the water
system The annual budget reflects the costs as shown in Table 6-2 These costs include the
Regionrsquos charges for supplying water to the City but do not include transfers to reserves as the
capital related costs are addressed separately in Section 612 The OampM costs are offset by
non-rate revenues with the resulting net costs to be recovered from rates
The gross 2016 OampM cost including the Regionrsquos charges are estimated to be $178 million This
cost would be offset by $044 million in non-rate revenues for a Net OampM cost of approximately
$173 million The purchase of water from the Region budgeted to cost $123 million in 2016
accounts for a significant portion (approximately 60) of the Cityrsquos annual OampM costs
The annual OampM costs (except for the Regionrsquos charges) and the non-rate revenues are
assumed to increase by 3 each year to allow for inflation plus any operational changes that
may be required The Regionrsquos charges would increase based on the Regionrsquos projected uniform
rates and the volume of water supplied to the City The assumptions respecting the Regionrsquos
charges are noted in Table 6-1 Appendix E presents the gross operating costs non-rate
revenues and net costs to be recovered from users through the Citys fixed and consumption
charges
Table 6-2 Operating and Maintenance Costs (Water)
21 DFA Infrastructure International Inc
Operating and Maintenance Costs 2016 Budget Operating Expenditures
Water Administration $ 2704238
Water Meters
Water Meter ReplacementInstallation $ 354693
Hydrants $ 10621
Valves $ 12724
Water-City
Infrastructure Management $
12047
Miscellaneous $ 280305
Operating and Maintenance Costs 2016 Budget Service Calls $ 135987
Subdivision Work $ 4307
Watermains $ 942058
Testing $ 23396
Hydrants $ 225876
Meters $ 250277
Service Repairs $ 172431
Vacuum Excavations $ 46878
Non Potable Pumping Station $ 1338
Water-Duel
Miscellaneous $
2264
Watermains $ 19290
Administration $ 138711
Prog-Water $ 129300
Wholesale Water Purchase from Region $ 12303913
Gross $ 17770654
Non-Rate Revenues
Water Administration $ 202132
Interdepartmental Repayment $ 121132
Water Meter $ 99595
Water-City $ 4295
Recoveries-Regional Water $ 10777
Net $ 17332723
City of Waterloo Water amp Sanitary Sewer Rate Design Study Final Report amp Water Financial Plan No 112-301
April 1 2016
615 Net Full Cost of Water System
The net full cost of managing the water system over the next twenty four (24) years is a
reasonable estimate of full costs to be recovered through the rates and is comprised of
bull Net Annual OampM Costs (ie after non-rate revenues are considered)
bull Net Capital costs (pipe replacement growth and non growth projects) ie not including
contributions from developers or grants
bull Water treatment (Regional) costs
bull Rate stabilization allowance
bull Capital reserve contributions and
bull Debt financing cost
Table 6-3 is a summary of the projected costs related to the water system over the study period
including the next 5 years It shows that the average annual cost of managing the water system
is approximately $306 million over the next 24 years compared to current (2016) annual costs
of approximately $205 million Debt repayment accounts for 3 of the annual costs
Operations cost are estimated to be approximately $76 million (25) and the capital costs $39
22 DFA Infrastructure International Inc
City of Waterloo Water amp Sanitary Sewer Rate Design Study Final Report amp Water Financial Plan No 112-301
April 1 2016
million (13) These are fixed costs that account for approximately 41 of the total annual
costs The purchase of water from the Region is estimated to be approximately $181 million
(59) of the overall net cost over the study period These are variable costs because of the
Regionrsquos rate structure for water treatment which is 100 volumetric However most of the
water treatment costs are fixed Therefore if the Region were to change its current rate
structure then most of Regionrsquos cost would become a fixed cost to the City The average
annual full cost of service is approximately $220 million over the next 5 years
The projected costs and net revenue requirements for each year over the next 24 years are
used as the basis for developing the rates The projected annual net full costs of managing the
water system over the period are presented in Appendix F
Table 6-3 Average Annual Full Cost of Water System
Cost Component
(Water) 2016 2016 ()
Average ($)
- (2016 2020)
Average ()
- (2016 2020)
Average ($)
- (2016 2039)
Average ()
- (2016 2039)
Capital Reserve $ 2777481 14 $ 3100679 14 $ 3962470 13
Transfers
Regional Charges $12303913 60 $13058563 59 $18083887 59
Operating $ 5466741 27 $ 5811017 26 $ 7580721 25
Expenses
$ Debt Repayment 0 $ 11417 0 $ 972520 3
-
Total $20548135 $21981676 $ 30599598
62 Full Cost Assessment ndash Sanitary Sewer System
621 Sanitary Sewer System Capital Costs
The sanitary sewer system capital budget requirements over the study period are presented in
Appendix C This reflects the projects identified in the Cityrsquos 10-year Capital Budget Forecast in
conjunction with the replacement of existing sanitary sewer assets based on the asset inventory
and life expectancies and age It should be noted that some of the projects identified in the 10-
year Capital Budget Forecast include asset replacement Therefore these projects were
rationalized with the projected asset replacement needs to ensure that there was no
duplication in the projections
A comparison of the capital needs to the existing level of capital spending indicates that current
funding levels are sufficient over the next 20 years until approximately 2035 as shown in Figure
6-2 However a funding gap in excess of $726 million is projected beyond 2035 (ie between
2036 and 2065 which is outside the window of this study) but a prime candidate for the
utilization of debt financing in the long-term The 2016 budget for capital expenditures is $38
23 DFA Infrastructure International Inc
City of Waterloo Water amp Sanitary Sewer Rate Design Study Final Report amp Water Financial Plan No 112-301
April 1 2016
million This annual amount should be sufficient for the next few years but should be increased
over the 24-year period to address the increasing sanitary sewer needs
If the capital investment is not increased to the levels noted in Appendix C then the funding
gap beyond 2035 would not be addressed and the sanitary sewer system would not be
financially sustainable
Figure 6-2 Capital Funding Gap (in $2015) ndash Sanitary Sewer
80000000
70000000
60000000
50000000
40000000
30000000
20000000
10000000
-2016 to 2025 2026 to 2035 2036 to 2045 2046 to 2055 2056 to 2065
Existing Asset Funding 32145413 32145413 32145413 32145413 32145413
Asset Replacement Summary 25702070 26719721 45344152 55111845 68602022
Appendix C also shows the projected sources financing for the annual expenditures Capital
financing will be through the Sanitary Sewer Capital Reserve Fund and debt (beyond 2025) in
the long term Other sources of financing such as provincial and or federal grants are
unpredictable and are therefore not considered over the long-term However the City is
encouraged to aggressively pursue these funding opportunities as they become available to
reduce the overall amount to be funded from the rates and capital reserve The reserve fund
requirements are discussed in Section 622
622 Sanitary Sewer Reserve Fund Requirements
There are two (2) reserve funds being recommended as part of this study
bull The Sanitary Sewer Capital Reserve Fund and
bull The Sanitary Sewer Rate Stabilization (Operating) Reserve
Appendix D shows the projected continuity schedules for both reserves This shows the
transfers to and from the respective reserves and the opening and closing balances
24 DFA Infrastructure International Inc
City of Waterloo Water amp Sanitary Sewer Rate Design Study Final Report amp Water Financial Plan No 112-301
April 1 2016
Sanitary Sewer Capital Reserve Fund
The Sanitary Sewer Capital Reserve Fund which had an opening balance of approximately $79
million at the beginning of 2016 will be a source of financing in conjunction with debt (beyond
2025) for future projects This requires that annual contributions be made to the Sanitary
Sewer Capital Reserve Fund to ensure that sufficient funds are available for the asset
replacement rehabilitation projects These annual contributions (to be raised through the
sanitary sewer rates each year) are generally projected to range from $40 million in 2016 to
approximately $30 million by 2026 The reserve closing balance is targeted to be a minimum of
1 of the asset replacement value adjusted for inflation each year over the study period The
annual reserve balance is projected to be $86 million at the close of 2016 increasing to $96
million by 2026
Sanitary Sewer Rate Stabilization (Operating) Reserve Fund
The Sanitary Sewer Rate Stabilization Reserve Fund is required to provide a source of funding to
offset any year-end operating deficits that may occur during the period and avoid unplanned
rate spikes in the subsequent year The annual contributions (to be raised through the sanitary
sewer rates each year) are based on maintaining a target balance of 5 of the annual operating
expenditures (approximately $17 million on average over 24 years) Transfers to this reserve
fund are targeted to begin in 2019 and phased in at a rate of 1 per year until 2023 Annual
contributions over the 24-year period are projected to range between $0 in 2016 and $346196
depending on the reserve balance and its utilization
623 Debt Related Costs
Similar to water there is no existing sanitary sewer system debt However based on feedback
from Council the City will utilize debt to finance future asset renewal projects which will tend to
smooth the rates Debt financing is expected to play a major role in funding projects beyond
the next 24 years when much of the sanitary sewer system becomes due for replacement The
City also plans to incur some growth related debt to supplement the Water amp Sanitary Sewer
Development Charges Reserve Fund to be used to finance the growth portions of projects This
future growth related debt and resulting debt repayment does not affect the costs to be
recovered from the water rates but are considered in the financial statements included in
Section 9
624 Sanitary Sewer System Operations amp Maintenance (OampM) Cost
The annual operating budget is based on the operations and maintenance needs of the sanitary
sewer system The annual budget reflects the costs as shown in Table 6-4 These costs include
the Regionrsquos charges wastewater treatment but do not include transfers to reserves because
the capital related costs are addressed separately in Sections 622 The OampM costs are offset
by non-rate revenues with the resulting net costs to be recovered from rates
25 DFA Infrastructure International Inc
City of Waterloo Water amp Sanitary Sewer Rate Design Study Final Report amp Water Financial Plan No 112-301
April 1 2016
Table 6-4 Operating and Maintenance Costs (Sanitary Sewer)
Operating and Maintenance Costs 2016 Budget
Operating Expenditures
Sewer Administration $2346514
Sewer Maintenance
Zoom Camera
$179476
Infrastructure Management $19543
Sanitary Sewer Flow Monitoring $51000
Laterals $640135
Sanitary Sewers $341400
Forcemain $2412
Pumping Station $247743
Prog-Sewer $120757
Interdepartmental Repayment $1108632
Net Operating Surplus $3081999
Regional Sewage Treatment Cost $16248249
Gross $24387860
Non-Rate Revenues
Sewer Administration $370088
Interdepartmental Repayment $12500
Sewage Rev-Extra Sewage $798050
Net $23207222
The gross 2016 OampM cost including the Regionrsquos charge is estimated to be $24387860 This
cost would be offset by $1180638 in non-rate revenues for a Net OampM cost of approximately
$23207222 Approximately $798000 in revenue is expected to be received from the City of
Kitchener annually for sanitary sewage that flows through the City of Waterloorsquos system
Wastewater treatment budgeted to cost $16248249 in 2016 accounts for a significant portion
(approximately 67) of the Cityrsquos annual OampM costs
The annual OampM costs (except for the Regionrsquos charges) and the non-rate revenues are
assumed to increase by 3 each year to allow for inflation plus any potential regulatory
changes The Regionrsquos charges would increase based on the Regionrsquos projected uniform rates
and the volume of wastewater treated from the City The assumptions respecting the Regionrsquos
charges are noted in Table 6-1 Appendix E summarizes the gross operating costs non-rate
revenues and net costs to be recovered from users through the Citys fixed and consumption
charges
26 DFA Infrastructure International Inc
City of Waterloo Water amp Sanitary Sewer Rate Design Study Final Report amp Water Financial Plan No 112-301
April 1 2016
625 Net Full Cost of Sanitary Sewer System
The net full cost of managing the sanitary sewer system over the next twenty-four (24) years is
a reasonable estimate of full costs to be recovered through the rates and is comprised of
bull Net Annual OampM Costs (ie after non-rate revenues are considered)
bull Net Capital costs (pipe replacement growth and non growth projects) ie not including
contributions from developers or grants
bull Wastewater treatment (Regional) costs
bull Rate stabilization allowance and
bull Capital reserve contributions
Table 6-5 is a summary of the projected costs for all the sanitary sewer system cost
components over the study period It shows that the average annual cost of managing the
sanitary sewer system is approximately $383 million over the next 24 years compared to 2016
costs of approximately $245 million The annual transfers to reserve are expected to decrease
from approximately $32 million in 2016 to an average annual amount of approximately $29
million over the next 24 years as most of the sanitary sewer system needs are beyond 2035
There are currently no debt related costs based on the Cityrsquos current capital needs However as
indicated in Section 623 debt will play a future role in the long-term capital financing strategy
(beyond 2025) for the sanitary sewer network and are estimated at approximately $524000
(1) Operations cost are estimated to be approximately $59 million (15) and the capital
costs $29 million (8) These are fixed costs that account for approximately 24 of the total
annual costs The treatment of wastewater by the Region is estimated to be approximately $29
million and accounts for 76 of the overall net cost These are variable costs because the
Regionrsquos current rate structure for wastewater treatment is 100 volumetric However most of
the treatment costs are fixed Therefore if the Region were to change its current rate structure
then most of Regionrsquos cost would become a fixed cost to the City
The projected costs and net revenue requirements for each year over the next 24 years are
used as the basis for developing the rates The projected annual net full costs of managing the
sanitary sewer system over the period are presented in Appendix F
27 DFA Infrastructure International Inc
Table 6-5 Average Annual Full Cost of Sanitary Sewer System
Cost Component
(Sanitary Sewer) 2016 2016 ()
Average ($)
- (2016 2020)
Average ()
- (2016 2020)
Average ($)
- (2016 2039)
Average ()
- (2016 2039)
Capital Reserve $ 3227783 13 $ 2954049 11 $ 2895828 8
Transfers
Regional Charges $16248249 66 $18382061 70 $28981774 76
Operating Expenses $ 5057612 21 $ 5083741 19 $ 5915288 15
Debt Repayment $ - 0 $ - 0 $ 524342 1
Total $24533644 $26419851 $38317232
City of Waterloo Water amp Sanitary Sewer Rate Design Study Final Report amp Water Financial Plan No 112-301
April 1 2016
7 Financing the Water amp Sanitary Sewer System Costs
This Section presents an analysis of the rate structure options the preferred structure and the
rates and charges required to provide sufficient revenues to recover the full costs associated
with the management of the Cityrsquos water and sanitary sewer systems
71 Sources of Financing
The current methods of financing for each cost component are summarized in Table 7-1 In
general capital projects are funded through rates and reserves The reserve funds are built
through annual contributions included in the water and sanitary sewer rates and charges each
year The City also intends to use debt along with reserves to finance future capital needs
Growth related projects are funded primarily through the Development Charges (DC) Reserve
and direct developer contributions Any additional funding from the City for growth related
projects is usually from the capital reserve fund Therefore only the ldquonetrdquo funding required
through the capital reserve funds is considered for growth related projects in this study as
identified in the 2016 capital budget forecast All other costs are recovered through the annual
rates and charges Periodically specific projects and activities may be funded by grants
available through Federal and Provincial Government funding programs and cost sharing
arrangements with the Region However this type of financing is not always available and only
considered in the study where funding has been confirmed
28 DFA Infrastructure International Inc
City of Waterloo Water amp Sanitary Sewer Rate Design Study Final Report amp Water Financial Plan No 112-301
April 1 2016
Table 7-1 Funding Sources
Item Funding Source
OampM bull Rates
bull DC Reserve Fund
bull Developer Contributions
Growth Projects bull Water Capital Reserve Fund for Water Projects
bull Sanitary Sewer Capital Reserve Fund for Sanitary Sewer Projects
bull Debt Financing (in the future)
bull Water Capital Reserve Fund for Water Projects
bull Sanitary Sewer Capital Reserve Fund for Sanitary Sewer Projects
Capital Replacement bull Debt Financing (in the future)
bull Transfers from Operating
bull Grants (as applicable)
Reserve Contributions bull Rates
Regional Charges bull Rates
72 Existing Rate Structure amp Rates
The Citys current rate structure for water includes a Water Service Charge (ie a base or fixed
charge component) that is set according to the customerrsquos meter size and a Water Rate (ie a
uniform consumption rate) The key features of this rate structure are
bull The revenues from the Service Charges are guaranteed because they are fixed
charges and can bring stability to the overall revenue stream and
bull This structure has all of the benefits of a uniform rate (eg promoting water
conservation) but without the extreme volatility of relying 100 on consumption
revenues However in the Cityrsquos case the portion of revenue from the service
charges is relatively small (approximately 6 for water and 0 for sanitary sewer)
and is only a minor benefit to revenue stability
The sanitary sewer rate structure includes only a volumetric rate that is applied to water
consumption but does not include a Sanitary Sewer Service Charge component Therefore 100
of the revenues are dependent on water use which can lead to revenue uncertainty and deficits
due to lower consumption The water and sanitary sewer rates are shown in Table 7-3
In general the current rate structure recovers only approximately 6 of the annual water
revenue and 0 of the annual sanitary sewer revenues from the fixed charges making revenues
heavily dependent upon consumption This increases the risk of incurring deficits especially in
wet years when water consumption tends to be lower than predicted This is particularly the
case for sanitary sewer revenues which are based on water consumption The revenue tends to
29 DFA Infrastructure International Inc
City of Waterloo Water amp Sanitary Sewer Rate Design Study Final Report amp Water Financial Plan No 112-301
April 1 2016
be lower in wet years but the cost of treatment tends to be higher due to inflow and
infiltration Most of the water and sanitary sewer costs are fixed (approximately 41 for water
and 24 for sanitary sewer as noted in Section 615 and Section 625 respectively) whereas
the revenue recovery tends to be more volatile ie the revenue structure does not match the
cost structure Although the Regionrsquos charges are volumetric most of the costs of treatment are
fixed except for hydro and chemical costs If the Region were to change its rate structure from
100 volumetric then the Cityrsquos rate structure would need to be revisited and changed to suit
the new cost structure Therefore the existing rate structure is exposed to revenue volatility
unless changes are made to recover a greater portion of revenues from the fixed charges (ie
guaranteed revenue regardless of consumption) The creation of respective Water and Sanitary
Sewer Rate Stabilization Reserve Funds is one way to mitigate some of the revenue volatility
risk resulting from the current rate structure
721 Service Charges
The Service Charges are calculated according to the size of the customerrsquos meter using meter
equivalency ratios The smallest meter (15mm) which is typical for residential customers has a
Meter Equivalency Ratio of 1 The charge for this meter size is calculated first and is used the
baseline charge for calculating the service charges for the larger meter sizes These are
determined by multiplying the baseline charge by the respective equivalency ratio for each
meter size This method of calculating base or fixed charges for water and sanitary sewer is
widely used in Ontario and is consistent with the American Water Works Association (AWWA)
guidelines for fees and charges The equivalency ratios are shown in Table 7-2
Table 7-2 Meter Equivalent Ratios
Meter Size Equivalency Ratio
15 mm 100
25 mm 202
40 mm 369
50 mm 462
75 mm 966
100 mm 1424
150 mm 2402
200 mm 3627
250 mm 4823
These ratios are also considered in the development of the alternative rate structures and rates
discussed in this section Under the existing rate structure there are services charges for the
water system but not for the sanitary sewer system as shown in Table 7-3
30 DFA Infrastructure International Inc
722 Uniform Consumption Rate
The uniform consumption rate is a water rate that is applied to each customerrsquos metered
consumption regardless of the type of customer the size of the meter and volume consumed
ie a single rate as opposed to multiple rates that vary depending on consumption or customer
type This portion of the charge is consistent with the concept of user pay because the cost to
the customer increases with consumption and is generally within the control of the customer
Under the current structure there are separate uniform rates for water and sanitary sewer (ie
a Water Rate and a Sanitary Sewer Rate) as shown in Table 7-3
Table 7-3 Existing (2016) Water amp Sanitary Sewer Rates and Charges
Meter Size (mm) 2016
Annual Water Service Charges ($year)
15 mm $ 3576
25 mm $ 7213
40 mm $ 13198
50 mm $ 16528
75 mm $ 34543
100 mm $ 50924
150 mm $ 85910
200 mm $ 129695
250 mm $ 172459
Uniform Rate ($msup3)
Water Rate ($msup3) $ 170
Sanitary Sewer Rate ($msup3) $ 217
City of Waterloo Water amp Sanitary Sewer Rate Design Study Final Report amp Water Financial Plan No 112-301
April 1 2016
73 Alternative Rate Structures amp Rates
This section presents the projected future rates for the existing rate structure plus two (2)
alternative structures developed based on the guiding principles discussed in Section 31 and
feedback received from the Council Workshop and Public Open House The future rates under
each option are required to meet the water and sanitary sewer revenue requirements (ie to
recover the full cost of managing the water and sanitary sewer systems based on the
assessment of system costs over the study period) The cost impacts of each option to the
different customer types are discussed and the preferred rate structure option and rates
identified
The first option is to continue using the existing rate structure and develop the rates required
for full cost recovery This is the rate structure described in Section 731 However one of the
main issues identified is the historical decline in water consumption and the resulting increased
risk of not collecting sufficient rate revenues to fully offset the cost of service This can result in
annual deficits if not addressed The existing structure is exposed to this risk as most of the
31 DFA Infrastructure International Inc
City of Waterloo Water amp Sanitary Sewer Rate Design Study Final Report amp Water Financial Plan No 112-301
April 1 2016
revenues are derived from consumption charges Therefore the two (2) alternative rate
structures are geared towards increasing revenue stability while at the same time maintaining
consistency with the other guiding principles to the extent possible In all three (3) options
implementation would begin in 2019 when the existing 2016 to 2018 rates become due for
renewal This is consistent with the feedback received from Council regarding the
implementation strategy
The rates required under each option over the 24-year study period are based on cash flow
analyses undertaken
731 Rate Structure Option 1 ndash Existing Structure
This option is the current structure used by the City to recover the costs of the water and
sanitary sewer systems The service charges and rates approved under By-Law 2016-001 will
continue to apply for the period 2016 to 2018 In 2019 the service charges and rates are
increased as needed to reflect full cost recovery for both systems Under this option the City
would continue to recover approximately 6 of the required water system revenues from the
Water Service Charges (ie guaranteed revenue) and 94 from consumption based on the
Water Rates This means that there would continue to be a heavy reliance on the consumption
based revenues each year which poses risk to revenue recovery Sanitary sewer system costs
would also continue to be recovered through the volumetric Sanitary Sewer Rate only ie
without a service charge component The 6-year water and sanitary sewer rate projections for
Option 1 are provided in Table 7-4
The Water Service Charges are projected to increase by 029 915 and 261 in 2019 (over
2018) 2020 and 2021 respectively The water rate is projected to increase by 878 948 and
291 in 2019 2020 and 2021 Similarly the Sanitary Sewer Rate is projected to increase by
approximately 655 each year from 2019 to 2021 inclusive These increases are necessary to
recover the full cost of service Rate and service charge projections for the study period are
presented in Appendix I
32 DFA Infrastructure International Inc
Table 7-4 Projected Service Charges amp Rates ndash Option 1
Rate
Component 2016 2017 2018 2019 2020 2021
Annual Water Service Charges
Annual Increase () 241
15 mm $3576
25 mm $7224
40 mm $13200
50 mm $16548
75 mm $34572
100 mm $50568
150 mm $85992
200 mm $129816
250 mm $172620
Uniform Wastewater Rate $217
($msup3)
235
$3660
$7404
$13536
$16956
$35436
$51828
$88140
$133056
$176940
262
$3756
$7584
$13872
$17376
$36324
$53124
$90348
$136380
$181368
915 261
$4111 $4219
$8302 $8518
$15185 $15580
$19020 $19516
$39761 $40797
$58151 $59666
$98898 $101474
$149286 $153175
$198531 $203703
$269 $287
Annual Increase () 241 235 287 878 948 291
Uniform Water Rate
($msup3) $170 $174 $179 $195 $213 $219
Annual Increase () 333 323 580 655 655 655
Uniform Rate
$224 $237
029
$3767
$7606
$13912
$17426
$36428
$53276
$90607
$136771
$181888
$253
City of Waterloo Water amp Sanitary Sewer Rate Design Study Final Report amp Water Financial Plan No 112-301
April 1 2016
732 Rate Structure Option 2 ndash 15 of Revenue from Service Charges
Under this option a Sanitary Sewer Service Charge is introduced and 15 of the respective
water and sanitary sewer system revenue requirements would be recovered from the
respective service charges in 2019 The existing rate structure and rates remain in effect until
2018 Note that the new service charges will result in a revenue shift away from the
consumption based revenue resulting in slight decrease in the Water Rate and the Sanitary
Sewer Rate All water and sanitary sewer service charges and rates are increased as needed
beyond 2019 such that the service charges provide approximately 15 of the annual revenues
for the remainder of the study period
This option is intended to improve revenue stability beginning in 2019 After 2019 both sets of
service charges and rates would increase as needed for full cost recovery As a result the base
Water Service Charge (ie for the 15mm meter) is projected to increase from $3756 in 2018 to
$9417 in 2019 (ie an increase of 1501) and 91 thereafter The Water Rate decreases
from $179 msup3 in 2018 to $176 msup3 in 2019 (-16) and 95 thereafter Similarly the Sanitary
Sewer Service Charge is estimated to be $11433 in 2019 but Sanitary Sewer Rate would
decrease to from $237 in 2018 to $215 msup3 in 2019 Table 7-5 and Table 7-6 show the projected
6-year rates for water and sanitary sewer respectively
33 DFA Infrastructure International Inc
Table 7-5 Projected Water Service Charges amp Rates - Option 2
Rate
Component 2016 2017 2018 2019 2020 2021
Annual Water
Service Charges
Annual Increase () 241 235 262 15072 915 261
15 mm $3576 $3660 $3756 $9417 $10279 $10546
25 mm $7224 $7404 $7584 $19014 $20754 $21295
40 mm $13200 $13536 $13872 $34779 $37962 $38951
50 mm $16548 $16956 $17376 $43565 $47551 $48790
75 mm $34572 $35436 $36324 $91070 $99403 $101993
100 mm $50568 $51828 $53124 $133191 $145378 $149165
150 mm $85992 $88140 $90348 $226518 $247244 $253686
200 mm $129816 $133056 $136380 $341928 $373214 $382938
250 mm $172620 $176940 $181368 $454720 $496327 $509258
Uniform Rate
Annual Increase () 241 235 287 -164 948 291
Uniform Water Rate
($msup3) $170 $174 $179 $176 $193 $198
Rate
Component 2016 2017 2018 2019 2020 2021
Annual Wastewater Service Charges
Annual Increase ()
15 mm -
25 mm -
40 mm -
50 mm -
75 mm -
100 mm -
150 mm -
200 mm -
250 mm -
333
Uniform
Wastewater Rate $217
($msup3)
-
-
-
-
-
-
-
-
-
-
-
-
-
-
-
-
-
-
Uniform Rate
323 580
$224 $237
$11433
$23085
$42224
$52890
$110565
$161702
$275007
$415122
$552059
-943
$215
623 624
$12145 $12902
$24523 $26052
$44855 $47653
$56186 $59689
$117454 $124779
$171777 $182489
$292141 $310360
$440986 $468487
$586456 $623028
655 655
$229 $244
Annual Increase ()
City of Waterloo Water amp Sanitary Sewer Rate Design Study Final Report amp Water Financial Plan No 112-301
April 1 2016
Table 7-6 Projected Sanitary Sewer Service Charges amp Rates ndash Option 2
34 DFA Infrastructure International Inc
City of Waterloo Water amp Sanitary Sewer Rate Design Study Final Report amp Water Financial Plan No 112-301
April 1 2016
733 Rate Structure Option 3 ndash Inclining Block Rate Structure
Under this option higher Water and Sanitary Sewer Rates would apply as consumption
increases The features of this structure include the following for both water and sanitary
sewer
bull A Bi-Monthly Service Charge that includes consumption of 14 msup3
This volume allows customers to meet their basic water use needs without
additional consumption (volumetric) charges and is referred to as basic
consumption The full charge applies whether or not the maximum of 14 msup3 is used
bull A First Consumption Block (Block 1) for bi-monthly consumption greater than 14 msup3
but not to exceed 34 msup3
This maximum volume represents the bi-monthly consumption for the average
residential customer The respective water and sanitary volumetric rates apply to
the volume consumed within Block 1 (ie in excess of 14 msup3 to a maximum of 34 msup3)
as measured by the customerrsquos water meter This is in addition to the Bi-Monthly
Service Charges
bull A Second Consumption Block (Block 2) for bi-monthly consumption greater than 34
msup3
The respective water and sanitary volumetric rates applicable to the volume
consumed within Block 2 (ie in excess of 34 msup3) as measured by the customerrsquos
water meter are 12 times the respective rates for the Second Consumption Block
The Bi-Monthly Service Charges also apply
The thresholds defining the volumetric blocks are based on reasonable use by the average
residential customer The Block 2 Rate being set using a factor of 12 times the Block 1 Rate is
intended to provide price point incentive for customers using water within the Block 2 to
conserve According to the AWWA Manual AWWAM1 Principles of Water Rates Fees and
Charges there are no set criteria for establishing the factor except that it must be significant in
order to have an effect on customer behaviour and trigger conservation Note that in some
jurisdictions this price premium is much higher eg City of Hamiltonrsquos block 2 rate is 2 times the
block 1 rate However for the purposes of this rate design study a lower factor of 12 is used to
assess what the impacts might be to the higher consumption customers under a more
moderate premium recognizing that a higher premium would result in even greater impacts
35 DFA Infrastructure International Inc
City of Waterloo Water amp Sanitary Sewer Rate Design Study Final Report amp Water Financial Plan No 112-301
April 1 2016
Inclining block rates are typically considered for use when the following applies
bull The billing system can handle different customer classes and has the capacity to
calculate the consumption within each block for each customer In the Cityrsquos case
adjustments to the existing billing system would be required to incorporate the
block billing
bull The water andor sanitary system is approaching its operating capacity and there is a
need to avoid or defer expansion Note that the issue of plant capacity falls under
the jurisdiction of the Region If inclining rates are to have an impact on deferring
plant capacity expansion then there would need to be a concerted effort by the
Region in collaboration with all the local area municipalities ie the Cityrsquos efforts on
its own would not be sufficient to defer plant capacity expansion
bull There is a desire to promote water conservation through pricing and
bull There is a willingness to incur the extra effort required to communicate and explain
the rationale behind the inclining block rates to customers and administer the
system
Although this structure provides greater portion of the annual revenue through the Service
Charges promotes conservation and facilitates user pay there are some major drawbacks
bull The customers that require high volumes of water as part of their normal business
would pay the higher Block 2 Rate but would not be able to reduce consumption to
benefit from the lower Block 1 Rate
bull There would be very little incentive for the low volume customers to conserve as
most of their consumption would fall within the volume included as part of the fixed
service charge
bull Greater revenue instability because higher revenues expected from the Block 2 may
not materialize as some customers conserve and reduce consumption within that
block or have all their consumption fall within Block 1 at the lower rate
bull The potential loss of higher consumption users that pay the premium Block 2 rate
would mean the loss revenues that would need to be recovered from the lower
consumption users This would require an increase to the Block 1 rate to ensure that
sufficient revenues are recovered Research suggests that reductions in consumption
can be 18 or greater (Ref 17) To address the reduction in consumption it is
assumed that a more conservative reduction of 10 would occur in the Block 2
volumes under Option 3
bull The complexity of administering the data collection and billing to align with the
inclining block as part of the ongoing operations This would increase the annual
operating cost The amount of this increase was not available at the time of
preparing this report
36 DFA Infrastructure International Inc
This option would become effective in 2019 As a result the base Water Service Charge (ie
for the 15mm meter) is projected to increase from $3756 in 2018 to $15841in 2019 (ie an
increase of 32175) However the Water Rate for Block 1 is projected to increase from
$179 in 2018 to $189 in 2019 ie an increase of 535 Both the service charges and rates
would increase by approximately 950 and 293 in 2020 and 2021 respectively but the
average increases needed for full cost recovery are projected to be approximately 3
annually over the study period Similarly the Sanitary Sewer Service Charge is estimated to
be $19822 in 2019 but Sanitary Sewer Rate for Block 1 would decrease by 294 Both the
service charges and rates would increase by 657 in 2020 and 2021 Table 7-7 and
Table 7-8 show the projected 6-year rates for water and sanitary sewer respectively
The annual service charges and rates and their respective increases for each year between 2021
and 2039 are shown in Appendix I
Table 7-7 Projected Water Service Charges amp Rates ndash Option 3
Rate
Component 2016 2017 2018 2019 2020 2021
Annual Increase
()
15 mm
25 mm
40 mm
50 mm
75 mm
100 mm
150 mm
200 mm
250 mm
Annual Increase
()
Block 1 ($msup3)
Block 2 ($msup3)
241
$3576
$7224
$13200
$16548
$34572
$50568
$85992
$129816
$172620
241
$170
Annual Water Service Charges
235 262 32175
$3660 $3756 $15841
$7404 $7584 $31985
$13536 $13872 $58505
$16956 $17376 $73283
$35436 $36324 $153196
$51828 $53124 $224050
$88140 $90348 $381042
$133056 $136380 $575182
$176940 $181368 $764919
Uniform Rate
235 287 535
$174 $179 $189
$226
950
$17345
$35023
$64062
$80244
$167747
$245330
$417233
$629812
$837569
950
$206
$248
293
$17853
$36049
$65938
$82593
$172659
$252515
$429452
$648256
$862098
293
$213
$255
City of Waterloo Water amp Sanitary Sewer Rate Design Study Final Report amp Water Financial Plan No 112-301
April 1 2016
37 DFA Infrastructure International Inc
Table 7-8 Projected Sanitary Sewer Service Charges amp Rates ndash Option 3
Rate
Component 2016 2017 2018 2019 2020 2021
Annual Sanitary Sewer Service Charges
Annual Increase
()
15 mm -
25 mm -
40 mm -
50 mm -
75 mm -
100 mm -
150 mm -
200 mm -
250 mm -
Uniform Rate
Annual Increase 333
()
Block 1 ($msup3) $217
Block 2 ($msup3)
-
-
-
-
-
-
-
-
-
323
$224
-
-
-
-
-
-
-
-
-
580
$237
$19322
$39015
$71363
$89389
$186865
$273291
$464787
$701594
$933030
-294
$230
$276
657
$20591
$41577
$76050
$95260
$199137
$291239
$495311
$747670
$994305
657
$245
$294
657
$21944
$44309
$81046
$101517
$212219
$310371
$527848
$796784
$1059622
657
$261
$313
City of Waterloo Water amp Sanitary Sewer Rate Design Study Final Report amp Water Financial Plan No 112-301
April 1 2016
734 Potential Customer Impacts
The potential cost impacts to customers are driven by the following
bull The 2016-2018 rates are not at the point at which they provide sustainable levels of
revenues to recover the full cost of service Therefore rate increases are required
beginning in 2019 to bring revenues up to sustainable levels regardless of the rate
structure option Council approves
bull Changes to the rate structure to obtain more revenues from the services charges to
improve revenue security As the base service charges increase there is a greater
impact to the low consumption user than the higher consumption user Therefore it is
recommended that staff continue to investigate the Region-wide affordability program
to help offset this impact to eligible users
bull The inclining rates of Option 3 which tends to increase costs to the high consumption
user compared the low consumption user The number of customers estimated to be in
each consumption block based on current billing and consumption data is shown in
38 DFA Infrastructure International Inc
City of Waterloo Water amp Sanitary Sewer Rate Design Study Final Report amp Water Financial Plan No 112-301
April 1 2016
Table 7-9 This indicates that approximately 31 of the customers would be exposed to
the higher Block 2 rate
Table 7-9 Number of Customers in Each Consumption Block (Option 3)
Customers
Block Number
Service Charge Only 5798 19
Service Charge + Block 1 15045 50
Service Charge + Block 1 + Block 2 9517 31
Total 30360 100
The potential customer impacts under each option are assessed by determining the annual
amount the average customer in each customer class would pay in 2019 for both water and
wastewater compared to 2018 The average customers are defined as follows
bull Small Residential - with a 15mm water meter and average annual
consumption of 120 msup3 per year
bull Average Residential - with a 15mm water meter and average
annual consumption of 204 msup3 per year
bull Residential Small Apartments - with a 25mm water meter and
average annual consumption of 1060 msup3 per year
bull Small Commercial amp Industrial - with a 40mm water meter and average annual consumption of 1215 msup3 per year
bull Large Commercial amp Industrial - with a 50 mm water meter and average annual consumption of 8227 msup3 per year
bull Largest Commercial amp Industrial - with a 50 mm water meter and
average annual consumption of 192000 msup3 per year
The average Large Commercial and Industrial customer is determined by the most common
meter size and the average consumption for that meter size Table 7-10 illustrates the 2019
annual cost to the average customer in each customer class and percentage increase compared
to 2018 under the three (3) rate structure options It is important to note that the change in
cost in 2019 is a one-time adjustment to reflect the change in rate structure and full cost
recovery Option 1 is projected to have a relatively consistent cost impact to all customer
classes ie 700-751 in 2019 Option 2 is projected to have a much greater cost impact on
the residential sector (2619 for residential small and 1347 for average residential
customers) than on the non-residential sector Large commercial and industrial customers
39 DFA Infrastructure International Inc
would benefit from reductions of 375 to 598 Option 3 is projected to result in reductions
to the small and average residential customers (approximately 641 and 364 respectively)
but would result in major increase to the other large customer classes ranging from
approximately 2087 to 3248 for the Residential Small Apartments and Non-Residential
Customers These are significant increases that would require more specific consultation with
the impacted customer classes prior to considering implementation Under all three (3) options
the annual increases beyond 2019 would be approximately 3-5 for all customer classes ie
after the 2019 increase and rate structure changes are made and become the new baseline
Table 7-10 Annual 2019 vs 2018 Costs to Customers
Description 2018 Option 1
(2019)
Option 2
(2019)
Option 3
(2019)
Small Residential - Single Family Homes
Meter Size - 15 mm (Equivalency Unit - 100)
Average Consumption - 120 msup3year
Annual Increase to Total Bill () 7 26 -6
Annual Increase to Total Bill ($) $3758 $14059 -$3443
Annual Bill ($) $53676 $57434 $67735 $50233
Average Residential - Single Family Homes
Meter Size - 15 mm (Equivalency Unit - 100)
Average Consumption - 204 msup3year
Annual Increase to Total Bill () 7 13 -4
Annual Increase to Total Bill ($) $6382 $11934 -$3223
Annual Bill ($) $88620 $95002 $100554 $85397
Residential - Small Apartments
Meter Size - 25 mm (Equivalency Unit - 202)
Average Consumption - 1060 msup3year
Annual Increase to Total Bill () 7 2 23
Annual Increase to Total Bill ($) $33125 $7706 $102687
Annual Bill ($) $448544 $481669 $456250 $551231
Small Commercial and Industrial
Meter Size - 40 mm (Equivalency Unit - 369)
Average Consumption - 1215 msup3year
Annual Increase to Total Bill () 7 6 32
City of Waterloo Water amp Sanitary Sewer Rate Design Study Final Report amp Water Financial Plan No 112-301
April 1 2016
40 DFA Infrastructure International Inc
Description 2018 Option 1
(2019)
Option 2
(2019)
Option 3
(2019)
Annual Increase to Total Bill ($) $37983 $32403 $168648
Annual Bill ($) $519312 $557295 $551715 $687960
Large Commercial and Industrial
Meter Size - 50 mm (Equivalency Unit - 462)
Average Consumption - 8227 msup3year
Annual Increase to Total Bill () 7 -4 23
Annual Increase to Total Bill ($) $256961 -$128984 $803285
Annual Bill ($) $3439672 $3696634 $3310689 $4242957
Largest Commercial and Industrial
Meter Size - 50 mm (Equivalency Unit - 462)
Average Consumption - 192000 msup3year
Annual Increase to Total Bill () 8 -6 21
Annual Increase to Total Bill ($) $5996030 -$4776829 $16668939
Annual Bill ($) $79889376 $85885406 $75112547 $96558315
Table 7-11 summarizes the customer impacts under each option and compares the potential
impacts under Options 2 and 3 to Option 1 ie the base option
Table 7-11 Annual 2019 vs 2018 Costs to Customers
Customer
Type Option 1
Current Rate Structure
Customer Impacts (2019 Compared to 2018)
Option 2
15 Revenue from Service
Charges
Option 3
Inclining Block
bull Annual cost would bull Annual cost would increase by
bull Annual cost would decrease by
Small increase by $3758 $14059 (2619) or $1172 $3443 (641) or $287 per
Residential (700) or $313 per per month in 2019 month in 2019
Single Family month in 2019 bull In 2019 customers would pay bull In 2019 customers would pay
Homes bull Rate increases beyond approximately $858 more per approximately $600 less per
120 msup3 per 2019 are an average of month compared to Option 1 month compared to Option 1
year 3 per year bull Rate increases beyond 2019 bull Rate increases beyond 2019 are
are an average of 3 per year an average of 3 per year
Average bull Annual cost would bull Annual cost would increase by bull Annual cost would decrease by
Residential increase by $6382 $11934 (1347) or $995 per $3223 (364) or $269 per
Single Family (720) or $532 per month in 2019 month in 2019
Homes month in 2019 bull In 2019 customers would pay bull In 2019 customers would pay
204 msup3 per bull Rate increases beyond approximately $463 more per approximately $800 less per
year 2019 are an average of month compared to Option 1 month compared to Option 1
City of Waterloo Water amp Sanitary Sewer Rate Design Study Final Report amp Water Financial Plan No 112-301
April 1 2016
41 DFA Infrastructure International Inc
Customer Impacts (2019 Compared to 2018)
Customer
Type Option 1
Current Rate Structure
Option 2
15 Revenue from Service
Charges
Option 3
Inclining Block
3 per year bull Rate increases beyond 2019 bull Rate increases beyond 2019 are
are an average of 3 per year an average of 3 per year
bull Annual cost would bull Annual cost would increase by
increase by $33125 $7706 (172) or $642 per Residential
(738) or $2760 per month in 2019 Small
month in 2019 bull In 2019 customers would pay Apts
bull Rate increases beyond approximately $2118 less per 1060 msup3 per
2019 are an average of month compared to Option 1 year
3 per year bull Rate increases beyond 2019
are an average of 3 per year
bull Annual cost would bull Annual cost would increase by
increase by $37983 $32403 (624) or $2700 per Small
(731) or $3165 per month in 2019 Commercial amp
month in 2019 bull In 2019 customers would pay Industrial
bull Rate increases beyond approximately $465 less per 1215 msup3 per
2019 are an average of month compared to Option 1 year
3 per year bull Increases beyond 2019
average of 3 per year
bull Annual cost would bull Annual cost would decrease
increase by $256961 by $128984 (375) or
Large (747) or $21413 per $10749 per month in 2019
Commercial amp month in 2019 bull In 2019 customers would pay
Industrial bull Rate increases beyond approximately $32162 less
8227 msup3 per 2019 are an average of per month compared to year 3 per year Option 1
bull Rate increases beyond 2019
are an average of 3 per year
bull Annual cost would bull Annual cost would decrease
increase by $5996030 by $4776829 (598) or
Largest (751) or $499669 per $398069per month in 2019
Commercial amp month in 2019 bull In 2019 customers would pay
Industrial bull Rate increases beyond approximately $897738 less
192000 msup3 per 2019 are an average of per month compared to
year 3 per year Option 1
bull Rate increases beyond 2019
are an average of 3 per year
bull Annual cost would increase by
$102687 (2289) or $8557
per month in 2019
bull In 2019 customers would pay
approximately $5797 more per
month compared to Option 1
bull Rate increases beyond 2019 are
an average of 3 per year
bull Annual cost would increase by
$168648 (3248) or $14054
per month in 2019
bull In 2019 customers would pay
approximately $10889 more
per month compared to Option
1
bull Increases beyond 2019 are an
average of 3 per year
bull Annual cost would increase by
$803285 (2335) or $66940
per month in 2019
bull In 2019 customers would pay
approximately $45527 more
per month compared to Option
1
bull Rate increases beyond 2019 are
an average of 3 per year
bull Annual cost would increase by
$16668939 (2087) or
$1389078 per month in 2019
bull In 2019 customers would pay
approximately $889409 more
per month compared to Option
1
bull Rate increases beyond 2019 are
an average of 3 per year
City of Waterloo Water amp Sanitary Sewer Rate Design Study Final Report amp Water Financial Plan No 112-301
April 1 2016
735 Options Analysis amp Preferred Option
A qualitative assessment of how well each option aligns with the Guiding Principles in Section
31 is presented in this Section Table 7-12 shows the results using full or partial circles Full
42 DFA Infrastructure International Inc
alignment with the respective guiding principle is depicted by a full circle some alignment by a
partial circle and no alignment by no circle
Table 7-12 Qualitative Analysis of Rate Options
Guiding Principles Option 1 Option 2 Option 3
Full Cost Recovery
Revenue Stability
User Pay
Fairness and Equity
Uniform Rate Structure
Water Conservation
Capital Financing
Ease of Administration
Affordability
City of Waterloo Water amp Sanitary Sewer Rate Design Study Final Report amp Water Financial Plan No 112-301
April 1 2016
Full Cost Recovery
bull All options are designed to recover the full costs of managing the water and sanitary
sewer systems over the study period
Revenue Stability
bull None of the three (3) options have fixed charge structures that fully align with the cost
structures for water and sanitary sewer but they all provide a portion of revenues
through the fixed charges
bull Option 1 offers the least revenue stability as only 6 of water revenues and 0 of the
sanitary sewer revenues would be guaranteed This is especially important given that
the majority of costs to manage the water and sanitary sewer systems are for the most
part fixed
bull Under Option 3 a larger portion of revenue (25 -27) would be recovered from the
service charges However there is added revenue instability because the higher
revenues expected from Block 2 at the higher rate may not materialize as some
43 DFA Infrastructure International Inc
City of Waterloo Water amp Sanitary Sewer Rate Design Study Final Report amp Water Financial Plan No 112-301
April 1 2016
customers conserve and reduce consumption within that block or have all their
consumption fall within Block 1 at the lower rate This would result in a reduction of
total revenue notwithstanding the portion that is guaranteed from the Service Charges
There is also the risk of losing one or more high volume users and the revenues
generated from those customers The revenue loss would have to be recovered from
the low volume users
bull Option 2offers the best revenue stability of the three (3) options with 15 from the
fixed charges and does not have the added revenue risks associated with Option 3
regarding Block 2 revenues
User Pay
bull The concept of user pay is based on the philosophy that those who use more water
should pay more Under all three (3) options customers would pay more if their
consumption increases as they all have a consumption rate component However
Option 3 aligns the best with this principle due to the higher rate charged for Block 2
Fairness and Reasonableness
bull All options promote fairness and equity as the service charges plus a consumption
charge is a reasonably fair approach to cost recovery to both the City as the
owneroperator and the customers This is the structure that is most common across
Ontario
bull Each class of customers is exposed to the same ratios in the calculation of their service
charges regardless of the rate structure option
bull All customers would pay the same consumption rate that applies under each option ie
the customers are exposed to the same consumption rate regardless of customer class
However customers that consume high volumes because of their business practices
may not be able to realistically reduce their consumption to benefit from the lower
Block 1 rate under Option 3 This may be considered to be unfair to these customers
because they may be unable to reduce their consumption The cost increase to the non-
residential sector (estimated to be 31 of the customers) is expected to be in the range
of 20 to 32 This is significant even at a relatively low price premium of 12 times the
Block 1 rate and could have adverse effects on attracting or retaining business within
the City
bull Under Option 1 from a high level equity perspective the residential and non-residential
sectors would pay their fair share Residential customers consume approximately 55
of the water and contribute 55 of the annual revenue while the ICI consumers
account for the remaining 45 of consumption and revenues This is because the
amount paid varies almost directly with consumption due to the low fixed charges
Under Option 2 the residential sector would pay approximately 5 more than they
44 DFA Infrastructure International Inc
City of Waterloo Water amp Sanitary Sewer Rate Design Study Final Report amp Water Financial Plan No 112-301
April 1 2016
consume while the non-residential sector would pay 5 less The reverse is true under
Option 3 where the non-residential sector would pay approximately 5 more than they
consume Therefore Option 1 is a fair and reasonable rate structure
Uniform Rate Structure
bull Options 1 and 2 have a uniform rate whereas Option 3 has inclining block rates
However Option 3 partially meets this principle because it addresses Councilrsquos request
to investigate an inclining block option
Water Conservation
bull All options promote water conservation as a significant proportion of the overall
revenue would be derived from consumption Option 3 provides the greatest incentive
to reduce consumption due to the inclining block However Options 1 and 2 offer a
reasonable incentive for customers to reduce consumption with 85 to 94 of
revenues from consumption for Options 2and 1 respectively
Capital Financing
bull All options are based on a combination of reserve and debt financing for capital projects
based on the feedback received from Council via the workshop Debt financing was
incorporated to assist with addressing the water capital backlog over the next 20 years
Easy to of Administration
bull Option 1 is the easiest to administer because it is the existing rate structure Option 2
will require some modifications to establish a service charge for sanitary sewer Option
3 will have the greatest impact on administration due to the complexity of managing the
information and billing requirements and the added cost to implement and administer
Affordability
bull Eligible customers stand to benefit from the affordability program when it is established
regardless of the rate structure option
Summary
Based on a qualitative review all options would provide the level of funding to be fully
sustainable over the long-term Although Option 3 is best for water conservation and user pay
it has significant disadvantages including
- Revenue uncertainty resulting from conservation due to the higher Block 2 rate
45 DFA Infrastructure International Inc
City of Waterloo Water amp Sanitary Sewer Rate Design Study Final Report amp Water Financial Plan No 112-301
April 1 2016
- Potentially high impacts (20 to 32 increases) to the non-residential customers
that may affect t he attraction and r etention of b usiness These levels of
increases are significant a nd would r equire further dialogue with t he business
community and volume data analysis prior to confirming the thresholds for each
block and t he factor to be used f or setting the Block 2 rate and
- The risk of shifting a much larger portion o f costs to the residential sector should
business customers relocate or discontinue operations
Option 2 offers the most predictable revenues and would ensure that at least 15 of the
annual water revenues would be guaranteed while providing sufficient incentive for customers
to conserve Therefore Option 2 would be best strictly from a revenue stability perspective
Option 1 (existing rate structure) seems to be the best based on fairness and reasonableness
Its major disadvantage is the low level of revenue stability as only a marginal amount of the
annual revenue is collected via fixed fees This lack of revenue stability would be offset to some
extent by the introduction of the rate stabilization reserves Therefore Option 1 could be
remain a viable option moving forward should Council not wish to proceed with Option 2 due
to the relatively large impact to the small and average residential customers in 2019 compared
to 2018
46 DFA Infrastructure International Inc
City of Waterloo Water amp Sanitary Sewer Rate Design Study Final Report amp Water Financial Plan No 112-301
April 1 2016
8 OReg 45307 Water System Financial Plan No 112-301
Regulation 18807 under the Safe Drinking Water Act requires Ontario municipalities to apply
for and obtain Drinking Water System Licences as part of their overall DWQMS One of the
requirements of holding a valid drinking water licence is preparing and submitting to the
Province an updated financial plan in accordance with OReg 45307 The financial plan must
include financial statements on the following
bull The proposed or projected financial position of the drinking water systems
bull The proposed or projected gross cash receipts and gross cash payments
bull The proposed or projected financial operations of the drinking water system and
bull Details on the extent to which the above information applies to the replacement of
lead service pipes if applicable
Appendix H lists each requirement of the regulation and references the respective financial
statements and other relevant information required under each regulatory requirement The
financial plan must apply to a period of at least six (6) years with the first year being the year
the existing license expires In the Cityrsquos case an updated Water System Financial Plan No112-
301 is required for the period 2016 to 2021 This plan is based on the results of the rate study
Upon Councilrsquos approval the financial plan would be made available to the public at no charge
and posted on the Cityrsquos website It will also be submitted to the Province as part of the Cityrsquos
drinking water license renewal application The license renewal application deadline is June 1
2016
81 Tangible Capital Assets (TCA) Analysis
The results of the rate study contained in this report are used as the basis for preparing the
water system financial plan The Cityrsquos Tangible Capital Asset inventories were also used in the
preparation of the water system financial plan The amortization of the tangible capital assets is
shown as a ldquonon-cashrdquo annual cost that reflects the annual ldquouserdquo of assets until the end of their
respective useful lives Allowances are made to finance the replacement and or rehabilitation
of the existing assets once they ldquoexpirerdquo and can no longer play a role in providing the required
drinking water service to customers It should be noted however that since amortization is
based on the original (historical) cost at the time the asset was placed in service it does not
account for inflation since the year of installation Therefore basing asset replacement costs on
amortization alone is not sufficient to cover the future replacement needs
The TCA projections contained in the Cityrsquos water financial plan are based on the following
assumptions
47 DFA Infrastructure International Inc
City of Waterloo Water amp Sanitary Sewer Rate Design Study Final Report amp Water Financial Plan No 112-301
April 1 2016
bull Amortization of existing assets is based on the Cityrsquos Tangible Capital Assets Policies and
Procedures Amortization of new infrastructure investments is based on straight line
depreciation with full year depreciation charged in the year of acquisition
bull Historical costs life expectancy and remaining useful life are as identified in the TCA
data provided by the City
bull Fully depreciated assets continue to be used in service ie no asset removals and
bull New assets to be acquired are based on the capital forecast presented The forecast
includes projects in the Cityrsquos Capital Budget Forecast and asset replacement projections
based on the Cityrsquos Asset Management Plan
Asset Value
The water system is comprised of the following capital asset classes
bull Water Mains
bull Hydrants and
bull Valves
Table 8-1 shows the current capital asset value based on historical cost and accumulated
amortization to 2015 This is reflected as the net book value (NBV) ie the ldquoaccountingrdquo value
and indicates that the water system as a whole is approximately 30 depreciated or has
approximately 70 remaining life based on the TCA data This suggests that the water system
assets are relatively new
Table 8-1 Asset Amortization and 2015 Net Book Value (NBV)
2015 Water Asset Details
Historical Cost $93412072 100
Accumulated Amortization $27992677 30
Net Book Value (2015) $65419394 70
82 Financial Statements
This financial plan involves the review analysis and assessment of financial information
contained in the rate study including costs revenues debt cash transactions and Tangible
Capital Assets (TCA) to prepare the following three (3) financial statements covering the period
2016 - 2021 as required under OReg 45307
bull Statement of Financial Position
bull Statement of Operations and
bull Statement of Cash Flow
48 DFA Infrastructure International Inc
City of Waterloo Water amp Sanitary Sewer Rate Design Study Final Report amp Water Financial Plan No 112-301
April 1 2016
821 Statement of Financial Position
The Statement of Financial Position is presented in Table 8-2 This statement summarizes the
Cityrsquos water-related financial and non-financial assets ie Tangible Capital Assets (TCA) and
liabilities and provides the net financial asset (or net debt) position and accumulated surplus
related to managing the water system The financial assets are primarily cash balances in the
water reserves and reserve funds Liabilities consist of development charge reserve fund
balances (ie deferred revenues) and long-term debt The non-financial assets (TCA) include the
Cityrsquos water infrastructure The historical costs are amortized over the asset life to arrive at the
net book value each year from 2016 to 2021 New assets are added in the years acquired
developed or built Contributed assets are primarily new infrastructure and facilities that would
be transferred to the Cityrsquos ownership and control by developers as they are completed
However this is assumed to be zero It is also assumed that other non-financial assets such as
inventory and prepaid expenses are zero
Contained within the Statement of Financial Position are important indicators the first being
net financial assets (or net debt) which is defined as the difference between financial assets and
liabilities This indicator provides a measure of the water systems future revenue
requirement Another important indicator in the Statement of Financial Position is the
accumulated surplus This indicator provides a measure of the resources available to the City
for managing its water system The accumulated surplus is projected to increase from
approximately $726 million in 2016 to approximately $863 million by 2021 The accumulated
surplus consists of the net financial assets that are available to fund future operations plus the
non-financial assets that are made up of net TCA balance representing past investments in
water infrastructure It is important to note that the non-financial assets (TCA) cannot be
readily monetized without affecting the delivery of water operations
Table 8-2 indicates that in 2016 the Citys water system will be in a net financial asset position
of $42 million This will be reduced to a net financial asset position of $25 million by 2021 The
net financial asset position indicates that financial resources will be available to fund future
operations The reduced net financial assets is due to a combination of a increase in the cash
position that is more than offset by an increase in liabilities with increases in deferred revenue
balances and the introduction of debt in 2019
The next important indicator contained in the Statement of Financial Position is the net book
value of TCA Another important indicator in the Statement of Financial Position is the
accumulated surplus This indicator provides a measure of the resources available to the City
for managing its water system The accumulated surplus is projected to increase from
approximately $726 million in 2016 to approximately $863 million by 2021 The accumulated
surplus consists of the net financial assets that are available to fund future operations plus the
non-financial assets that are made up of net TCA balance representing past investments in
water infrastructure It is important to note that the non-financial assets (TCA) cannot be
readily monetized without affecting the delivery of water operations
49 DFA Infrastructure International Inc
City of Waterloo Water amp Sanitary Sewer Rate Design Study Final Report amp Water Financial Plan No 112-301
April 1 2016
The next important indicator contained in the Statement of Financial Position is the net book
value of TCA Another important indicator in the Statement of Financial Position is the
accumulated surplus This indicator provides a measure of the resources available to the City
for managing its water system The accumulated surplus is projected to increase from
approximately $726 million in 2016 to approximately $863 million by 2021 The accumulated
surplus consists of the net financial assets that are available to fund future operations plus the
non-financial assets that are made up of net TCA balance representing past investments in
water infrastructure It is important to note that the non-financial assets (TCA) cannot be
readily monetized without affecting the delivery of water operations
Table 8-2 shows that net TCA are expected to grow by $154 million over the forecast period or
from $684 million in 2016 to $838 million 2021 This indicates that the City has plans to invest
in significant tangible capital assets in excess of the consumption of existing assets Further a
consumption ratio consisting of the accumulated amortization of the Citys TCA as a percent of
historical cost ratio highlights the aged condition of the assets and their potential replacement
needs The Citys Water Asset Consumption Ratio actually declines over the forecast period
from 30 to 28 as newly acquired or constructed assets would more than offset the
consumption of existing assets
Another important indicator in the Statement of Financial Position is the accumulated surplus
This indicator provides a measure of the resources available to the City for managing its water
system The accumulated surplus is projected to increase from approximately $726 million in
2016 to approximately $863 million by 2021 The accumulated surplus consists of the net
financial assets that are available to fund future operations plus the non-financial assets that
are made up of net TCA balance representing past investments in water infrastructure It is
important to note that the non-financial assets (TCA) cannot be readily monetized without
affecting the delivery of water operations
50 DFA Infrastructure International Inc
City of Waterloo Water amp Sanitary Sewer Rate Design Study Final Report amp Water Financial Plan No 112-301
April 1 2016
Table 8-2 Statement of Financial Position
Statement of Financial Position 2016 2017 2018 2019 2020 2021
Financial Assets
CashReceivables and Investment $6767426 $6080033 $6563808 $7004435 $6711995 $7206337
Total Financial Assets $6767426 $6080033 $6563808 $7004435 $6711995 $7206337
Financial Liabilities
Accounts Payable amp Deferred Revenue $2068633 $1525462 $1732356 $2364790 $2872351 $3366692
Long-term Liabilities $534197 $481614 $427454 $858621 $1169636 $1380142
Total Financial Liabilities $2602831 $2007076 $2159810 $3223411 $4041987 $4746835
Net Financial Assets (Net Debt) $4164595 $4072958 $4403999 $3781024 $2670009 $2459502
Non-Financial Assests
Tangible Capital Assets $97235501 $101396201 $104426305 $108247701 $112142203 $116085079
Accumulated Amortization ($28800415) ($29534931) ($30410031) ($31003111) ($31622734) ($32265603)
Total Non-Financial Assets $68435086 $71861270 $74016275 $77244590 $80519469 $83819476
Accumulated Surplus $72599681 $75934228 $78420273 $81025614 $83189478 $86278979
Financial Indicators 2016 2017 2018 2019 2020 2021
Increase (Decrease) in Net Financial Assets $392962 ($91637) $331041 ($622974) ($1111016) ($210506)
Increase (Decrease) in Net Tangible Capital Assets $3015692 $3426184 $2155004 $3228316 $3274879 $3300007
Increase (Decrease) in Accumulated Surplus $3408654 $3334547 $2486045 $2605341 $2163864 $3089501
Water Asset Consumption Ratio 30 29 29 29 28 28
822 Statement of Operations
The Statement of Operations is presented in Table 8-3 It summarizes the annual revenues and
expenses associated with managing the Cityrsquos water system It provides a report on the
transactions and events that have an influence on the accumulated surplus The main revenue
items included are
bull Revenues from Water Rates and Charges
bull Earned Revenues (earned development charges) and
bull Other Revenues (miscellaneous fees and charges recoveries etc)
The main expense items are
bull The annual cost of operating and maintaining the water system including the cost of
water purchases from the Region and
bull Amortization expenses on existing and added TCA
The operating surplus (or deficit) is an important indicator contained in the Statement of
Operations An operating surplus (deficit) measures whether operating revenues generated in a
year were sufficient to cover operating expenses incurred in that year It is important to note
that an annual surplus is necessary to ensure funds will be available to address non-expense
items such as TCA acquisitions over and above amortization expenses reservereserve fund
contributions for asset replacement and rate stabilization and repayment of outstanding debt
principal A ratio of operating surplus to total revenue is shown in Table 8-3 to reflect the
percent of total revenue that can be allocated to funding the non-expense items noted above
51 DFA Infrastructure International Inc
City of Waterloo Water amp Sanitary Sewer Rate Design Study Final Report amp Water Financial Plan No 112-301
April 1 2016
This ratio decreases from 15 in 2016 to 12 in 2021 The higher the ratio the greater
proportion of operating revenues that are available for paying down debt purchasing capital
assets and setting aside in reserve for future use Cash generated from operations is discussed
in the Statement of Cash Flows section
Table 8-3 Statement of Operations
Statement of Operations 2016 2017 2018 2019 2020 2021
Water Revenue
User Revenue $19471007 $20143317 $20623089 $21822413 $23024080 $24610398
Earned Revenue $1763719 $1649661 $859546 $490371 $497236 $504197
Other Revenue $1437931 $1445213 $1452652 $1463926 $475536 $487492
Total Revenues $22672657 $23238191 $22935287 $23776710 $23996852 $25602087
Water Expenses
Gross $5466741 $5569487 $5679838 $5902122 $6034310 $6171363
Water Purchased from Region $12404140 $12875909 $13262328 $13703114 $14157651 $14635550
Operating Expenses $17870881 $18445396 $18942166 $19605236 $20191961 $20806913
Interest on Debt $0 $0 $0 $0 $25759 $35089
Amortization 1393123 1458248 1507076 1566133 1615269 1670585
Total Expenses $19264004 $19903645 $20449242 $21171369 $21832989 $22512586
Annual Surplus(Deficit) $3408654 $3334547 $2486045 $2605341 $2163864 $3089501
Accumulated Surplus(Deficit) Beginning of Year $69191027 $72599681 $75934228 $78420273 $81025614 $83189478
Accumulated Surplus (Deficit) End of Year $72599681 $75934228 $78420273 $81025614 $83189478 $86278978
Financial Indicators 2016 2017 2018 2019 2020 2021
Increase (Decrease) in Total Revenues ($580510) $565534 ($302904) $841422 $220142 $1605235
Increase (Decrease) in Total Expenses $879750 $639641 $545597 $722127 $661620 $679598
Increase (Decrease) in Annual Surplus ($1460260) ($74107) ($848501) $119296 ($441478) $925637
Operating Surplus Ratio 15 14 11 11 9 12
823 Statement of Cash Flow
The Statement of Cash Flow is presented in Table 8-4 This statement summarizes the main
cash inflows and outflows related to the water system in four (4) main areas - operating
capital investing and financing and shows the annual changes in cash
The operating cash transactions begin with the surplus or deficit identified in the Statement of
Operations This figure is adjusted to add or subtract non-cash items that were included as
revenues or expenses (eg amortization expenses) It is assumed that there are no ldquoinvesting
activitiesrdquo over the period The capital section indicates the amounts to be spent to acquire
capital assets (TCA) or to be received from the sale of assets In the Cityrsquos case it is assumed
that there are no assets to be sold to generate cash The financing section identifies the funds
to be received from development charges receipts ProvincialFederal Grants and proceeds
from the issuance of debenture as cash inflows and the portion of debt repaid as cash
outflows No grant funding is projected over the forecast period
Table 8-4 indicates that cash is generated from operations which is used in funding the
acquisition of TCA and towards building internal reserves The Citys cash position is projected
to increase over the forecast period from $67 million in 2016 to $72 million in 2021
52 DFA Infrastructure International Inc
City of Waterloo Water amp Sanitary Sewer Rate Design Study Final Report amp Water Financial Plan No 112-301
April 1 2016
Table 8-4 Statement of Cash Flow
Statement of Cashflows 2016 2017 2018 2019 2020 2021
Cash Provided by
Operating Activities
Annual Surplus(Deficit) $3408654 $3334547 $2486045 $2605341 $2163864 $3089501
Non-Cash Items
Amortization $1393123 $1458248 $1507076 $1566133 $1615269 $1670585
Earned Revenue ($1763719) ($1649661) ($859546) ($490371) ($497236) ($504197)
Net Change in Cash Provided by Operating Activities $3038057 $3143134 $3133575 $3681103 $3281896 $4255888
Capital Activities
Purchase of TCA ($4408815) ($4884432) ($3662081) ($4794449) ($4890148) ($4970592)
Net Change in Cash Used in Capital Activities ($4408815) ($4884432) ($3662081) ($4794449) ($4890148) ($4970592)
Financing Activities
DC Collections $1088065 $1106489 $1066441 $1122805 $1004797 $998539
ProvincialFederal Grants $0 $0 $0 $0 $0 $0
Proceeds From Long-Term Debt $0 $0 $0 $486953 $410951 $349288
Repayment of Long-Term Debt ($51052) ($52583) ($54161) ($55785) ($99936) ($138782)
Net Change in Cash Used in Financing Activities $1037013 $1053906 $1012280 $1553972 $1315812 $1209045
Net Change in Cash and Cash Equivalents ($333744) ($687392) $483775 $440627 ($292440) $494342
Cash and Cash Equivalents Beginning of the Year $7101170 $6767426 $6080033 $6563808 $7004435 $6711995
Cash and Cash Equivalents End of the Year $6767426 $6080033 $6563808 $7004435 $6711995 $7206337
824 Lead Service Pipe Removal
The financial plan is also required to detail the extent to which the information described above
relates directly to the replacement of lead service pipes
The City of Waterloo 2016-2025 Capital Budget outlines the proposed rehabilitation and
reconstruction projects for the next 10 years Lead services are replaced as part of watermain
rehabilitation projects andor road reconstruction projects when undertaken Although not all
the streets contain lead services all of the water services to the property line are replaced for
every rehabilitation and reconstruction project
Lead services are also replaced individually when they are found in the field or if requested by
the owner if the full rehabilitation project and reconstruction project has not been identified in
the capital forecast and if the new service can be connected to the customer side
53 DFA Infrastructure International Inc
City of Waterloo Water amp Sanitary Sewer Rate Design Study Final Report amp Water Financial Plan No 112-301
April 1 2016
9 Sanitary Sewer System Financial Plan
Preparing a Sanitary Sewer System Financial Plan is not mandatory but has become a municipal
best practice over the past few years It is typically prepared in accordance with the
requirements of OReg 45307 which applies to water systems
This financial plan involves the review analysis and assessment of financial information
contained in the rate study including costs revenues debt cash transactions and Tangible
Capital Assets (TCA) to prepare the following three (3) financial statements covering the period
2016 to 2021 as required under OReg 45307
bull Statement of Financial Position
bull Statement of Operations and
bull Statement of Cash Flow
Appendix H lists each requirement of the regulation and references the respective financial
statements and other items that contain relevant information required under each item The
financial plan applies to a period of (6) six years from 2016 to 2021 to be consistent with the
period covered by the Water System Financial Plan It is anticipated that the financial plan
would be made available to the public at no charge on the Cityrsquos website following final
approval of the rate study and financial plan by Council
91 Tangible Capital Assets (TCA) Analysis
The results of the rate study contained in this report are used as the basis for preparing the
wastewater system financial plan The Cityrsquos Asset Inventories were also used in the
preparation of the wastewater system financial plan The amortization of the tangible capital
assets is shown as a ldquonon-cashrdquo annual cost that reflects the annual ldquouserdquo of assets until the
end of their respective useful lives Allowances are made to finance the replacement and or
rehabilitation of the existing assets once they ldquoexpirerdquo and can no longer play a role in
providing the required wastewater service to customers However it should be noted that since
amortization is based on the original (historical) cost at the time the asset was placed in service
it does not account for inflation since the year of installation Therefore basing asset
replacement costs on amortization alone is not sufficient to cover the future replacement
needs
The TCA projections contained in the Cityrsquos wastewater financial plan are based on the
following assumptions
bull Amortization of existing assets is based on the Cityrsquos Tangible Capital Assets policies and
procedures Amortization of new infrastructure investments is based on straight line
depreciation with full year depreciation charged in the year of acquisition
54 DFA Infrastructure International Inc
City of Waterloo Water amp Sanitary Sewer Rate Design Study Final Report amp Water Financial Plan No 112-301
April 1 2016
bull Historical costs life expectancy and remaining useful life as per the TCA data provided
by the City
bull Fully depreciated assets continue to be used in service ie no asset removals and
bull New assets to be acquired are based on the capital forecast The forecast includes
projects in the Cityrsquos Capital Budget Forecast and asset replacement projections based
on the Cityrsquos Asset Management Plan
Asset Value
The wastewater system is comprised of the following capital asset classes
bull Sanitary Sewer Gravity Mains
bull Sanitary Sewer Forcemains
bull Manholes and
bull Pumping Stations
Table 9-1 shows the current capital asset value based on historical cost and accumulated
amortization to 2015 This is reflected as the net book value (NBV) ie the ldquoaccountingrdquo value
and indicates that the wastewater system as a whole is approximately 29 depreciated or has
approximately 71 remaining life based on the TCA data This suggests that the wastewater
system assets are relatively new
Table 9-1 Asset Amortization and 2015 Net Book Value (NBV)
2015 Sanitary Sewer Asset Details
Historical Cost $135873861 29
Accumulated Amortization $39335177 71
Net Book Value (2015) $96538684 100
92 Statement of Financial Position
The Statement of Financial Position is presented in Table 9-2 This statement summarizes the
Cityrsquos sanitary sewer related financial and non-financial assets (Tangible Capital Assets ndash TCA)
and liabilities and provides the net financial asset (net debt) position and accumulated surplus
related to managing the sanitary sewer system The financial assets are primarily cash balances
in the sanitary sewer reserves and reserve funds Liabilities consist of development charge
reserve fund balances (ie deferred revenues) The City does not have any outstanding long-
term debt for the Cityrsquos sanitary sewer systemThe non-financial assets (TCA) include the Cityrsquos
sanitary sewer infrastructure The historical costs are amortized over the asset life to arrive at
the net book value each year from 2016 to 2021 New assets are added in the years acquired
developed or built Contributed assets are primarily new infrastructure that would be
transferred to the Cityrsquos ownership and control by developers as they are completed However
55 DFA Infrastructure International Inc
City of Waterloo Water amp Sanitary Sewer Rate Design Study Final Report amp Water Financial Plan No 112-301
April 1 2016
asset (net debt) position and accumulated surplus related to managing the sanitary sewer
system The financial assets are primarily cash balances in the sanitary sewer reserves and
reserve funds Liabilities consist of development charge reserve fund balances (ie deferred
revenues) The City does not have any outstanding long-term debt for the Cityrsquos sanitary sewer
systemThe non-financial assets (TCA) include the Cityrsquos sanitary sewer infrastructure The
historical costs are amortized over the asset life to arrive at the net book value each year from
2016 to 2021 New assets are added in the years acquired developed or built Contributed
assets are primarily new infrastructure that would be transferred to the Cityrsquos ownership and
control by developers as they are completed However this is assumed to be zero It is also
assumed that other non-financial assets such as inventory and prepaid expenses are zero
Contained within the Statement of Financial Position are important indicators the first being
net financial assets (or net debt) which is defined as the difference between financial assets and
liabilities This indicator provides a measure of the sanitary sewer systems future revenue
requirement Another important indicator in the Statement of Financial Position is the
accumulated surplus This indicator provides measure of the resources available to the City for
managing its system The accumulated surplus is projected to increase from approximately
$1139 million in 2016 to approximately $1265 million by 2021 The accumulated surplus is
made up of the net TCA balance representing past investments in the sanitary sewer
infrastructure and net financial assets It is important to note that the non-financial assets (TCA)
cannot be readily monetized without affecting the sanitary sewer operations
Table 9-2 indicates that in 2016 the Citys sanitary sewer system will be in a net financial asset
position in the amount of $128 million This will be increased to a net financial asset position of
$141 million by 2021 The net financial asset position indicates that financial resources will be
available to fund future operations The increased net financial assets position is due to a
combination of an increase in the cash position that is offset by increases in liabilities mainly
through an increase in a deferred revenue balance The next important indicator contained in
the Statement of Financial Position is the net book value of TCA Another important indicator in
the Statement of Financial Position is the accumulated surplus This indicator provides measure
of the resources available to the City for managing its system The accumulated surplus is
projected to increase from approximately $1139 million in 2016 to approximately $1265
million by 2021 The accumulated surplus is made up of the net TCA balance representing past
investments in the sanitary sewer infrastructure and net financial assets It is important to note
that the non-financial assets (TCA) cannot be readily monetized without affecting the sanitary
sewer operations
Table 9-2 shows that net TCA are expected to grow by $113 million over the forecast period or
from $1010 million in 2016 to $1123 million 2021 This indicates that the City has plans to
invest significant dollars in tangible capital assets in excess of the consumption of existing
assets Further a consumption ratio consisting of the accumulated amortization of the Citys
TCA as a percent of historical cost ratio highlights the aged condition of the assets and their
potential replacement needs The Citys Sanitary Sewer Asset Consumption Ratio remains fairly
56 DFA Infrastructure International Inc
City of Waterloo Water amp Sanitary Sewer Rate Design Study Final Report amp Water Financial Plan No 112-301
April 1 2016
stable over the forecast period ranging from 29 - 30 as newly acquired or constructed
assets essentially offset the consumption of existing assets
Another important indicator in the Statement of Financial Position is the accumulated surplus
This indicator provides measure of the resources available to the City for managing its system
The accumulated surplus is projected to increase from approximately $1139 million in 2016 to
approximately $1265 million by 2021 The accumulated surplus is made up of the net TCA
balance representing past investments in the sanitary sewer infrastructure and net financial
assets It is important to note that the non-financial assets (TCA) cannot be readily monetized
without affecting the sanitary sewer operations
Table 9-2 Statement of Financial Position
Statement of Financial Position 2016 2017 2018 2019 2020 2021
Financial Assets
CashReceivables and Investment $13731061 $13895204 $12164873 $13378657 $16515184 $18166448
Total Financial Assets $13731061 $13895204 $12164873 $13378657 $16515184 $18166448
Financial Liabilities
Accounts Payable amp Deferred Revenue $894210 $883620 $513420 $233149 $1760764 $3968923
Long-term Liabilities $0 $0 $0 $0 $0 $0
Total Financial Liabilities $894210 $883620 $513420 $233149 $1760764 $3968923
Net Financial Assets (Net Debt) $12836851 $13011585 $11651453 $13145508 $14754420 $14197524
Non-Financial Assests
Tangible Capital Assets $141770533 $145955938 $151059146 $154957662 $157415679 $160653548
Accumulated Amortization ($40756475) ($42198525) ($43520590) ($45264718) ($46892049) ($48329678)
Total Non-Financial Assets $101014058 $103757414 $107538555 $109692943 $110523630 $112323870
Accumulated Surplus $113850909 $116768999 $119190008 $122838451 $125278050 $126521394
Financial Indicators 2016 2017 2018 2019 2020 2021
Increase (Decrease) in Net Financial Assets $966414 $174733 ($1360132) $1494055 $1608912 ($556895)
Increase (Decrease) in Net Tangible Capital Assets $4475375 $2743356 $3781142 $2154388 $830687 $1800240
Increase (Decrease) in Accumulated Surplus $5441789 $2918089 $2421010 $3648443 $2439598 $1243345
Water Asset Consumption Ratio 29 29 29 29 30 30
93 Statement of Operations
The Statement of Operations is presented in Table 9-3 It summarizes the annual revenues and
expenses associated with managing the Cityrsquos sanitary sewer system It provides a report on the
transactions and events that have an influence on the accumulated surplus The main revenue
items included are
bull Revenues from Sanitary Sewer Rates and Charges
bull Earned Revenues (earned development charges capital contributions and sewer post
period capacity recovery) and
bull Other Revenues (miscellaneous fees and charges additional sewage revenues
(Kitchener) etc)
The main expense items are
57 DFA Infrastructure International Inc
City of Waterloo Water amp Sanitary Sewer Rate Design Study Final Report amp Water Financial Plan No 112-301
April 1 2016
bull The annual cost of operating and maintaining the sanitary sewer system including
Regional charges for treating wastewater and
bull Amortization expenses on existing and new TCA
The operating surplus (deficit) is an important indicator contained in the Statement of
Operations An operating surplus (deficit) measures whether operating revenues generated in
a year were sufficient to cover operating expenses incurred in that year It is important to note
that an annual surplus is necessary to ensure funds will be available to address non-expense
items such as TCA acquisitions over and above amortization expenses reservereserve fund
contributions for asset replacement and rate stabilization and repayment of outstanding debt
principal A ratio of operating surplus to total revenue is shown in Table 9-3 to reflect the
percent of total revenue that can be allocated to funding the non-expense items noted above
The higher the ratio the greater proportion of operating revenues that are available for paying
down debt purchasing capital assets and setting aside in reserves for future use Cash
generated from operations is discussed in the Statement of Cash Flows section
Table 9-3 Statement of Operations
Statement of Operations 2016 2017 2018 2019 2020 2021
Water Revenue
User Revenue $22639530 $23642507 $24500418 $26620392 $27414835 $28741194
Earned Revenue $4955280 $2749781 $3010247 $3059851 $959828 $263792
Other Revenue $1180638 $1100638 $1019638 $1056580 $1081060 $1121094
Total Revenues $28775448 $27492926 $28530303 $30736823 $29455723 $30126080
Water Expenses
Gross $5057612 $5191245 $5263715 $5388699 $4517432 $4650027
Wastewater Treated $16248249 $17291318 $18673935 $19469577 $20227227 $21906220
Operating Expenses $21305861 $22482563 $23937650 $24858276 $24744659 $26556247
Interest on Debt $0 $0 $0 $0 $0 $0
Amortization 2027798 2092273 2171644 2230104 2271466 2326489
Total Expenses $23333660 $24574836 $26109293 $27088380 $27016124 $28882736
Annual Surplus(Deficit) $5441789 $2918089 $2421010 $3648443 $2439598 $1243345
Accumulated Surplus(Deficit) Beginning of Year $108409121 $113850909 $116768999 $119190008 $122838451 $125278050
Accumulated Surplus (Deficit) End of Year $113850909 $116768999 $119190008 $122838451 $125278050 $126521394
Financial Indicators 2016 2017 2018 2019 2020 2021
Increase (Decrease) in Total Revenues $3103799 ($1282523) $1037378 $2206520 ($1281100) $670357
Increase (Decrease) in Total Expenses $3392720 $1241177 $1534457 $979087 ($72256) $1866611
Increase (Decrease) in Annual Surplus ($288921) ($2523700) ($497079) $1227433 ($1208844) ($1196254)
Operating Surplus Ratio 19 11 8 12 8 4
94 Statement of Cash Flow
The Statement of Cash Flow is presented in Table 9-4 This statement summarizes the main
cash inflows and outflows related to the sanitary sewer system in four (4) main areas -
operating capital investing and financing and shows the annual changes in cash Contained
within the 2016 cash position is a receivable of approximately $395 million to be fully collected
by 2021 from the Develop Charges Reserve Fund for capacity related projects funded in prior
years from the Sanitary Sewer Capital Reserve Fund
58 DFA Infrastructure International Inc
City of Waterloo Water amp Sanitary Sewer Rate Design Study Final Report amp Water Financial Plan No 112-301
April 1 2016
The operating cash transactions begin with the surplus or deficit identified in the Statement of
Operations This figure is adjusted to add or subtract non-cash items that were included as
revenues or expenses (eg amortization expenses) It is assumed that there were no ldquoinvesting
activitiesrdquo over the period The capital section indicates the amounts spent to acquire capital
assets (TCA) or received from the sale of assets In the Cityrsquos case it is assumed that there are
no assets to be sold to generate cash The financing section identifies the funds received from
development charges receipts ProvincialFederal Grants and proceeds from the issuance of
long-term debt as cash inflows offset by the portion of debt repaid as cash outflows No debt
however is projected over the forecast period
Table 9-4 indicates that cash has been generated from operations which is used in funding the
acquisition of TCA and towards building internal reserves over the forecast period The Citys
cash position is projected to increase over the forecast period from $137 million in 2016 to
$182 million in 2021
Table 9-4 Statement of Cash Flows
Statement of Cashflows 2016 2017 2018 2019 2020 2021
Cash Provided by
Operating Activities
Annual Surplus(Deficit) $5441789 $2918089 $2421010 $3648443 $2439598 $1243345
Non-Cash Items
Amortization $2027798 $2092273 $2171644 $2230104 $2271466 $2326489
Earned Revenue ($4955280) ($2749781) ($3010247) ($3059851) ($959828) ($263792)
Net Change in Cash Provided by Operating Activities $2514307 $2260582 $1582406 $2818696 $3751236 $3306041
Capital Activities
Purchase of TCA ($6503173) ($4835629) ($5952785) ($4384491) ($3102152) ($4126728)
Net Change in Cash Used in Capital Activities ($6503173) ($4835629) ($5952785) ($4384491) ($3102152) ($4126728)
Financing Activities
Other Municipal Sources
DC Collections $2693579 $2739190 $2640048 $2779579 $2487443 $2471951
ProvincialFederal Grants $411623 $0 $0 $0 $0 $0
Proceeds From Long-Term Debt $0 $0 $0 $0 $0 $0
Repayment of Long-Term Debt $0 $0 $0 $0 $0 $0
Net Change in Cash Used in Financing Activities $3105203 $2739190 $2640048 $2779579 $2487443 $2471951
Net Change in Cash and Cash Equivalents ($883664) $164143 ($1730331) $1213784 $3136527 $1651264
Cash and Cash Equivalents Beginning of the Year $14614725 $13731061 $13895204 $12164873 $13378657 $16515184
Cash and Cash Equivalents End of the Year $13731061 $13895204 $12164873 $13378657 $16515184 $18166448
59 DFA Infrastructure International Inc
City of Waterloo Water amp Sanitary Sewer Rate Design Study Final Report amp Water Financial Plan No 112-301
April 1 2016
10 Conclusions and Recommendations 101 Conclusions
Based on the information reviewed and analyses completed the following are the main
conclusions
1 The average annual full cost of managing the Cityrsquos water system over the study period
(next 24 years) is anticipated to be $306 million compared to current (2016) annual costs
of approximately $205 million Therefore water rate and service charge increases are
necessary to ensure that the system costs are fully funded and financially sustainable over
the long-term as required by O Reg 45307
2 The Regionrsquos Charges estimated at $181 million (annual average cost) for water treatment
represent the largest portion of system costs (59) over the next 24 years Contributions
to the capital reserve account for $39 million (13) OampM activities related to the Cityrsquos
operations account for $76 million (25) and debt repayment accounts for $097 million
(3)
3 A water infrastructure funding gap of approximately $33 million over the next 20 years
would continue to exist if rates and service charges are not adjusted to generate sufficient
funding levels
4 The financial statements for the water system prepared based on the results of the ratestudy analyses and projections indicate the following
- The accumulated surplus is projected to increase from approximately $726
million in 2016 to approximately $863 million by 2021
- The operating surplus ratio is projected to decrease from 15 in 2016 to 12 by
2021
- The cash position is projected to increase from $68 million in 2016 to $72
million in 2021
These indicate that the financial outlook for the water system over the 6-year period 2016
to 2021 is good
5 The average annual full cost of managing the Cityrsquos sanitary sewer system over the study
period (next 24 years) is anticipated to be $383 million compared to 2016 costs of
approximately $245 million Therefore sanitary sewer rate increases are necessary to
ensure that the system costs are fully funded and financially sustainable over the long-
term
6 The Regionrsquos Charges estimated at $29 million (annual average cost) for wastewater
treatment represent the largest portion of system costs (76) over the next 24 years
Contributions to the capital reserve account for $29 million (8) OampM activities related
60 DFA Infrastructure International Inc
City of Waterloo Water amp Sanitary Sewer Rate Design Study Final Report amp Water Financial Plan No 112-301
April 1 2016
to the Cityrsquos operations account for $59 million (15) and debt repayment accounts for
$05 million (1)
7 The current funding levels are sufficient for meeting the projected needs over the next 20
years However an infrastructure funding gap in excess of $72 million is projected beyond
2035 to 2065 Debt financing should be considered as part of the funding strategy to
address this infrastructure funding gap which is projected to occur just beyond the study
period
8 The financial statements for the sanitary sewer system prepared based on the results of
the rate study analyses and projections indicate the following
- The accumulated surplus is projected to increase from approximately $1139
million in 2016 to approximately $1265 million by 2021
- The operating surplus ratio is projected to decrease from 17 in 2016 to 4 by
2021
- The cash position is projected to increase from $137 million in 2016 to $182
million in 2021
These indicate that the financial outlook for the sanitary sewer system over the 6-year
period 2016 to 2021 is good
9 Based on a qualitative review all options would provide the level of funding to be fully
sustainable over the long-term Although Option 3 is best from a water conservation and
user pay guiding principle perspective it has significant disadvantages including but not
limited to
- Revenue uncertainty resulting from conservation due to the higher Block 2 rate
- Potentially high impacts (201 to 325 increases) to the non-residential
customers that may affect the attraction and retention of business These levels
of increases are significant and would require further dialogue with the business
community and volume data analysis prior to confirming the thresholds for each
block and the factor to be used for setting the Block 2 rate and
- The risk of shifting a much larger portion of costs to the residential sector should
business customers relocate or discontinue operations
Option 2 offers the most predictable revenues and would ensure that at least 15 of the
annual water revenues would be guaranteed while providing sufficient incentive for
customers to conserve
Option 1 still offers a fair and reasonable rate structure because the amount paid varies
almost directly with consumption due to the low fixed water charges (none for sanitary
sewer) Under Option 1 from a high level equity perspective the residential and non-
residential sectors pay their fair share Residential customers consume approximately
55 of the water and contribute 55 of the annual revenue while the non-residential
61 DFA Infrastructure International Inc
City of Waterloo Water amp Sanitary Sewer Rate Design Study Final Report amp Water Financial Plan No 112-301
April 1 2016
consumers account for the remaining 45 of consumption and revenues The major
disadvantage of the existing rate structure is the low level of revenue stability as only a
marginal amount of the annual revenue is collected via fixed fees This lack of revenue
stability will be offset to some extent by the introduction of the rate stabilization
reserves Therefore Option 1 could be remain a viable option moving forward should
Council not wish to proceed with Option 2 due to the large impact to the small and
average residential customers
102 Recommendations
The following are the primary recommendations for consideration by the City
10 Implement the rate structure described as Option 2 in this report effective 2019 to achieve
full cost recovery and ensure that 15 revenue recovery from the Water and Sanitary
Sewer Service Charges This would provide the best level of revenue stability compared to
the other options However if the potential cost increases to the small and average
residential customers under this option is of concern then it would be reasonable to
maintain the existing rate structure (Option 1) provided that the new rate stabilization
reserve funds discussed in this report are established The funds that would be available
from these reserves would reduce the financial risks due to revenue volatility
11 Increase transfers to the Water Capital Reserve Fund to the levels noted in Section 612 of
this report and included in Appendix D to meet the minimum target balance of 1 of
asset value adjusted for annual inflation each year subject to annual reviews of the water
systemrsquos asset needs to fully fund the capital requirements
12 Maintain transfers to the Sanitary Sewer Capital Reserve Fund at the levels noted in
Section 622 of this report and included in Appendix D to meet the minimum target
balance of 1 of asset value adjusted for annual inflation each year subject to annual
reviews of the sanitary sewer systemrsquos asset needs to fully fund the capital requirements
13 Utilize debt financing in the near term to help address the existing water capital shortfall
and sanitary sewer capital shortfall projected in the longer term in an effort to reduce the
burden placed on the rates
14 Establish a separate rate stabilization reserve fund for both water and sanitary sewer to be
used for offsetting any deficits and stabilizing rates and service charges These reserves to
be phased-in at a rate of 1 of annual operating cost from 2019-2023 until the target
balance of 5 of annual revenues is achieved
15 Continue to take steps to identify and address the causes of non-revenue water and inflow
and infiltration to the sanitary sewer system
16 That the OReg 45307 Water System Financial Plan No 112-301 including the Financial
Statements contained herein be approved by Council and submitted to the Province of
62 DFA Infrastructure International Inc
City of Waterloo Water amp Sanitary Sewer Rate Design Study Final Report amp Water Financial Plan No 112-301
April 1 2016
Ontario on or before June 1 2016 in accordance with the Drinking Water System Licence
renewal requirements and O Reg 45307
That a copy of this document entitled ldquoWater and Sanitary Sewer Rate Design Final
Report amp Water Financial Plan No 112-301rdquo be posted on the Cityrsquos website
(httpwwwwaterloocaratereview) and made available to the public at no charge
17 That the Sanitary Sewer System Financial Plan including the Financial Statements
contained herein be received by Council
18 The City should actively pursue Grant funding opportunities based on recent Federal
Budget announcements to increase funding to municipalities for infrastructure and lsquogreenrsquo
projects
63 DFA Infrastructure International Inc
City of Waterloo Water amp Sanitary Sewer Rate Design Study Final Report amp Water Financial Plan No 112-301
April 1 2016
References
1 Development Charges Background Study November 16 2012 Hemson Consulting Ltd
2 People amp Jobs Forecast 2015 -2025
3 City of Waterloo 2015- 2024 Capital Budget (10 year program)
4 Water Production and Supply Volumes Records ndashCity of Waterloo
5 Wastewater Treatment Volumes Forecast ndash City of Waterloo
6 Water amp Wastewater Treatment Rates Forecast ndash Region of Waterloo
7 City of Waterloo PSAB 3150 TCA Data (2014)
8 City of Waterloo 2015 and 2016 Operating Budgets
9 City of Waterloo By-Law Number 2015-24
10 City of Waterloo Debt Repayment Schedules (Growth)
11 City of Waterloo DC Reserves Continuity Schedule
12 City of Waterloo Water Capital Reserve Continuity Schedule
13 City of Waterloo Sanitary Sewer Capital Reserve Continuity Schedule
14 City of Waterloo Asset Management Plan (2014)
15 City of Waterloo Water amp Sanitary Sewer Asset Inventories
16 City of Waterloo Debt Management Policy FC-009 Revised May 12 2014
17 Working Paper Do Increasing Block Rate Water Budgets Reduce Residential Water
Demand A Case Study in Southern California Water Science amp Policy Centre University
of California Riverside K Baerenklau K Schwabe A Dinar September 1 2013
18Environment Canada (2011) 2011 Municipal Water Pricing Report Full-Cost Rates for
Water and the Chimera of ldquoAffordabilityrdquo C Bodimeade amp S Renzetti March 1 2013
64 DFA Infrastructure International Inc
Appendix A
EXCERPT OF CITY OF WATERLOO
BY-LAW 2015-079
THE CORPORATION OF THE CITY OF WATERLOO
BY-LAW NUMBER 2015-079
BEING a by-law to impose fees and charges on persons
WHEREAS section 391(1) of the Municipal Act 2001 SO 2001 c 25 as amended authorizes a municipality to impose fees or charges on persons for services or activities provided or done by or on behalf of it for costs payable by it for services or activities provided or done by or on behalf of any other municipality or any local board and for use of its property including property under its control
AND WHEREAS section 391(2) of the Municipal Act 2001 SO 2001 c 25 as amended states that a fee or charge imposed for capital costs related to services or activities may be imposed on persons not receiving an immediate benefit from the services or activities but who will receive a benefit at some later point in time
AND WHEREAS section 391(3) of the Municipal Act 2001 SO 2001 c 25 as amended states that the costs included in a fee or charge may include costs incurred by the municipality or local board related to administration enforcement and the establishment acquisition and replacement of capital assets
AND WHEREAS section 391(4) of the Municipal Act 2001 SO 2001 c 25 as amended states that a fee or charge may be imposed whether or not it is mandatory for the municipality or local board imposing the fee or charge to provide or do the service or activity pay the costs or allow the use of its property
AND WHEREAS section 391(5) of the Municipal Act 2001 SO 2001 c 25 as amended states that in the event of a conflict between a fee or charge by-law and the Municipal Act 2001 SO 2001 c 25 as amended or any other act or regulation made under any other act the by-law prevails
AND WHEREAS section 69(1) of the Planning Act RSO 1990 c P13 as amended states that the council of a municipality by by-law and a planning board by resolution may establish a tariff of fees for the processing of applications made in respect of planning matters which tariff shall be designed to meet only the anticipated cost to the municipality or to a committee of adjustment or land division committee constituted by the council of the municipality in respect of the processing of each type of application provided for in the tariff
AND WHEREAS section 69(2) of the Planning Act RSO 1990 c P13 as amended states that despite a tariff of fees established under subsection (1) the council of a municipality a planning board a committee of adjustment or a land division committee in processing an application may reduce the amount of or waive the requirement for the payment of a fee in respect of the application where the council planning board or committee is satisfied that it would be unreasonable to require payment in accordance with the tariff
AND WHEREAS section 69(3) of the Planning Act RSO 1990 c P13 as amended states that any person who is required to pay a fee under subsection (1) for the processing of an application in respect of a planning matter may pay the amount of the fee under protest and thereafter appeal to the Ontario Municipal Board against the levying of the fee or the amount of the fee by giving written notice of appeal to the Ontario Municipal Board within thirty days of payment of the fee
AND WHEREAS section 7(1)(c) of the Building Code Act 1992 SO 1992 c 23 as amended states that the council of a municipality may require the payment of fees on applications for and on the issuance of permits requiring the payment of fees for maintenance inspections and prescribing the amounts of the fees
AND WHEREAS section 7(2) of the Building Code Act 1992 SO 1992 c 23 as amended states that the total amount of the fees authorized under section 7(1)(c) must not exceed the anticipated reasonable costs of the principal authority to administer and enforce the Building Code Act 1992 SO 1992 c 23 as amended in its area of jurisdiction
AND WHEREAS section 7(3) of the Building Code Act 1992 SO 1992 c 23 as amended states that a regulation by-law or resolution establishing fees under section 7(1)(c) must provide for reduced fees to be payable in respect of the construction of a building for which a registered code agency is appointed under section 42 of the Building Code Act 1992 SO 1992 c 23 as amended
NOW THEREFORE BE IT ENACTED by the Council of The Corporation of the City of Waterloo as follows
10 CITATION
11 This by-law shall be known as the ldquoFees and Charges By-Lawrdquo ldquoFee Guiderdquo or ldquoFee Schedulerdquo of The Corporation of the City of Waterloo (the ldquoCityrdquo)
12 Should any by-law refer to the Cityrsquos or a department of the Cityrsquos ldquoFee Guiderdquo or ldquoFee Schedulerdquo the aforesaid by-law in using any of the aforementioned terms shall be interpreted to mean this by-law regardless of any definition to the contrary contained within that by-law
20 DEFINITIONS
For the purposes of this by-law
21 ldquoBuilding Code Actrdquo means Building Code Act 1992 SO 1992 c 23 as amended
22 ldquoBuilding Coderdquo means Ontario Regulation 35006 as amended
23 ldquoChief Building Officialrdquo means the chief building official of the City or his or her designate appointed or constituted under sections 3 or 4 of the Building Code Act
24 ldquoCityrdquo means The Corporation of the City of Waterloo
25 ldquoCouncilrdquo means the municipal Council of the City
2
26 ldquoCommissionerrdquo means a commissioner of a department of the City and shall include the Chief Financial OfficerTreasurer and the Chief Human Resources Officer or his or her designate
27 ldquoMunicipal Actrdquo means the Municipal Act 2001 SO 2001 c 25 as amended
28 ldquopersonrdquo includes an individual unincorporated association sole proprietorship partnership corporation or municipality and
29 ldquoPlanning Actrdquo means the Planning Act RSO 1990 c P13 as amended
30 FEES AND CHARGES
31 The City hereby imposes the fees and charges outlined in Schedule ldquoArdquo to this by-law pursuant to the provisions of the Municipal Act
311 The fees and charges imposed on a person by the City as outlined in Schedule ldquoArdquo to this by-law constitute a debt of the person to the City
312 The Treasurer of the City may add fees and charges imposed by the City as outlined in Schedule ldquoArdquo to this by-law to the tax roll for the following property in the City and collect them in the same manner as municipal taxes
3121 in the case of fees and charges for the supply of a public utility the property to which the public utility was supplied and
3122 in all other cases any property for which all of the owners are responsible for paying the fees and charges
313 If the City uses a registered collection agency in good standing under the Collection Agencies Act to recover a debt including taxes payable to the City the collection agency may also recover its reasonable costs of collecting the debt but those costs shall not exceed an amount approved by the City
314 The City may sell any prescribed debt payable to the City to any other person in accordance with the rules and conditions prescribed under the Municipal Act
3141 A person who acquires a debt outlined in section 314 has the priority of the City with respect to the debt
315 The powers of a Commissioner to increase decrease or waive a fee outlined in section 316 below should only be used in exceptional circumstances as determined by the Commissioner
316 The fees and charges imposed on a person by the City as outlined in Schedule ldquoArdquo to this by-law may be increased decreased or waived completely by the Commissioner to whose department the fee or charge relates in the following circumstances
3161 where there is a material change to the program or service being offered
3
3162 where a large-scale event such as a conference or trade show is being held at a City facility or on City-owned or City-operated property and where a negotiated agreement is required
3163 where by imposing a fee or charge the City is decreasing access or imposing a barrier to a person with a disability or their support person
3164 where a fee is set incorrectly by way of an administrative error or
3165 where imposing a fee or charge would be in the opinion of the Commissioner unreasonable given the circumstances
317 A Commissioner may only increase the amount of a fee or charge pursuant to section 316 of this by-law in order to recover or partially recover the Cityrsquos actual costs in delivering the applicable program or service
318 A Commissioner may impose a new fee or charge not outlined in Schedule ldquoArdquo to this by-law but still under the provisions of the Municipal Act where a new program or service is being offered by the City The new fee or charge imposed by a Commissioner shall
3181 not exceed the Cityrsquos actual cost to deliver the new program or service and
3182 shall be included in Schedule ldquoArdquo of this by-law as soon as is practicable
319 Should a Commissioner increase decrease or waive a fee or charge pursuant to section 316 of this by-law or should a Commissioner impose a new fee or charge pursuant to section 318 of this by-law the Commissioner shall report to Council on an annual basis and outline the specific actions taken and the rationale for so doing
32 The City hereby imposes a tariff of fees outlined in Schedule ldquoBrdquo pursuant to the provisions of the Planning Act
321 Any person may apply to Council in a manner or form prescribed by the City if that person feels that there are particular circumstances which would make it unreasonable for the City to require payment in accordance with the tariff of fees outlined in Schedule ldquoBrdquo
322 Following its consideration of the aforementioned application Council may reduce the amount of or waive the requirement for the payment of a fee pursuant to Schedule ldquoBrdquo
33 The City hereby imposes the fees and charges outlined in Schedule ldquoCrdquo pursuant to the provisions of the Building Code Act
331 Every twelve (12) months the Chief Building Official shall prepare a report that contains such information as may be prescribed in the Building Code Act and its regulations about the fees and charges outlined in Schedule ldquoCrdquo and the costs
4
of the City to administer and enforce the Building Code Act in its area of jurisdiction
332 The City shall make its report pursuant to section 331 available to the public in the manner required by regulation under the Building Code Act
333 If the City proposes to change any fee or charge imposed under Schedule ldquoCrdquo the City shall
3331 give notice of the proposed changes in fees or charges to such persons as may be prescribed by regulation under the Building Code Act and
3332 hold a public meeting concerning the proposed changes in a manner determined by the Chief Building Official
334 The notice of proposed changes in fees or charges outlined in section 3331 of this by-law must contain the information prescribed by the regulations under the Building Code Act including information about the public meeting and must be given in the manner prescribed by the regulations under the Building Code Act
335 The public meeting concerning proposed changes in fees or charges outlined in section 3332 of this by-law must be held within the period specified by regulation under the Building Code Act before the regulation by-law or resolution to implement the proposed changes is made
336 Section 398 of the Municipal Act applies with necessary modifications to fees established by the City under Schedule ldquoCrdquo and with the approval of the Treasurer of the City to fees established under section 7(1)(c) of the Building Code Act by a conservation authority whose area of jurisdiction includes any part of the local municipality
34 All fees and charges imposed by this by-law including all fees and charges outlined in the schedules to this by-law shall
341 not include applicable taxes unless otherwise indicated and
342 be in full force and effect on the effective date noted in the schedule unless no effective date is noted in which case they shall be in full force and effect immediately following their passage by Council
40 SEVERABILITY
41 If a Court of competent jurisdiction should declare any section or part of a section of this by-law to be invalid such section or part of a section shall not be construed as having persuaded or influenced Council to pass the remainder of this by-law and it is hereby declared that the remainder of this by-law shall be valid and shall remain in full force and effect
50 REPEAL amp AMENDMENT
51 By-Law 2015-051 is hereby repealed
5
_________________________________
__________________________________
52 Should this by-law conflict with any other by-law or resolution of Council or any staff report approved by Council in relation to fees and charges imposed under the Municipal Act Planning Act Building Code Act or any other act this by-law shall take precedence unless specifically stated to the contrary
60 COMING INTO FORCE
61 This by-law shall come into force on the date of its passage by Council
Read a FIRST SECOND and THIRD time this 14th day of December 2015
Signed by
MAYOR ndash David Jaworsky
Signed by
CITY CLERK ndash Olga Smith
6
Integrated Planning amp Public Works Department ndash Water-Sewer-Stormwater Services Division Schedule ldquoArdquo to Fees and Charges Bylaw
WATER AND SANITARY SEWER Effective Effective
Water Rate Fee Date of Fee Fee Date of Fee
(per cubic metre) $ 160 1-Jan-2014 $ 166 1-Feb-2015 Sanitary Sewer Rate
(per cubic metre) $ 200 1-Jan-2014 $ 210 1-Feb-2015
Service Charges
Water Meters
Water Meters - New
Fire Protection Charge (large commercial accounts)
15mm Water Meter Charge (single family residential accounts)
25mm Water Meter Charge (small apartments ie Triplex accounts)
40mm Water Meter Charge (small commercial industrial accounts)
50mm Water Meter Charge (large commercial industrial accounts)
75mm Water Meter Charge (large commercial industrial accounts)
100mm Water Meter Charge (large commercial industrial accounts)
150mm Water Meter Charge (large commercial industrial accounts)
200mm Water Meter Charge (large commercial industrial accounts)
250mm Water Meter Charge (large commercial industrial accounts)
Meter Pit Charge
$ 2048 1-Jan-2014 $ 2089 1-Feb-2015
$ 285 1-Jan-2014 $ 291 1-Feb-2015
$ 575 1-Jan-2014 $ 587 1-Feb-2015
$ 1053 1-Jan-2014 $ 1074 1-Feb-2015
$ 1319 1-Jan-2014 $ 1345 1-Feb-2015
$ 2756 1-Jan-2014 $ 2811 1-Feb-2015
$ 4030 1-Jan-2014 $ 4111 1-Feb-2015
$ 6854 1-Jan-2014 $ 6991 1-Feb-2015
$ 10347 1-Jan-2014 $ 10554 1-Feb-2015
$ 13759 1-Jan-2014 $ 14034 1-Feb-2015
$ 3517 1-Jan-2014 $ 3587 1-Feb-2015
Water Meter Accuracy Deposit
Water Meter Replacement Fee - (Damaged Frozen or Missing) plus Meter Cost
RemoteMounting Bracket Assembly
Tail Piece Replacement
Remote Re-wiring
15mm Meter Kit (complete)
Verification Administration
Miscellaneous Minor Repairs
Security Tag Replacement
$ 12755 1-Jan-2014 $ 15000 1-Feb-2015
$ 7200 1-Jan-2014 $ 7310 1-Feb-2015
$ 3815 1-Jan-2014 $ 3873 1-Feb-2015
$ 1905 1-Jan-2014 $ 1934 1-Feb-2015
$ 15275 1-Jan-2014 $ 15509 1-Feb-2015
$ 16145 1-Jan-2014 $ 16392 1-Feb-2015
$ 3815 1-Jan-2014 $ 3873 1-Feb-2015
$ 7635 1-Jan-2014 $ 7752 1-Feb-2015
$ 6325 1-Jan-2014 $ 6422 1-Feb-2015
15 mm
25 mm
40 mm
50 mm
75 mm
100 mm compound
100 mm fire rated
150 mm compound
150 mm fire rated
200 mm compound
200 mm fire rated
250 mm compound
250 mm fire rated
$ 10250 1-Jan-2014 $ 10680 1-Feb-2015
$ 22500 1-Jan-2014 $ 19920 1-Feb-2015
$ 45100 1-Jan-2014 $ 59400 1-Feb-2015
$ 60200 1-Jan-2014 $ 71400 1-Feb-2015
$ 264900 1-Jan-2014 $ 219600 1-Feb-2015
na - new $ 372000 1-Feb-2015
$ 1002000 1-Jan-2014 $ 828000 1-Feb-2015
na - new $ 633000 1-Feb-2015
$ 1140000 1-Jan-2014 $ 1104000 1-Feb-2015
na - new $ 1020000 1-Feb-2015
$ 1545100 1-Jan-2014 $ 1680000 1-Feb-2015
na - new $ 1320000 1-Feb-2015
$ 2188100 1-Jan-2014 $ 2359200 1-Feb-2015
Appendix B
WampWW VOLUMES AND GROWTH PROJECTIONS
Appendix B - WampWW Volumes and Growth Projections
Water Volumes and Growth Projections
Description 2016 2017 2018 2019 2020 2021 2022 2023 2024 2025 2026 2027 2028 2029 2030 2031 2032 2033 2034 2035 2036 2037 2038 2039
Volume Purchased by Waterloo from Region (1000 msup3)
12286 12274 12268 12319 12369 12426 12455 12491 12536 12580 12623 12662 12704 12747 12790 12832 12875 12917 12961 13004 13047 13090 13134 13178
Volume Sold to Customers (1000 msup3) 10535 10451 10355 10398 10441 10484 10527 10570 10613 10655 10698 10741 10784 10827 10870 10913 10956 10999 11042 11085 11128 11171 11214 11257
Non-Revenue Water (1000 msup3) 1751 1823 1914 1921 1928 1943 1928 1922 1924 1924 1924 1921 1920 1920 1919 1919 1918 1918 1918 1918 1919 1919 1919 1920
Non-Revenue Water () 14 15 16 16 16 16 15 15 15 15 15 15 15 15 15 15 15 15 15 15 15 15 15 15
Number of Customer Accounts
30360 30360 30360 30606 30852 31098 31344 31590 31836 32082 32328 32574 32820 33066 33312 33558 33804 34050 34296 34542 34788 35034 35280 35526
Description 2016 2017 2018 2019 2020 2021 2022 2023 2024 2025 2026 2027 2028 2029 2030 2031 2032 2033 2034 2035 2036 2037 2038 2039
Waterloo Volume Treated by the
32033
32279
32525
32771
33017
33263
33509
33755
34001
34247
34493
34739
34985
Region (1000 msup3)
Number of Customers
16265
29819
16193
29819
16358
29819
16084
30065
15779
30311
16136
30557
16110
30803
16093
31049
16041
31295
16032
31541
16082 16072 16064 16058 16062 16067 16065 16063 16063 16064 16064 16064 16064 16064 Billable Wastewater Volume
from Customers (1000 msup3) 10326 10279 10209 10252 10295 10339 10382 10425 10469 10512 10555 10599 10642 10685 10729 10772 10815 10859 10902 10945 10989 11032 11075 11119
31787
Sanitary Sewer Volumes and Growth Projections
Appendix C
PROJECTED CAPITAL BUDGET REQUIREMENTS
Appendix C - Projected Capital Budget Requirements
Projected Capital Budget Requirements - Water Capital Projections
Water Capital Projections ($000)
2016 2017 2018 2019 2020 2021 2022 2023 2024 2025 2026 2027 2028 2029 2030 2031 2032 2033 2034 2035 2036 2037 2038 2039
Capital 6503 4836 5953 4384 3102 4127 2131 2259 3238 4053 4210 4210 4210 4210 4210 4210 4210 4210 4210 4210 4210 4210 4210 4210
Backlog - - - - - - - - - - - - - - - - - - - - - - - -
Total Capital
6503 4836 5953 4384 3102 4127 2131 2259 3238 4053 4210 4210 4210 4210 4210 4210 4210 4210 4210 4210 4210 4210 4210 4210
Capital Financing ($000) 2016 2017 2018 2019 2020 2021 2022 2023 2024 2025 2026 2027 2028 2029 2030 2031 2032 2033 2034 2035 2036 2037 2038 2039
ProvincialFederal Grants - - - - - - - - - - - - - - - - - - - - - - - -
Gas Tax Allocation - - - - - - - - - - - - - - - - - - - - - - - -
Additional Gas Tax Allocation - - - - - - - - - - - - - - - - - - - - - - - -
Recoveries - - - - - - - - - - - - - - - - - - - - - - - -
Other Reserve - - - - - - - - - - - - - - - - - - - - - - - -
Contribution from Contingency - - - - - - - - - - - - - - - - - - - - - - - -
Reserve
Development Charges 1764 1650 860 490 497 504 511 518 526 533 - - - - - - - - - - - - - -
Non-Growth Related - - - 487 411 349 788 682 463 853 1868 1868 1868 1868 1868 1868 1868 1868 1868 1868 1868 1868 1868 1868
Debenture Requirements Growth Related Debenture
- - - - - - - - - - - - - - - - - - - - - - - - Requirements
Water Capital Reserve 2645 3235 2803 3817 3982 4117 4044 4193 4143 3974 4358 4358 4358 4358 4358 4358 4358 4358 4358 4358 4358 4358 4358 4358
Total Capital Financing 4409 4884 3662 4794 4890 4971 5343 5393 5132 5360 6226 6226 6226 6226 6226 6226 6226 6226 6226 6226 6226 6226 6226 6226
Projected Capital Budget Requirements - Water Capital Financing
Appendix C - Projected Capital Budget Requirements
Projected Capital Budget Requirements - Sanitary Sewer Capital Projections
Sanitary Sewer Capital Projections ($000)
2016 2017 2018 2019 2020 2021 2022 2023 2024 2025 2026 2027 2028 2029 2030 2031 2032 2033 2034 2035 2036 2037 2038 2039
Capital 6503 4836 5953 4384 3102 4127 2131 2259 3238 4053 4210 4210 4210 4210 4210 4210 4210 4210 4210 4210 4210 4210 4210 4210
Backlog - - - - - - - - - - - - - - - - - - - - - - - -
Total Capital
6503 4836 5953 4384 3102 4127 2131 2259 3238 4053 4210 4210 4210 4210 4210 4210 4210 4210 4210 4210 4210 4210 4210 4210
Capital Financing ($000) 2016 2017 2018 2019 2020 2021 2022 2023 2024 2025 2026 2027 2028 2029 2030 2031 2032 2033 2034 2035 2036 2037 2038 2039
ProvincialFederal Grants - - - - - - - - - - - - - - - - - - - - - - - -
Gas Tax Allocation 412 - - - - - - - - - - - - - - - - - - - - - - -
Additional Gas Tax Allocation - - - - - - - - - - - - - - - - - - - - - - - -
Recoveries - - - - - - - - - - - - - - - - - - - - - - - -
Other Reserve - - - - - - - - - - - - - - - - - - - - - - - -
Contribution from Contingency - - - - - - - - - - - - - - - - - - - - - - - -
Reserve
Development Charges 3763 1929 2185 2235 260 264 267 271 570 1959 - - - - - - - - - - - - - -
Non-Growth Related - - - - - - - - - - 1263 1263 1263 1263 1263 1263 1263 1263 1263 1263 1263 1263 1263 1263
Debenture Requirements Growth Related Debenture
- - - - - - - - - - - - - - - - - - - - - - - - Requirements
Sanitary Sewer Reserve 2329 2906 3767 2150 2842 3863 1863 1988 2669 2093 2947 2947 2947 2947 2947 2947 2947 2947 2947 2947 2947 2947 2947 2947
Total Capital Financing 6503 4836 5953 4384 3102 4127 2131 2259 3238 4053 4210 4210 4210 4210 4210 4210 4210 4210 4210 4210 4210 4210 4210 4210
Projected Capital Budget Requirements - Sanitary Sewer Capital Financing
Appendix D
PROJECTED RESERVES CONTINUITY SCHEDULE
Appendix D - Projected Reserves Continuity Schedule
Projected Reserves Continuity Schedule - Water Capital Reserve
Capital Reserve ($000)
Opening Balance
Transfer from Operating
2016
4357
1777
2017
4489
1674
2018
3928
1170
2019
3718
2478
2020
3379
3982
2021
3379
4117
2022
3379
4044
2023
3379
4193
2024
3379
4143
2025
3379
3974
2026
3379
4358
2027
3379
4829
2028
3850
4474
2029
3965
4477
2030
4084
4481
2031
4207
4484
2032
4333
4488
2033
4463
4492
2034
4597
4496
2035
4734
4500
2036
4877
4504
2037
5023
4509
2038
5173
4513
2039
5329
4518
Transfer from Operating-Sewer Loan
1000 1000 1000 1000
Transfer to Capital 2645 3235 2803 3817 3982 4117 4044 4193 4143 3974 4358 4358 4358 4358 4358 4358 4358 4358 4358 4358 4358 4358 4358 4358
Transfer to Operating - - - - - - - - - - - - - - - - - - - - - - - -
Closing Balance 4489 3928 3718 3379 3379 3379 3379 3379 3379 3379 3379 3850 3965 4084 4207 4333 4463 4597 4734 4877 5023 5173 5329 5489
Interest
- - - - - - - - - - - - - - - - - - - - - - - -
Projected Reserves Continuity Schedule - Water Rate Stabilizations Reserve
Rate Stabilization ($000) 2016 2017 2018 2019 2020 2021 2022 2023 2024 2025 2026 2027 2028 2029 2030 2031 2032 2033 2034 2035 2036 2037 2038 2039
Total Operating Cost 17771 18219 18689 19539 20129 20748 21353 21987 22415 23101 23836 24588 25368 26174 27004 27861 28744 29656 30597 31567 32568 33602 34668 35768
RSR Target ( of Net Costs to 0 0 0 1 2 3 4 5 5 5 5 5 5 5 5 5 5 5 5 5 5 5 5 5
Be Recovered from Users)
RSR Target ($) - - - 195 403 622 854 1099 1121 1155 1192 1229 1268 1309 1350 1393 1437 1483 1530 1578 1628 1680 1733 1788
Year End RSR Balance - - - 195 403 622 854 1099 1121 1155 1192 1229 1268 1309 1350 1393 1437 1483 1530 1578 1628 1680 1733 1788
Shortfall from Target - - - 0 0 0 0 0 0 0 0 0 0 0 0 0 0 0 0 0 0 0 0 0
Surplus from Target - - - - - - - - - - - - - - - - - - - - - - - -
Appendix D - Projected Reserves Continuity Schedule
Projected Reserves Continuity Schedule - Sanitary Sewer Capital Reserve
Transfer from Operating
Capital Reserve ($000) 2016
Opening Balance 7919
3228
2017
8599
2644
2018
8157
2276
2019
6491
2835
2020
7001
3788
2021
8646
3898
2022
8681
2828
2023
9646
1988
2024
9646
2669
2025
9646
2093
2026
9646
2947
2027
9646
2947
2028
9646
2947
2029
9646
2947
2030
9646
2947
2031
9646
2947
2032
9646
2947
2033
9646
2947
2034
9646
2947
2035
9646
2947
2036
9646
2947
2037
9646
2947
2028
9646
2947
2039
9646
2947
SPPC Repayment 781 820 825 825 700
Transfer to Capital 2329 2906 3767 2150 2842 3863 1863 1988 2669 2093 2947 2947 2947 2947 2947 2947 2947 2947 2947 2947 2947 2947 2947 2947
Transfer to Operating 1000 1000 1000 1000 - - - - - - - - - - - - - - - - - - - -
Closing Balance 8599 8157 6491 7001 8646 8681 9646 9646 9646 9646 9646 9646 9646 9646 9646 9646 9646 9646 9646 9646 9646 9646 9646 9646
Interest - - - - - - - - - - - - - - - - - - - - - - - -
Rate Stabilization ($000) 2016 2017 2018 2019 2020 2021 2022 2023 2024 2025 2026 2027 2028 2029 2030 2031 2032 2033 2034 2035 2036 2037 2038 2039
Total Operating Cost 21306 22483 23938 25109 24993 26862 28108 29125 30245 31938 32978 34204 35474 36795 38185 39346 40484 41662 42876 44129 45417 46740 48102 49505
RSR Target ( of Net Costs to 0 0 0 1 2 3 4 5 5 5 5 5 5 5 5 5 5 5 5 5 5 5 5 5
Be Recovered from Users)
RSR Target ($) - - - 251 500 806 1124 1456 1512 1597 1649 1710 1774 1840 1909 1967 2024 2083 2144 2206 2271 2337 2405 2475
Year End RSR Balance - - - 251 500 806 1152 1273 1273 1597 1649 1710 1774 1840 1909 1967 2024 2083 2144 2206 2271 2337 2405 2475
Shortfall from Target - - - 0 0 0 - 183 239 0 0 0 0 0 0 0 0 0 0 0 0 0 0 0
Surplus from Target - - - - - - 28 - - - - - - - - - - - - - - - - -
Projected Reserves Continuity Schedule - Sanitary Sewer Rate Stabilization Reserve
Appendix E
SYSTEM COSTS AND REVENUE REQUIREMENTS
Appendix E - System Costs and Revenue Requirements
System Costs and Revenue Requirements - Water System
CostRevenue Item ($000) 2016 2017 2018 2019 2020 2021 2022 2023 2024 2025 2026 2027 2028 2029 2030 2031 2032 2033 2034 2035 2036 2037 2038 2039
Municipal Capital Forecast 4409 4884 3662 3171 3520 3806 2715 3121 3588 2517 - - - - - - - - - - - - - -
Replacement Costs from Asset - - - - - - 371 - 22 1531 4892 5038 5190 3508 3613 3722 3833 3948 1823 1878 1934 1992 2052 2561
Replacement Summary
Backlog - - - 1623 1370 1164 2257 2272 1521 1313 1334 1187 1036 2718 2613 2504 2392 2277 4403 4348 4292 4234 4174 3665
Total Capital Requirements 4409 4884 3662 4794 4890 4971 5343 5393 5132 5360 6226 6226 6226 6226 6226 6226 6226 6226 6226 6226 6226 6226 6226 6226
Debt Financing - - - 487 411 349 788 682 463 853 1868 1868 1868 1868 1868 1868 1868 1868 1868 1868 1868 1868 1868 1868
Capital Reserve Financing 2645 3235 2803 3817 3982 4117 4044 4193 4143 3974 4358 4358 4358 4358 4358 4358 4358 4358 4358 4358 4358 4358 4358 4358
Transfer from Operating - - - - - - - - - - - - - - - - - - - - - - - -
Other Financing (Grants Third - - - - - - - - - - - - - - - - - - - - - - - -
Party etc)
DC Reserve Financing 1764 1650 860 490 497 504 511 518 526 533 - - - - - - - - - - - - - -
Total Capital Financing 4409 4884 3662 4794 4890 4971 5343 5393 5132 5360 6226 6226 6226 6226 6226 6226 6226 6226 6226 6226 6226 6226 6226 6226
Operating and Maintenance 17771 18219 18689 19539 20129 20748 21353 21987 22415 23101 23836 24588 25368 26174 27004 27861 28744 29656 30597 31567 32568 33602 34668 35768
Transfer to Capital Reserves 1777 1674 1170 2478 3982 4117 4044 4193 4143 3974 4358 4829 4474 4477 4481 4484 4488 4492 4496 4500 4504 4509 4513 4518
Debt Repayment - - - - 57 105 146 239 319 373 473 692 911 1130 1292 1462 1640 1767 1906 2071 2190 2190 2190 2190
Less Non-Rate Revenue 1438 1445 1453 1464 476 487 500 512 526 539 555 571 588 605 623 641 660 667 687 708 729 751 773 796
Revenue Requirements (from Users)
Revenue from Base Charge
Revenue from Uniform Rate
20986
1218
17878
21338
1247
18186
21312
1279
18535
23481
1292
20245
24644
1421
22256
25458
1468
22999
26042
1502
23524
26931
1553
24335
27403
1580
24753
27987
1613
25277
29222
1686
26407
30680
1771
27747
31340
1809
28336
32386
1869
29285
33399
1928
30204
34448
1989
31155
35532
2051
32138
36582
2113
33111
37686
2177
34110
38846
2244
35161
39991
2310
36198
41051
2371
37152
42144
2434
38136
43272
2499
39152
Annual Increase ($)
Annual Increase ()
617
3
337
2
382
2
1723
9
2139
10
790
3
559
2
863
3
445
2
557
2
1203
4
1425
5
626
2
1010
3
978
3
1012
3
1045
3
1035
3
1063
3
1118
3
1103
3
1015
3
1047
3
1081
3
Appendix E - System Costs and Revenue Requirements
System Costs and Revenue Requirements - Water System
CostRevenue Item ($000) 2016 2017 2018 2019 2020 2021 2022 2023 2024 2025 2026 2027 2028 2029 2030 2031 2032 2033 2034 2035 2036 2037 2038 2039
Municipal Capital Forecast 6503 4836 5953 4384 3102 4127 2131 2259 3238 4053 - - - - - - - - - - - - - -
Replacement Costs from Asset - - - - 0 - - - - 0 4210 4210 4210 4210 4210 4210 4210 4210 4210 4210 4210 4210 4210 4210
Replacement Summary
Total Capital Requirements 6503 4836 5953 4384 3102 4127 2131 2259 3238 4053 4210 4210 4210 4210 4210 4210 4210 4210 4210 4210 4210 4210 4210 4210
Debt Financing - - - - - - - - - - 1263 1263 1263 1263 1263 1263 1263 1263 1263 1263 1263 1263 1263 1263
Capital Reserve Financing 2329 2906 3767 2150 2842 3863 1863 1988 2669 2093 2947 2947 2947 2947 2947 2947 2947 2947 2947 2947 2947 2947 2947 2947
Transfer from Operating - - - - - - - - - - - - - - - - - - - - - - - -
Other Financing (Grants Third 412 - - - - - - - - - - - - - - - - - - - - - - -
Party etc)
DC Reserve Financing 3763 1929 2185 2235 260 264 267 271 570 1959 - - - - - - - - - - - - - -
Total Capital Financing 6503 4836 5953 4384 3102 4127 2131 2259 3238 4053 4210 4210 4210 4210 4210 4210 4210 4210 4210 4210 4210 4210 4210 4210
Operating and Maintenance 21306 22483 23938 25109 24993 26862 28108 29125 30245 31938 32978 34204 35474 36795 38185 39346 40484 41662 42876 44129 45417 46740 48102 49505
Transfer to Capital Reserves 3228 2644 2276 2835 3788 3898 2828 1988 2669 2093 2947 2947 2947 2947 2947 2947 2947 2947 2947 2947 2947 2947 2947 2947
Debt Repayment - - - - - - - - - - - 148 296 444 592 740 888 1036 1184 1332 1480 1480 1480 1480
Less Non-Rate Revenue 1181 1101 1020 1057 1081 1121 1160 1199 1239 1260 1297 1336 1375 1416 1458 1502 1546 1580 1627 1676 1726 1778 1832 1886
Revenue Requirements (from Users)
Revenue from Base Charge
25714
-
26227
-
27233
-
29001
-
29862
-
31881
-
32096
-
32311
-
34153
-
35291
-
37222
-
38634
-
40092
-
41602
-
43182
-
44535
-
45866
-
47225
-
48635
-
50084
-
51571
-
52945
-
54361
-
55819
-
Revenue from Uniform Rate 22353 23026 24194 25888 27700 29639 29776 29914 31675 32772 34628 35963 37341 38769 40265 41531 42773 44065 45380 46732 48118 49389 50698 52046
Annual Increase ($) 1139 673 1168 1694 1812 1939 137 137 1762 1096 1856 1335 1378 1428 1496 1266 1242 1292 1315 1352 1386 1271 1309 1348
Annual Increase () 5 3 5 7 7 7 0 0 6 3 6 4 4 4 4 3 3 3 3 3 3 3 3 3
Appendix F
PROJECTED FULL COST OF SERVICE
Appendix F - Projected Full Cost of Service
Projected Full Cost of Service - Water System
Cost Component 2016 2017 2018 2019 2020 2021 2022 2023 2024 2025 2026 2027 2028 2029 2030 2031 2032 2033 2034 2035 2036 2037 2038 2039
OampM 5467 5569 5680 6098 6242 6391 6545 6706 6635 6806 7011 7221 7438 7661 7891 8128 8372 8623 8882 9149 9423 9706 9997 10297
Regional Charge 12304 12649 13010 13442 13888 14357 14808 15281 15780 16295 16825 17367 17930 18512 19113 19732 20372 21032 21715 22419 23145 23896 24671 25470
Capital Expenditure 1777 1674 1170 2478 3982 4117 4044 4193 4143 3974 4358 4829 4474 4477 4481 4484 4488 4492 4496 4500 4504 4509 4513 4518
Debt Repayment -
Total 19548
-
19893
-
19859
-
22017
57
24169
105
24971
146
25543
239
26419
319
26877
373
27448
473
28667
692
30109
911
30752
1130
31781
1292
32777
1462
33807
1640
34872
1767
35915
1906
36999
2071
38138
2190
39262
2190
40300
2190
41371
2190
42475
Cost Component 2016 2017 2018 2019 2020 2021 2022 2023 2024 2025 2026 2027 2028 2029 2030 2031 2032 2033 2034 2035 2036 2037 2038 2039
OampM 5058 5191 5264 5640 4766 4956 5133 5048 5072 5545 5430 5601 5769 5943 6123 6293 6479 6673 6873 7080 7292 7511 7736 7968
Regional Charge 16248 17291 18674 19470 20227 21906 22975 24076 25173 26393 27548 28603 29705 30852 32062 33053 34006 34989 36003 37049 38125 39229 40366 41537
Capital Expenditure 3228 2644 2276 2835 3788 3898 2828 1988 2669 2093 2947 2947 2947 2947 2947 2947 2947 2947 2947 2947 2947 2947 2947 2947
Debt Repayment - - - - - - - - - - - 148 296 444 592 740 888 1036 1184 1332 1480 1480 1480 1480
Total 24534
25126 26214 27944 28781 30760 30936 31112 32914 34031 35925 37299 38717 40185 41724 43033 44319 45645 47008 48408 49844 51167 52529 53932
Projected Full Cost of Service - Sanitary Sewer System
Appendix G
ANNUAL CASH FLOW
Appendix G - Annual Cash Flow
Annual Cash Flow - Water System
Annual Cash Flow ($000) 2016 2017 2018 2019 2020 2021 2022 2023 2024 2025 2026 2027 2028 2029 2030 2031 2032 2033 2034 2035 2036 2037 2038 2039
Annual Opening Balance - - - - - - - - - - - - - - - - - - - - - - - -
Revenue from Base Charge 1218 1247 1279 1292 1421 1468 1502 1553 1580 1613 1686 1771 1809 1869 1928 1989 2051 2113 2177 2244 2310 2371 2434 2499
Revenue from Uniform Rate 17878 18186 18535 20245 22256 22999 23524 24335 24753 25277 26407 27747 28336 29285 30204 31155 32138 33111 34110 35161 36198 37152 38136 39152
Non-Rate Revenues 1438 1445 1453 1464 476 487 500 512 526 539 555 571 588 605 623 641 660 667 687 708 729 751 773 796
Operating Expenditures 17771 18219 18689 19539 20129 20748 21353 21987 22415 23101 23836 24588 25368 26174 27004 27861 28744 29656 30597 31567 32568 33602 34668 35768
(Contributions to) Capital 1777 1674 1593 2478 3982 4117 4044 4193 4143 3974 4358 4829 4474 4477 4481 4484 4488 4492 4496 4500 4504 4509 4513 4518
Reserve - 1 - (Cash Budget) (Contributions to) Capital
1000 1000 1000 1000 - - - - - - - - - - - - - - - - - - - - Reserve - 2 - (Cash Budget)
(Contributions to) Lifecycle - - - - - - - - - - - - - - - - - - - - - - - -
Reserve - (Cash Budget) Debt Repayment - (Cash
- - - - 57 105 146 239 319 373 473 692 911 1130 1292 1462 1640 1767 1906 2071 2190 2190 2190 2190 Outflow)
Annual Closing Balance - - - - - - - - - - - - - - - - - - - - - - - -
Annual Cash Flow ($000) 2016 2017 2018 2019 2020 2021 2022 2023 2024 2025 2026 2027 2028 2029 2030 2031 2032 2033 2034 2035 2036 2037 2038 2039
Annual Opening Balance - - - - - - - - - - - - - - - - - - - - - - - -
Revenue from Base Charge - - - - - - - - - - - - - - - - - - - - - - - -
Non-Rate Revenues
Loan Repayment
Revenue from Uniform Rate 22353
1181
23026 24194
1101
1020
1000
25888 27700
1057
1081
-
29639 29776
1121
1160
-
29914 31675
1199
1239
-
32772
1260
-
34628
1297
-
35963
1336
-
37341
1375
-
38769
1416
-
40265
1458
-
41531
1502
-
42773
1546
-
44065
1580
-
45380
1627
-
46732
1676
-
48118
1726
-
49389
1778
-
50698
1832
-
52046
1886
-
Operating Expenditures
(Contributions to) Capital Reserve - 1 - (Cash Budget)
(Contributions to) Capital
1000
21306
3228
-
-
-
1000
22483
2644
-
-
-
23938
2276
-
-
-
1000
25109
2835
-
-
-
24993
3788
-
-
-
-
26862
3898
-
-
-
28108
2828
-
-
-
-
29125
1988
-
-
-
30245
2669
-
-
-
31938
2093
-
-
-
32978
2947
-
-
-
34204
2947
-
35474
2947
-
36795
2947
-
38185
2947
-
39346
2947
-
40484
2947
-
41662
2947
-
42876
2947
-
44129
2947
-
45417
2947
-
46740
2947
-
48102
2947
-
49505
2947
- Reserve - 2 - (Cash Budget)
(Contributions to) Lifecycle Reserve - (Cash Budget)
Debt Repayment - (Cash Outflow)
Annual Closing Balance
- - - - - - - - - - - - - - - - - - - - - - - -
148 296 444 592 740 888 1036 1184 1332 1480 1480 1480 1480
- - - - - - - - - - - - -
Annual Cash Flow - Sanitary Sewer
Appendix H
REQUIREMENTS OF ONTARIO REGULATIONS 45307
Appendix A Requirements of OReg 45307
Requirements How Requirements are Met
1 The financial plans that is passed by
must be approved by a resolution
i The council of the municipality if the owner of the drinking water system is a municipality
It is expected the Council will approve the Updated Financial Plan prior to June 1st 2016
ii The governing body of the owner if the owner of the drinking water system has a governing body
and is not a municipality
NA
2 The financial plans must apply to a period of at least six Applies for 6 years from 2016 to 2021 inclusive years
3 The first year to which the financial plans must apply must be the year determined in accordance with the
following rules
i If the financial plans are required by subsection 2 the first year to which the financial plans must
apply must be the year in which the drinking water systemrsquos existing municipal drinking water
licence would otherwise expire
The licence expires in 2016 for the water systems (No112-301) Therefore the first year
of the Updated Financial Plan is 2016
ii If the financial plans are required by a condition that was included in a municipal drinking water
licence under subsection 1 (3) the first year to which the financial plans must apply must be the
later of 2010 and the year in which the first licence for the system was issued
NA
4 Subject to subsection financial plans apply
the following
(2) the
for each year financial plans
to which the must include
i Details of the proposed or projected financial position of the drinking water system itemized by
See Statement of Financial Position for all water systems combined in Financial Plan
a Total financial assets See Statement of Financial Position for all water systems combined in Financial Plan
b Total liabilities See Statement of Financial Position for all water systems combined in Financial Plan
c Net financial assets (debt) See Statement of Financial Position for all water systems combined in Financial Plan
d Non-financial assets that are tangible capital assets tangible capital assets
under construction inventories of supplies and prepaid expenses
See Statement of Financial Position for all water systems combined in Financial Plan TCA
Projections in Financial Plan
e Changes in tangible capital assets that are additions donations write downs
and disposals
See Statement of Financial Position for all water systems combined in Financial Plan TCA
Projections in Financial Plan
Appendix A Requirements of OReg 45307
ii Details of the proposed or projected financial operations of the drinking water system itemized by
See Statement of Operations for all water systems combined in Financial Plan
a Total revenues further itemized by water rates user charges and other revenues
See Statement of Operations for all water systems combined in Financial Plan
b Total expenses further itemized by amortization expenses interest expenses and other expenses
See Statement of Operations for all water systems combined in Financial Plan
c Annual surplus or deficit and See Statement of Operations for all water systems combined in Financial Plan
d Accumulated surplus or deficit See Statement of Operations for all water systems combined in Financial Plan
iii Details of the drinking water systemrsquos proposed or projected gross cash receipts and gross cash payments itemized by
See Statement of Cash Flow for all water systems combined in Financial Plan
a Operating transactions that are cash received from revenues cash paid for operating expenses and finance charges - done in full cost report
See Statement of Cash Flow for all water systems combined in Financial Plan
b Capital transactions that are proceeds on the sale of tangible capital assets and cash used to acquire capital assets
See Statement of Cash Flow for all water systems combined in Financial Plan
c Investing transactions that are acquisitions and disposal of investments
See Statement of Cash Flow for all water systems combined in Financial Plan
d Financing transactions that are proceeds from the issuance of debt and debt repayment
See Statement of Cash Flow for all water systems combined in Financial Plan
e Changes in cash and cash equivalents during the year
See Statement of Cash Flow for all water systems combined in Financial Plan
f Cash and cash equivalents at the beginning and end of the year
See Statement of Cash Flow for all water systems combined in Financial Plan
iv Details of the extent to which the information described in subparagraphs i ii and iii relates directly to the replacement of lead service pipes as defined in section 151- 3 of Schedule 151 to Ontario Regulation 17003 (Drinking Water Systems) made under the Act
Lead services are replaced as part of watermain rehabilitation projects andor road reconstruction projects when undertaken Although not all the streets contain lead services all of the water services to the property line are replaced for every rehabilitation and reconstruction project
5 The owner of the drinking water system must
i Make the financial plans available on request to members of the public who are served by the drinking water system without charge
This will be done by the municipality following Council approval
ii Make the financial plans available to members of the public without charge through publication on the Internet if the owner maintains a website on the Internet
The Financial Plan will be posted on the municipalityrsquos website and made available for public review at no charge
Appendix A Requirements of OReg 45307
iii Provide notice advising the public of the availability of the financial plans under
subparagraphs i and ii if applicable in a manner that in the opinion of the owner will bring the
notice to the attention of members of the public who are served by the drinking water system
A notice will be issued following Council approval
6 The owner of the drinking water system must give a copy of the financial plans to the Ministry of Municipal
Affairs and Housing O Reg 45307 s 3 (1)
Will be submitted following Council approval
Each of the following sub-subparagraphs applies only if the information referred to in the sub-
subparagraph is known to the owner at the time the financial plans are prepared
The Financial Plan was prepared using available information at the time of preparation and may
not contain all desired items Reasonable assumptions were made and these are noted in
the Financial Plan
1 Sub-subparagraphs 4 i A B and C of subsection (1)
The Financial Plan was prepared using available information at the time of preparation and may
not contain all desired items Reasonable assumptions were made and these are noted in
the Financial Plan
2 Sub-subparagraphs 4 iii A C E subsection (1) O Reg 45307 s 3 (2)
and F of The Financial Plan was prepared using available information at the time of preparation and may
not contain all desired items Reasonable assumptions were made and these are noted in
the Financial Plan
Appendix I
SERVICE CHARGES amp RATE PROJECTIONS
Appendix I - Service Charges and Rate Projections
Service Charges amp Rate Projections - Option 1
Rate Component
2016 2017 2018 2019 2020 2021 2022 2023 2024 2025 2026 2027 2028 2029 2030 2031 2032 2033 2034 2035 2036 2037 2038 2039
Annual Water Service Charges
Annual Increase ()
241 235 262 029 915 261 157 273 101 141 376 436 143 266 245 247 248 236 235 242 229 198 200 202
15 mm
3576
3660
3756
3767
4111
4219
4285
4402
4446
4509
4678
4882
4952
5084
5209
5337
5470
5598
5730
5869
6003
6122
6245
6371
25 mm
7224
7404
7584
7606
8302
8518
8651
8887
8977
9104
9447
9859
10000
10266
10518
10777
11044
11304
11570
11850
12121
12362
12609
12864
40 mm
13200
13536
13872
13912
15185
15580
15825
16256
16421
16653
17279
18032
18291
18777
19238
19713
20201
20677
21163
21675
22171
22611
23063
23529
50 mm
16548
16956
17376
17426
19020
19516
19822
20362
20569
20859
21643
22587
22911
23520
24097
24692
25304
25900
26509
27150
27771
28322
28889
29473
75 mm
34572
35436
36324
36428
39761
40797
41437
42567
42998
43605
45245
47218
47895
49169
50374
51618
52896
54142
55415
56755
58055
59207
60392
61612
100 mm
50568
51828
53124
53276
58151
59666
60601
62254
62885
63773
66171
69056
70046
71909
73673
75491
77361
79183
81045
83005
84906
86590
88324
90107
150 mm
85992
88140
90348
90607
98898
101474
103065
105876
106948
108459
112537
117444
119127
122296
125295
128387
131568
134667
137834
141167
144399
147263
150212
153246
200 mm
129816
133056
136380
136771
149286
153175
155576
159819
161438
163718
169874
177282
179822
184606
189133
193800
198602
203279
208060
213091
217970
222294
226744
231324
250 mm
172620
176940
181368
181888
198531
203703
206896
212539
214692
217724
225911
235762
239141
245502
251522
257729
264115
270335
276693
283383
289872
295622
301541
307631
Uniform Rate
Annual Increase ()
241 235 287 878 948 291 187 303 131 170 405 465 171 294 273 274 275 262 262 268 255 224 226 227
Uniform Water Rate ($msup3) 170 174 179 195 213 219 223 230 233 237 247 258 263 270 278 285 293 301 309 317 325 333 340 348
Annual Increase ()
333 323 580 655 655 655 004 004 545 303 523 343 341 340 344 273 258 261 258 257 256 224 225 226
Uniform
Wastewater 217 224
Rate ($msup3)
237
253
269 287
287
287
303
312
328
339
351
363
375
386
395
406
416
427
438
448
458
468
Appendix I - Service Charges and Rate Projections
Service Charges amp Rate Projections - Option 2
Rate 2016 2017 2018 2019 2020 2021 2022 2023 2024 2025 2026 2027 2028 2029 2030 2031 2032 2033 2034 2035 2036 2037 2038 2039
Component
Annual Water Service Charges
Annual Increase 241 235 262 15072 915 261 157 273 101 141 376 436 143 266 245 247 248 236 235 242 229 198 200 202
()
15 mm
3576 3660 3756 9417 10279 10546 10712 11004 11115 11272 11696 12206 12381 12710 13022 13343 13674 13996 14325 14672 15008 15305 15612 15927
25 mm
7224 7404 7584 19014 20754 21295 21629 22219 22444 22761 23616 24646 24999 25665 26294 26943 27610 28261 28925 29625 30303 30904 31523 32159
40 mm
13200 13536 13872 34779 37962 38951 39561 40640 41052 41632 43197 45081 45727 46943 48094 49281 50502 51692 52907 54187 55427 56527 57659 58823
50 mm
16548 16956 17376 43565 47551 48790 49554 50906 51422 52148 54109 56468 57277 58801 60243 61730 63259 64749 66272 67874 69428 70805 72223 73682
75 mm
34572 35436 36324 91070 99403 101993 103592 106417 107495 109013 113112 118045 119737 122922 125936 129044 132241 135356 138539 141889 145137 148017 150980 154029
100 mm
50568 51828 53124 133191 145378 149165 151503 155636 157212 159432 165427 172641 175115 179773 184182 188727 193403 197958 202613 207513 212264 216475 220809 225268
150 mm
85992 88140 90348 226518 247244 253686 257662 264689 267371 271147 281342 293611 297818 305741 313238 320968 328921 336667 344585 352917 360997 368159 375530 383114
200 mm
129816 133056 136380 341928 373214 382938 388939 399548 403596 409295 424685 443205 449556 461515 472832 484500 496505 508198 520149 532727 544924 555734 566861 578309
250 mm
172620 176940 181368 454720 496327 509258 517240 531348 536731 544310 564777 589406 597852 613756 628806 644324 660288 675838 691732 708458 724679 739056 753852 769078
Uniform Rate
Annual Increase 241 235 287 -164 948 291 187 303 131 170 405 465 171 294 273 274 275 262 262 268 255 224 226 227
()
Uniform Water Rate ($msup3) 170 174 179 176 193 198 202 208 211 215 223 234 238 245 251 258 265 272 279 287 294 301 308 314
Rate
2016 2017 2018 2019 2020 2021 2022 2023 2024 2025 2026 2027 2028 2029 2030 2031 2032 2033 2034 2035 2036 2037 2038 2039 Component
Annual Wastewater Service Charges
Annual Increase 623 624 -025 -025 515 274 494 314 313 312 316 246 231 234 231 231 230 198 200 201
()
15 mm
- - - 11433 12145 12902 12870 12839 13500 13870 14555 15012 15482 15965 16470 16875 17264 17669 18077 18495 18921 19296 19681 20077
25 mm
- - - 23085 24523 26052 25987 25924 27258 28006 29389 30313 31260 32237 33256 34073 34859 35676 36501 37344 38204 38962 39740 40538
40 mm
- - - 42224 44855 47653 47534 47417 49859 51226 53755 55445 57179 58964 60829 62323 63762 65256 66765 68307 69879 71265 72689 74149
50 mm
- - - 52890 56186 59689 59541 59394 62453 64166 67333 69451 71622 73858 76194 78066 79867 81739 83629 85561 87530 89266 91049 92879
75 mm
- - - 110565 117454 124779 124468 124162 130556 134137 140758 145185 149723 154399 159281 163195 166961 170874 174824 178864 182979 186609 190336 194161
100 mm
- - - 161702 171777 182489 182035 181588 190938 196176 205859 212333 218970 225809 232949 238673 244180 249903 255681 261589 267608 272916 278367 283961
150 mm
- - - 275007 292141 310360 309588 308826 324729 333637 350105 361115 372403 384033 396176 405911 415278 425011 434837 444884 455121 464148 473419 482932
200 mm
- - - 415122 440986 468487 467321 466172 490177 503624 528482 545102 562141 579697 598026 612721 626860 641552 656384 671551 687003 700630 714624 728984
250 mm
- - - 552059 586456 623028 621478 619950 651872 669755 702814 724916 747576 770923 795298 814841 833644 853182 872907 893077 913626 931748 950359 969456
Uniform Rate
Annual Increase 333 323 580 -943 655 655 004 004 545 303 523 343 341 340 344 273 258 261 258 257 256 224 225 226
()
Uniform
Wastewater 217 224 237 215 229 244 244 244 257 265 279 288 298 308 319 328 336 345 354 363 372 381 389 398
Rate ($msup3)
Appendix I - Service Charges and Rate Projections
Service Charges amp Rate Projections - Option 3
Rate Component
2016 2017 2018 2019 2020 2021 2022 2023 2024 2025 2026 2027 2028 2029 2030 2031 2032 2033 2034 2035 2036 2037 2038 2039
Annual Water Service Charges
Annual Increase ()
241 235 262 32175 950 293 188 304 132 172 407 467 173 296 275 276 276 264 263 270 256 226 227 229
15 mm
3576
3660
3756
15841
17345
17853
18190
18743
18991
19317
20104
21042
21406
22039
22644
23268
23912
24543
25189
25868
26531
27130
27746
28380
25 mm
7224
7404
7584
31985
35023
36049
36728
37846
38346
39005
40592
42488
43222
44500
45722
46983
48282
49556
50860
52232
53571
54779
56023
57304
40 mm
13200
13536
13872
58505
64062
65938
67180
69225
70140
71345
74248
77715
79059
81396
83631
85937
88313
90643
93029
95538
97988
100198
102473
104815
50 mm
16548
16956
17376
73283
80244
82593
84149
86711
87857
89366
93003
97345
99028
101957
104755
107644
110620
113539
116528
119670
122739
125507
128357
131291
75 mm
34572
35436
36324
153196
167747
172659
175912
181267
183662
186817
194420
203497
207016
213137
218988
225027
231248
237351
243599
250167
256582
262369
268327
274460
100 mm
50568
51828
53124
224050
245330
252515
257272
265103
268606
273220
284339
297615
302762
311714
320271
329103
338202
347126
356264
365870
375253
383715
392429
401399
150 mm
85992
88140
90348
381042
417233
429452
437542
450861
456818
464666
483576
506154
514907
530132
544685
559706
575180
590358
605899
622235
638192
652585
667404
682659
200 mm
129816
133056
136380
575182
629812
648256
660468
680574
689565
701412
729957
764038
777250
800232
822199
844874
868232
891143
914602
939261
963349
985075
1007443
1030471
250 mm
172620
176940
181368
764919
837569
862098
878338
905076
917034
932788
970749
1016073
1033643
1064206
1093420
1123574
1154638
1185107
1216304
1249098
1281132
1310023
1339771
1370395
Uniform Rate
Annual Increase ()
241 235 287 535 950 293 188 304 132 172 407 467 173 296 275 276 276 264 263 270 256 226 227 229
Block 1 ($msup3)
170
174
179
189
206
213
217
223
226
230
239
251
255
262
270
277
285
292
300
308
316
323
330
338
Block 2 ($msup3)
226
248
255
260
268
271
276
287
301
306
315
323
332
342
351
360
370
379
388
396
405
Rate
Component 2016 2017 2018 2019 2020 2021 2022 2023 2024 2025 2026 2027 2028 2029 2030 2031 2032 2033 2034 2035 2036 2037 2038 2039
Annual Sanitary Sewer Service Charges
Annual Increase ()
15 mm
25 mm
40 mm
50 mm
75 mm
100 mm
150 mm
200 mm
250 mm
Uniform Rate
Annual Increase ()
-
-
-
-
-
-
-
-
-
333
-
-
-
-
-
-
-
-
-
323
-
-
-
-
-
-
-
-
-
580
19322
39015
71363
89389
186865
273291
464787
701594
933030
-294
657
20591
41577
76050
95260
199137
291239
495311
747670
994305
657
657
21944
44309
81046
101517
212219
310371
527848
796784
1059622
657
006
21957
44335
81095
101579
212347
310558
528167
797266
1060262
006
006
21970
44362
81143
101639
212474
310744
528483
797743
1060897
006
547
23172
46788
85580
107197
224092
327736
557380
841363
1118906
547
305
23879
48215
88191
110468
230930
337736
574388
867036
1153048
305
525
25132
50745
92819
116264
243047
355457
604526
912531
1213549
525
345
25998
52495
96019
120272
251426
367712
625367
943990
1255386
345
343
26889
54293
99307
124392
260038
380306
646787
976322
1298384
343
342
27808
56149
102703
128645
268929
393309
668901
1009704
1342777
342
345
28769
58089
106251
133090
278220
406898
692011
1044588
1389169
345
275
29558
59684
109168
136743
285858
418068
711008
1073265
1427305
275
259
30325
61231
111998
140288
293267
428905
729438
1101085
1464302
259
263
31121
62838
114938
143971
300967
440165
748589
1129992
1502746
263
259
31927
64466
117916
147701
308764
451568
767982
1159266
1541676
259
259
32753
66133
120965
151521
316749
463247
787845
1189249
1581549
259
257
33596
67836
124079
155421
324902
475171
808123
1219859
1622257
257
225
34353
69364
126874
158922
332222
485876
826329
1247340
1658803
225
226
35130
70934
129747
162520
339743
496876
845037
1275580
1696358
226
227
35929
72547
132696
166215
347467
508171
864247
1304578
1734923
227
Block 1 ($msup3)
217
224
237
230
245
261
261
262
276
284
299
310
320
331
342
352
361
370
380
390
400
409
418
428
Block 2 ($msup3)
276
294
313
314
314
331
341
359
371
384
397
411
422
433
445
456
468
480
491
502
513

City of Waterloo Water amp Sanitary Sewer Rate Design Study Final Report amp Water Financial Plan No 112-301
April 1 2016
The projected costs and net revenue requirements for each year over the next 24 years are
used as the basis for developing the rates The projected annual net full costs of managing the
water system over the period are presented in Appendix F
Table ES-3 is a summary of the projected costs for the sanitary sewer system over the study
period It shows that the average annual cost of managing the sanitary sewer system is
approximately $383 million over the next 24 years compared to 2016 costs of approximately
$245 million The annual transfers to reserve are expected to decrease from approximately
$32 million in 2016 to an average annual amount of approximately $29 million over the next
24 years as most of the sanitary sewer system needs are beyond 2035 There are currently no
debt related costs based on the Cityrsquos current capital needs However debt will play a future
role in the long-term capital financing strategy for the sanitary sewer network and is estimated
at approximately $052 million (1) of annual costs Operations cost are estimated to be
approximately $59 million (15) and the capital costs $29 million (8) These are fixed costs
that account for approximately 24 of the total annual costs The treatment of wastewater by
the Region is estimated to be approximately $29 million and accounts for 76 of the overall net
cost These are variable costs because the Regionrsquos current rate structure for wastewater
treatment is 100 volumetric However most of the treatment costs are fixed Therefore if the
Region were to change its current rate structure then most of Regionrsquos cost would become a
fixed cost to the City
The projected costs and net revenue requirements for each year over the next 24 years are
used as the basis for developing the rates The projected annual net costs of managing the
sanitary sewer system over the period are presented in Appendix F
Table ES-3 Average Annual Full Cost of Sanitary Sewer System
iv DFA Infrastructure International Inc
Cost Component
(Sanitary Sewer) 2016 2016 ()
Average ($)
- (2016 2020)
Average ()
- (2016 2020)
Average ($)
- (2016 2039)
Average ()
- (2016 2039)
Capital Reserve $ 3227783 13 $ 2954049 11 $ 2895828 8
Transfers
Regional Charges $16248249 66 $18382061 70 $28981774 76
Operating Expenses $ 5057612 21 $ 5083741 19 $ 5915288 15
Debt Repayment $ - 0 $ - 0 $ 524342 1
Total $24533644 $26419851 $38317232
City of Waterloo Water amp Sanitary Sewer Rate Design Study Final Report amp Water Financial Plan No 112-301
April 1 2016
ES-5 Financing the System Costs
The existing rate structure plus two (2) alternative structures are considered for cost recovery
based on the guiding principles and feedback received from the Council Workshop and Public
Open House
bull Option 1 Continue using the existing rate structure and develop the rates required
for full cost recovery However one of the main issues identified is the increased risk
of not collecting sufficient rate revenues to fully offset the cost of service because
94 of the revenues depend on water consumption This can result in annual
deficits if not addressed
bull Option 2 A Sanitary Sewer Service Charge is introduced and 15 of the respective
water and sanitary sewer system revenue requirements would be recovered from
the respective service charges
bull Option 3 An inclining block rate structure is introduced Under this option higher
Water and Sanitary Sewer Rates would apply as consumption increases The
features of this structure include the following for both water and sanitary sewer
- A Bi-Monthly Service Charge that includes consumption of 14 msup3 for no
additional volumetric rate
- A First Consumption Block (Block 1) for bi-monthly consumption greater than
14 msup3 but not to exceed 34 msup3
- A Second Consumption Block (Block 2) for bi-monthly consumption greater
than 34 msup3
Table ES-4 shows the potential cost impacts of each option to the various customer types by
moving from 2018 to 2019 rates and charges It is important to note that the change in cost in
2019 is a one-time adjustment to reflect the change in rate structure and full cost recovery
Option 1 is projected to have a relatively consistent cost impact to all customer classes ie
700-751 in 2019 Option 2 is projected to have a much greater cost impact on the
residential sector (2619 for residential small and 1347 for average residential customers)
than on the non-residential sector Large commercial and industrial customers would benefit
from reductions of 375 to 598 Option 3 is projected to result in reductions to the small
and average residential customers (approximately 641 and 364 respectively) but would
result in major increase to the other large customer classes ranging from approximately 2087
to 3248 for the Residential Small Apartments and Non-Residential Customers These are
significant increases that would require more specific consultation with the impacted customer
classes prior to considering implementation Under all three (3) options the annual increases
beyond 2019 would be approximately 3-5 for all customer classes ie after the 2019 increase
and rate structure changes are made and become the new baseline
v DFA Infrastructure International Inc
City of Waterloo Water amp Sanitary Sewer Rate Design Study Final Report amp Water Financial Plan No 112-301
April 1 2016
Table ES-4 Annual 2019 vs 2018 Costs to Customers
Description 2018 Option 1
(2019)
Option 2
(2019)
Option 3
(2019)
Small Residential - Single Family Homes
Meter Size - 15 mm (Equivalency Unit - 100)
Average Consumption - 120 msup3year
Annual Increase to Total Bill () 7 26
Annual Increase to Total Bill ($) $3758 $14059
Annual Bill ($) $53676 $57434 $67735
-6
-$3443
$50233
Average Residential - Single Family Homes
Meter Size - 15 mm (Equivalency Unit - 100)
Average Consumption - 204 msup3year
Annual Increase to Total Bill () 7 13
Annual Increase to Total Bill ($) $6382 $11934
Annual Bill ($) $88620 $95002 $100554
-4
-$3223
$85397
Residential - Small Apartments
Meter Size - 25 mm (Equivalency Unit - 202)
Average Consumption - 1060 msup3year
Annual Increase to Total Bill () 7 2
Annual Increase to Total Bill ($) $33125 $7706
Annual Bill ($) $448544 $481669 $456250
23
$102687
$551231
Small Commercial and Industrial
Meter Size - 40 mm (Equivalency Unit - 369)
Average Consumption - 1215 msup3year
Annual Increase to Total Bill () 7 6
Annual Increase to Total Bill ($) $37983 $32403
Annual Bill ($) $519312 $557295 $551715
32
$168648
$687960
vi DFA Infrastructure International Inc
Description 2018 Option 1
(2019)
Option 2
(2019)
Option 3
(2019)
Large Commercial and Industrial
Meter Size - 50 mm (Equivalency Unit - 462)
Average Consumption - 8227 msup3year
Annual Increase to Total Bill () 7 -4 23
Annual Increase to Total Bill ($) $256961 -$128984 $803285
Annual Bill ($) $3439672 $3696634 $3310689 $4242957
Largest Commercial and Industrial
Meter Size - 50 mm (Equivalency Unit - 462)
Average Consumption - 192000 msup3year
Annual Increase to Total Bill () 8 -6 21
Annual Increase to Total Bill ($) $5996030 -$4776829 $16668939
Annual Bill ($) $79889376 $85885406 $75112547 $96558315
City of Waterloo Water amp Sanitary Sewer Rate Design Study Final Report amp Water Financial Plan No 112-301
April 1 2016
ES-6 Conclusions and Recommendations
Based on the information reviewed and analyses completed the following are the main
conclusions
1 The average annual full cost of managing the Cityrsquos water system over the study period
(next 24 years) is anticipated to be $306 million compared to current (2016) annual costs
of approximately $205 million Therefore water rate and service charge increases are
necessary to ensure that the system costs are fully funded and financially sustainable over
the long-term as required by O Reg 45307
2 The Regionrsquos Charges estimated at $181 million (annual average cost) for water treatment
represent the largest portion of system costs (59) over the next 24 years Contributions
to the capital reserve account for $39 million (13) OampM activities related to the Cityrsquos
operations account for $76 million (25) and debt repayment accounts for $097 million
(3)
3 A water infrastructure funding gap of approximately $33 million over the next 20 years
would continue to exist if rates and service charges are not adjusted to generate sufficient
funding levels
4 The financial statements for the water system prepared based on the results of the ratestudy analyses and projections indicate the following
vii DFA Infrastructure International Inc
City of Waterloo Water amp Sanitary Sewer Rate Design Study Final Report amp Water Financial Plan No 112-301
April 1 2016
- The accumulated surplus is projected to increase from approximately $726
million in 2016 to approximately $863 million by 2021
- The operating surplus ratio is projected to decrease from 15 in 2016 to 12 by
2021
- The cash position is projected to increase from $68 million in 2016 to $72
million in 2021
These indicate that the financial outlook for the water system over the 6-year period 2016
to 2021 is good
5 The average annual full cost of managing the Cityrsquos sanitary sewer system over the study
period (next 24 years) is anticipated to be $383 million compared to 2016 costs of
approximately $245 million Therefore sanitary sewer rate increases are necessary to
ensure that the system costs are fully funded and financially sustainable over the long-
term
6 The Regionrsquos Charges estimated at $29 million (annual average cost) for wastewater
treatment represent the largest portion of system costs (76) over the next 24 years
Contributions to the capital reserve account for $29 million (8) OampM activities related
to the Cityrsquos operations account for $59 million (15) and debt repayment accounts for
$05 million (1)
7 The current funding levels are sufficient for meeting the projected needs over the next 20
years However an infrastructure funding gap in excess of $72 million is projected beyond
2035 to 2065 Debt financing should be considered as part of the funding strategy to
address this infrastructure funding gap which is projected to occur just beyond the study
period
8 The financial statements for the sanitary sewer system prepared based on the results of
the rate study analyses and projections indicate the following
- The accumulated surplus is projected to increase from approximately $1139
million in 2016 to approximately $1265 million by 2021
- The operating surplus ratio is projected to decrease from 17 in 2016 to 4 by
2021
- The cash position is projected to increase from $137 million in 2016 to $182
million in 2021
These indicate that the financial outlook for the sanitary sewer system over the 6-year
period 2016 to 2021 is good
9 Based on a qualitative review all options would provide the level of funding to be fully
sustainable over the long-term Although Option 3 is best from a water conservation and
user pay guiding principle perspective it has significant disadvantages including but not
limited to
viii DFA Infrastructure International Inc
City of Waterloo Water amp Sanitary Sewer Rate Design Study Final Report amp Water Financial Plan No 112-301
April 1 2016
- Revenue uncertainty resulting from conservation d ue to the higher Block 2 rate
- Potentially high impacts (201 to 325 increases) to the non-residential
customers that m ay affect the attraction and retention o f b usiness These levels
of increases are significant and w ould r equire further dialogue with t he business
community and volume data analysis prior to confirming the thresholds for each
block and t he factor to be used f or setting the Block 2 rate and
- The risk of shifting a much larger portion o f costs to the residential sector should
business customers relocate or discontinue operations
Option 2 offers the most predictable revenues and would ensure that at least 15 of the
annual water revenues would be guaranteed while providing sufficient incentive for
customers to conserve
Option 1 still offers a fair and reasonable rate structure because the amount paid varies
almost directly with consumption due to the low fixed water charges (none for sanitary
sewer) Under Option 1 from a high level equity perspective the residential and non-
residential sectors pay their fair share Residential customers consume approximately
55 of the water and contribute 55 of the annual revenue while the non-residential
consumers account for the remaining 45 of consumption and revenues The major
disadvantage of the existing rate structure is the low level of revenue stability as only a
marginal amount of the annual revenue is collected via fixed fees This lack of revenue
stability will be offset to some extent by the introduction of the rate stabilization
reserves Therefore Option 1 could be remain a viable option moving forward should
Council not wish to proceed with Option 2 due to the large impact to the small and
average residential customers
11 Recommendations
The following are the primary recommendations for consideration by the City
10 Implement the rate structure described as Option 2 in this report effective 2019 to achieve
full cost recovery and ensure that 15 revenue recovery from the Water and Sanitary
Sewer Service Charges This would provide the best level of revenue stability compared to
the other options However if the potential cost increases to the small and average
residential customers under this option is of concern then it would be reasonable to
maintain the existing rate structure (Option 1) provided that the new rate stabilization
reserve funds discussed in this report are established The funds that would be available
from these reserves would reduce the financial risks due to revenue volatility
11 Increase transfers to the Water Capital Reserve Fund to the levels noted in Section 612 of
this report and included in Appendix D to meet the minimum target balance of 1 of
asset value adjusted for annual inflation each year subject to annual reviews of the water
systemrsquos asset needs to fully fund the capital requirements
ix DFA Infrastructure International Inc
City of Waterloo Water amp Sanitary Sewer Rate Design Study Final Report amp Water Financial Plan No 112-301
April 1 2016
12 Maintain transfers to the Sanitary Sewer Capital Reserve Fund at the levels noted in
Section 622 of this report and included in Appendix D to meet the minimum target
balance of 1 of asset value adjusted for annual inflation each year subject to annual
reviews of the sanitary sewer systemrsquos asset needs to fully fund the capital requirements
13 Utilize debt financing in the near term to help address the existing water capital shortfall
and sanitary sewer capital shortfall projected in the longer term in an effort to reduce the
burden placed on the rates
14 Establish a separate rate stabilization reserve fund for both water and sanitary sewer to be
used for offsetting any deficits and stabilizing rates and service charges These reserves to
be phased-in at a rate of 1 of annual operating cost from 2019-2023 until the target
balance of 5 of annual revenues is achieved
15 Continue to take steps to identify and address the causes of non-revenue water and inflow
and infiltration to the sanitary sewer system
16 That the OReg 45307 Water System Financial Plan No 112-301 including the Financial
Statements contained herein be approved by Council and submitted to the Province of
Ontario on or before June 1 2016 in accordance with the Drinking Water System Licence
renewal requirements and O Reg 45307
That a copy of this document entitled ldquoWater and Sanitary Sewer Rate Design Final
Report amp Water Financial Plan No 112-301rdquo be posted on the Cityrsquos website
(httpwwwwaterloocaratereview) and made available to the public at no charge
17 That the Sanitary Sewer System Financial Plan including the Financial Statements
contained herein be received by Council
18 The City should actively pursue Grant funding opportunities based on recent Federal
Budget announcements to increase funding to municipalities for infrastructure and lsquogreenrsquo
projects
x DFA Infrastructure International Inc
City of Waterloo Water amp Sanitary Sewer Rate Design Study Final Report amp Water Financial Plan No 112-301
April 1 2016
Table of Contents
1 Introduction 2
11 Background 212 Purpose 3
2 Regulatory Requirements 3
21 Provincial Regulations 322 City of Waterloo By-laws 5
3 Methodology 5
31 Guiding Principles 532 Study Components 6
4 Stakeholder Feedback 8
41 Committee of the Whole (COW) Feedback 841 Customer Feedback 11
5 Existing Systems 11
51 Water System 1152 Sanitary Sewer System 1153 Customer Growth 1154 Water Volumes 1255 Wastewater Volumes 13
6 Cost of Services 14
61 Cost Components 1461 Full Cost Assessment ndash Water System 19
611 Water System Capital Costs 19612 Water System Reserve Fund Requirements20613 Debt Related Costs 21614 Water System Operations amp Maintenance (OampM) Cost 21615 Net Full Cost of Water System 22
62 Full Cost Assessment ndash Sanitary Sewer System 23621 Sanitary Sewer System Capital Costs 23622 Sanitary Sewer Reserve Fund Requirements 24623 Debt Related Costs 25624 Sanitary Sewer System Operations amp Maintenance (OampM) Cost 25625 Net Full Cost of Sanitary Sewer System 27
7 Financing the Water amp Sanitary Sewer System Costs 28
71 Sources of Financing 2872 Existing Rate Structure amp Rates 29
721 Service Charges 30722 Uniform Consumption Rate 31
xi DFA Infrastructure International Inc
City of Waterloo Water amp Sanitary Sewer Rate Design Study Final Report amp Water Financial Plan No 112-301
April 1 2016
73 Alternative Rate Structures amp Rates 31731 Rate Structure Option 1 ndash Existing Structure 32732 Rate Structure Option 2 ndash 15 of Revenue from Service Charges33733 Rate Structure Option 3 ndash Inclining Block Rate Structure 35734 Potential Customer Impacts38735 Options Analysis amp Preferred Option 42
8 OReg 45307 Water System Financial Plan No 112-301 47
81 Tangible Capital Assets (TCA) Analysis 4782 Financial Statements 48
821 Statement of Financial Position 49822 Statement of Operations50823 Statement of Cash Flow 52824 Lead Service Pipe Removal52
9 Sanitary Sewer System Financial Plan 54
91 Tangible Capital Assets (TCA) Analysis 5492 Statement of Financial Position 5593 Statement of Operations 5794 Statement of Cash Flow 58
10 Conclusions and Recommendations 60
101 Conclusions 60102 Recommendations 62
References
Appendices
Appendix A Excerpt of City of Waterloo By-Law 2016-001
Appendix B Water amp Wastewater Volumes and Growth Projections
Appendix C Projected Capital Budget Requirements
Appendix D Projected Reserves Continuity Schedules
Appendix E System Costs and Revenue Requirements
Appendix F Projected Net Full Cost of Service
Appendix G Annual Cash-Flows
Appendix H Requirements of Ontario Regulation 45307
Appendix I Service Charges amp Rates Projections
xii DFA Infrastructure International Inc
City of Waterloo Water amp Sanitary Sewer Rate Design Study Final Report amp Water Financial Plan No 112-301
April 1 2016
Tables
Table 3-1 Rate Study Data Sources 7 Table 4-1 Council Feedback 9 Table 5-1 Water Volume Projections (2016-2021) 12 Table 5-2 Sanitary Sewage Volume Projections (2016-2021) 13 Table 6-1 Cost R elated A ssumptions 16 Table 6-2 Operating and Maintenance Costs (Water) 21 Table 6-3 Average Annual Full Cost o f Water System 23 Table 6-4 Operating and M aintenance Costs (Sanitary Sewer) 26 Table 6-5 Average Annual Full Cost o f Sanitary Sewer System 28 Table 7-1 Funding Sources 29 Table 7-2 Meter Equivalent R atios 30 Table 7-3 Existing (2016) Water amp Sanitary Sewer Rates and Charges 31 Table 7-4 Projected S ervice Charges amp Rates ndash Option 1 33 Table 7-5 Projected W ater Service Charges amp Rates - Option 2 34 Table 7-6 Projected S anitary Sewer Service Charges amp Rates ndash Option 2 34 Table 7-7 Projected W ater Service Charges amp Rates ndash Option 3 37 Table 7-8 Projected S anitary Sewer Service Charges amp Rates ndash Option 3 38 Table 7-9 Number of C ustomers in Each Consumption Block ( Option 3 ) 39 Table 7-10 Annual 2019 vs 2018 Costs to Customers 40 Table 7-11 Annual 2019 vs 2018 Costs to Customers 41 Table 7-12 Qualitative Analysis of R ate Options 43 Table 8-1 Asset Amortization a nd 2015 Net Book Value (NBV) 48 Table 8-2 Statement of F inancial Position 51 Table 8-3 Statement of O perations 52 Table 8-4 Statement of C ash Flow 53 Table 9-1 Asset Amortization a nd 2015 Net Book Value (NBV) 55 Table 9-2 Statement of F inancial Position 57 Table 9-3 Statement of O perations 58 Table 9-4 Statement of C ash Flows 59
Figures
Figure 6-1 Capital Funding Gap ( in $ 2015) ndash Water 19 Figure 6-2 Capital Funding Gap ( in $ 2015) ndash Sanitary Sewer 24
xiii DFA Infrastructure International Inc
City of Waterloo Water amp Sanitary Sewer Rate Design Study Final Report amp Water Financial Plan No 112-301
April 1 2016
1 Introduction 11 Background
The City of Waterloo (City) owns and operates a water distribution system and a sanitary
sewage (wastewater) collection system that service approximately 131000 residents The City
is responsible for ensuring that these systems are financially sustainable over the long-term
The delivery of water and sanitary sewage collection services in the Waterloo Region is a two-
tier structure whereby the Region of Waterloo (the Region) is responsible for water treatment
and transmission and wastewater treatment The Area Municipalities purchase water and
wastewater treatment services from the Region and are responsible for the water distribution
services to and sanitary sewage collection from their respective customers
The Regionrsquos annual charges to the City for water and wastewater treatment services are based
on actual water volume supplied to the City and the wastewater volume treated These are
calculated by applying the respective Regional water and wastewater volumetric rates to the
water and wastewater volumes as measured by the Region The Region is the ldquowholesalerrdquo and
the City is the ldquoretailerrdquo of water and wastewater services in the City of Waterloo Therefore
the Regionrsquos charges are a major part of the Cityrsquos annual service delivery costs The Regionrsquos
charges are more fully explained in Section 661 Cost Components Service
The total cost of the Cityrsquos water distribution and sanitary sewage collection services including
payments made to the Region are recovered from daily operating (non-rate) revenues (eg
administrative fees etc) and through direct billing to customers (rate revenues) The Citys
water bill to customers is comprised of monthly service charges based on meter size for water
plus consumption charges based on the respective water and sanitary sewage uniform rate per
cubic metre for volume of water consumed The sanitary sewer portion of the bill does not
include monthly service charges These revenues are required to cover the full costs of the
managing the water and wastewater systems including annual operating and capital costs and
long-term asset renewal costs net of any non-rate revenues However there is an increasing
risk to revenue recovery because consumption is volatile while many of the system costs are
fixed Consumption in recent years has been trending downwards despite continued growth
Therefore a more stable rate structure is required to improve the level of revenue recovery
over the long-term Accordingly there is a need for the City to update its rate structures and
rates to ensure that it remains on course to sustainable system financing The City is also
required to prepare and submit an updated Water System Financial Plan (No 112-301) to meet
the requirements of the Drinking Water Quality Management System as defined under OReg
45307 for renewal of its water distribution system licence
2 DFA Infrastructure International Inc
City of Waterloo Water amp Sanitary Sewer Rate Design Study Final Report amp Water Financial Plan No 112-301
April 1 2016
12 Purpose
The purpose of the rate study is to
bull Identify the full cost of services for the Cityrsquos drinking water and sanitary sewer systems
based on the most recent information
bull Develop water and sanitary sewer rate structures that would not only recover the full
cost of delivering these services but also provide sustainable financing over the long-
term and address the issue of declining water consumption and revenue stability
bull Prepare an updated Water System Financial Plan (No112-301) in accordance with the
requirements of OReg 45307 for the renewal of the licence for the Cityrsquos water
distribution system The existing licence expires on July 1 2016 and submission of the
financial plan as part of the licence renewal application to the Ministry of the
Environment (MOE) is required by June 1 2016 and
bull Prepare a Sanitary Sewer System Financial Plan similar to that required for water under
OReg 45307
2 Regulatory Requirements 21 Provincial Regulations
The primary Provincial legislation governing drinking water and sanitary sewer services include
the following
bull The Environmental Assessment (EA) Act 1990
bull The Environmental Protection (EP) Act 1990
bull The Safe Drinking Water Act 2002
bull The Municipal Act 2001
bull The Development Charges Act 1997
bull The Sustainable Water amp Sewer Systems Act 2002 and
bull The Water Opportunities amp Conservation Act 2010
The first two (2) set out the technical requirements related to service delivery The EA Act
applies to expansion of existing facilities and establishment of new capacity such as the
installation of new pipes The EP Act establishes the minimum requirements for the operations
of water and sanitary systems in terms of the potential environmental impacts
The Safe Drinking Water Act 2002 (SDWA) has significant implications to the daily water system
operations as it sets out the water sampling and other requirements (in OReg 17003) for
ensuring that the water delivered to consumers is high quality and safe for consumption This
Act has been a major influence over the past decade in terms of adjustments to operational
practices and quality expectations regarding both the Region and the City operations In
addition there is also a requirement under this Act (OReg 18807) for drinking water providers
3 DFA Infrastructure International Inc
City of Waterloo Water amp Sanitary Sewer Rate Design Study Final Report amp Water Financial Plan No 112-301 April 1 2016
to establish a Drinking Water Quality Management System (DWQMS) and obtain a licence for their respective water systems As part of this DWQMS and as required under O Reg 45307 (Financial Plans Regulation) operating authorities must submit a financial plan in order to renew their drinking water system licences These requirements are further described in Section 8 - OReg 45307 Water System Financial Plan No 112-301 There are also many other regulations and guidelines that deal with design and operation standards that mandate certain activities be undertaken as part of service delivery
The Municipal Act also sets out the financial requirements for managing the water and sanitary sewer systems including the assessment and recovery of full costs The Municipal Act Part VII Section 293 requires municipalities to establish reserves for dealing with long-term liabilities This applies directly to the pipe networks and the future liabilities associated with their age and condition The Municipal Act also permits the City to establish fees for cost recovery and requires public input prior to any fee adjustments The Development Charges Act and regulations establishes the requirements for the recovery of portions of future growth related capital expenditures to be incurred by the City
The Sustainable Water amp Sewer Systems Act 2002 (SWSSA)
The Sustainable Water and Wastewater Systems Act 2002 (SWSSA) was established based on the recommendations made by Justice OrsquoConnor on improvements to the management and operation of water and wastewater systems Under the SWSSA municipalities are required to submit reports on the full cost of service and method of cost recovery to the Province of Ontario as follows
A report prepared by a Professional Engineer identifying the full cost of water and sanitary sewer services
A report identifying a sustainable method by which the full cost would be recovered
The comments made by the Cityrsquos Auditor following a review of both reports and
Copies of Council resolutions accepting the recommendation of reports
Regulations under the SWSSA are still pending However these requirements have evolved over the years into best practice approaches taken by municipalities for sustainable water and sanitary sewer financial planning
The Water Opportunities and Conservation Act 2010 (WOA)
The WOA was enacted in November 2010 This legislation promotes water conservation and requires municipalities to prepare the following reports
Water conservation plans
Sustainability plans for water sanitary sewage amp stormwater management and
4 DFA Infrastructure International Inc
City of Waterloo Water amp Sanitary Sewer Rate Design Study Final Report amp Water Financial Plan No 112-301
April 1 2016
bull Asset management plans
Financial plans are required as a component of the water and sanitary sewer sustainability and
asset management plans Therefore more municipalities are now preparing sanitary sewer
financial plans as a best practise These financial plans that are similar to those required for
water systems in accordance with OReg 45307
22 City of Waterloo By-laws
By-Law 2016-001 establishes the Cityrsquos 2016 to 2018 water and sanitary sewer rates and
charges to its customers The rates and charges will be updated in 2019 through an update of
By-Law 2016-001 Excerpts of the by-law related to the drinking water and sanitary sewer rates
and charges are included in Appendix A
3 Methodology
This section outlines the study methodology which considers the feedback received from City
Council and customers as further described in Section 4
31 Guiding Principles
The water and sanitary sewer rate structure design is based on the guiding principles noted
below These reflect the feedback received from Council and customers described in Section 4
1 Full Cost Recovery All costs are to be recovered through the utility rates
2 Revenue Stability Provide stable and adequate annual revenue to minimize the
occurrence of annual deficits
3 User Pay Recover more revenue from those who use more water
4 Fairness and Equity Ensure to the extent possible that each customer class pays
its fair share with minimal cross subsidization
5 Uniform Rate Structure Rate structure to remain a uniform volumetric
(consumption) rate with no inclining or declining block (ie same consumption
rate for all users) However a rate option based on an inclining block rate
structure should be developed for further consideration
6 Water Conservation Water rate to be designed to facilitate ongoing water
conservation
7 Capital Financing To be through a combination of reserve rates debt (in accordance with the Cityrsquos debt policy)
8 Ease of Administration Rate calculations are to be transparent and easily
explainable to customers Rate structure must be compatible with existing billing
software capabilities and minimize costs due to rate structure changes
9 Affordability Customer affordability and assistance programs to be considered
as part of the study
5 DFA Infrastructure International Inc
City of Waterloo Water amp Sanitary Sewer Rate Design Study Final Report amp Water Financial Plan No 112-301
April 1 2016
32 Study Components
This study consists of three (3) main parts
bull Full Cost of Service This identifies the full costs (net of non-rate revenues) associated
with managing the water and sanitary sewer systems over a twenty-four (24) year study
period from 2016 to 2039
bull Rate Structure Alternatives (ie Full Cost Recovery) This identifies the rate structure
alternatives and the preferred option for recovery of costs (ie a revenue plan) through
proposed new rate structures and rates and charges to customers and
bull OReg45307 Financial Plans Section 8 presents the Water System Financial Plan (No
076-301) financial statements and other information required to meet the requirements
of OReg 45307 The financial statements are based on the information developed as
part of the full cost and revenue analyses completed for the rate study Similar financial
statements are also presented for the sanitary sewer system in Section 9
Full Cost Methodology
Calculation of the Cityrsquos full cost of managing the water and wastewater systems is based on
estimating and projecting the respective annual costs related to each system over the study
period These include
bull Annual operations and maintenance (OampM) costs related to water distribution and
sanitary sewage collection
bull Regional charges for water supply and wastewater treatment
bull Watermain and sewer replacement costs over the twenty four (24) year period based on
the renewal needs according to life expectancy as identified in the Cityrsquos Asset
Inventory
bull Capital funding for growth related projects over and above funding available through
the Development Charges Reserve Fund and direct contributions by developers as
presented in the Cityrsquos Capital Budget Forecast
bull Funding required for studies and non-growth operational improvement projects as
presented in the Cityrsquos Capital Budget Forecast
bull Annual contributions to a capital reserve fund for financing capital projects with a
minimum target of 1 of asset replacement value
bull Annual contributions to a rate stabilization reserve fund to offset major peaks and
valleys in rate requirements due to annual fluctuations in consumption as a result of
unpredictable weather patterns with a target of 5 phased in at a rate of 1 per year
beginning in 2019 over a 5-year period such that the 5 target is achieved by 2023 and
bull Repayment of existing and proposed future debt Debt will be utilized to address the
water network capital backlog and sanitary sewer system needs in accordance with the
Cityrsquos debt policy (maximum 30 of project cost to be funded by debt)
6 DFA Infrastructure International Inc
City of Waterloo Water amp Sanitary Sewer Rate Design Study Final Report amp Water Financial Plan No 112-301
April 1 2016
The assumptions made with respect to these cost items are presented in Table 6-1 The annual
costs are calculated in 2015 dollars and inflated over the study period
Cost Recovery Methodology
The fundamental components of the Cityrsquos current rate structure ie a fixed monthly charge
according to the customerrsquos meter size plus a consumption rate per cubic metre is maintained
as the basis for the water and sanitary sewer rate structures However options for improved
revenue security are provided and assessed against the guiding principles to identify a
preferred option Prior to completing this part of the study feedback from Council and
customers was obtained and incorporated into development of the options The base option is
the Cityrsquos 2015 rate structure with annual increases to the respective rates for full cost
recovery Two (2) additional options include adjusting the rate structure such that
approximately 15 of the annual revenue would be generated by the fixed charges and an
inclining block structure to promote conservation The current rate structure and rates for 2016
to 2018 as approved by Council under By-Law 2016-001 would continue to apply Therefore the
implementation year for the preferred rate structure option is 2019 The respective water and
sanitary rates over the study period and potential impacts to customers under each option are
modeled using DFArsquos Financial Planning Model A more detailed description of the Cityrsquos
current rate structure and the rate options for cost recovery are presented in Section 7
Data Sources
The primary sources of data used to prepare this rate study are listed in Table 3-1 In addition
information was also developed from discussions with and input from the Cityrsquos staff as
required
Table 3-1 Rate Study Data Sources
7 DFA Infrastructure International Inc
Item Data Source
Asset Life Expectancy bull The Cityrsquos Water amp Wastewater Asset Inventory
bull The Cityrsquos Water amp Wastewater Asset Inventory
Asset Replacement Cost bull bull
Unit Prices Provided by the City
Cityrsquos 2016 Capital Budget and 10-Year Capital
Forecast
Net Book Value (2014) Depreciation Historical Cost etc
bull The Cityrsquos PSAB 3150 Data for Water amp Wastewater
bull Cityrsquos 2013-2014 record of Building Permit Activity amp
actual development
Customer Growth bull Development Charges Study
bull People and Jobs Forecast 2015 to 2029
bull The revenues noted in the 2016 to 2018 annual
operating budgets
Item Data Source
OampM Costs bull Cityrsquos 2016 Budget
bull Regionrsquos 2016 Projected Rates amp Charges
Non-Rate Revenues bull Cityrsquos 2016 Budget Operating
bull Cityrsquos 2016 Budget Operating
Non TCA Capital Projections bull Cityrsquos 2016 Capital Budget and 10-Year Capital
Forecast
Water amp Wastewater Treatment bull Cityrsquos Historical Records
Volumes bull Cityrsquos Water Supply Master Plan
Water Volume Sold to Customers bull Cityrsquos 2016 Operating Budget Data
Existing Debt bull There is no existing water or wastewater debt
City of Waterloo Water amp Sanitary Sewer Rate Design Study Final Report amp Water Financial Plan No 112-301
April 1 2016
4 Stakeholder Feedback
The study process included obtaining feedback from members of Council and customers
through the following
bull A workshop session held on February 22 2016 with members of Council (Committee of
the Whole)
bull A Public Open House held on February 25 2016 in conjunction with the AssetManagement Plan and Water Master Plan public meeting requirements
The comments and feedback received was used to refine the guiding principles reserve
strategies and rate structure options for consideration
41 Committee of the Whole (COW) Feedback
The workshop session involved a presentation to COW outlining background information on the
water and sanitary sewer systems and the projected cost of service over the next 24 years
Survey questions were completed by members of Council during the workshop An overview of
the feedback is provided in Table 4-1
8 DFA Infrastructure International Inc
City of Waterloo Water amp Sanitary Sewer Rate Design Study Final Report amp Water Financial Plan No 112-301
April 1 2016
Table 4-1 Council Feedback
Workshop Item Feedback
Guiding P rinciples
Council was asked to rate the importance of e ach principle bull There was overall support for all principles
bull Consideration should be given to financing
capital projects not only from the respective
water and sanitary sewer capital reserve
funds but also through the use of d ebt
bull Although there was general support for
maintaining a uniform volumetric rate
structure the feedback suggested that an
inclining block structure should also be
examined to support water conservation and
user pay
Rate Structure Options
Council was asked to rank four (4) potential rate structure
options that would facilitate higher portions of r evenue
recovery from the fixed charges versus the volumetric charge
for both water and sanitary sewer
bull Option 1The existing rate structure
bull Option 2 6 revenue recovery from the fixed charges bull Options 2 and 3 were the most preferred 94 from the volumetric charge bull Options 1 and 4 were the least preferred
bull Option 3 20 revenue recovery from the fixed charges
80 from the volumetric charge bull Option 4 40 revenue recovery from the fixed charges
60 from the volumetric charge
Capital Reserve Strategies
Council was asked to rank four (4) potential capital reserve
strategies
bull Option 1Target a minimum reserve balance of 1 of
asset replacement value bull Option 1 was the most preferred
bull Option 2 Target a minimum reserve balance of less than bull Option 4 was the least preferred
1 of a sset replacement value bull Preference for Options 2 and 3 were mixed
bull Option 3 Target a reserve balance of 2 of a sset
replacement value
bull Option 4 Target a reserve balance of greater than 2 of
asset replacement value
9 DFA Infrastructure International Inc
Workshop Item Feedback
Rate Stabilization Reserve Strategies
Council was asked to rank four (4) potential capital reserve
strategies
bull Option 1Target a minimum reserve balance of 5 of
annual operating costs
bull Option 2 Target a minimum reserve balance of less than
5 of annual operating costs
bull Option 3 Target a reserve balance of 10 of annual
operating costs
bull Option 4 Target a reserve balance of greater than 10
of annual operating costs
Implementation Strategies
Council was asked to indicate a preference for implementing
the new rate structure
bull As part of the Asset Management Plan Implementation
(estimated to be 2019 for the purposes of this study)
bull As part of the next Water Services Utility rate report
(2017)
Affordability Program
Council was asked to indicate a support for establishing a
region wide affordability program for water and sanitary
sewer
bull bull
bull
bull
bull
Option 1 was the most preferred
Option 4 was the least preferred
Preference for Options 2 and 3 were mixed
Implementation in 2019 to align with the
Asset Management Plan Implementation was
preferred
There was strong support for this initiative
City of Waterloo Water amp Sanitary Sewer Rate Design Study Final Report amp Water Financial Plan No 112-301
April 1 2016
The following were also confirmed
bull Use of debt financing for capital needs will be utilized for up to 30 of the estimated
annual capital needs Water and sanitary sewer projects are exempt from the City Debt
Management Policy (FC-009) However a maximum debt funding limit of up to 30 of
the annual capital funding needs was used for the purposes of this study and rate
forecast as per the policy debt limits This is seen as an acceptable debt levelstrategy in
accordance with the Council approved tax base debt policy
bull Targeting capital reserve balances to be minimum 1 of the estimated asset
replacement value adjusted each year for inflation
bull Targeting rate stabilization reserve balances of 5 of annual operating costs each year
bull Implementing the new rate structure in 2019
10 DFA Infrastructure International Inc
City of Waterloo Water amp Sanitary Sewer Rate Design Study Final Report amp Water Financial Plan No 112-301
April 1 2016
41 Customer Feedback
A single combined Public Open House was hosted to obtain feedback on the rate design study
asset management plan and the master plan Attendees had the opportunity to view
information on display boards indicate their preferences regarding the guiding principles and
provide written feedback on comment sheets There were approximately ten (10) attendees
not including staff representing mainly the residential customers There was general support for
the guiding principles and the need for higher levels of revenue stability Only one comment
sheet was returned indicating a willingness to pay more for less future risk with respect to
water and sanitary sewer assets
5 Existing Systems
51 Water System
The water distribution system is operated by the Cityrsquos operations staff with support from
external contractors and consultants as needed The City provides water directly to its
customers through its water distribution system which is fed from the Regionrsquos water supply
system The distribution system generally consists of approximately 431 kilometres of
watermain of various ages materials and sizes 30050 water meters 2429 hydrants and 3995
valves Water use is metered for almost all customers
52 Sanitary Sewer System
The sanitary sewer system is operated by the Cityrsquos operations staff with support from external
contractors and consultants as needed The collection system consists of approximately 407
kilometres of sewer mains of various ages 5991 manholes and 6 pumping stations that are
monitored by City staff using a Supervisory Control and Data Acquisition (SCADA) system
53 Customer Growth
According to the Cityrsquos billing records the number of water and wastewater customers in 2016
is 30182 and 29906 respectively The annual customer growth for both water and wastewater
is estimated to be 246 residential customers for the study period beginning in 2019This is
consistent with 2013-2014 building permits issued and is conservative from an additional
revenue generation perspective Projections contained in the Development Charges Study and
People and Jobs Forecast 2015-2029 are considered to be relatively high for the purposes of
the rate study and would likely result in an over estimate of future revenues Note that all
growth is assigned to residential customers ie single family homes with a 15mm water meter
to be conservative with the revenue projections Growth for the period 2016 to 2018 is
assumed to be zero to match the revenue projections contained in the Cityrsquos annual budgets
forecasted for this period Annually any actual growth achieved will be captured by staff as part
11 DFA Infrastructure International Inc
City of Waterloo Water amp Sanitary Sewer Rate Design Study Final Report amp Water Financial Plan No 112-301
April 1 2016
of the annual consumption patterns update Appendix B presents the customer growth
projections over the study period
54 Water Volumes
The Cityrsquos historical and projected water volumes to be supplied annually by the Region and
sold to customers over the study period are shown in Appendix B The estimated water
volumes to be purchased and sold each year over the next six (6) years are shown in Table 5-1
The projected treatment volumes are based on a rolling 5-year average calculation which
includes a 1 annual increase that accounts for additional demand due to growth The annual
volume of water to be purchased from the Region each year is projected to increase from
approximately 12285662 m3 in 2016 to 13177504 by 2039 based on the Regionrsquos Water
Supply Master Plan This includes water that is supplied by the City of Waterloo to the City of
Kitchener and Bridgeport on a charge back basis estimated to be approximately 14400 m3 in
2016
The volumes projected to be sold to customers are based on a rolling 5-year average
calculation which includes a 1 annual reduction until 2018 This accounts for ongoing
conservation efforts and the overall downward trend in consumption despite annual customer
growth However an increase in the volume sold is projected to begin in 2019 to account for
growth The annual increases due to annual growth are estimated to be approximately 43050
m3 per year based on annual growth of 246 new customers per year and an average
consumption of 175 m3 per customer projected for 2019 The annual volumes to be consumed
by (ie sold to) customers are estimated to be approximately 10354586 m3 in 2018 increasing
to 11257292 m3 by2039 These are the ldquorevenuerdquo volumes used to calculate the annual
revenue from the metered consumption The difference between the purchase volumes and
the consumption volumes is the ldquounaccounted forrdquo or non-revenue water volume
Table 5-1 Water Volume Projections (2016-2021)
Water Volumes 2016 2017 2018 2019 2020 2021
Volume to be
Purchased from the 12285662 12274432 12268381 12318894 12368688 12426243
Region (msup3)
Revenue Volume (msup3) 10535117 10451447 10354586 10397572 10440558 10483544
Non-Revenue Water 1750545 1822985 1913795 1921323 1928130 1942700
(msup3)
12 DFA Infrastructure International Inc
City of Waterloo Water amp Sanitary Sewer Rate Design Study Final Report amp Water Financial Plan No 112-301
April 1 2016
55 Wastewater Volumes
The sanitary sewage collected by the City is not measured at the source but is metered by the
Region at the wastewater treatment plant These volumes include sanitary sewage
contributions from customers (as estimated based on metered water consumption) and inflow
and infiltration (IampI) into the sanitary sewer system
The historical and forecasted volumes of wastewater to be treated by the Region annually over
the 24-year study period are also shown in Appendix B These are based on the Cityrsquos forecast
for the period 2016 to 2018 which reflects the historical rolling 5-year average The annual
volume of wastewater to be treated by the Region each year is projected to increase from
approximately 16358051 m3 in 2018 to 16063727 by 2039 This includes IampI volumes and
additional wastewater generation due to growth
The revenue volumes for sanitary sewer billing are the metered water volumes for those
customers that also have water services This method of applying the sanitary sewer rates to
the metered water consumption volumes for billing purposes is standard industry practise
because sanitary sewage is typically not metered by municipalities The annual revenue
volumes including new customer growth are estimated to be approximately 10208507 m3 in
2018 increasing to 11118605 m3 by 2039 Note that there are customers that receive water
services only Therefore the revenue volumes for sanitary sewage are different from the
revenue volumes for water because of the difference between the number water and sanitary
sewer customers The 2016 annual treatment volume is 16264573 m3 compared to the
estimated sanitary sewage volume generated by customers of 10325928 m3 ie assuming that
all water consumed b y customers would be returned t o the wastewater system
The estimated volumes to be treated each year over the next six (6) years are shown in Table
5-2
Table 5-2 Sanitary Sewage Volume Projections (2016-2021)
13 DFA Infrastructure International Inc
Wastewater
Volumes 2016 2017 2018 2019 2020 2021
Citys Volume to be
Treated by Region 16264573 16193060 16358051 16084050 15779218 16135790
(msup3)
Sanitary Sewage
Revenue Volume (msup3) 10325928 10279351 10208507 10251845 10295183 10338521
City of Waterloo Water amp Sanitary Sewer Rate Design Study Final Report amp Water Financial Plan No 112-301
April 1 2016
6 Cost of Services
The respective full cost of managing the Cityrsquos water and sanitary systems takes into account all
factors that have a bearing on the level of effort and costs required to ensure a safe and reliable
supply of potable water to customers and public health and environmental protection
regarding sanitary sewage over the long-term These include both current and future
considerations that would influence the cost of managing the systems throughout their
respective lifetimes which can be several decades for water and sanitary sewer systems
Examples include replacement and rehabilitation of the distribution pipe network and the
sanitary sewer mains The cost implications of some of these factors are more predictable and
therefore more readily estimated than those of other factors eg the Cityrsquos OampM cost for the
distribution system is more predictable than the cost of purchasing water from the Region due
to varying weather conditions and consumption patterns Similarly the cost of sanitary sewage
treatment tends to increase with wet weather but revenues may decline due to lower water
consumption
Higher costs are expected in the future as the water and sanitary sewage business environment
changes However the impact can be mitigated by fully understanding assessing and planning
for future system costs The following sections identify the main drivers of cost the
assumptions made in quantifying costs and an estimate of the full cost of managing the water
and sanitary sewer systems The period used for this assessment is twenty-four (24) years
(2016 to 2039)
The respective full cost of managing the water and sanitary sewer systems is the total operating
and capital costs less non-rate revenues which are the revenues that are routinely generated
each year through the daily operations These include administrative revenues such as service
fees for turn-off charges lateral installations etc but do not include the revenues generated by
the water and sanitary sewer rates (ie from the sale of water) Accordingly the ldquonetrdquo full cost
of service represents the amount to be recovered from customers through the water and
sanitary sewer rates
61 Cost Components
The costs components related to the water system include the following
bull Operations and Maintenance (OampM) Costs of the Water Distribution Systems This
includes the costs of administration pipe repairs and maintenance water meter
maintenance hydrant maintenance water service installations and maintenance
sampling and testing and regulatory reporting
bull Regional Charges for the Supply of Treated Water to the City The cost of water
treatment and supply as billed by the Region is based on a uniform volumetric rate This
cost would vary depending on consumption and water loss within the Cityrsquos system and
14 DFA Infrastructure International Inc
City of Waterloo Water amp Sanitary Sewer Rate Design Study Final Report amp Water Financial Plan No 112-301
April 1 2016
is calculated as the product of the actual (metered) water volume purchased by the City
and the Regionrsquos uniform water rate
bull Capital Expenditures Capital expenditures are incurred primarily to replace and or
rehabilitate existing water related infrastructure each year as part of the Cityrsquos asset
management program and increase system capacity to accommodate new growth The
costs associated with studies design and construction are included in the capital
expenditures The capital costs associated with growth are normally recovered through
developer contributions and financing from the Development Charges Reserve
established by the City However depending on the project a portion of development
related costs may be funded from the capital reserve Annual contributions to the
capital reserve are required to ensure that sufficient funds are available to finance
projects as needed
bull Debt Repayment This is an annual cost for the repayment of debentures issued to
partially or fully fund capital projects There are no existing water system related debts
to be repaid However the City does intends to finance up to 30 of the water capital
backlog through debt in accordance with its current debt management policy and
discussions with staff
The sanitary sewer system cost components are similar to those for water
bull Operations and Maintenance (OampM) Costs of the Sanitary Sewer System This includes
the costs of administration pipe repairs and maintenance manhole repairs and service
lateral installations maintenance amp repairs
bull Regional Charges for the Treatment of the Cityrsquos Wastewater The cost of wastewater
treatment as billed by the Region is based on a uniform volumetric rate This cost would
vary depending on the volume of wastewater including inflow and infiltration
generated by the City It is calculated as the product of the actual treated wastewater
volume (as metered by the Region) and the Regionrsquos uniform wastewater rate This cost
tends to increase with wet weather due to the higher IampI volume
bull Capital Expenditures Capital expenditures are incurred primarily to replace and or
rehabilitate existing sanitary sewer related infrastructure each year as part of the Cityrsquos
asset management program and increase system capacity to accommodate new growth
The costs associated with studies design and construction are included in the capital
expenditures Annual contributions to the capital reserve are required to ensure that
sufficient funds are available to finance projects as needed
bull Debt Repayment There is no existing sanitary sewer system related debt at this time
However the City does intends to finance up to 30 of future capital projects (beyond
2025) through debt in accordance with its current financial policy and discussions with
staff
The assumptions made with respect to these cost components are summarized in Table 6-1
15 DFA Infrastructure International Inc
City of Waterloo Water amp Sanitary Sewer Rate Design Study Final Report amp Water Financial Plan No 112-301
April 1 2016
Table 6-1 Cost Related Assumptions
16 DFA Infrastructure International Inc
Applicable Factor Assumptions Regarding Future Costs
Water System amp Sanitary Sewer bull The current OampM costs are reflective of regulatory requirements
System Operations and Maintenance There would be no significant increase in the level of effort required
to operate and maintain the water system in the future The 2016 to
2018 OampM costs are the budget amounts already approved by the
City for this period However an increase of 3 per year is allowed
for inflation and any minor adjustments that may be required due to
future regulatory changes from 2019 onward
bull The Cityrsquos annual contribution to capital and rate stabilization
reserves is typically included in the annual OampM costs However
these contributions would be adjusted to suit the capital
requirements and target reserve levels and would vary as needed
over the study period
Region of Waterloo Water Supply bull The Regionrsquos rate structure is 100 volumetric and would continue
Charges indefinitely
bull The Regionrsquos Uniform Rate would increase in accordance with the
rate projections provided by the Region - 2016 - 2017 - +39 - 2017 onward - +29
bull The annual volume of water to be supplied by the Region would be as
projected by the City (ie a 5-Year Historical Rolling Average less 1
per year until 2018 to account for the decline in consumption)
bull The Regionrsquos projected Uniform Rate is inclusive of annual amounts
that may be required to fund any future rebate program for low
income water customers Discussions are ongoing with the Region
Region of Waterloo Wastewater bull The Regionrsquos rate structure is 100 volumetric and would continue
Treatment Charges indefinitely
bull The Regionrsquos Uniform Rate would increase in accordance with the
rate projections provided by the Region as follows up to 2025 Rates
for 2026-2064 are currently outside the Regionrsquos 10 year forecast
window but thought to be reasonable estimates based on the current
wholesale trend
- 2016-2018 - +69 - 2019-2021 - +59 - 2022-2025 - +49 - 2026-2030 - +39 - 2031-2064 - +29
bull The annual volume of wastewater to be treated by the Region would
be as projected by the City (ie a 5-Year Historical Rolling Average)
bull The Regionrsquos projected Uniform Rate is inclusive of annual amounts
that may be required to fund any future rebate program for low
income sanitary customers
Applicable Factor Assumptions Regarding Future Costs
Water amp Sanitary Sewer Revenue
Volumes (Volume to be Sold to
Customers)
Effective Date of Annual Regional amp
City Water Rates
Annual Variations in Revenue
Volumes (Volume Consumed) Due to
Weather Conditions
Water Consumption and Sanitary
Sewage Increases Due to the Addition
of New Customers
New and Emerging Regulations and
Guidelines Related to Water Quality
and Sanitary Sewer Management
Existing Asset Preservation and
Renewal
bull
bull
bull
bull
bull
bull
bull
bull
bull
bull
bull
bull
bull
bull
Volume of water used to calculate the Cityrsquos annual water revenues
and rates from 2016 to 2018 is based on the Regions Supply Master
Plan A 1 decline in consumption is applied to the previous five year
average consumption to reflect conservation
The revenue water volumes from 2019 onward would increase 3
annually due to growth from 10354586 m in 2018 based on the
assumption that the decline would level off by 2018
Because of the difference between the number of water and sanitary
sewer customers the volume of water used to calculate the Cityrsquos
annual sanitary sewer revenues and rates is based on the Regions
Supply Master Plan The historical rolling 5-year average treated
volume is used to project volumes from 2016 to 2018
For the purposes of the study the annual Region and the City water
rates are assumed to take effect on January 1st each year
Annual variations in weather conditions are unpredictable Therefore
an annual allowance is required as contributions to separate rate
stabilization reserves for water and sanitary sewer to account for
potential fluctuations in revenue due to consumption variations The
target balance for each rate stabilization reserve would be equal to
5 of the Cityrsquos annual operating cost for each system and be phased-
in at a rate of 1 per year over the course of 2019-2023
There are approximately 30360 water customers and 29819 sanitary
sewer customers in 2016
No increase in customers is projected for 2016 to 2018 to match the
revenue assumptions in the Cityrsquos 2016 to 2018 budgets
Approximately 246 new residential customers would be added
annually from 2019 onward based realized growth from 2013 to 2014
(conservative assumption) 3
Residential customers would consume approximately 175 m per
customer based on the Cityrsquos 2018 consumption projection This is an 3
additional 43050 per year m
There would be no Non-residential customer growth (conservative
assumption)
The implications of the Safe Drinking Water Act and the Water
Opportunities Act have already been realized for the most part Any
further cost implications of emerging regulations would be taken into
account in the annual 3 increase for OampM costs
The timing of pipe and other asset replacement would be based on
age and life expectancies contained in the Citys Asset Inventory
Capital expenditures would also be driven by the Cityrsquos 10-year capital
forecast for the period 2016 to 2025
Water related asset backlog (ie replacements due as of 2015 or
City of Waterloo Water amp Sanitary Sewer Rate Design Study Final Report amp Water Financial Plan No 112-301
April 1 2016
17 DFA Infrastructure International Inc
Applicable Factor Assumptions Regarding Future Costs
New growth related infrastructure
Inflation
Capital Financing
Market Competition and Pricing
bull
bull
bull
bull
bull bull
bull
bull
bull
bull
earlier) is spread over a 21-year period starting in 2019
Sanitary sewer related asset backlog is assumed to be already
captured in the Citys capital replacement plan
The growth related capital projects are based on the information
contained in the Cityrsquos 2016 ndash 2025 capital budget forecast
All project costs that are due to be funded directly by developer
contributions and from DC Reserve Fund are not considered as direct
cost to the City ie only the net cost to the City is considered in the
future cost projections
The Inflation index is estimated at 3 per annum for construction
related costs
The City has no existing debt related to water and sanitary sewer
Future capital financing for addressing the water backlog will be
through a combination of capital reserves and debt financing as
indicated through Councilrsquos feedback in accordance with the Cityrsquos
debt management policy as recommended by staff
Future capital financing for sanitary sewer projects would also be
through a combination of capital reserves and debt (beyond 2025)
The City also plans to issue debentures to partially fund some growth
related projects
Third party funding is only considered where the funds are confirmed
to be available
All outsourced services will be secured through a competitive bid
process thereby benefiting from market pricing and competition Any
market price increases would be covered of by the annual inflation
assumption
The factors described in Table 6-1 have different cost implications Some are directly within the
Cityrsquos control while others are not (eg Regional rates water demand fluctuations due to
weather variations) depending on the factor For example there is flexibility with capital
expenditures as upgrades can be planned and timed to suit a particular budget strategy Lost
revenues due to unaccounted for water and costs related to demand fluctuations are more
difficult to control It is also assumed that expansion of the water and sanitary sewer systems
will be limited to within the existing approved service areas
City of Waterloo Water amp Sanitary Sewer Rate Design Study Final Report amp Water Financial Plan No 112-301
April 1 2016
18 DFA Infrastructure International Inc
City of Waterloo Water amp Sanitary Sewer Rate Design Study Final Report amp Water Financial Plan No 112-301
April 1 2016
61 Full Cost Assessment ndash Water System
611 Water System Capital Costs
The water system capital budget requirements over the study period are presented in Appendix
C This reflects the projects identified in the Cityrsquos 10-year Capital Budget Forecast in
conjunction with the replacement of existing water system assets based on the asset inventory
and life expectancies and age It should be noted that some of the projects identified in the 10-
year Capital Budget Forecast include asset replacement Therefore these projects were
rationalized with the projected asset replacement needs to ensure that there was no
duplication in the projections There is also an existing backlog of asset replacement
requirements related to the water system estimated at approximately $33 million (in 2015
dollars) based on life expectancy These capital needs are spread over the 21-year period from
(2019 to 2039 inclusive) for better affordability due to the magnitude of the costs
A comparison of the capital needs to the existing level of capital funding indicates that there is
a funding gap which is estimated to be approximately $128 million over the next 20 years
However beyond 2036 current funding levels appear to be sufficient as shown in Figure 6-1
The 2016 budget for existing asset replacement related capital expenditures is $3687134 This
annual amount needs to be increased over the next twenty (20) years to close the funding gap
If the capital investment is not increased in the short-term to the levels noted in Appendix C
then the funding gap would continue to exist beyond 2035 and the water system would not be
financially sustainable
Figure 6-1 Capital Funding Gap (in $2015) ndash Water
45000000
40000000
35000000
30000000
25000000
20000000
15000000
10000000
5000000
-2016 to 2025 2026 to 2035 2036 to 2045 2046 to 2055 2056 to 2065
Existing Asset Funding 33582130 33582130 33582130 33582130 33582130
Asset Replacement Summary 40453995 39517821 21299913 31184756 22362999
Appendix C also shows the projected sources financing for the annual expenditures Capital
financing will be through the capital reserve and debt (to a maximum 30) Other sources of
financing such as provincial and or federal grants are unpredictable and are therefore not
19 DFA Infrastructure International Inc
City of Waterloo Water amp Sanitary Sewer Rate Design Study Final Report amp Water Financial Plan No 112-301
April 1 2016
considered over the long-term However the City is encouraged to aggressively pursue these
funding opportunities as they become available to reduce the overall amount to be funded
from the rates and Water Capital Reserve Fund The reserve fund requirements are discussed in
Section 612
612 Water System Reserve Fund Requirements
There are two (2) reserve funds being recommended as part of this study
bull The Water Capital Reserve Fund and
bull The Water Rate Stabilization Reserve
Appendix D shows the projected continuity schedules for both reserves This shows the
transfers to and from the respective reserves and the opening and closing balances Reserves
are assumed to earn zero annual interest on balances
Water Capital Reserve Fund
The Water Capital Reserve Fund which had an opening balance of approximately $44 million
at the beginning of 2016 will be a source of financing along with debt for future projects This
requires that annual contributions be made to the Water Capital Reserve Fund to ensure that
sufficient funds are available particularly for the asset replacement rehabilitation projects
required over the long-term These annual contributions (to be raised through the water rates
each year) are generally projected to range between $28 million starting in 2016 to
approximately $48 million by 2027 The 2016 transfer includes an annual amount of
$1000000 from the Sanitary Sewer Capital Reserve Fund for repayment of a loan from water
The loan is expected to be fully repaid by 2019 The reserve closing balance is targeted to be a
minimum of 1 of the asset replacement value adjusted for inflation each year over the study
period The annual reserve balance is projected to be $45 million at the close of 2016
decreasing to approximately $34 million by 2019 and increasing again to approximately $38 by
2027
Water Rate Stabilization (Operating) Reserve Fund
The Water Rate Stabilization Reserve Fund is required to provide a source of funding to offset
any year-end operating deficits that may occur during the period and avoid unplanned rate
spikes in the subsequent year The annual contributions (to be raised through the water rates
each year) are based on maintaining a target balance of 5 of the total operating expenditures
ie the revenue requirements (approximately $12 million on average over 24 years) Transfers
to this reserve fund are targeted to begin in 2019 and phased in at a rate of 1 per year until
2023 Annual contributions over the 24-year period are projected to range between $0 in 2016
and $245241 depending on the reserve balance and its utilization
20 DFA Infrastructure International Inc
City of Waterloo Water amp Sanitary Sewer Rate Design Study Final Report amp Water Financial Plan No 112-301
April 1 2016
613 Debt Related Costs
There is no existing water system debt However based on feedback from Council the City will
utilize debt to finance future asset renewal projects which will tend to smooth the rates The
City also plans to incur some growth related debt to supplement the Water amp Sanitary
Development Charges Reserve Fund to be used to finance the growth portions of projects This
future growth related debt and resulting debt repayment does not affect the costs to be
recovered from the water rates but are considered in the financial statements included in
Section 8
614 Water System Operations amp Maintenance (OampM) Cost
The annual operating budget is based on the operations and maintenance needs of the water
system The annual budget reflects the costs as shown in Table 6-2 These costs include the
Regionrsquos charges for supplying water to the City but do not include transfers to reserves as the
capital related costs are addressed separately in Section 612 The OampM costs are offset by
non-rate revenues with the resulting net costs to be recovered from rates
The gross 2016 OampM cost including the Regionrsquos charges are estimated to be $178 million This
cost would be offset by $044 million in non-rate revenues for a Net OampM cost of approximately
$173 million The purchase of water from the Region budgeted to cost $123 million in 2016
accounts for a significant portion (approximately 60) of the Cityrsquos annual OampM costs
The annual OampM costs (except for the Regionrsquos charges) and the non-rate revenues are
assumed to increase by 3 each year to allow for inflation plus any operational changes that
may be required The Regionrsquos charges would increase based on the Regionrsquos projected uniform
rates and the volume of water supplied to the City The assumptions respecting the Regionrsquos
charges are noted in Table 6-1 Appendix E presents the gross operating costs non-rate
revenues and net costs to be recovered from users through the Citys fixed and consumption
charges
Table 6-2 Operating and Maintenance Costs (Water)
21 DFA Infrastructure International Inc
Operating and Maintenance Costs 2016 Budget Operating Expenditures
Water Administration $ 2704238
Water Meters
Water Meter ReplacementInstallation $ 354693
Hydrants $ 10621
Valves $ 12724
Water-City
Infrastructure Management $
12047
Miscellaneous $ 280305
Operating and Maintenance Costs 2016 Budget Service Calls $ 135987
Subdivision Work $ 4307
Watermains $ 942058
Testing $ 23396
Hydrants $ 225876
Meters $ 250277
Service Repairs $ 172431
Vacuum Excavations $ 46878
Non Potable Pumping Station $ 1338
Water-Duel
Miscellaneous $
2264
Watermains $ 19290
Administration $ 138711
Prog-Water $ 129300
Wholesale Water Purchase from Region $ 12303913
Gross $ 17770654
Non-Rate Revenues
Water Administration $ 202132
Interdepartmental Repayment $ 121132
Water Meter $ 99595
Water-City $ 4295
Recoveries-Regional Water $ 10777
Net $ 17332723
City of Waterloo Water amp Sanitary Sewer Rate Design Study Final Report amp Water Financial Plan No 112-301
April 1 2016
615 Net Full Cost of Water System
The net full cost of managing the water system over the next twenty four (24) years is a
reasonable estimate of full costs to be recovered through the rates and is comprised of
bull Net Annual OampM Costs (ie after non-rate revenues are considered)
bull Net Capital costs (pipe replacement growth and non growth projects) ie not including
contributions from developers or grants
bull Water treatment (Regional) costs
bull Rate stabilization allowance
bull Capital reserve contributions and
bull Debt financing cost
Table 6-3 is a summary of the projected costs related to the water system over the study period
including the next 5 years It shows that the average annual cost of managing the water system
is approximately $306 million over the next 24 years compared to current (2016) annual costs
of approximately $205 million Debt repayment accounts for 3 of the annual costs
Operations cost are estimated to be approximately $76 million (25) and the capital costs $39
22 DFA Infrastructure International Inc
City of Waterloo Water amp Sanitary Sewer Rate Design Study Final Report amp Water Financial Plan No 112-301
April 1 2016
million (13) These are fixed costs that account for approximately 41 of the total annual
costs The purchase of water from the Region is estimated to be approximately $181 million
(59) of the overall net cost over the study period These are variable costs because of the
Regionrsquos rate structure for water treatment which is 100 volumetric However most of the
water treatment costs are fixed Therefore if the Region were to change its current rate
structure then most of Regionrsquos cost would become a fixed cost to the City The average
annual full cost of service is approximately $220 million over the next 5 years
The projected costs and net revenue requirements for each year over the next 24 years are
used as the basis for developing the rates The projected annual net full costs of managing the
water system over the period are presented in Appendix F
Table 6-3 Average Annual Full Cost of Water System
Cost Component
(Water) 2016 2016 ()
Average ($)
- (2016 2020)
Average ()
- (2016 2020)
Average ($)
- (2016 2039)
Average ()
- (2016 2039)
Capital Reserve $ 2777481 14 $ 3100679 14 $ 3962470 13
Transfers
Regional Charges $12303913 60 $13058563 59 $18083887 59
Operating $ 5466741 27 $ 5811017 26 $ 7580721 25
Expenses
$ Debt Repayment 0 $ 11417 0 $ 972520 3
-
Total $20548135 $21981676 $ 30599598
62 Full Cost Assessment ndash Sanitary Sewer System
621 Sanitary Sewer System Capital Costs
The sanitary sewer system capital budget requirements over the study period are presented in
Appendix C This reflects the projects identified in the Cityrsquos 10-year Capital Budget Forecast in
conjunction with the replacement of existing sanitary sewer assets based on the asset inventory
and life expectancies and age It should be noted that some of the projects identified in the 10-
year Capital Budget Forecast include asset replacement Therefore these projects were
rationalized with the projected asset replacement needs to ensure that there was no
duplication in the projections
A comparison of the capital needs to the existing level of capital spending indicates that current
funding levels are sufficient over the next 20 years until approximately 2035 as shown in Figure
6-2 However a funding gap in excess of $726 million is projected beyond 2035 (ie between
2036 and 2065 which is outside the window of this study) but a prime candidate for the
utilization of debt financing in the long-term The 2016 budget for capital expenditures is $38
23 DFA Infrastructure International Inc
City of Waterloo Water amp Sanitary Sewer Rate Design Study Final Report amp Water Financial Plan No 112-301
April 1 2016
million This annual amount should be sufficient for the next few years but should be increased
over the 24-year period to address the increasing sanitary sewer needs
If the capital investment is not increased to the levels noted in Appendix C then the funding
gap beyond 2035 would not be addressed and the sanitary sewer system would not be
financially sustainable
Figure 6-2 Capital Funding Gap (in $2015) ndash Sanitary Sewer
80000000
70000000
60000000
50000000
40000000
30000000
20000000
10000000
-2016 to 2025 2026 to 2035 2036 to 2045 2046 to 2055 2056 to 2065
Existing Asset Funding 32145413 32145413 32145413 32145413 32145413
Asset Replacement Summary 25702070 26719721 45344152 55111845 68602022
Appendix C also shows the projected sources financing for the annual expenditures Capital
financing will be through the Sanitary Sewer Capital Reserve Fund and debt (beyond 2025) in
the long term Other sources of financing such as provincial and or federal grants are
unpredictable and are therefore not considered over the long-term However the City is
encouraged to aggressively pursue these funding opportunities as they become available to
reduce the overall amount to be funded from the rates and capital reserve The reserve fund
requirements are discussed in Section 622
622 Sanitary Sewer Reserve Fund Requirements
There are two (2) reserve funds being recommended as part of this study
bull The Sanitary Sewer Capital Reserve Fund and
bull The Sanitary Sewer Rate Stabilization (Operating) Reserve
Appendix D shows the projected continuity schedules for both reserves This shows the
transfers to and from the respective reserves and the opening and closing balances
24 DFA Infrastructure International Inc
City of Waterloo Water amp Sanitary Sewer Rate Design Study Final Report amp Water Financial Plan No 112-301
April 1 2016
Sanitary Sewer Capital Reserve Fund
The Sanitary Sewer Capital Reserve Fund which had an opening balance of approximately $79
million at the beginning of 2016 will be a source of financing in conjunction with debt (beyond
2025) for future projects This requires that annual contributions be made to the Sanitary
Sewer Capital Reserve Fund to ensure that sufficient funds are available for the asset
replacement rehabilitation projects These annual contributions (to be raised through the
sanitary sewer rates each year) are generally projected to range from $40 million in 2016 to
approximately $30 million by 2026 The reserve closing balance is targeted to be a minimum of
1 of the asset replacement value adjusted for inflation each year over the study period The
annual reserve balance is projected to be $86 million at the close of 2016 increasing to $96
million by 2026
Sanitary Sewer Rate Stabilization (Operating) Reserve Fund
The Sanitary Sewer Rate Stabilization Reserve Fund is required to provide a source of funding to
offset any year-end operating deficits that may occur during the period and avoid unplanned
rate spikes in the subsequent year The annual contributions (to be raised through the sanitary
sewer rates each year) are based on maintaining a target balance of 5 of the annual operating
expenditures (approximately $17 million on average over 24 years) Transfers to this reserve
fund are targeted to begin in 2019 and phased in at a rate of 1 per year until 2023 Annual
contributions over the 24-year period are projected to range between $0 in 2016 and $346196
depending on the reserve balance and its utilization
623 Debt Related Costs
Similar to water there is no existing sanitary sewer system debt However based on feedback
from Council the City will utilize debt to finance future asset renewal projects which will tend to
smooth the rates Debt financing is expected to play a major role in funding projects beyond
the next 24 years when much of the sanitary sewer system becomes due for replacement The
City also plans to incur some growth related debt to supplement the Water amp Sanitary Sewer
Development Charges Reserve Fund to be used to finance the growth portions of projects This
future growth related debt and resulting debt repayment does not affect the costs to be
recovered from the water rates but are considered in the financial statements included in
Section 9
624 Sanitary Sewer System Operations amp Maintenance (OampM) Cost
The annual operating budget is based on the operations and maintenance needs of the sanitary
sewer system The annual budget reflects the costs as shown in Table 6-4 These costs include
the Regionrsquos charges wastewater treatment but do not include transfers to reserves because
the capital related costs are addressed separately in Sections 622 The OampM costs are offset
by non-rate revenues with the resulting net costs to be recovered from rates
25 DFA Infrastructure International Inc
City of Waterloo Water amp Sanitary Sewer Rate Design Study Final Report amp Water Financial Plan No 112-301
April 1 2016
Table 6-4 Operating and Maintenance Costs (Sanitary Sewer)
Operating and Maintenance Costs 2016 Budget
Operating Expenditures
Sewer Administration $2346514
Sewer Maintenance
Zoom Camera
$179476
Infrastructure Management $19543
Sanitary Sewer Flow Monitoring $51000
Laterals $640135
Sanitary Sewers $341400
Forcemain $2412
Pumping Station $247743
Prog-Sewer $120757
Interdepartmental Repayment $1108632
Net Operating Surplus $3081999
Regional Sewage Treatment Cost $16248249
Gross $24387860
Non-Rate Revenues
Sewer Administration $370088
Interdepartmental Repayment $12500
Sewage Rev-Extra Sewage $798050
Net $23207222
The gross 2016 OampM cost including the Regionrsquos charge is estimated to be $24387860 This
cost would be offset by $1180638 in non-rate revenues for a Net OampM cost of approximately
$23207222 Approximately $798000 in revenue is expected to be received from the City of
Kitchener annually for sanitary sewage that flows through the City of Waterloorsquos system
Wastewater treatment budgeted to cost $16248249 in 2016 accounts for a significant portion
(approximately 67) of the Cityrsquos annual OampM costs
The annual OampM costs (except for the Regionrsquos charges) and the non-rate revenues are
assumed to increase by 3 each year to allow for inflation plus any potential regulatory
changes The Regionrsquos charges would increase based on the Regionrsquos projected uniform rates
and the volume of wastewater treated from the City The assumptions respecting the Regionrsquos
charges are noted in Table 6-1 Appendix E summarizes the gross operating costs non-rate
revenues and net costs to be recovered from users through the Citys fixed and consumption
charges
26 DFA Infrastructure International Inc
City of Waterloo Water amp Sanitary Sewer Rate Design Study Final Report amp Water Financial Plan No 112-301
April 1 2016
625 Net Full Cost of Sanitary Sewer System
The net full cost of managing the sanitary sewer system over the next twenty-four (24) years is
a reasonable estimate of full costs to be recovered through the rates and is comprised of
bull Net Annual OampM Costs (ie after non-rate revenues are considered)
bull Net Capital costs (pipe replacement growth and non growth projects) ie not including
contributions from developers or grants
bull Wastewater treatment (Regional) costs
bull Rate stabilization allowance and
bull Capital reserve contributions
Table 6-5 is a summary of the projected costs for all the sanitary sewer system cost
components over the study period It shows that the average annual cost of managing the
sanitary sewer system is approximately $383 million over the next 24 years compared to 2016
costs of approximately $245 million The annual transfers to reserve are expected to decrease
from approximately $32 million in 2016 to an average annual amount of approximately $29
million over the next 24 years as most of the sanitary sewer system needs are beyond 2035
There are currently no debt related costs based on the Cityrsquos current capital needs However as
indicated in Section 623 debt will play a future role in the long-term capital financing strategy
(beyond 2025) for the sanitary sewer network and are estimated at approximately $524000
(1) Operations cost are estimated to be approximately $59 million (15) and the capital
costs $29 million (8) These are fixed costs that account for approximately 24 of the total
annual costs The treatment of wastewater by the Region is estimated to be approximately $29
million and accounts for 76 of the overall net cost These are variable costs because the
Regionrsquos current rate structure for wastewater treatment is 100 volumetric However most of
the treatment costs are fixed Therefore if the Region were to change its current rate structure
then most of Regionrsquos cost would become a fixed cost to the City
The projected costs and net revenue requirements for each year over the next 24 years are
used as the basis for developing the rates The projected annual net full costs of managing the
sanitary sewer system over the period are presented in Appendix F
27 DFA Infrastructure International Inc
Table 6-5 Average Annual Full Cost of Sanitary Sewer System
Cost Component
(Sanitary Sewer) 2016 2016 ()
Average ($)
- (2016 2020)
Average ()
- (2016 2020)
Average ($)
- (2016 2039)
Average ()
- (2016 2039)
Capital Reserve $ 3227783 13 $ 2954049 11 $ 2895828 8
Transfers
Regional Charges $16248249 66 $18382061 70 $28981774 76
Operating Expenses $ 5057612 21 $ 5083741 19 $ 5915288 15
Debt Repayment $ - 0 $ - 0 $ 524342 1
Total $24533644 $26419851 $38317232
City of Waterloo Water amp Sanitary Sewer Rate Design Study Final Report amp Water Financial Plan No 112-301
April 1 2016
7 Financing the Water amp Sanitary Sewer System Costs
This Section presents an analysis of the rate structure options the preferred structure and the
rates and charges required to provide sufficient revenues to recover the full costs associated
with the management of the Cityrsquos water and sanitary sewer systems
71 Sources of Financing
The current methods of financing for each cost component are summarized in Table 7-1 In
general capital projects are funded through rates and reserves The reserve funds are built
through annual contributions included in the water and sanitary sewer rates and charges each
year The City also intends to use debt along with reserves to finance future capital needs
Growth related projects are funded primarily through the Development Charges (DC) Reserve
and direct developer contributions Any additional funding from the City for growth related
projects is usually from the capital reserve fund Therefore only the ldquonetrdquo funding required
through the capital reserve funds is considered for growth related projects in this study as
identified in the 2016 capital budget forecast All other costs are recovered through the annual
rates and charges Periodically specific projects and activities may be funded by grants
available through Federal and Provincial Government funding programs and cost sharing
arrangements with the Region However this type of financing is not always available and only
considered in the study where funding has been confirmed
28 DFA Infrastructure International Inc
City of Waterloo Water amp Sanitary Sewer Rate Design Study Final Report amp Water Financial Plan No 112-301
April 1 2016
Table 7-1 Funding Sources
Item Funding Source
OampM bull Rates
bull DC Reserve Fund
bull Developer Contributions
Growth Projects bull Water Capital Reserve Fund for Water Projects
bull Sanitary Sewer Capital Reserve Fund for Sanitary Sewer Projects
bull Debt Financing (in the future)
bull Water Capital Reserve Fund for Water Projects
bull Sanitary Sewer Capital Reserve Fund for Sanitary Sewer Projects
Capital Replacement bull Debt Financing (in the future)
bull Transfers from Operating
bull Grants (as applicable)
Reserve Contributions bull Rates
Regional Charges bull Rates
72 Existing Rate Structure amp Rates
The Citys current rate structure for water includes a Water Service Charge (ie a base or fixed
charge component) that is set according to the customerrsquos meter size and a Water Rate (ie a
uniform consumption rate) The key features of this rate structure are
bull The revenues from the Service Charges are guaranteed because they are fixed
charges and can bring stability to the overall revenue stream and
bull This structure has all of the benefits of a uniform rate (eg promoting water
conservation) but without the extreme volatility of relying 100 on consumption
revenues However in the Cityrsquos case the portion of revenue from the service
charges is relatively small (approximately 6 for water and 0 for sanitary sewer)
and is only a minor benefit to revenue stability
The sanitary sewer rate structure includes only a volumetric rate that is applied to water
consumption but does not include a Sanitary Sewer Service Charge component Therefore 100
of the revenues are dependent on water use which can lead to revenue uncertainty and deficits
due to lower consumption The water and sanitary sewer rates are shown in Table 7-3
In general the current rate structure recovers only approximately 6 of the annual water
revenue and 0 of the annual sanitary sewer revenues from the fixed charges making revenues
heavily dependent upon consumption This increases the risk of incurring deficits especially in
wet years when water consumption tends to be lower than predicted This is particularly the
case for sanitary sewer revenues which are based on water consumption The revenue tends to
29 DFA Infrastructure International Inc
City of Waterloo Water amp Sanitary Sewer Rate Design Study Final Report amp Water Financial Plan No 112-301
April 1 2016
be lower in wet years but the cost of treatment tends to be higher due to inflow and
infiltration Most of the water and sanitary sewer costs are fixed (approximately 41 for water
and 24 for sanitary sewer as noted in Section 615 and Section 625 respectively) whereas
the revenue recovery tends to be more volatile ie the revenue structure does not match the
cost structure Although the Regionrsquos charges are volumetric most of the costs of treatment are
fixed except for hydro and chemical costs If the Region were to change its rate structure from
100 volumetric then the Cityrsquos rate structure would need to be revisited and changed to suit
the new cost structure Therefore the existing rate structure is exposed to revenue volatility
unless changes are made to recover a greater portion of revenues from the fixed charges (ie
guaranteed revenue regardless of consumption) The creation of respective Water and Sanitary
Sewer Rate Stabilization Reserve Funds is one way to mitigate some of the revenue volatility
risk resulting from the current rate structure
721 Service Charges
The Service Charges are calculated according to the size of the customerrsquos meter using meter
equivalency ratios The smallest meter (15mm) which is typical for residential customers has a
Meter Equivalency Ratio of 1 The charge for this meter size is calculated first and is used the
baseline charge for calculating the service charges for the larger meter sizes These are
determined by multiplying the baseline charge by the respective equivalency ratio for each
meter size This method of calculating base or fixed charges for water and sanitary sewer is
widely used in Ontario and is consistent with the American Water Works Association (AWWA)
guidelines for fees and charges The equivalency ratios are shown in Table 7-2
Table 7-2 Meter Equivalent Ratios
Meter Size Equivalency Ratio
15 mm 100
25 mm 202
40 mm 369
50 mm 462
75 mm 966
100 mm 1424
150 mm 2402
200 mm 3627
250 mm 4823
These ratios are also considered in the development of the alternative rate structures and rates
discussed in this section Under the existing rate structure there are services charges for the
water system but not for the sanitary sewer system as shown in Table 7-3
30 DFA Infrastructure International Inc
722 Uniform Consumption Rate
The uniform consumption rate is a water rate that is applied to each customerrsquos metered
consumption regardless of the type of customer the size of the meter and volume consumed
ie a single rate as opposed to multiple rates that vary depending on consumption or customer
type This portion of the charge is consistent with the concept of user pay because the cost to
the customer increases with consumption and is generally within the control of the customer
Under the current structure there are separate uniform rates for water and sanitary sewer (ie
a Water Rate and a Sanitary Sewer Rate) as shown in Table 7-3
Table 7-3 Existing (2016) Water amp Sanitary Sewer Rates and Charges
Meter Size (mm) 2016
Annual Water Service Charges ($year)
15 mm $ 3576
25 mm $ 7213
40 mm $ 13198
50 mm $ 16528
75 mm $ 34543
100 mm $ 50924
150 mm $ 85910
200 mm $ 129695
250 mm $ 172459
Uniform Rate ($msup3)
Water Rate ($msup3) $ 170
Sanitary Sewer Rate ($msup3) $ 217
City of Waterloo Water amp Sanitary Sewer Rate Design Study Final Report amp Water Financial Plan No 112-301
April 1 2016
73 Alternative Rate Structures amp Rates
This section presents the projected future rates for the existing rate structure plus two (2)
alternative structures developed based on the guiding principles discussed in Section 31 and
feedback received from the Council Workshop and Public Open House The future rates under
each option are required to meet the water and sanitary sewer revenue requirements (ie to
recover the full cost of managing the water and sanitary sewer systems based on the
assessment of system costs over the study period) The cost impacts of each option to the
different customer types are discussed and the preferred rate structure option and rates
identified
The first option is to continue using the existing rate structure and develop the rates required
for full cost recovery This is the rate structure described in Section 731 However one of the
main issues identified is the historical decline in water consumption and the resulting increased
risk of not collecting sufficient rate revenues to fully offset the cost of service This can result in
annual deficits if not addressed The existing structure is exposed to this risk as most of the
31 DFA Infrastructure International Inc
City of Waterloo Water amp Sanitary Sewer Rate Design Study Final Report amp Water Financial Plan No 112-301
April 1 2016
revenues are derived from consumption charges Therefore the two (2) alternative rate
structures are geared towards increasing revenue stability while at the same time maintaining
consistency with the other guiding principles to the extent possible In all three (3) options
implementation would begin in 2019 when the existing 2016 to 2018 rates become due for
renewal This is consistent with the feedback received from Council regarding the
implementation strategy
The rates required under each option over the 24-year study period are based on cash flow
analyses undertaken
731 Rate Structure Option 1 ndash Existing Structure
This option is the current structure used by the City to recover the costs of the water and
sanitary sewer systems The service charges and rates approved under By-Law 2016-001 will
continue to apply for the period 2016 to 2018 In 2019 the service charges and rates are
increased as needed to reflect full cost recovery for both systems Under this option the City
would continue to recover approximately 6 of the required water system revenues from the
Water Service Charges (ie guaranteed revenue) and 94 from consumption based on the
Water Rates This means that there would continue to be a heavy reliance on the consumption
based revenues each year which poses risk to revenue recovery Sanitary sewer system costs
would also continue to be recovered through the volumetric Sanitary Sewer Rate only ie
without a service charge component The 6-year water and sanitary sewer rate projections for
Option 1 are provided in Table 7-4
The Water Service Charges are projected to increase by 029 915 and 261 in 2019 (over
2018) 2020 and 2021 respectively The water rate is projected to increase by 878 948 and
291 in 2019 2020 and 2021 Similarly the Sanitary Sewer Rate is projected to increase by
approximately 655 each year from 2019 to 2021 inclusive These increases are necessary to
recover the full cost of service Rate and service charge projections for the study period are
presented in Appendix I
32 DFA Infrastructure International Inc
Table 7-4 Projected Service Charges amp Rates ndash Option 1
Rate
Component 2016 2017 2018 2019 2020 2021
Annual Water Service Charges
Annual Increase () 241
15 mm $3576
25 mm $7224
40 mm $13200
50 mm $16548
75 mm $34572
100 mm $50568
150 mm $85992
200 mm $129816
250 mm $172620
Uniform Wastewater Rate $217
($msup3)
235
$3660
$7404
$13536
$16956
$35436
$51828
$88140
$133056
$176940
262
$3756
$7584
$13872
$17376
$36324
$53124
$90348
$136380
$181368
915 261
$4111 $4219
$8302 $8518
$15185 $15580
$19020 $19516
$39761 $40797
$58151 $59666
$98898 $101474
$149286 $153175
$198531 $203703
$269 $287
Annual Increase () 241 235 287 878 948 291
Uniform Water Rate
($msup3) $170 $174 $179 $195 $213 $219
Annual Increase () 333 323 580 655 655 655
Uniform Rate
$224 $237
029
$3767
$7606
$13912
$17426
$36428
$53276
$90607
$136771
$181888
$253
City of Waterloo Water amp Sanitary Sewer Rate Design Study Final Report amp Water Financial Plan No 112-301
April 1 2016
732 Rate Structure Option 2 ndash 15 of Revenue from Service Charges
Under this option a Sanitary Sewer Service Charge is introduced and 15 of the respective
water and sanitary sewer system revenue requirements would be recovered from the
respective service charges in 2019 The existing rate structure and rates remain in effect until
2018 Note that the new service charges will result in a revenue shift away from the
consumption based revenue resulting in slight decrease in the Water Rate and the Sanitary
Sewer Rate All water and sanitary sewer service charges and rates are increased as needed
beyond 2019 such that the service charges provide approximately 15 of the annual revenues
for the remainder of the study period
This option is intended to improve revenue stability beginning in 2019 After 2019 both sets of
service charges and rates would increase as needed for full cost recovery As a result the base
Water Service Charge (ie for the 15mm meter) is projected to increase from $3756 in 2018 to
$9417 in 2019 (ie an increase of 1501) and 91 thereafter The Water Rate decreases
from $179 msup3 in 2018 to $176 msup3 in 2019 (-16) and 95 thereafter Similarly the Sanitary
Sewer Service Charge is estimated to be $11433 in 2019 but Sanitary Sewer Rate would
decrease to from $237 in 2018 to $215 msup3 in 2019 Table 7-5 and Table 7-6 show the projected
6-year rates for water and sanitary sewer respectively
33 DFA Infrastructure International Inc
Table 7-5 Projected Water Service Charges amp Rates - Option 2
Rate
Component 2016 2017 2018 2019 2020 2021
Annual Water
Service Charges
Annual Increase () 241 235 262 15072 915 261
15 mm $3576 $3660 $3756 $9417 $10279 $10546
25 mm $7224 $7404 $7584 $19014 $20754 $21295
40 mm $13200 $13536 $13872 $34779 $37962 $38951
50 mm $16548 $16956 $17376 $43565 $47551 $48790
75 mm $34572 $35436 $36324 $91070 $99403 $101993
100 mm $50568 $51828 $53124 $133191 $145378 $149165
150 mm $85992 $88140 $90348 $226518 $247244 $253686
200 mm $129816 $133056 $136380 $341928 $373214 $382938
250 mm $172620 $176940 $181368 $454720 $496327 $509258
Uniform Rate
Annual Increase () 241 235 287 -164 948 291
Uniform Water Rate
($msup3) $170 $174 $179 $176 $193 $198
Rate
Component 2016 2017 2018 2019 2020 2021
Annual Wastewater Service Charges
Annual Increase ()
15 mm -
25 mm -
40 mm -
50 mm -
75 mm -
100 mm -
150 mm -
200 mm -
250 mm -
333
Uniform
Wastewater Rate $217
($msup3)
-
-
-
-
-
-
-
-
-
-
-
-
-
-
-
-
-
-
Uniform Rate
323 580
$224 $237
$11433
$23085
$42224
$52890
$110565
$161702
$275007
$415122
$552059
-943
$215
623 624
$12145 $12902
$24523 $26052
$44855 $47653
$56186 $59689
$117454 $124779
$171777 $182489
$292141 $310360
$440986 $468487
$586456 $623028
655 655
$229 $244
Annual Increase ()
City of Waterloo Water amp Sanitary Sewer Rate Design Study Final Report amp Water Financial Plan No 112-301
April 1 2016
Table 7-6 Projected Sanitary Sewer Service Charges amp Rates ndash Option 2
34 DFA Infrastructure International Inc
City of Waterloo Water amp Sanitary Sewer Rate Design Study Final Report amp Water Financial Plan No 112-301
April 1 2016
733 Rate Structure Option 3 ndash Inclining Block Rate Structure
Under this option higher Water and Sanitary Sewer Rates would apply as consumption
increases The features of this structure include the following for both water and sanitary
sewer
bull A Bi-Monthly Service Charge that includes consumption of 14 msup3
This volume allows customers to meet their basic water use needs without
additional consumption (volumetric) charges and is referred to as basic
consumption The full charge applies whether or not the maximum of 14 msup3 is used
bull A First Consumption Block (Block 1) for bi-monthly consumption greater than 14 msup3
but not to exceed 34 msup3
This maximum volume represents the bi-monthly consumption for the average
residential customer The respective water and sanitary volumetric rates apply to
the volume consumed within Block 1 (ie in excess of 14 msup3 to a maximum of 34 msup3)
as measured by the customerrsquos water meter This is in addition to the Bi-Monthly
Service Charges
bull A Second Consumption Block (Block 2) for bi-monthly consumption greater than 34
msup3
The respective water and sanitary volumetric rates applicable to the volume
consumed within Block 2 (ie in excess of 34 msup3) as measured by the customerrsquos
water meter are 12 times the respective rates for the Second Consumption Block
The Bi-Monthly Service Charges also apply
The thresholds defining the volumetric blocks are based on reasonable use by the average
residential customer The Block 2 Rate being set using a factor of 12 times the Block 1 Rate is
intended to provide price point incentive for customers using water within the Block 2 to
conserve According to the AWWA Manual AWWAM1 Principles of Water Rates Fees and
Charges there are no set criteria for establishing the factor except that it must be significant in
order to have an effect on customer behaviour and trigger conservation Note that in some
jurisdictions this price premium is much higher eg City of Hamiltonrsquos block 2 rate is 2 times the
block 1 rate However for the purposes of this rate design study a lower factor of 12 is used to
assess what the impacts might be to the higher consumption customers under a more
moderate premium recognizing that a higher premium would result in even greater impacts
35 DFA Infrastructure International Inc
City of Waterloo Water amp Sanitary Sewer Rate Design Study Final Report amp Water Financial Plan No 112-301
April 1 2016
Inclining block rates are typically considered for use when the following applies
bull The billing system can handle different customer classes and has the capacity to
calculate the consumption within each block for each customer In the Cityrsquos case
adjustments to the existing billing system would be required to incorporate the
block billing
bull The water andor sanitary system is approaching its operating capacity and there is a
need to avoid or defer expansion Note that the issue of plant capacity falls under
the jurisdiction of the Region If inclining rates are to have an impact on deferring
plant capacity expansion then there would need to be a concerted effort by the
Region in collaboration with all the local area municipalities ie the Cityrsquos efforts on
its own would not be sufficient to defer plant capacity expansion
bull There is a desire to promote water conservation through pricing and
bull There is a willingness to incur the extra effort required to communicate and explain
the rationale behind the inclining block rates to customers and administer the
system
Although this structure provides greater portion of the annual revenue through the Service
Charges promotes conservation and facilitates user pay there are some major drawbacks
bull The customers that require high volumes of water as part of their normal business
would pay the higher Block 2 Rate but would not be able to reduce consumption to
benefit from the lower Block 1 Rate
bull There would be very little incentive for the low volume customers to conserve as
most of their consumption would fall within the volume included as part of the fixed
service charge
bull Greater revenue instability because higher revenues expected from the Block 2 may
not materialize as some customers conserve and reduce consumption within that
block or have all their consumption fall within Block 1 at the lower rate
bull The potential loss of higher consumption users that pay the premium Block 2 rate
would mean the loss revenues that would need to be recovered from the lower
consumption users This would require an increase to the Block 1 rate to ensure that
sufficient revenues are recovered Research suggests that reductions in consumption
can be 18 or greater (Ref 17) To address the reduction in consumption it is
assumed that a more conservative reduction of 10 would occur in the Block 2
volumes under Option 3
bull The complexity of administering the data collection and billing to align with the
inclining block as part of the ongoing operations This would increase the annual
operating cost The amount of this increase was not available at the time of
preparing this report
36 DFA Infrastructure International Inc
This option would become effective in 2019 As a result the base Water Service Charge (ie
for the 15mm meter) is projected to increase from $3756 in 2018 to $15841in 2019 (ie an
increase of 32175) However the Water Rate for Block 1 is projected to increase from
$179 in 2018 to $189 in 2019 ie an increase of 535 Both the service charges and rates
would increase by approximately 950 and 293 in 2020 and 2021 respectively but the
average increases needed for full cost recovery are projected to be approximately 3
annually over the study period Similarly the Sanitary Sewer Service Charge is estimated to
be $19822 in 2019 but Sanitary Sewer Rate for Block 1 would decrease by 294 Both the
service charges and rates would increase by 657 in 2020 and 2021 Table 7-7 and
Table 7-8 show the projected 6-year rates for water and sanitary sewer respectively
The annual service charges and rates and their respective increases for each year between 2021
and 2039 are shown in Appendix I
Table 7-7 Projected Water Service Charges amp Rates ndash Option 3
Rate
Component 2016 2017 2018 2019 2020 2021
Annual Increase
()
15 mm
25 mm
40 mm
50 mm
75 mm
100 mm
150 mm
200 mm
250 mm
Annual Increase
()
Block 1 ($msup3)
Block 2 ($msup3)
241
$3576
$7224
$13200
$16548
$34572
$50568
$85992
$129816
$172620
241
$170
Annual Water Service Charges
235 262 32175
$3660 $3756 $15841
$7404 $7584 $31985
$13536 $13872 $58505
$16956 $17376 $73283
$35436 $36324 $153196
$51828 $53124 $224050
$88140 $90348 $381042
$133056 $136380 $575182
$176940 $181368 $764919
Uniform Rate
235 287 535
$174 $179 $189
$226
950
$17345
$35023
$64062
$80244
$167747
$245330
$417233
$629812
$837569
950
$206
$248
293
$17853
$36049
$65938
$82593
$172659
$252515
$429452
$648256
$862098
293
$213
$255
City of Waterloo Water amp Sanitary Sewer Rate Design Study Final Report amp Water Financial Plan No 112-301
April 1 2016
37 DFA Infrastructure International Inc
Table 7-8 Projected Sanitary Sewer Service Charges amp Rates ndash Option 3
Rate
Component 2016 2017 2018 2019 2020 2021
Annual Sanitary Sewer Service Charges
Annual Increase
()
15 mm -
25 mm -
40 mm -
50 mm -
75 mm -
100 mm -
150 mm -
200 mm -
250 mm -
Uniform Rate
Annual Increase 333
()
Block 1 ($msup3) $217
Block 2 ($msup3)
-
-
-
-
-
-
-
-
-
323
$224
-
-
-
-
-
-
-
-
-
580
$237
$19322
$39015
$71363
$89389
$186865
$273291
$464787
$701594
$933030
-294
$230
$276
657
$20591
$41577
$76050
$95260
$199137
$291239
$495311
$747670
$994305
657
$245
$294
657
$21944
$44309
$81046
$101517
$212219
$310371
$527848
$796784
$1059622
657
$261
$313
City of Waterloo Water amp Sanitary Sewer Rate Design Study Final Report amp Water Financial Plan No 112-301
April 1 2016
734 Potential Customer Impacts
The potential cost impacts to customers are driven by the following
bull The 2016-2018 rates are not at the point at which they provide sustainable levels of
revenues to recover the full cost of service Therefore rate increases are required
beginning in 2019 to bring revenues up to sustainable levels regardless of the rate
structure option Council approves
bull Changes to the rate structure to obtain more revenues from the services charges to
improve revenue security As the base service charges increase there is a greater
impact to the low consumption user than the higher consumption user Therefore it is
recommended that staff continue to investigate the Region-wide affordability program
to help offset this impact to eligible users
bull The inclining rates of Option 3 which tends to increase costs to the high consumption
user compared the low consumption user The number of customers estimated to be in
each consumption block based on current billing and consumption data is shown in
38 DFA Infrastructure International Inc
City of Waterloo Water amp Sanitary Sewer Rate Design Study Final Report amp Water Financial Plan No 112-301
April 1 2016
Table 7-9 This indicates that approximately 31 of the customers would be exposed to
the higher Block 2 rate
Table 7-9 Number of Customers in Each Consumption Block (Option 3)
Customers
Block Number
Service Charge Only 5798 19
Service Charge + Block 1 15045 50
Service Charge + Block 1 + Block 2 9517 31
Total 30360 100
The potential customer impacts under each option are assessed by determining the annual
amount the average customer in each customer class would pay in 2019 for both water and
wastewater compared to 2018 The average customers are defined as follows
bull Small Residential - with a 15mm water meter and average annual
consumption of 120 msup3 per year
bull Average Residential - with a 15mm water meter and average
annual consumption of 204 msup3 per year
bull Residential Small Apartments - with a 25mm water meter and
average annual consumption of 1060 msup3 per year
bull Small Commercial amp Industrial - with a 40mm water meter and average annual consumption of 1215 msup3 per year
bull Large Commercial amp Industrial - with a 50 mm water meter and average annual consumption of 8227 msup3 per year
bull Largest Commercial amp Industrial - with a 50 mm water meter and
average annual consumption of 192000 msup3 per year
The average Large Commercial and Industrial customer is determined by the most common
meter size and the average consumption for that meter size Table 7-10 illustrates the 2019
annual cost to the average customer in each customer class and percentage increase compared
to 2018 under the three (3) rate structure options It is important to note that the change in
cost in 2019 is a one-time adjustment to reflect the change in rate structure and full cost
recovery Option 1 is projected to have a relatively consistent cost impact to all customer
classes ie 700-751 in 2019 Option 2 is projected to have a much greater cost impact on
the residential sector (2619 for residential small and 1347 for average residential
customers) than on the non-residential sector Large commercial and industrial customers
39 DFA Infrastructure International Inc
would benefit from reductions of 375 to 598 Option 3 is projected to result in reductions
to the small and average residential customers (approximately 641 and 364 respectively)
but would result in major increase to the other large customer classes ranging from
approximately 2087 to 3248 for the Residential Small Apartments and Non-Residential
Customers These are significant increases that would require more specific consultation with
the impacted customer classes prior to considering implementation Under all three (3) options
the annual increases beyond 2019 would be approximately 3-5 for all customer classes ie
after the 2019 increase and rate structure changes are made and become the new baseline
Table 7-10 Annual 2019 vs 2018 Costs to Customers
Description 2018 Option 1
(2019)
Option 2
(2019)
Option 3
(2019)
Small Residential - Single Family Homes
Meter Size - 15 mm (Equivalency Unit - 100)
Average Consumption - 120 msup3year
Annual Increase to Total Bill () 7 26 -6
Annual Increase to Total Bill ($) $3758 $14059 -$3443
Annual Bill ($) $53676 $57434 $67735 $50233
Average Residential - Single Family Homes
Meter Size - 15 mm (Equivalency Unit - 100)
Average Consumption - 204 msup3year
Annual Increase to Total Bill () 7 13 -4
Annual Increase to Total Bill ($) $6382 $11934 -$3223
Annual Bill ($) $88620 $95002 $100554 $85397
Residential - Small Apartments
Meter Size - 25 mm (Equivalency Unit - 202)
Average Consumption - 1060 msup3year
Annual Increase to Total Bill () 7 2 23
Annual Increase to Total Bill ($) $33125 $7706 $102687
Annual Bill ($) $448544 $481669 $456250 $551231
Small Commercial and Industrial
Meter Size - 40 mm (Equivalency Unit - 369)
Average Consumption - 1215 msup3year
Annual Increase to Total Bill () 7 6 32
City of Waterloo Water amp Sanitary Sewer Rate Design Study Final Report amp Water Financial Plan No 112-301
April 1 2016
40 DFA Infrastructure International Inc
Description 2018 Option 1
(2019)
Option 2
(2019)
Option 3
(2019)
Annual Increase to Total Bill ($) $37983 $32403 $168648
Annual Bill ($) $519312 $557295 $551715 $687960
Large Commercial and Industrial
Meter Size - 50 mm (Equivalency Unit - 462)
Average Consumption - 8227 msup3year
Annual Increase to Total Bill () 7 -4 23
Annual Increase to Total Bill ($) $256961 -$128984 $803285
Annual Bill ($) $3439672 $3696634 $3310689 $4242957
Largest Commercial and Industrial
Meter Size - 50 mm (Equivalency Unit - 462)
Average Consumption - 192000 msup3year
Annual Increase to Total Bill () 8 -6 21
Annual Increase to Total Bill ($) $5996030 -$4776829 $16668939
Annual Bill ($) $79889376 $85885406 $75112547 $96558315
Table 7-11 summarizes the customer impacts under each option and compares the potential
impacts under Options 2 and 3 to Option 1 ie the base option
Table 7-11 Annual 2019 vs 2018 Costs to Customers
Customer
Type Option 1
Current Rate Structure
Customer Impacts (2019 Compared to 2018)
Option 2
15 Revenue from Service
Charges
Option 3
Inclining Block
bull Annual cost would bull Annual cost would increase by
bull Annual cost would decrease by
Small increase by $3758 $14059 (2619) or $1172 $3443 (641) or $287 per
Residential (700) or $313 per per month in 2019 month in 2019
Single Family month in 2019 bull In 2019 customers would pay bull In 2019 customers would pay
Homes bull Rate increases beyond approximately $858 more per approximately $600 less per
120 msup3 per 2019 are an average of month compared to Option 1 month compared to Option 1
year 3 per year bull Rate increases beyond 2019 bull Rate increases beyond 2019 are
are an average of 3 per year an average of 3 per year
Average bull Annual cost would bull Annual cost would increase by bull Annual cost would decrease by
Residential increase by $6382 $11934 (1347) or $995 per $3223 (364) or $269 per
Single Family (720) or $532 per month in 2019 month in 2019
Homes month in 2019 bull In 2019 customers would pay bull In 2019 customers would pay
204 msup3 per bull Rate increases beyond approximately $463 more per approximately $800 less per
year 2019 are an average of month compared to Option 1 month compared to Option 1
City of Waterloo Water amp Sanitary Sewer Rate Design Study Final Report amp Water Financial Plan No 112-301
April 1 2016
41 DFA Infrastructure International Inc
Customer Impacts (2019 Compared to 2018)
Customer
Type Option 1
Current Rate Structure
Option 2
15 Revenue from Service
Charges
Option 3
Inclining Block
3 per year bull Rate increases beyond 2019 bull Rate increases beyond 2019 are
are an average of 3 per year an average of 3 per year
bull Annual cost would bull Annual cost would increase by
increase by $33125 $7706 (172) or $642 per Residential
(738) or $2760 per month in 2019 Small
month in 2019 bull In 2019 customers would pay Apts
bull Rate increases beyond approximately $2118 less per 1060 msup3 per
2019 are an average of month compared to Option 1 year
3 per year bull Rate increases beyond 2019
are an average of 3 per year
bull Annual cost would bull Annual cost would increase by
increase by $37983 $32403 (624) or $2700 per Small
(731) or $3165 per month in 2019 Commercial amp
month in 2019 bull In 2019 customers would pay Industrial
bull Rate increases beyond approximately $465 less per 1215 msup3 per
2019 are an average of month compared to Option 1 year
3 per year bull Increases beyond 2019
average of 3 per year
bull Annual cost would bull Annual cost would decrease
increase by $256961 by $128984 (375) or
Large (747) or $21413 per $10749 per month in 2019
Commercial amp month in 2019 bull In 2019 customers would pay
Industrial bull Rate increases beyond approximately $32162 less
8227 msup3 per 2019 are an average of per month compared to year 3 per year Option 1
bull Rate increases beyond 2019
are an average of 3 per year
bull Annual cost would bull Annual cost would decrease
increase by $5996030 by $4776829 (598) or
Largest (751) or $499669 per $398069per month in 2019
Commercial amp month in 2019 bull In 2019 customers would pay
Industrial bull Rate increases beyond approximately $897738 less
192000 msup3 per 2019 are an average of per month compared to
year 3 per year Option 1
bull Rate increases beyond 2019
are an average of 3 per year
bull Annual cost would increase by
$102687 (2289) or $8557
per month in 2019
bull In 2019 customers would pay
approximately $5797 more per
month compared to Option 1
bull Rate increases beyond 2019 are
an average of 3 per year
bull Annual cost would increase by
$168648 (3248) or $14054
per month in 2019
bull In 2019 customers would pay
approximately $10889 more
per month compared to Option
1
bull Increases beyond 2019 are an
average of 3 per year
bull Annual cost would increase by
$803285 (2335) or $66940
per month in 2019
bull In 2019 customers would pay
approximately $45527 more
per month compared to Option
1
bull Rate increases beyond 2019 are
an average of 3 per year
bull Annual cost would increase by
$16668939 (2087) or
$1389078 per month in 2019
bull In 2019 customers would pay
approximately $889409 more
per month compared to Option
1
bull Rate increases beyond 2019 are
an average of 3 per year
City of Waterloo Water amp Sanitary Sewer Rate Design Study Final Report amp Water Financial Plan No 112-301
April 1 2016
735 Options Analysis amp Preferred Option
A qualitative assessment of how well each option aligns with the Guiding Principles in Section
31 is presented in this Section Table 7-12 shows the results using full or partial circles Full
42 DFA Infrastructure International Inc
alignment with the respective guiding principle is depicted by a full circle some alignment by a
partial circle and no alignment by no circle
Table 7-12 Qualitative Analysis of Rate Options
Guiding Principles Option 1 Option 2 Option 3
Full Cost Recovery
Revenue Stability
User Pay
Fairness and Equity
Uniform Rate Structure
Water Conservation
Capital Financing
Ease of Administration
Affordability
City of Waterloo Water amp Sanitary Sewer Rate Design Study Final Report amp Water Financial Plan No 112-301
April 1 2016
Full Cost Recovery
bull All options are designed to recover the full costs of managing the water and sanitary
sewer systems over the study period
Revenue Stability
bull None of the three (3) options have fixed charge structures that fully align with the cost
structures for water and sanitary sewer but they all provide a portion of revenues
through the fixed charges
bull Option 1 offers the least revenue stability as only 6 of water revenues and 0 of the
sanitary sewer revenues would be guaranteed This is especially important given that
the majority of costs to manage the water and sanitary sewer systems are for the most
part fixed
bull Under Option 3 a larger portion of revenue (25 -27) would be recovered from the
service charges However there is added revenue instability because the higher
revenues expected from Block 2 at the higher rate may not materialize as some
43 DFA Infrastructure International Inc
City of Waterloo Water amp Sanitary Sewer Rate Design Study Final Report amp Water Financial Plan No 112-301
April 1 2016
customers conserve and reduce consumption within that block or have all their
consumption fall within Block 1 at the lower rate This would result in a reduction of
total revenue notwithstanding the portion that is guaranteed from the Service Charges
There is also the risk of losing one or more high volume users and the revenues
generated from those customers The revenue loss would have to be recovered from
the low volume users
bull Option 2offers the best revenue stability of the three (3) options with 15 from the
fixed charges and does not have the added revenue risks associated with Option 3
regarding Block 2 revenues
User Pay
bull The concept of user pay is based on the philosophy that those who use more water
should pay more Under all three (3) options customers would pay more if their
consumption increases as they all have a consumption rate component However
Option 3 aligns the best with this principle due to the higher rate charged for Block 2
Fairness and Reasonableness
bull All options promote fairness and equity as the service charges plus a consumption
charge is a reasonably fair approach to cost recovery to both the City as the
owneroperator and the customers This is the structure that is most common across
Ontario
bull Each class of customers is exposed to the same ratios in the calculation of their service
charges regardless of the rate structure option
bull All customers would pay the same consumption rate that applies under each option ie
the customers are exposed to the same consumption rate regardless of customer class
However customers that consume high volumes because of their business practices
may not be able to realistically reduce their consumption to benefit from the lower
Block 1 rate under Option 3 This may be considered to be unfair to these customers
because they may be unable to reduce their consumption The cost increase to the non-
residential sector (estimated to be 31 of the customers) is expected to be in the range
of 20 to 32 This is significant even at a relatively low price premium of 12 times the
Block 1 rate and could have adverse effects on attracting or retaining business within
the City
bull Under Option 1 from a high level equity perspective the residential and non-residential
sectors would pay their fair share Residential customers consume approximately 55
of the water and contribute 55 of the annual revenue while the ICI consumers
account for the remaining 45 of consumption and revenues This is because the
amount paid varies almost directly with consumption due to the low fixed charges
Under Option 2 the residential sector would pay approximately 5 more than they
44 DFA Infrastructure International Inc
City of Waterloo Water amp Sanitary Sewer Rate Design Study Final Report amp Water Financial Plan No 112-301
April 1 2016
consume while the non-residential sector would pay 5 less The reverse is true under
Option 3 where the non-residential sector would pay approximately 5 more than they
consume Therefore Option 1 is a fair and reasonable rate structure
Uniform Rate Structure
bull Options 1 and 2 have a uniform rate whereas Option 3 has inclining block rates
However Option 3 partially meets this principle because it addresses Councilrsquos request
to investigate an inclining block option
Water Conservation
bull All options promote water conservation as a significant proportion of the overall
revenue would be derived from consumption Option 3 provides the greatest incentive
to reduce consumption due to the inclining block However Options 1 and 2 offer a
reasonable incentive for customers to reduce consumption with 85 to 94 of
revenues from consumption for Options 2and 1 respectively
Capital Financing
bull All options are based on a combination of reserve and debt financing for capital projects
based on the feedback received from Council via the workshop Debt financing was
incorporated to assist with addressing the water capital backlog over the next 20 years
Easy to of Administration
bull Option 1 is the easiest to administer because it is the existing rate structure Option 2
will require some modifications to establish a service charge for sanitary sewer Option
3 will have the greatest impact on administration due to the complexity of managing the
information and billing requirements and the added cost to implement and administer
Affordability
bull Eligible customers stand to benefit from the affordability program when it is established
regardless of the rate structure option
Summary
Based on a qualitative review all options would provide the level of funding to be fully
sustainable over the long-term Although Option 3 is best for water conservation and user pay
it has significant disadvantages including
- Revenue uncertainty resulting from conservation due to the higher Block 2 rate
45 DFA Infrastructure International Inc
City of Waterloo Water amp Sanitary Sewer Rate Design Study Final Report amp Water Financial Plan No 112-301
April 1 2016
- Potentially high impacts (20 to 32 increases) to the non-residential customers
that may affect t he attraction and r etention of b usiness These levels of
increases are significant a nd would r equire further dialogue with t he business
community and volume data analysis prior to confirming the thresholds for each
block and t he factor to be used f or setting the Block 2 rate and
- The risk of shifting a much larger portion o f costs to the residential sector should
business customers relocate or discontinue operations
Option 2 offers the most predictable revenues and would ensure that at least 15 of the
annual water revenues would be guaranteed while providing sufficient incentive for customers
to conserve Therefore Option 2 would be best strictly from a revenue stability perspective
Option 1 (existing rate structure) seems to be the best based on fairness and reasonableness
Its major disadvantage is the low level of revenue stability as only a marginal amount of the
annual revenue is collected via fixed fees This lack of revenue stability would be offset to some
extent by the introduction of the rate stabilization reserves Therefore Option 1 could be
remain a viable option moving forward should Council not wish to proceed with Option 2 due
to the relatively large impact to the small and average residential customers in 2019 compared
to 2018
46 DFA Infrastructure International Inc
City of Waterloo Water amp Sanitary Sewer Rate Design Study Final Report amp Water Financial Plan No 112-301
April 1 2016
8 OReg 45307 Water System Financial Plan No 112-301
Regulation 18807 under the Safe Drinking Water Act requires Ontario municipalities to apply
for and obtain Drinking Water System Licences as part of their overall DWQMS One of the
requirements of holding a valid drinking water licence is preparing and submitting to the
Province an updated financial plan in accordance with OReg 45307 The financial plan must
include financial statements on the following
bull The proposed or projected financial position of the drinking water systems
bull The proposed or projected gross cash receipts and gross cash payments
bull The proposed or projected financial operations of the drinking water system and
bull Details on the extent to which the above information applies to the replacement of
lead service pipes if applicable
Appendix H lists each requirement of the regulation and references the respective financial
statements and other relevant information required under each regulatory requirement The
financial plan must apply to a period of at least six (6) years with the first year being the year
the existing license expires In the Cityrsquos case an updated Water System Financial Plan No112-
301 is required for the period 2016 to 2021 This plan is based on the results of the rate study
Upon Councilrsquos approval the financial plan would be made available to the public at no charge
and posted on the Cityrsquos website It will also be submitted to the Province as part of the Cityrsquos
drinking water license renewal application The license renewal application deadline is June 1
2016
81 Tangible Capital Assets (TCA) Analysis
The results of the rate study contained in this report are used as the basis for preparing the
water system financial plan The Cityrsquos Tangible Capital Asset inventories were also used in the
preparation of the water system financial plan The amortization of the tangible capital assets is
shown as a ldquonon-cashrdquo annual cost that reflects the annual ldquouserdquo of assets until the end of their
respective useful lives Allowances are made to finance the replacement and or rehabilitation
of the existing assets once they ldquoexpirerdquo and can no longer play a role in providing the required
drinking water service to customers It should be noted however that since amortization is
based on the original (historical) cost at the time the asset was placed in service it does not
account for inflation since the year of installation Therefore basing asset replacement costs on
amortization alone is not sufficient to cover the future replacement needs
The TCA projections contained in the Cityrsquos water financial plan are based on the following
assumptions
47 DFA Infrastructure International Inc
City of Waterloo Water amp Sanitary Sewer Rate Design Study Final Report amp Water Financial Plan No 112-301
April 1 2016
bull Amortization of existing assets is based on the Cityrsquos Tangible Capital Assets Policies and
Procedures Amortization of new infrastructure investments is based on straight line
depreciation with full year depreciation charged in the year of acquisition
bull Historical costs life expectancy and remaining useful life are as identified in the TCA
data provided by the City
bull Fully depreciated assets continue to be used in service ie no asset removals and
bull New assets to be acquired are based on the capital forecast presented The forecast
includes projects in the Cityrsquos Capital Budget Forecast and asset replacement projections
based on the Cityrsquos Asset Management Plan
Asset Value
The water system is comprised of the following capital asset classes
bull Water Mains
bull Hydrants and
bull Valves
Table 8-1 shows the current capital asset value based on historical cost and accumulated
amortization to 2015 This is reflected as the net book value (NBV) ie the ldquoaccountingrdquo value
and indicates that the water system as a whole is approximately 30 depreciated or has
approximately 70 remaining life based on the TCA data This suggests that the water system
assets are relatively new
Table 8-1 Asset Amortization and 2015 Net Book Value (NBV)
2015 Water Asset Details
Historical Cost $93412072 100
Accumulated Amortization $27992677 30
Net Book Value (2015) $65419394 70
82 Financial Statements
This financial plan involves the review analysis and assessment of financial information
contained in the rate study including costs revenues debt cash transactions and Tangible
Capital Assets (TCA) to prepare the following three (3) financial statements covering the period
2016 - 2021 as required under OReg 45307
bull Statement of Financial Position
bull Statement of Operations and
bull Statement of Cash Flow
48 DFA Infrastructure International Inc
City of Waterloo Water amp Sanitary Sewer Rate Design Study Final Report amp Water Financial Plan No 112-301
April 1 2016
821 Statement of Financial Position
The Statement of Financial Position is presented in Table 8-2 This statement summarizes the
Cityrsquos water-related financial and non-financial assets ie Tangible Capital Assets (TCA) and
liabilities and provides the net financial asset (or net debt) position and accumulated surplus
related to managing the water system The financial assets are primarily cash balances in the
water reserves and reserve funds Liabilities consist of development charge reserve fund
balances (ie deferred revenues) and long-term debt The non-financial assets (TCA) include the
Cityrsquos water infrastructure The historical costs are amortized over the asset life to arrive at the
net book value each year from 2016 to 2021 New assets are added in the years acquired
developed or built Contributed assets are primarily new infrastructure and facilities that would
be transferred to the Cityrsquos ownership and control by developers as they are completed
However this is assumed to be zero It is also assumed that other non-financial assets such as
inventory and prepaid expenses are zero
Contained within the Statement of Financial Position are important indicators the first being
net financial assets (or net debt) which is defined as the difference between financial assets and
liabilities This indicator provides a measure of the water systems future revenue
requirement Another important indicator in the Statement of Financial Position is the
accumulated surplus This indicator provides a measure of the resources available to the City
for managing its water system The accumulated surplus is projected to increase from
approximately $726 million in 2016 to approximately $863 million by 2021 The accumulated
surplus consists of the net financial assets that are available to fund future operations plus the
non-financial assets that are made up of net TCA balance representing past investments in
water infrastructure It is important to note that the non-financial assets (TCA) cannot be
readily monetized without affecting the delivery of water operations
Table 8-2 indicates that in 2016 the Citys water system will be in a net financial asset position
of $42 million This will be reduced to a net financial asset position of $25 million by 2021 The
net financial asset position indicates that financial resources will be available to fund future
operations The reduced net financial assets is due to a combination of a increase in the cash
position that is more than offset by an increase in liabilities with increases in deferred revenue
balances and the introduction of debt in 2019
The next important indicator contained in the Statement of Financial Position is the net book
value of TCA Another important indicator in the Statement of Financial Position is the
accumulated surplus This indicator provides a measure of the resources available to the City
for managing its water system The accumulated surplus is projected to increase from
approximately $726 million in 2016 to approximately $863 million by 2021 The accumulated
surplus consists of the net financial assets that are available to fund future operations plus the
non-financial assets that are made up of net TCA balance representing past investments in
water infrastructure It is important to note that the non-financial assets (TCA) cannot be
readily monetized without affecting the delivery of water operations
49 DFA Infrastructure International Inc
City of Waterloo Water amp Sanitary Sewer Rate Design Study Final Report amp Water Financial Plan No 112-301
April 1 2016
The next important indicator contained in the Statement of Financial Position is the net book
value of TCA Another important indicator in the Statement of Financial Position is the
accumulated surplus This indicator provides a measure of the resources available to the City
for managing its water system The accumulated surplus is projected to increase from
approximately $726 million in 2016 to approximately $863 million by 2021 The accumulated
surplus consists of the net financial assets that are available to fund future operations plus the
non-financial assets that are made up of net TCA balance representing past investments in
water infrastructure It is important to note that the non-financial assets (TCA) cannot be
readily monetized without affecting the delivery of water operations
Table 8-2 shows that net TCA are expected to grow by $154 million over the forecast period or
from $684 million in 2016 to $838 million 2021 This indicates that the City has plans to invest
in significant tangible capital assets in excess of the consumption of existing assets Further a
consumption ratio consisting of the accumulated amortization of the Citys TCA as a percent of
historical cost ratio highlights the aged condition of the assets and their potential replacement
needs The Citys Water Asset Consumption Ratio actually declines over the forecast period
from 30 to 28 as newly acquired or constructed assets would more than offset the
consumption of existing assets
Another important indicator in the Statement of Financial Position is the accumulated surplus
This indicator provides a measure of the resources available to the City for managing its water
system The accumulated surplus is projected to increase from approximately $726 million in
2016 to approximately $863 million by 2021 The accumulated surplus consists of the net
financial assets that are available to fund future operations plus the non-financial assets that
are made up of net TCA balance representing past investments in water infrastructure It is
important to note that the non-financial assets (TCA) cannot be readily monetized without
affecting the delivery of water operations
50 DFA Infrastructure International Inc
City of Waterloo Water amp Sanitary Sewer Rate Design Study Final Report amp Water Financial Plan No 112-301
April 1 2016
Table 8-2 Statement of Financial Position
Statement of Financial Position 2016 2017 2018 2019 2020 2021
Financial Assets
CashReceivables and Investment $6767426 $6080033 $6563808 $7004435 $6711995 $7206337
Total Financial Assets $6767426 $6080033 $6563808 $7004435 $6711995 $7206337
Financial Liabilities
Accounts Payable amp Deferred Revenue $2068633 $1525462 $1732356 $2364790 $2872351 $3366692
Long-term Liabilities $534197 $481614 $427454 $858621 $1169636 $1380142
Total Financial Liabilities $2602831 $2007076 $2159810 $3223411 $4041987 $4746835
Net Financial Assets (Net Debt) $4164595 $4072958 $4403999 $3781024 $2670009 $2459502
Non-Financial Assests
Tangible Capital Assets $97235501 $101396201 $104426305 $108247701 $112142203 $116085079
Accumulated Amortization ($28800415) ($29534931) ($30410031) ($31003111) ($31622734) ($32265603)
Total Non-Financial Assets $68435086 $71861270 $74016275 $77244590 $80519469 $83819476
Accumulated Surplus $72599681 $75934228 $78420273 $81025614 $83189478 $86278979
Financial Indicators 2016 2017 2018 2019 2020 2021
Increase (Decrease) in Net Financial Assets $392962 ($91637) $331041 ($622974) ($1111016) ($210506)
Increase (Decrease) in Net Tangible Capital Assets $3015692 $3426184 $2155004 $3228316 $3274879 $3300007
Increase (Decrease) in Accumulated Surplus $3408654 $3334547 $2486045 $2605341 $2163864 $3089501
Water Asset Consumption Ratio 30 29 29 29 28 28
822 Statement of Operations
The Statement of Operations is presented in Table 8-3 It summarizes the annual revenues and
expenses associated with managing the Cityrsquos water system It provides a report on the
transactions and events that have an influence on the accumulated surplus The main revenue
items included are
bull Revenues from Water Rates and Charges
bull Earned Revenues (earned development charges) and
bull Other Revenues (miscellaneous fees and charges recoveries etc)
The main expense items are
bull The annual cost of operating and maintaining the water system including the cost of
water purchases from the Region and
bull Amortization expenses on existing and added TCA
The operating surplus (or deficit) is an important indicator contained in the Statement of
Operations An operating surplus (deficit) measures whether operating revenues generated in a
year were sufficient to cover operating expenses incurred in that year It is important to note
that an annual surplus is necessary to ensure funds will be available to address non-expense
items such as TCA acquisitions over and above amortization expenses reservereserve fund
contributions for asset replacement and rate stabilization and repayment of outstanding debt
principal A ratio of operating surplus to total revenue is shown in Table 8-3 to reflect the
percent of total revenue that can be allocated to funding the non-expense items noted above
51 DFA Infrastructure International Inc
City of Waterloo Water amp Sanitary Sewer Rate Design Study Final Report amp Water Financial Plan No 112-301
April 1 2016
This ratio decreases from 15 in 2016 to 12 in 2021 The higher the ratio the greater
proportion of operating revenues that are available for paying down debt purchasing capital
assets and setting aside in reserve for future use Cash generated from operations is discussed
in the Statement of Cash Flows section
Table 8-3 Statement of Operations
Statement of Operations 2016 2017 2018 2019 2020 2021
Water Revenue
User Revenue $19471007 $20143317 $20623089 $21822413 $23024080 $24610398
Earned Revenue $1763719 $1649661 $859546 $490371 $497236 $504197
Other Revenue $1437931 $1445213 $1452652 $1463926 $475536 $487492
Total Revenues $22672657 $23238191 $22935287 $23776710 $23996852 $25602087
Water Expenses
Gross $5466741 $5569487 $5679838 $5902122 $6034310 $6171363
Water Purchased from Region $12404140 $12875909 $13262328 $13703114 $14157651 $14635550
Operating Expenses $17870881 $18445396 $18942166 $19605236 $20191961 $20806913
Interest on Debt $0 $0 $0 $0 $25759 $35089
Amortization 1393123 1458248 1507076 1566133 1615269 1670585
Total Expenses $19264004 $19903645 $20449242 $21171369 $21832989 $22512586
Annual Surplus(Deficit) $3408654 $3334547 $2486045 $2605341 $2163864 $3089501
Accumulated Surplus(Deficit) Beginning of Year $69191027 $72599681 $75934228 $78420273 $81025614 $83189478
Accumulated Surplus (Deficit) End of Year $72599681 $75934228 $78420273 $81025614 $83189478 $86278978
Financial Indicators 2016 2017 2018 2019 2020 2021
Increase (Decrease) in Total Revenues ($580510) $565534 ($302904) $841422 $220142 $1605235
Increase (Decrease) in Total Expenses $879750 $639641 $545597 $722127 $661620 $679598
Increase (Decrease) in Annual Surplus ($1460260) ($74107) ($848501) $119296 ($441478) $925637
Operating Surplus Ratio 15 14 11 11 9 12
823 Statement of Cash Flow
The Statement of Cash Flow is presented in Table 8-4 This statement summarizes the main
cash inflows and outflows related to the water system in four (4) main areas - operating
capital investing and financing and shows the annual changes in cash
The operating cash transactions begin with the surplus or deficit identified in the Statement of
Operations This figure is adjusted to add or subtract non-cash items that were included as
revenues or expenses (eg amortization expenses) It is assumed that there are no ldquoinvesting
activitiesrdquo over the period The capital section indicates the amounts to be spent to acquire
capital assets (TCA) or to be received from the sale of assets In the Cityrsquos case it is assumed
that there are no assets to be sold to generate cash The financing section identifies the funds
to be received from development charges receipts ProvincialFederal Grants and proceeds
from the issuance of debenture as cash inflows and the portion of debt repaid as cash
outflows No grant funding is projected over the forecast period
Table 8-4 indicates that cash is generated from operations which is used in funding the
acquisition of TCA and towards building internal reserves The Citys cash position is projected
to increase over the forecast period from $67 million in 2016 to $72 million in 2021
52 DFA Infrastructure International Inc
City of Waterloo Water amp Sanitary Sewer Rate Design Study Final Report amp Water Financial Plan No 112-301
April 1 2016
Table 8-4 Statement of Cash Flow
Statement of Cashflows 2016 2017 2018 2019 2020 2021
Cash Provided by
Operating Activities
Annual Surplus(Deficit) $3408654 $3334547 $2486045 $2605341 $2163864 $3089501
Non-Cash Items
Amortization $1393123 $1458248 $1507076 $1566133 $1615269 $1670585
Earned Revenue ($1763719) ($1649661) ($859546) ($490371) ($497236) ($504197)
Net Change in Cash Provided by Operating Activities $3038057 $3143134 $3133575 $3681103 $3281896 $4255888
Capital Activities
Purchase of TCA ($4408815) ($4884432) ($3662081) ($4794449) ($4890148) ($4970592)
Net Change in Cash Used in Capital Activities ($4408815) ($4884432) ($3662081) ($4794449) ($4890148) ($4970592)
Financing Activities
DC Collections $1088065 $1106489 $1066441 $1122805 $1004797 $998539
ProvincialFederal Grants $0 $0 $0 $0 $0 $0
Proceeds From Long-Term Debt $0 $0 $0 $486953 $410951 $349288
Repayment of Long-Term Debt ($51052) ($52583) ($54161) ($55785) ($99936) ($138782)
Net Change in Cash Used in Financing Activities $1037013 $1053906 $1012280 $1553972 $1315812 $1209045
Net Change in Cash and Cash Equivalents ($333744) ($687392) $483775 $440627 ($292440) $494342
Cash and Cash Equivalents Beginning of the Year $7101170 $6767426 $6080033 $6563808 $7004435 $6711995
Cash and Cash Equivalents End of the Year $6767426 $6080033 $6563808 $7004435 $6711995 $7206337
824 Lead Service Pipe Removal
The financial plan is also required to detail the extent to which the information described above
relates directly to the replacement of lead service pipes
The City of Waterloo 2016-2025 Capital Budget outlines the proposed rehabilitation and
reconstruction projects for the next 10 years Lead services are replaced as part of watermain
rehabilitation projects andor road reconstruction projects when undertaken Although not all
the streets contain lead services all of the water services to the property line are replaced for
every rehabilitation and reconstruction project
Lead services are also replaced individually when they are found in the field or if requested by
the owner if the full rehabilitation project and reconstruction project has not been identified in
the capital forecast and if the new service can be connected to the customer side
53 DFA Infrastructure International Inc
City of Waterloo Water amp Sanitary Sewer Rate Design Study Final Report amp Water Financial Plan No 112-301
April 1 2016
9 Sanitary Sewer System Financial Plan
Preparing a Sanitary Sewer System Financial Plan is not mandatory but has become a municipal
best practice over the past few years It is typically prepared in accordance with the
requirements of OReg 45307 which applies to water systems
This financial plan involves the review analysis and assessment of financial information
contained in the rate study including costs revenues debt cash transactions and Tangible
Capital Assets (TCA) to prepare the following three (3) financial statements covering the period
2016 to 2021 as required under OReg 45307
bull Statement of Financial Position
bull Statement of Operations and
bull Statement of Cash Flow
Appendix H lists each requirement of the regulation and references the respective financial
statements and other items that contain relevant information required under each item The
financial plan applies to a period of (6) six years from 2016 to 2021 to be consistent with the
period covered by the Water System Financial Plan It is anticipated that the financial plan
would be made available to the public at no charge on the Cityrsquos website following final
approval of the rate study and financial plan by Council
91 Tangible Capital Assets (TCA) Analysis
The results of the rate study contained in this report are used as the basis for preparing the
wastewater system financial plan The Cityrsquos Asset Inventories were also used in the
preparation of the wastewater system financial plan The amortization of the tangible capital
assets is shown as a ldquonon-cashrdquo annual cost that reflects the annual ldquouserdquo of assets until the
end of their respective useful lives Allowances are made to finance the replacement and or
rehabilitation of the existing assets once they ldquoexpirerdquo and can no longer play a role in
providing the required wastewater service to customers However it should be noted that since
amortization is based on the original (historical) cost at the time the asset was placed in service
it does not account for inflation since the year of installation Therefore basing asset
replacement costs on amortization alone is not sufficient to cover the future replacement
needs
The TCA projections contained in the Cityrsquos wastewater financial plan are based on the
following assumptions
bull Amortization of existing assets is based on the Cityrsquos Tangible Capital Assets policies and
procedures Amortization of new infrastructure investments is based on straight line
depreciation with full year depreciation charged in the year of acquisition
54 DFA Infrastructure International Inc
City of Waterloo Water amp Sanitary Sewer Rate Design Study Final Report amp Water Financial Plan No 112-301
April 1 2016
bull Historical costs life expectancy and remaining useful life as per the TCA data provided
by the City
bull Fully depreciated assets continue to be used in service ie no asset removals and
bull New assets to be acquired are based on the capital forecast The forecast includes
projects in the Cityrsquos Capital Budget Forecast and asset replacement projections based
on the Cityrsquos Asset Management Plan
Asset Value
The wastewater system is comprised of the following capital asset classes
bull Sanitary Sewer Gravity Mains
bull Sanitary Sewer Forcemains
bull Manholes and
bull Pumping Stations
Table 9-1 shows the current capital asset value based on historical cost and accumulated
amortization to 2015 This is reflected as the net book value (NBV) ie the ldquoaccountingrdquo value
and indicates that the wastewater system as a whole is approximately 29 depreciated or has
approximately 71 remaining life based on the TCA data This suggests that the wastewater
system assets are relatively new
Table 9-1 Asset Amortization and 2015 Net Book Value (NBV)
2015 Sanitary Sewer Asset Details
Historical Cost $135873861 29
Accumulated Amortization $39335177 71
Net Book Value (2015) $96538684 100
92 Statement of Financial Position
The Statement of Financial Position is presented in Table 9-2 This statement summarizes the
Cityrsquos sanitary sewer related financial and non-financial assets (Tangible Capital Assets ndash TCA)
and liabilities and provides the net financial asset (net debt) position and accumulated surplus
related to managing the sanitary sewer system The financial assets are primarily cash balances
in the sanitary sewer reserves and reserve funds Liabilities consist of development charge
reserve fund balances (ie deferred revenues) The City does not have any outstanding long-
term debt for the Cityrsquos sanitary sewer systemThe non-financial assets (TCA) include the Cityrsquos
sanitary sewer infrastructure The historical costs are amortized over the asset life to arrive at
the net book value each year from 2016 to 2021 New assets are added in the years acquired
developed or built Contributed assets are primarily new infrastructure that would be
transferred to the Cityrsquos ownership and control by developers as they are completed However
55 DFA Infrastructure International Inc
City of Waterloo Water amp Sanitary Sewer Rate Design Study Final Report amp Water Financial Plan No 112-301
April 1 2016
asset (net debt) position and accumulated surplus related to managing the sanitary sewer
system The financial assets are primarily cash balances in the sanitary sewer reserves and
reserve funds Liabilities consist of development charge reserve fund balances (ie deferred
revenues) The City does not have any outstanding long-term debt for the Cityrsquos sanitary sewer
systemThe non-financial assets (TCA) include the Cityrsquos sanitary sewer infrastructure The
historical costs are amortized over the asset life to arrive at the net book value each year from
2016 to 2021 New assets are added in the years acquired developed or built Contributed
assets are primarily new infrastructure that would be transferred to the Cityrsquos ownership and
control by developers as they are completed However this is assumed to be zero It is also
assumed that other non-financial assets such as inventory and prepaid expenses are zero
Contained within the Statement of Financial Position are important indicators the first being
net financial assets (or net debt) which is defined as the difference between financial assets and
liabilities This indicator provides a measure of the sanitary sewer systems future revenue
requirement Another important indicator in the Statement of Financial Position is the
accumulated surplus This indicator provides measure of the resources available to the City for
managing its system The accumulated surplus is projected to increase from approximately
$1139 million in 2016 to approximately $1265 million by 2021 The accumulated surplus is
made up of the net TCA balance representing past investments in the sanitary sewer
infrastructure and net financial assets It is important to note that the non-financial assets (TCA)
cannot be readily monetized without affecting the sanitary sewer operations
Table 9-2 indicates that in 2016 the Citys sanitary sewer system will be in a net financial asset
position in the amount of $128 million This will be increased to a net financial asset position of
$141 million by 2021 The net financial asset position indicates that financial resources will be
available to fund future operations The increased net financial assets position is due to a
combination of an increase in the cash position that is offset by increases in liabilities mainly
through an increase in a deferred revenue balance The next important indicator contained in
the Statement of Financial Position is the net book value of TCA Another important indicator in
the Statement of Financial Position is the accumulated surplus This indicator provides measure
of the resources available to the City for managing its system The accumulated surplus is
projected to increase from approximately $1139 million in 2016 to approximately $1265
million by 2021 The accumulated surplus is made up of the net TCA balance representing past
investments in the sanitary sewer infrastructure and net financial assets It is important to note
that the non-financial assets (TCA) cannot be readily monetized without affecting the sanitary
sewer operations
Table 9-2 shows that net TCA are expected to grow by $113 million over the forecast period or
from $1010 million in 2016 to $1123 million 2021 This indicates that the City has plans to
invest significant dollars in tangible capital assets in excess of the consumption of existing
assets Further a consumption ratio consisting of the accumulated amortization of the Citys
TCA as a percent of historical cost ratio highlights the aged condition of the assets and their
potential replacement needs The Citys Sanitary Sewer Asset Consumption Ratio remains fairly
56 DFA Infrastructure International Inc
City of Waterloo Water amp Sanitary Sewer Rate Design Study Final Report amp Water Financial Plan No 112-301
April 1 2016
stable over the forecast period ranging from 29 - 30 as newly acquired or constructed
assets essentially offset the consumption of existing assets
Another important indicator in the Statement of Financial Position is the accumulated surplus
This indicator provides measure of the resources available to the City for managing its system
The accumulated surplus is projected to increase from approximately $1139 million in 2016 to
approximately $1265 million by 2021 The accumulated surplus is made up of the net TCA
balance representing past investments in the sanitary sewer infrastructure and net financial
assets It is important to note that the non-financial assets (TCA) cannot be readily monetized
without affecting the sanitary sewer operations
Table 9-2 Statement of Financial Position
Statement of Financial Position 2016 2017 2018 2019 2020 2021
Financial Assets
CashReceivables and Investment $13731061 $13895204 $12164873 $13378657 $16515184 $18166448
Total Financial Assets $13731061 $13895204 $12164873 $13378657 $16515184 $18166448
Financial Liabilities
Accounts Payable amp Deferred Revenue $894210 $883620 $513420 $233149 $1760764 $3968923
Long-term Liabilities $0 $0 $0 $0 $0 $0
Total Financial Liabilities $894210 $883620 $513420 $233149 $1760764 $3968923
Net Financial Assets (Net Debt) $12836851 $13011585 $11651453 $13145508 $14754420 $14197524
Non-Financial Assests
Tangible Capital Assets $141770533 $145955938 $151059146 $154957662 $157415679 $160653548
Accumulated Amortization ($40756475) ($42198525) ($43520590) ($45264718) ($46892049) ($48329678)
Total Non-Financial Assets $101014058 $103757414 $107538555 $109692943 $110523630 $112323870
Accumulated Surplus $113850909 $116768999 $119190008 $122838451 $125278050 $126521394
Financial Indicators 2016 2017 2018 2019 2020 2021
Increase (Decrease) in Net Financial Assets $966414 $174733 ($1360132) $1494055 $1608912 ($556895)
Increase (Decrease) in Net Tangible Capital Assets $4475375 $2743356 $3781142 $2154388 $830687 $1800240
Increase (Decrease) in Accumulated Surplus $5441789 $2918089 $2421010 $3648443 $2439598 $1243345
Water Asset Consumption Ratio 29 29 29 29 30 30
93 Statement of Operations
The Statement of Operations is presented in Table 9-3 It summarizes the annual revenues and
expenses associated with managing the Cityrsquos sanitary sewer system It provides a report on the
transactions and events that have an influence on the accumulated surplus The main revenue
items included are
bull Revenues from Sanitary Sewer Rates and Charges
bull Earned Revenues (earned development charges capital contributions and sewer post
period capacity recovery) and
bull Other Revenues (miscellaneous fees and charges additional sewage revenues
(Kitchener) etc)
The main expense items are
57 DFA Infrastructure International Inc
City of Waterloo Water amp Sanitary Sewer Rate Design Study Final Report amp Water Financial Plan No 112-301
April 1 2016
bull The annual cost of operating and maintaining the sanitary sewer system including
Regional charges for treating wastewater and
bull Amortization expenses on existing and new TCA
The operating surplus (deficit) is an important indicator contained in the Statement of
Operations An operating surplus (deficit) measures whether operating revenues generated in
a year were sufficient to cover operating expenses incurred in that year It is important to note
that an annual surplus is necessary to ensure funds will be available to address non-expense
items such as TCA acquisitions over and above amortization expenses reservereserve fund
contributions for asset replacement and rate stabilization and repayment of outstanding debt
principal A ratio of operating surplus to total revenue is shown in Table 9-3 to reflect the
percent of total revenue that can be allocated to funding the non-expense items noted above
The higher the ratio the greater proportion of operating revenues that are available for paying
down debt purchasing capital assets and setting aside in reserves for future use Cash
generated from operations is discussed in the Statement of Cash Flows section
Table 9-3 Statement of Operations
Statement of Operations 2016 2017 2018 2019 2020 2021
Water Revenue
User Revenue $22639530 $23642507 $24500418 $26620392 $27414835 $28741194
Earned Revenue $4955280 $2749781 $3010247 $3059851 $959828 $263792
Other Revenue $1180638 $1100638 $1019638 $1056580 $1081060 $1121094
Total Revenues $28775448 $27492926 $28530303 $30736823 $29455723 $30126080
Water Expenses
Gross $5057612 $5191245 $5263715 $5388699 $4517432 $4650027
Wastewater Treated $16248249 $17291318 $18673935 $19469577 $20227227 $21906220
Operating Expenses $21305861 $22482563 $23937650 $24858276 $24744659 $26556247
Interest on Debt $0 $0 $0 $0 $0 $0
Amortization 2027798 2092273 2171644 2230104 2271466 2326489
Total Expenses $23333660 $24574836 $26109293 $27088380 $27016124 $28882736
Annual Surplus(Deficit) $5441789 $2918089 $2421010 $3648443 $2439598 $1243345
Accumulated Surplus(Deficit) Beginning of Year $108409121 $113850909 $116768999 $119190008 $122838451 $125278050
Accumulated Surplus (Deficit) End of Year $113850909 $116768999 $119190008 $122838451 $125278050 $126521394
Financial Indicators 2016 2017 2018 2019 2020 2021
Increase (Decrease) in Total Revenues $3103799 ($1282523) $1037378 $2206520 ($1281100) $670357
Increase (Decrease) in Total Expenses $3392720 $1241177 $1534457 $979087 ($72256) $1866611
Increase (Decrease) in Annual Surplus ($288921) ($2523700) ($497079) $1227433 ($1208844) ($1196254)
Operating Surplus Ratio 19 11 8 12 8 4
94 Statement of Cash Flow
The Statement of Cash Flow is presented in Table 9-4 This statement summarizes the main
cash inflows and outflows related to the sanitary sewer system in four (4) main areas -
operating capital investing and financing and shows the annual changes in cash Contained
within the 2016 cash position is a receivable of approximately $395 million to be fully collected
by 2021 from the Develop Charges Reserve Fund for capacity related projects funded in prior
years from the Sanitary Sewer Capital Reserve Fund
58 DFA Infrastructure International Inc
City of Waterloo Water amp Sanitary Sewer Rate Design Study Final Report amp Water Financial Plan No 112-301
April 1 2016
The operating cash transactions begin with the surplus or deficit identified in the Statement of
Operations This figure is adjusted to add or subtract non-cash items that were included as
revenues or expenses (eg amortization expenses) It is assumed that there were no ldquoinvesting
activitiesrdquo over the period The capital section indicates the amounts spent to acquire capital
assets (TCA) or received from the sale of assets In the Cityrsquos case it is assumed that there are
no assets to be sold to generate cash The financing section identifies the funds received from
development charges receipts ProvincialFederal Grants and proceeds from the issuance of
long-term debt as cash inflows offset by the portion of debt repaid as cash outflows No debt
however is projected over the forecast period
Table 9-4 indicates that cash has been generated from operations which is used in funding the
acquisition of TCA and towards building internal reserves over the forecast period The Citys
cash position is projected to increase over the forecast period from $137 million in 2016 to
$182 million in 2021
Table 9-4 Statement of Cash Flows
Statement of Cashflows 2016 2017 2018 2019 2020 2021
Cash Provided by
Operating Activities
Annual Surplus(Deficit) $5441789 $2918089 $2421010 $3648443 $2439598 $1243345
Non-Cash Items
Amortization $2027798 $2092273 $2171644 $2230104 $2271466 $2326489
Earned Revenue ($4955280) ($2749781) ($3010247) ($3059851) ($959828) ($263792)
Net Change in Cash Provided by Operating Activities $2514307 $2260582 $1582406 $2818696 $3751236 $3306041
Capital Activities
Purchase of TCA ($6503173) ($4835629) ($5952785) ($4384491) ($3102152) ($4126728)
Net Change in Cash Used in Capital Activities ($6503173) ($4835629) ($5952785) ($4384491) ($3102152) ($4126728)
Financing Activities
Other Municipal Sources
DC Collections $2693579 $2739190 $2640048 $2779579 $2487443 $2471951
ProvincialFederal Grants $411623 $0 $0 $0 $0 $0
Proceeds From Long-Term Debt $0 $0 $0 $0 $0 $0
Repayment of Long-Term Debt $0 $0 $0 $0 $0 $0
Net Change in Cash Used in Financing Activities $3105203 $2739190 $2640048 $2779579 $2487443 $2471951
Net Change in Cash and Cash Equivalents ($883664) $164143 ($1730331) $1213784 $3136527 $1651264
Cash and Cash Equivalents Beginning of the Year $14614725 $13731061 $13895204 $12164873 $13378657 $16515184
Cash and Cash Equivalents End of the Year $13731061 $13895204 $12164873 $13378657 $16515184 $18166448
59 DFA Infrastructure International Inc
City of Waterloo Water amp Sanitary Sewer Rate Design Study Final Report amp Water Financial Plan No 112-301
April 1 2016
10 Conclusions and Recommendations 101 Conclusions
Based on the information reviewed and analyses completed the following are the main
conclusions
1 The average annual full cost of managing the Cityrsquos water system over the study period
(next 24 years) is anticipated to be $306 million compared to current (2016) annual costs
of approximately $205 million Therefore water rate and service charge increases are
necessary to ensure that the system costs are fully funded and financially sustainable over
the long-term as required by O Reg 45307
2 The Regionrsquos Charges estimated at $181 million (annual average cost) for water treatment
represent the largest portion of system costs (59) over the next 24 years Contributions
to the capital reserve account for $39 million (13) OampM activities related to the Cityrsquos
operations account for $76 million (25) and debt repayment accounts for $097 million
(3)
3 A water infrastructure funding gap of approximately $33 million over the next 20 years
would continue to exist if rates and service charges are not adjusted to generate sufficient
funding levels
4 The financial statements for the water system prepared based on the results of the ratestudy analyses and projections indicate the following
- The accumulated surplus is projected to increase from approximately $726
million in 2016 to approximately $863 million by 2021
- The operating surplus ratio is projected to decrease from 15 in 2016 to 12 by
2021
- The cash position is projected to increase from $68 million in 2016 to $72
million in 2021
These indicate that the financial outlook for the water system over the 6-year period 2016
to 2021 is good
5 The average annual full cost of managing the Cityrsquos sanitary sewer system over the study
period (next 24 years) is anticipated to be $383 million compared to 2016 costs of
approximately $245 million Therefore sanitary sewer rate increases are necessary to
ensure that the system costs are fully funded and financially sustainable over the long-
term
6 The Regionrsquos Charges estimated at $29 million (annual average cost) for wastewater
treatment represent the largest portion of system costs (76) over the next 24 years
Contributions to the capital reserve account for $29 million (8) OampM activities related
60 DFA Infrastructure International Inc
City of Waterloo Water amp Sanitary Sewer Rate Design Study Final Report amp Water Financial Plan No 112-301
April 1 2016
to the Cityrsquos operations account for $59 million (15) and debt repayment accounts for
$05 million (1)
7 The current funding levels are sufficient for meeting the projected needs over the next 20
years However an infrastructure funding gap in excess of $72 million is projected beyond
2035 to 2065 Debt financing should be considered as part of the funding strategy to
address this infrastructure funding gap which is projected to occur just beyond the study
period
8 The financial statements for the sanitary sewer system prepared based on the results of
the rate study analyses and projections indicate the following
- The accumulated surplus is projected to increase from approximately $1139
million in 2016 to approximately $1265 million by 2021
- The operating surplus ratio is projected to decrease from 17 in 2016 to 4 by
2021
- The cash position is projected to increase from $137 million in 2016 to $182
million in 2021
These indicate that the financial outlook for the sanitary sewer system over the 6-year
period 2016 to 2021 is good
9 Based on a qualitative review all options would provide the level of funding to be fully
sustainable over the long-term Although Option 3 is best from a water conservation and
user pay guiding principle perspective it has significant disadvantages including but not
limited to
- Revenue uncertainty resulting from conservation due to the higher Block 2 rate
- Potentially high impacts (201 to 325 increases) to the non-residential
customers that may affect the attraction and retention of business These levels
of increases are significant and would require further dialogue with the business
community and volume data analysis prior to confirming the thresholds for each
block and the factor to be used for setting the Block 2 rate and
- The risk of shifting a much larger portion of costs to the residential sector should
business customers relocate or discontinue operations
Option 2 offers the most predictable revenues and would ensure that at least 15 of the
annual water revenues would be guaranteed while providing sufficient incentive for
customers to conserve
Option 1 still offers a fair and reasonable rate structure because the amount paid varies
almost directly with consumption due to the low fixed water charges (none for sanitary
sewer) Under Option 1 from a high level equity perspective the residential and non-
residential sectors pay their fair share Residential customers consume approximately
55 of the water and contribute 55 of the annual revenue while the non-residential
61 DFA Infrastructure International Inc
City of Waterloo Water amp Sanitary Sewer Rate Design Study Final Report amp Water Financial Plan No 112-301
April 1 2016
consumers account for the remaining 45 of consumption and revenues The major
disadvantage of the existing rate structure is the low level of revenue stability as only a
marginal amount of the annual revenue is collected via fixed fees This lack of revenue
stability will be offset to some extent by the introduction of the rate stabilization
reserves Therefore Option 1 could be remain a viable option moving forward should
Council not wish to proceed with Option 2 due to the large impact to the small and
average residential customers
102 Recommendations
The following are the primary recommendations for consideration by the City
10 Implement the rate structure described as Option 2 in this report effective 2019 to achieve
full cost recovery and ensure that 15 revenue recovery from the Water and Sanitary
Sewer Service Charges This would provide the best level of revenue stability compared to
the other options However if the potential cost increases to the small and average
residential customers under this option is of concern then it would be reasonable to
maintain the existing rate structure (Option 1) provided that the new rate stabilization
reserve funds discussed in this report are established The funds that would be available
from these reserves would reduce the financial risks due to revenue volatility
11 Increase transfers to the Water Capital Reserve Fund to the levels noted in Section 612 of
this report and included in Appendix D to meet the minimum target balance of 1 of
asset value adjusted for annual inflation each year subject to annual reviews of the water
systemrsquos asset needs to fully fund the capital requirements
12 Maintain transfers to the Sanitary Sewer Capital Reserve Fund at the levels noted in
Section 622 of this report and included in Appendix D to meet the minimum target
balance of 1 of asset value adjusted for annual inflation each year subject to annual
reviews of the sanitary sewer systemrsquos asset needs to fully fund the capital requirements
13 Utilize debt financing in the near term to help address the existing water capital shortfall
and sanitary sewer capital shortfall projected in the longer term in an effort to reduce the
burden placed on the rates
14 Establish a separate rate stabilization reserve fund for both water and sanitary sewer to be
used for offsetting any deficits and stabilizing rates and service charges These reserves to
be phased-in at a rate of 1 of annual operating cost from 2019-2023 until the target
balance of 5 of annual revenues is achieved
15 Continue to take steps to identify and address the causes of non-revenue water and inflow
and infiltration to the sanitary sewer system
16 That the OReg 45307 Water System Financial Plan No 112-301 including the Financial
Statements contained herein be approved by Council and submitted to the Province of
62 DFA Infrastructure International Inc
City of Waterloo Water amp Sanitary Sewer Rate Design Study Final Report amp Water Financial Plan No 112-301
April 1 2016
Ontario on or before June 1 2016 in accordance with the Drinking Water System Licence
renewal requirements and O Reg 45307
That a copy of this document entitled ldquoWater and Sanitary Sewer Rate Design Final
Report amp Water Financial Plan No 112-301rdquo be posted on the Cityrsquos website
(httpwwwwaterloocaratereview) and made available to the public at no charge
17 That the Sanitary Sewer System Financial Plan including the Financial Statements
contained herein be received by Council
18 The City should actively pursue Grant funding opportunities based on recent Federal
Budget announcements to increase funding to municipalities for infrastructure and lsquogreenrsquo
projects
63 DFA Infrastructure International Inc
City of Waterloo Water amp Sanitary Sewer Rate Design Study Final Report amp Water Financial Plan No 112-301
April 1 2016
References
1 Development Charges Background Study November 16 2012 Hemson Consulting Ltd
2 People amp Jobs Forecast 2015 -2025
3 City of Waterloo 2015- 2024 Capital Budget (10 year program)
4 Water Production and Supply Volumes Records ndashCity of Waterloo
5 Wastewater Treatment Volumes Forecast ndash City of Waterloo
6 Water amp Wastewater Treatment Rates Forecast ndash Region of Waterloo
7 City of Waterloo PSAB 3150 TCA Data (2014)
8 City of Waterloo 2015 and 2016 Operating Budgets
9 City of Waterloo By-Law Number 2015-24
10 City of Waterloo Debt Repayment Schedules (Growth)
11 City of Waterloo DC Reserves Continuity Schedule
12 City of Waterloo Water Capital Reserve Continuity Schedule
13 City of Waterloo Sanitary Sewer Capital Reserve Continuity Schedule
14 City of Waterloo Asset Management Plan (2014)
15 City of Waterloo Water amp Sanitary Sewer Asset Inventories
16 City of Waterloo Debt Management Policy FC-009 Revised May 12 2014
17 Working Paper Do Increasing Block Rate Water Budgets Reduce Residential Water
Demand A Case Study in Southern California Water Science amp Policy Centre University
of California Riverside K Baerenklau K Schwabe A Dinar September 1 2013
18Environment Canada (2011) 2011 Municipal Water Pricing Report Full-Cost Rates for
Water and the Chimera of ldquoAffordabilityrdquo C Bodimeade amp S Renzetti March 1 2013
64 DFA Infrastructure International Inc
Appendix A
EXCERPT OF CITY OF WATERLOO
BY-LAW 2015-079
THE CORPORATION OF THE CITY OF WATERLOO
BY-LAW NUMBER 2015-079
BEING a by-law to impose fees and charges on persons
WHEREAS section 391(1) of the Municipal Act 2001 SO 2001 c 25 as amended authorizes a municipality to impose fees or charges on persons for services or activities provided or done by or on behalf of it for costs payable by it for services or activities provided or done by or on behalf of any other municipality or any local board and for use of its property including property under its control
AND WHEREAS section 391(2) of the Municipal Act 2001 SO 2001 c 25 as amended states that a fee or charge imposed for capital costs related to services or activities may be imposed on persons not receiving an immediate benefit from the services or activities but who will receive a benefit at some later point in time
AND WHEREAS section 391(3) of the Municipal Act 2001 SO 2001 c 25 as amended states that the costs included in a fee or charge may include costs incurred by the municipality or local board related to administration enforcement and the establishment acquisition and replacement of capital assets
AND WHEREAS section 391(4) of the Municipal Act 2001 SO 2001 c 25 as amended states that a fee or charge may be imposed whether or not it is mandatory for the municipality or local board imposing the fee or charge to provide or do the service or activity pay the costs or allow the use of its property
AND WHEREAS section 391(5) of the Municipal Act 2001 SO 2001 c 25 as amended states that in the event of a conflict between a fee or charge by-law and the Municipal Act 2001 SO 2001 c 25 as amended or any other act or regulation made under any other act the by-law prevails
AND WHEREAS section 69(1) of the Planning Act RSO 1990 c P13 as amended states that the council of a municipality by by-law and a planning board by resolution may establish a tariff of fees for the processing of applications made in respect of planning matters which tariff shall be designed to meet only the anticipated cost to the municipality or to a committee of adjustment or land division committee constituted by the council of the municipality in respect of the processing of each type of application provided for in the tariff
AND WHEREAS section 69(2) of the Planning Act RSO 1990 c P13 as amended states that despite a tariff of fees established under subsection (1) the council of a municipality a planning board a committee of adjustment or a land division committee in processing an application may reduce the amount of or waive the requirement for the payment of a fee in respect of the application where the council planning board or committee is satisfied that it would be unreasonable to require payment in accordance with the tariff
AND WHEREAS section 69(3) of the Planning Act RSO 1990 c P13 as amended states that any person who is required to pay a fee under subsection (1) for the processing of an application in respect of a planning matter may pay the amount of the fee under protest and thereafter appeal to the Ontario Municipal Board against the levying of the fee or the amount of the fee by giving written notice of appeal to the Ontario Municipal Board within thirty days of payment of the fee
AND WHEREAS section 7(1)(c) of the Building Code Act 1992 SO 1992 c 23 as amended states that the council of a municipality may require the payment of fees on applications for and on the issuance of permits requiring the payment of fees for maintenance inspections and prescribing the amounts of the fees
AND WHEREAS section 7(2) of the Building Code Act 1992 SO 1992 c 23 as amended states that the total amount of the fees authorized under section 7(1)(c) must not exceed the anticipated reasonable costs of the principal authority to administer and enforce the Building Code Act 1992 SO 1992 c 23 as amended in its area of jurisdiction
AND WHEREAS section 7(3) of the Building Code Act 1992 SO 1992 c 23 as amended states that a regulation by-law or resolution establishing fees under section 7(1)(c) must provide for reduced fees to be payable in respect of the construction of a building for which a registered code agency is appointed under section 42 of the Building Code Act 1992 SO 1992 c 23 as amended
NOW THEREFORE BE IT ENACTED by the Council of The Corporation of the City of Waterloo as follows
10 CITATION
11 This by-law shall be known as the ldquoFees and Charges By-Lawrdquo ldquoFee Guiderdquo or ldquoFee Schedulerdquo of The Corporation of the City of Waterloo (the ldquoCityrdquo)
12 Should any by-law refer to the Cityrsquos or a department of the Cityrsquos ldquoFee Guiderdquo or ldquoFee Schedulerdquo the aforesaid by-law in using any of the aforementioned terms shall be interpreted to mean this by-law regardless of any definition to the contrary contained within that by-law
20 DEFINITIONS
For the purposes of this by-law
21 ldquoBuilding Code Actrdquo means Building Code Act 1992 SO 1992 c 23 as amended
22 ldquoBuilding Coderdquo means Ontario Regulation 35006 as amended
23 ldquoChief Building Officialrdquo means the chief building official of the City or his or her designate appointed or constituted under sections 3 or 4 of the Building Code Act
24 ldquoCityrdquo means The Corporation of the City of Waterloo
25 ldquoCouncilrdquo means the municipal Council of the City
2
26 ldquoCommissionerrdquo means a commissioner of a department of the City and shall include the Chief Financial OfficerTreasurer and the Chief Human Resources Officer or his or her designate
27 ldquoMunicipal Actrdquo means the Municipal Act 2001 SO 2001 c 25 as amended
28 ldquopersonrdquo includes an individual unincorporated association sole proprietorship partnership corporation or municipality and
29 ldquoPlanning Actrdquo means the Planning Act RSO 1990 c P13 as amended
30 FEES AND CHARGES
31 The City hereby imposes the fees and charges outlined in Schedule ldquoArdquo to this by-law pursuant to the provisions of the Municipal Act
311 The fees and charges imposed on a person by the City as outlined in Schedule ldquoArdquo to this by-law constitute a debt of the person to the City
312 The Treasurer of the City may add fees and charges imposed by the City as outlined in Schedule ldquoArdquo to this by-law to the tax roll for the following property in the City and collect them in the same manner as municipal taxes
3121 in the case of fees and charges for the supply of a public utility the property to which the public utility was supplied and
3122 in all other cases any property for which all of the owners are responsible for paying the fees and charges
313 If the City uses a registered collection agency in good standing under the Collection Agencies Act to recover a debt including taxes payable to the City the collection agency may also recover its reasonable costs of collecting the debt but those costs shall not exceed an amount approved by the City
314 The City may sell any prescribed debt payable to the City to any other person in accordance with the rules and conditions prescribed under the Municipal Act
3141 A person who acquires a debt outlined in section 314 has the priority of the City with respect to the debt
315 The powers of a Commissioner to increase decrease or waive a fee outlined in section 316 below should only be used in exceptional circumstances as determined by the Commissioner
316 The fees and charges imposed on a person by the City as outlined in Schedule ldquoArdquo to this by-law may be increased decreased or waived completely by the Commissioner to whose department the fee or charge relates in the following circumstances
3161 where there is a material change to the program or service being offered
3
3162 where a large-scale event such as a conference or trade show is being held at a City facility or on City-owned or City-operated property and where a negotiated agreement is required
3163 where by imposing a fee or charge the City is decreasing access or imposing a barrier to a person with a disability or their support person
3164 where a fee is set incorrectly by way of an administrative error or
3165 where imposing a fee or charge would be in the opinion of the Commissioner unreasonable given the circumstances
317 A Commissioner may only increase the amount of a fee or charge pursuant to section 316 of this by-law in order to recover or partially recover the Cityrsquos actual costs in delivering the applicable program or service
318 A Commissioner may impose a new fee or charge not outlined in Schedule ldquoArdquo to this by-law but still under the provisions of the Municipal Act where a new program or service is being offered by the City The new fee or charge imposed by a Commissioner shall
3181 not exceed the Cityrsquos actual cost to deliver the new program or service and
3182 shall be included in Schedule ldquoArdquo of this by-law as soon as is practicable
319 Should a Commissioner increase decrease or waive a fee or charge pursuant to section 316 of this by-law or should a Commissioner impose a new fee or charge pursuant to section 318 of this by-law the Commissioner shall report to Council on an annual basis and outline the specific actions taken and the rationale for so doing
32 The City hereby imposes a tariff of fees outlined in Schedule ldquoBrdquo pursuant to the provisions of the Planning Act
321 Any person may apply to Council in a manner or form prescribed by the City if that person feels that there are particular circumstances which would make it unreasonable for the City to require payment in accordance with the tariff of fees outlined in Schedule ldquoBrdquo
322 Following its consideration of the aforementioned application Council may reduce the amount of or waive the requirement for the payment of a fee pursuant to Schedule ldquoBrdquo
33 The City hereby imposes the fees and charges outlined in Schedule ldquoCrdquo pursuant to the provisions of the Building Code Act
331 Every twelve (12) months the Chief Building Official shall prepare a report that contains such information as may be prescribed in the Building Code Act and its regulations about the fees and charges outlined in Schedule ldquoCrdquo and the costs
4
of the City to administer and enforce the Building Code Act in its area of jurisdiction
332 The City shall make its report pursuant to section 331 available to the public in the manner required by regulation under the Building Code Act
333 If the City proposes to change any fee or charge imposed under Schedule ldquoCrdquo the City shall
3331 give notice of the proposed changes in fees or charges to such persons as may be prescribed by regulation under the Building Code Act and
3332 hold a public meeting concerning the proposed changes in a manner determined by the Chief Building Official
334 The notice of proposed changes in fees or charges outlined in section 3331 of this by-law must contain the information prescribed by the regulations under the Building Code Act including information about the public meeting and must be given in the manner prescribed by the regulations under the Building Code Act
335 The public meeting concerning proposed changes in fees or charges outlined in section 3332 of this by-law must be held within the period specified by regulation under the Building Code Act before the regulation by-law or resolution to implement the proposed changes is made
336 Section 398 of the Municipal Act applies with necessary modifications to fees established by the City under Schedule ldquoCrdquo and with the approval of the Treasurer of the City to fees established under section 7(1)(c) of the Building Code Act by a conservation authority whose area of jurisdiction includes any part of the local municipality
34 All fees and charges imposed by this by-law including all fees and charges outlined in the schedules to this by-law shall
341 not include applicable taxes unless otherwise indicated and
342 be in full force and effect on the effective date noted in the schedule unless no effective date is noted in which case they shall be in full force and effect immediately following their passage by Council
40 SEVERABILITY
41 If a Court of competent jurisdiction should declare any section or part of a section of this by-law to be invalid such section or part of a section shall not be construed as having persuaded or influenced Council to pass the remainder of this by-law and it is hereby declared that the remainder of this by-law shall be valid and shall remain in full force and effect
50 REPEAL amp AMENDMENT
51 By-Law 2015-051 is hereby repealed
5
_________________________________
__________________________________
52 Should this by-law conflict with any other by-law or resolution of Council or any staff report approved by Council in relation to fees and charges imposed under the Municipal Act Planning Act Building Code Act or any other act this by-law shall take precedence unless specifically stated to the contrary
60 COMING INTO FORCE
61 This by-law shall come into force on the date of its passage by Council
Read a FIRST SECOND and THIRD time this 14th day of December 2015
Signed by
MAYOR ndash David Jaworsky
Signed by
CITY CLERK ndash Olga Smith
6
Integrated Planning amp Public Works Department ndash Water-Sewer-Stormwater Services Division Schedule ldquoArdquo to Fees and Charges Bylaw
WATER AND SANITARY SEWER Effective Effective
Water Rate Fee Date of Fee Fee Date of Fee
(per cubic metre) $ 160 1-Jan-2014 $ 166 1-Feb-2015 Sanitary Sewer Rate
(per cubic metre) $ 200 1-Jan-2014 $ 210 1-Feb-2015
Service Charges
Water Meters
Water Meters - New
Fire Protection Charge (large commercial accounts)
15mm Water Meter Charge (single family residential accounts)
25mm Water Meter Charge (small apartments ie Triplex accounts)
40mm Water Meter Charge (small commercial industrial accounts)
50mm Water Meter Charge (large commercial industrial accounts)
75mm Water Meter Charge (large commercial industrial accounts)
100mm Water Meter Charge (large commercial industrial accounts)
150mm Water Meter Charge (large commercial industrial accounts)
200mm Water Meter Charge (large commercial industrial accounts)
250mm Water Meter Charge (large commercial industrial accounts)
Meter Pit Charge
$ 2048 1-Jan-2014 $ 2089 1-Feb-2015
$ 285 1-Jan-2014 $ 291 1-Feb-2015
$ 575 1-Jan-2014 $ 587 1-Feb-2015
$ 1053 1-Jan-2014 $ 1074 1-Feb-2015
$ 1319 1-Jan-2014 $ 1345 1-Feb-2015
$ 2756 1-Jan-2014 $ 2811 1-Feb-2015
$ 4030 1-Jan-2014 $ 4111 1-Feb-2015
$ 6854 1-Jan-2014 $ 6991 1-Feb-2015
$ 10347 1-Jan-2014 $ 10554 1-Feb-2015
$ 13759 1-Jan-2014 $ 14034 1-Feb-2015
$ 3517 1-Jan-2014 $ 3587 1-Feb-2015
Water Meter Accuracy Deposit
Water Meter Replacement Fee - (Damaged Frozen or Missing) plus Meter Cost
RemoteMounting Bracket Assembly
Tail Piece Replacement
Remote Re-wiring
15mm Meter Kit (complete)
Verification Administration
Miscellaneous Minor Repairs
Security Tag Replacement
$ 12755 1-Jan-2014 $ 15000 1-Feb-2015
$ 7200 1-Jan-2014 $ 7310 1-Feb-2015
$ 3815 1-Jan-2014 $ 3873 1-Feb-2015
$ 1905 1-Jan-2014 $ 1934 1-Feb-2015
$ 15275 1-Jan-2014 $ 15509 1-Feb-2015
$ 16145 1-Jan-2014 $ 16392 1-Feb-2015
$ 3815 1-Jan-2014 $ 3873 1-Feb-2015
$ 7635 1-Jan-2014 $ 7752 1-Feb-2015
$ 6325 1-Jan-2014 $ 6422 1-Feb-2015
15 mm
25 mm
40 mm
50 mm
75 mm
100 mm compound
100 mm fire rated
150 mm compound
150 mm fire rated
200 mm compound
200 mm fire rated
250 mm compound
250 mm fire rated
$ 10250 1-Jan-2014 $ 10680 1-Feb-2015
$ 22500 1-Jan-2014 $ 19920 1-Feb-2015
$ 45100 1-Jan-2014 $ 59400 1-Feb-2015
$ 60200 1-Jan-2014 $ 71400 1-Feb-2015
$ 264900 1-Jan-2014 $ 219600 1-Feb-2015
na - new $ 372000 1-Feb-2015
$ 1002000 1-Jan-2014 $ 828000 1-Feb-2015
na - new $ 633000 1-Feb-2015
$ 1140000 1-Jan-2014 $ 1104000 1-Feb-2015
na - new $ 1020000 1-Feb-2015
$ 1545100 1-Jan-2014 $ 1680000 1-Feb-2015
na - new $ 1320000 1-Feb-2015
$ 2188100 1-Jan-2014 $ 2359200 1-Feb-2015
Appendix B
WampWW VOLUMES AND GROWTH PROJECTIONS
Appendix B - WampWW Volumes and Growth Projections
Water Volumes and Growth Projections
Description 2016 2017 2018 2019 2020 2021 2022 2023 2024 2025 2026 2027 2028 2029 2030 2031 2032 2033 2034 2035 2036 2037 2038 2039
Volume Purchased by Waterloo from Region (1000 msup3)
12286 12274 12268 12319 12369 12426 12455 12491 12536 12580 12623 12662 12704 12747 12790 12832 12875 12917 12961 13004 13047 13090 13134 13178
Volume Sold to Customers (1000 msup3) 10535 10451 10355 10398 10441 10484 10527 10570 10613 10655 10698 10741 10784 10827 10870 10913 10956 10999 11042 11085 11128 11171 11214 11257
Non-Revenue Water (1000 msup3) 1751 1823 1914 1921 1928 1943 1928 1922 1924 1924 1924 1921 1920 1920 1919 1919 1918 1918 1918 1918 1919 1919 1919 1920
Non-Revenue Water () 14 15 16 16 16 16 15 15 15 15 15 15 15 15 15 15 15 15 15 15 15 15 15 15
Number of Customer Accounts
30360 30360 30360 30606 30852 31098 31344 31590 31836 32082 32328 32574 32820 33066 33312 33558 33804 34050 34296 34542 34788 35034 35280 35526
Description 2016 2017 2018 2019 2020 2021 2022 2023 2024 2025 2026 2027 2028 2029 2030 2031 2032 2033 2034 2035 2036 2037 2038 2039
Waterloo Volume Treated by the
32033
32279
32525
32771
33017
33263
33509
33755
34001
34247
34493
34739
34985
Region (1000 msup3)
Number of Customers
16265
29819
16193
29819
16358
29819
16084
30065
15779
30311
16136
30557
16110
30803
16093
31049
16041
31295
16032
31541
16082 16072 16064 16058 16062 16067 16065 16063 16063 16064 16064 16064 16064 16064 Billable Wastewater Volume
from Customers (1000 msup3) 10326 10279 10209 10252 10295 10339 10382 10425 10469 10512 10555 10599 10642 10685 10729 10772 10815 10859 10902 10945 10989 11032 11075 11119
31787
Sanitary Sewer Volumes and Growth Projections
Appendix C
PROJECTED CAPITAL BUDGET REQUIREMENTS
Appendix C - Projected Capital Budget Requirements
Projected Capital Budget Requirements - Water Capital Projections
Water Capital Projections ($000)
2016 2017 2018 2019 2020 2021 2022 2023 2024 2025 2026 2027 2028 2029 2030 2031 2032 2033 2034 2035 2036 2037 2038 2039
Capital 6503 4836 5953 4384 3102 4127 2131 2259 3238 4053 4210 4210 4210 4210 4210 4210 4210 4210 4210 4210 4210 4210 4210 4210
Backlog - - - - - - - - - - - - - - - - - - - - - - - -
Total Capital
6503 4836 5953 4384 3102 4127 2131 2259 3238 4053 4210 4210 4210 4210 4210 4210 4210 4210 4210 4210 4210 4210 4210 4210
Capital Financing ($000) 2016 2017 2018 2019 2020 2021 2022 2023 2024 2025 2026 2027 2028 2029 2030 2031 2032 2033 2034 2035 2036 2037 2038 2039
ProvincialFederal Grants - - - - - - - - - - - - - - - - - - - - - - - -
Gas Tax Allocation - - - - - - - - - - - - - - - - - - - - - - - -
Additional Gas Tax Allocation - - - - - - - - - - - - - - - - - - - - - - - -
Recoveries - - - - - - - - - - - - - - - - - - - - - - - -
Other Reserve - - - - - - - - - - - - - - - - - - - - - - - -
Contribution from Contingency - - - - - - - - - - - - - - - - - - - - - - - -
Reserve
Development Charges 1764 1650 860 490 497 504 511 518 526 533 - - - - - - - - - - - - - -
Non-Growth Related - - - 487 411 349 788 682 463 853 1868 1868 1868 1868 1868 1868 1868 1868 1868 1868 1868 1868 1868 1868
Debenture Requirements Growth Related Debenture
- - - - - - - - - - - - - - - - - - - - - - - - Requirements
Water Capital Reserve 2645 3235 2803 3817 3982 4117 4044 4193 4143 3974 4358 4358 4358 4358 4358 4358 4358 4358 4358 4358 4358 4358 4358 4358
Total Capital Financing 4409 4884 3662 4794 4890 4971 5343 5393 5132 5360 6226 6226 6226 6226 6226 6226 6226 6226 6226 6226 6226 6226 6226 6226
Projected Capital Budget Requirements - Water Capital Financing
Appendix C - Projected Capital Budget Requirements
Projected Capital Budget Requirements - Sanitary Sewer Capital Projections
Sanitary Sewer Capital Projections ($000)
2016 2017 2018 2019 2020 2021 2022 2023 2024 2025 2026 2027 2028 2029 2030 2031 2032 2033 2034 2035 2036 2037 2038 2039
Capital 6503 4836 5953 4384 3102 4127 2131 2259 3238 4053 4210 4210 4210 4210 4210 4210 4210 4210 4210 4210 4210 4210 4210 4210
Backlog - - - - - - - - - - - - - - - - - - - - - - - -
Total Capital
6503 4836 5953 4384 3102 4127 2131 2259 3238 4053 4210 4210 4210 4210 4210 4210 4210 4210 4210 4210 4210 4210 4210 4210
Capital Financing ($000) 2016 2017 2018 2019 2020 2021 2022 2023 2024 2025 2026 2027 2028 2029 2030 2031 2032 2033 2034 2035 2036 2037 2038 2039
ProvincialFederal Grants - - - - - - - - - - - - - - - - - - - - - - - -
Gas Tax Allocation 412 - - - - - - - - - - - - - - - - - - - - - - -
Additional Gas Tax Allocation - - - - - - - - - - - - - - - - - - - - - - - -
Recoveries - - - - - - - - - - - - - - - - - - - - - - - -
Other Reserve - - - - - - - - - - - - - - - - - - - - - - - -
Contribution from Contingency - - - - - - - - - - - - - - - - - - - - - - - -
Reserve
Development Charges 3763 1929 2185 2235 260 264 267 271 570 1959 - - - - - - - - - - - - - -
Non-Growth Related - - - - - - - - - - 1263 1263 1263 1263 1263 1263 1263 1263 1263 1263 1263 1263 1263 1263
Debenture Requirements Growth Related Debenture
- - - - - - - - - - - - - - - - - - - - - - - - Requirements
Sanitary Sewer Reserve 2329 2906 3767 2150 2842 3863 1863 1988 2669 2093 2947 2947 2947 2947 2947 2947 2947 2947 2947 2947 2947 2947 2947 2947
Total Capital Financing 6503 4836 5953 4384 3102 4127 2131 2259 3238 4053 4210 4210 4210 4210 4210 4210 4210 4210 4210 4210 4210 4210 4210 4210
Projected Capital Budget Requirements - Sanitary Sewer Capital Financing
Appendix D
PROJECTED RESERVES CONTINUITY SCHEDULE
Appendix D - Projected Reserves Continuity Schedule
Projected Reserves Continuity Schedule - Water Capital Reserve
Capital Reserve ($000)
Opening Balance
Transfer from Operating
2016
4357
1777
2017
4489
1674
2018
3928
1170
2019
3718
2478
2020
3379
3982
2021
3379
4117
2022
3379
4044
2023
3379
4193
2024
3379
4143
2025
3379
3974
2026
3379
4358
2027
3379
4829
2028
3850
4474
2029
3965
4477
2030
4084
4481
2031
4207
4484
2032
4333
4488
2033
4463
4492
2034
4597
4496
2035
4734
4500
2036
4877
4504
2037
5023
4509
2038
5173
4513
2039
5329
4518
Transfer from Operating-Sewer Loan
1000 1000 1000 1000
Transfer to Capital 2645 3235 2803 3817 3982 4117 4044 4193 4143 3974 4358 4358 4358 4358 4358 4358 4358 4358 4358 4358 4358 4358 4358 4358
Transfer to Operating - - - - - - - - - - - - - - - - - - - - - - - -
Closing Balance 4489 3928 3718 3379 3379 3379 3379 3379 3379 3379 3379 3850 3965 4084 4207 4333 4463 4597 4734 4877 5023 5173 5329 5489
Interest
- - - - - - - - - - - - - - - - - - - - - - - -
Projected Reserves Continuity Schedule - Water Rate Stabilizations Reserve
Rate Stabilization ($000) 2016 2017 2018 2019 2020 2021 2022 2023 2024 2025 2026 2027 2028 2029 2030 2031 2032 2033 2034 2035 2036 2037 2038 2039
Total Operating Cost 17771 18219 18689 19539 20129 20748 21353 21987 22415 23101 23836 24588 25368 26174 27004 27861 28744 29656 30597 31567 32568 33602 34668 35768
RSR Target ( of Net Costs to 0 0 0 1 2 3 4 5 5 5 5 5 5 5 5 5 5 5 5 5 5 5 5 5
Be Recovered from Users)
RSR Target ($) - - - 195 403 622 854 1099 1121 1155 1192 1229 1268 1309 1350 1393 1437 1483 1530 1578 1628 1680 1733 1788
Year End RSR Balance - - - 195 403 622 854 1099 1121 1155 1192 1229 1268 1309 1350 1393 1437 1483 1530 1578 1628 1680 1733 1788
Shortfall from Target - - - 0 0 0 0 0 0 0 0 0 0 0 0 0 0 0 0 0 0 0 0 0
Surplus from Target - - - - - - - - - - - - - - - - - - - - - - - -
Appendix D - Projected Reserves Continuity Schedule
Projected Reserves Continuity Schedule - Sanitary Sewer Capital Reserve
Transfer from Operating
Capital Reserve ($000) 2016
Opening Balance 7919
3228
2017
8599
2644
2018
8157
2276
2019
6491
2835
2020
7001
3788
2021
8646
3898
2022
8681
2828
2023
9646
1988
2024
9646
2669
2025
9646
2093
2026
9646
2947
2027
9646
2947
2028
9646
2947
2029
9646
2947
2030
9646
2947
2031
9646
2947
2032
9646
2947
2033
9646
2947
2034
9646
2947
2035
9646
2947
2036
9646
2947
2037
9646
2947
2028
9646
2947
2039
9646
2947
SPPC Repayment 781 820 825 825 700
Transfer to Capital 2329 2906 3767 2150 2842 3863 1863 1988 2669 2093 2947 2947 2947 2947 2947 2947 2947 2947 2947 2947 2947 2947 2947 2947
Transfer to Operating 1000 1000 1000 1000 - - - - - - - - - - - - - - - - - - - -
Closing Balance 8599 8157 6491 7001 8646 8681 9646 9646 9646 9646 9646 9646 9646 9646 9646 9646 9646 9646 9646 9646 9646 9646 9646 9646
Interest - - - - - - - - - - - - - - - - - - - - - - - -
Rate Stabilization ($000) 2016 2017 2018 2019 2020 2021 2022 2023 2024 2025 2026 2027 2028 2029 2030 2031 2032 2033 2034 2035 2036 2037 2038 2039
Total Operating Cost 21306 22483 23938 25109 24993 26862 28108 29125 30245 31938 32978 34204 35474 36795 38185 39346 40484 41662 42876 44129 45417 46740 48102 49505
RSR Target ( of Net Costs to 0 0 0 1 2 3 4 5 5 5 5 5 5 5 5 5 5 5 5 5 5 5 5 5
Be Recovered from Users)
RSR Target ($) - - - 251 500 806 1124 1456 1512 1597 1649 1710 1774 1840 1909 1967 2024 2083 2144 2206 2271 2337 2405 2475
Year End RSR Balance - - - 251 500 806 1152 1273 1273 1597 1649 1710 1774 1840 1909 1967 2024 2083 2144 2206 2271 2337 2405 2475
Shortfall from Target - - - 0 0 0 - 183 239 0 0 0 0 0 0 0 0 0 0 0 0 0 0 0
Surplus from Target - - - - - - 28 - - - - - - - - - - - - - - - - -
Projected Reserves Continuity Schedule - Sanitary Sewer Rate Stabilization Reserve
Appendix E
SYSTEM COSTS AND REVENUE REQUIREMENTS
Appendix E - System Costs and Revenue Requirements
System Costs and Revenue Requirements - Water System
CostRevenue Item ($000) 2016 2017 2018 2019 2020 2021 2022 2023 2024 2025 2026 2027 2028 2029 2030 2031 2032 2033 2034 2035 2036 2037 2038 2039
Municipal Capital Forecast 4409 4884 3662 3171 3520 3806 2715 3121 3588 2517 - - - - - - - - - - - - - -
Replacement Costs from Asset - - - - - - 371 - 22 1531 4892 5038 5190 3508 3613 3722 3833 3948 1823 1878 1934 1992 2052 2561
Replacement Summary
Backlog - - - 1623 1370 1164 2257 2272 1521 1313 1334 1187 1036 2718 2613 2504 2392 2277 4403 4348 4292 4234 4174 3665
Total Capital Requirements 4409 4884 3662 4794 4890 4971 5343 5393 5132 5360 6226 6226 6226 6226 6226 6226 6226 6226 6226 6226 6226 6226 6226 6226
Debt Financing - - - 487 411 349 788 682 463 853 1868 1868 1868 1868 1868 1868 1868 1868 1868 1868 1868 1868 1868 1868
Capital Reserve Financing 2645 3235 2803 3817 3982 4117 4044 4193 4143 3974 4358 4358 4358 4358 4358 4358 4358 4358 4358 4358 4358 4358 4358 4358
Transfer from Operating - - - - - - - - - - - - - - - - - - - - - - - -
Other Financing (Grants Third - - - - - - - - - - - - - - - - - - - - - - - -
Party etc)
DC Reserve Financing 1764 1650 860 490 497 504 511 518 526 533 - - - - - - - - - - - - - -
Total Capital Financing 4409 4884 3662 4794 4890 4971 5343 5393 5132 5360 6226 6226 6226 6226 6226 6226 6226 6226 6226 6226 6226 6226 6226 6226
Operating and Maintenance 17771 18219 18689 19539 20129 20748 21353 21987 22415 23101 23836 24588 25368 26174 27004 27861 28744 29656 30597 31567 32568 33602 34668 35768
Transfer to Capital Reserves 1777 1674 1170 2478 3982 4117 4044 4193 4143 3974 4358 4829 4474 4477 4481 4484 4488 4492 4496 4500 4504 4509 4513 4518
Debt Repayment - - - - 57 105 146 239 319 373 473 692 911 1130 1292 1462 1640 1767 1906 2071 2190 2190 2190 2190
Less Non-Rate Revenue 1438 1445 1453 1464 476 487 500 512 526 539 555 571 588 605 623 641 660 667 687 708 729 751 773 796
Revenue Requirements (from Users)
Revenue from Base Charge
Revenue from Uniform Rate
20986
1218
17878
21338
1247
18186
21312
1279
18535
23481
1292
20245
24644
1421
22256
25458
1468
22999
26042
1502
23524
26931
1553
24335
27403
1580
24753
27987
1613
25277
29222
1686
26407
30680
1771
27747
31340
1809
28336
32386
1869
29285
33399
1928
30204
34448
1989
31155
35532
2051
32138
36582
2113
33111
37686
2177
34110
38846
2244
35161
39991
2310
36198
41051
2371
37152
42144
2434
38136
43272
2499
39152
Annual Increase ($)
Annual Increase ()
617
3
337
2
382
2
1723
9
2139
10
790
3
559
2
863
3
445
2
557
2
1203
4
1425
5
626
2
1010
3
978
3
1012
3
1045
3
1035
3
1063
3
1118
3
1103
3
1015
3
1047
3
1081
3
Appendix E - System Costs and Revenue Requirements
System Costs and Revenue Requirements - Water System
CostRevenue Item ($000) 2016 2017 2018 2019 2020 2021 2022 2023 2024 2025 2026 2027 2028 2029 2030 2031 2032 2033 2034 2035 2036 2037 2038 2039
Municipal Capital Forecast 6503 4836 5953 4384 3102 4127 2131 2259 3238 4053 - - - - - - - - - - - - - -
Replacement Costs from Asset - - - - 0 - - - - 0 4210 4210 4210 4210 4210 4210 4210 4210 4210 4210 4210 4210 4210 4210
Replacement Summary
Total Capital Requirements 6503 4836 5953 4384 3102 4127 2131 2259 3238 4053 4210 4210 4210 4210 4210 4210 4210 4210 4210 4210 4210 4210 4210 4210
Debt Financing - - - - - - - - - - 1263 1263 1263 1263 1263 1263 1263 1263 1263 1263 1263 1263 1263 1263
Capital Reserve Financing 2329 2906 3767 2150 2842 3863 1863 1988 2669 2093 2947 2947 2947 2947 2947 2947 2947 2947 2947 2947 2947 2947 2947 2947
Transfer from Operating - - - - - - - - - - - - - - - - - - - - - - - -
Other Financing (Grants Third 412 - - - - - - - - - - - - - - - - - - - - - - -
Party etc)
DC Reserve Financing 3763 1929 2185 2235 260 264 267 271 570 1959 - - - - - - - - - - - - - -
Total Capital Financing 6503 4836 5953 4384 3102 4127 2131 2259 3238 4053 4210 4210 4210 4210 4210 4210 4210 4210 4210 4210 4210 4210 4210 4210
Operating and Maintenance 21306 22483 23938 25109 24993 26862 28108 29125 30245 31938 32978 34204 35474 36795 38185 39346 40484 41662 42876 44129 45417 46740 48102 49505
Transfer to Capital Reserves 3228 2644 2276 2835 3788 3898 2828 1988 2669 2093 2947 2947 2947 2947 2947 2947 2947 2947 2947 2947 2947 2947 2947 2947
Debt Repayment - - - - - - - - - - - 148 296 444 592 740 888 1036 1184 1332 1480 1480 1480 1480
Less Non-Rate Revenue 1181 1101 1020 1057 1081 1121 1160 1199 1239 1260 1297 1336 1375 1416 1458 1502 1546 1580 1627 1676 1726 1778 1832 1886
Revenue Requirements (from Users)
Revenue from Base Charge
25714
-
26227
-
27233
-
29001
-
29862
-
31881
-
32096
-
32311
-
34153
-
35291
-
37222
-
38634
-
40092
-
41602
-
43182
-
44535
-
45866
-
47225
-
48635
-
50084
-
51571
-
52945
-
54361
-
55819
-
Revenue from Uniform Rate 22353 23026 24194 25888 27700 29639 29776 29914 31675 32772 34628 35963 37341 38769 40265 41531 42773 44065 45380 46732 48118 49389 50698 52046
Annual Increase ($) 1139 673 1168 1694 1812 1939 137 137 1762 1096 1856 1335 1378 1428 1496 1266 1242 1292 1315 1352 1386 1271 1309 1348
Annual Increase () 5 3 5 7 7 7 0 0 6 3 6 4 4 4 4 3 3 3 3 3 3 3 3 3
Appendix F
PROJECTED FULL COST OF SERVICE
Appendix F - Projected Full Cost of Service
Projected Full Cost of Service - Water System
Cost Component 2016 2017 2018 2019 2020 2021 2022 2023 2024 2025 2026 2027 2028 2029 2030 2031 2032 2033 2034 2035 2036 2037 2038 2039
OampM 5467 5569 5680 6098 6242 6391 6545 6706 6635 6806 7011 7221 7438 7661 7891 8128 8372 8623 8882 9149 9423 9706 9997 10297
Regional Charge 12304 12649 13010 13442 13888 14357 14808 15281 15780 16295 16825 17367 17930 18512 19113 19732 20372 21032 21715 22419 23145 23896 24671 25470
Capital Expenditure 1777 1674 1170 2478 3982 4117 4044 4193 4143 3974 4358 4829 4474 4477 4481 4484 4488 4492 4496 4500 4504 4509 4513 4518
Debt Repayment -
Total 19548
-
19893
-
19859
-
22017
57
24169
105
24971
146
25543
239
26419
319
26877
373
27448
473
28667
692
30109
911
30752
1130
31781
1292
32777
1462
33807
1640
34872
1767
35915
1906
36999
2071
38138
2190
39262
2190
40300
2190
41371
2190
42475
Cost Component 2016 2017 2018 2019 2020 2021 2022 2023 2024 2025 2026 2027 2028 2029 2030 2031 2032 2033 2034 2035 2036 2037 2038 2039
OampM 5058 5191 5264 5640 4766 4956 5133 5048 5072 5545 5430 5601 5769 5943 6123 6293 6479 6673 6873 7080 7292 7511 7736 7968
Regional Charge 16248 17291 18674 19470 20227 21906 22975 24076 25173 26393 27548 28603 29705 30852 32062 33053 34006 34989 36003 37049 38125 39229 40366 41537
Capital Expenditure 3228 2644 2276 2835 3788 3898 2828 1988 2669 2093 2947 2947 2947 2947 2947 2947 2947 2947 2947 2947 2947 2947 2947 2947
Debt Repayment - - - - - - - - - - - 148 296 444 592 740 888 1036 1184 1332 1480 1480 1480 1480
Total 24534
25126 26214 27944 28781 30760 30936 31112 32914 34031 35925 37299 38717 40185 41724 43033 44319 45645 47008 48408 49844 51167 52529 53932
Projected Full Cost of Service - Sanitary Sewer System
Appendix G
ANNUAL CASH FLOW
Appendix G - Annual Cash Flow
Annual Cash Flow - Water System
Annual Cash Flow ($000) 2016 2017 2018 2019 2020 2021 2022 2023 2024 2025 2026 2027 2028 2029 2030 2031 2032 2033 2034 2035 2036 2037 2038 2039
Annual Opening Balance - - - - - - - - - - - - - - - - - - - - - - - -
Revenue from Base Charge 1218 1247 1279 1292 1421 1468 1502 1553 1580 1613 1686 1771 1809 1869 1928 1989 2051 2113 2177 2244 2310 2371 2434 2499
Revenue from Uniform Rate 17878 18186 18535 20245 22256 22999 23524 24335 24753 25277 26407 27747 28336 29285 30204 31155 32138 33111 34110 35161 36198 37152 38136 39152
Non-Rate Revenues 1438 1445 1453 1464 476 487 500 512 526 539 555 571 588 605 623 641 660 667 687 708 729 751 773 796
Operating Expenditures 17771 18219 18689 19539 20129 20748 21353 21987 22415 23101 23836 24588 25368 26174 27004 27861 28744 29656 30597 31567 32568 33602 34668 35768
(Contributions to) Capital 1777 1674 1593 2478 3982 4117 4044 4193 4143 3974 4358 4829 4474 4477 4481 4484 4488 4492 4496 4500 4504 4509 4513 4518
Reserve - 1 - (Cash Budget) (Contributions to) Capital
1000 1000 1000 1000 - - - - - - - - - - - - - - - - - - - - Reserve - 2 - (Cash Budget)
(Contributions to) Lifecycle - - - - - - - - - - - - - - - - - - - - - - - -
Reserve - (Cash Budget) Debt Repayment - (Cash
- - - - 57 105 146 239 319 373 473 692 911 1130 1292 1462 1640 1767 1906 2071 2190 2190 2190 2190 Outflow)
Annual Closing Balance - - - - - - - - - - - - - - - - - - - - - - - -
Annual Cash Flow ($000) 2016 2017 2018 2019 2020 2021 2022 2023 2024 2025 2026 2027 2028 2029 2030 2031 2032 2033 2034 2035 2036 2037 2038 2039
Annual Opening Balance - - - - - - - - - - - - - - - - - - - - - - - -
Revenue from Base Charge - - - - - - - - - - - - - - - - - - - - - - - -
Non-Rate Revenues
Loan Repayment
Revenue from Uniform Rate 22353
1181
23026 24194
1101
1020
1000
25888 27700
1057
1081
-
29639 29776
1121
1160
-
29914 31675
1199
1239
-
32772
1260
-
34628
1297
-
35963
1336
-
37341
1375
-
38769
1416
-
40265
1458
-
41531
1502
-
42773
1546
-
44065
1580
-
45380
1627
-
46732
1676
-
48118
1726
-
49389
1778
-
50698
1832
-
52046
1886
-
Operating Expenditures
(Contributions to) Capital Reserve - 1 - (Cash Budget)
(Contributions to) Capital
1000
21306
3228
-
-
-
1000
22483
2644
-
-
-
23938
2276
-
-
-
1000
25109
2835
-
-
-
24993
3788
-
-
-
-
26862
3898
-
-
-
28108
2828
-
-
-
-
29125
1988
-
-
-
30245
2669
-
-
-
31938
2093
-
-
-
32978
2947
-
-
-
34204
2947
-
35474
2947
-
36795
2947
-
38185
2947
-
39346
2947
-
40484
2947
-
41662
2947
-
42876
2947
-
44129
2947
-
45417
2947
-
46740
2947
-
48102
2947
-
49505
2947
- Reserve - 2 - (Cash Budget)
(Contributions to) Lifecycle Reserve - (Cash Budget)
Debt Repayment - (Cash Outflow)
Annual Closing Balance
- - - - - - - - - - - - - - - - - - - - - - - -
148 296 444 592 740 888 1036 1184 1332 1480 1480 1480 1480
- - - - - - - - - - - - -
Annual Cash Flow - Sanitary Sewer
Appendix H
REQUIREMENTS OF ONTARIO REGULATIONS 45307
Appendix A Requirements of OReg 45307
Requirements How Requirements are Met
1 The financial plans that is passed by
must be approved by a resolution
i The council of the municipality if the owner of the drinking water system is a municipality
It is expected the Council will approve the Updated Financial Plan prior to June 1st 2016
ii The governing body of the owner if the owner of the drinking water system has a governing body
and is not a municipality
NA
2 The financial plans must apply to a period of at least six Applies for 6 years from 2016 to 2021 inclusive years
3 The first year to which the financial plans must apply must be the year determined in accordance with the
following rules
i If the financial plans are required by subsection 2 the first year to which the financial plans must
apply must be the year in which the drinking water systemrsquos existing municipal drinking water
licence would otherwise expire
The licence expires in 2016 for the water systems (No112-301) Therefore the first year
of the Updated Financial Plan is 2016
ii If the financial plans are required by a condition that was included in a municipal drinking water
licence under subsection 1 (3) the first year to which the financial plans must apply must be the
later of 2010 and the year in which the first licence for the system was issued
NA
4 Subject to subsection financial plans apply
the following
(2) the
for each year financial plans
to which the must include
i Details of the proposed or projected financial position of the drinking water system itemized by
See Statement of Financial Position for all water systems combined in Financial Plan
a Total financial assets See Statement of Financial Position for all water systems combined in Financial Plan
b Total liabilities See Statement of Financial Position for all water systems combined in Financial Plan
c Net financial assets (debt) See Statement of Financial Position for all water systems combined in Financial Plan
d Non-financial assets that are tangible capital assets tangible capital assets
under construction inventories of supplies and prepaid expenses
See Statement of Financial Position for all water systems combined in Financial Plan TCA
Projections in Financial Plan
e Changes in tangible capital assets that are additions donations write downs
and disposals
See Statement of Financial Position for all water systems combined in Financial Plan TCA
Projections in Financial Plan
Appendix A Requirements of OReg 45307
ii Details of the proposed or projected financial operations of the drinking water system itemized by
See Statement of Operations for all water systems combined in Financial Plan
a Total revenues further itemized by water rates user charges and other revenues
See Statement of Operations for all water systems combined in Financial Plan
b Total expenses further itemized by amortization expenses interest expenses and other expenses
See Statement of Operations for all water systems combined in Financial Plan
c Annual surplus or deficit and See Statement of Operations for all water systems combined in Financial Plan
d Accumulated surplus or deficit See Statement of Operations for all water systems combined in Financial Plan
iii Details of the drinking water systemrsquos proposed or projected gross cash receipts and gross cash payments itemized by
See Statement of Cash Flow for all water systems combined in Financial Plan
a Operating transactions that are cash received from revenues cash paid for operating expenses and finance charges - done in full cost report
See Statement of Cash Flow for all water systems combined in Financial Plan
b Capital transactions that are proceeds on the sale of tangible capital assets and cash used to acquire capital assets
See Statement of Cash Flow for all water systems combined in Financial Plan
c Investing transactions that are acquisitions and disposal of investments
See Statement of Cash Flow for all water systems combined in Financial Plan
d Financing transactions that are proceeds from the issuance of debt and debt repayment
See Statement of Cash Flow for all water systems combined in Financial Plan
e Changes in cash and cash equivalents during the year
See Statement of Cash Flow for all water systems combined in Financial Plan
f Cash and cash equivalents at the beginning and end of the year
See Statement of Cash Flow for all water systems combined in Financial Plan
iv Details of the extent to which the information described in subparagraphs i ii and iii relates directly to the replacement of lead service pipes as defined in section 151- 3 of Schedule 151 to Ontario Regulation 17003 (Drinking Water Systems) made under the Act
Lead services are replaced as part of watermain rehabilitation projects andor road reconstruction projects when undertaken Although not all the streets contain lead services all of the water services to the property line are replaced for every rehabilitation and reconstruction project
5 The owner of the drinking water system must
i Make the financial plans available on request to members of the public who are served by the drinking water system without charge
This will be done by the municipality following Council approval
ii Make the financial plans available to members of the public without charge through publication on the Internet if the owner maintains a website on the Internet
The Financial Plan will be posted on the municipalityrsquos website and made available for public review at no charge
Appendix A Requirements of OReg 45307
iii Provide notice advising the public of the availability of the financial plans under
subparagraphs i and ii if applicable in a manner that in the opinion of the owner will bring the
notice to the attention of members of the public who are served by the drinking water system
A notice will be issued following Council approval
6 The owner of the drinking water system must give a copy of the financial plans to the Ministry of Municipal
Affairs and Housing O Reg 45307 s 3 (1)
Will be submitted following Council approval
Each of the following sub-subparagraphs applies only if the information referred to in the sub-
subparagraph is known to the owner at the time the financial plans are prepared
The Financial Plan was prepared using available information at the time of preparation and may
not contain all desired items Reasonable assumptions were made and these are noted in
the Financial Plan
1 Sub-subparagraphs 4 i A B and C of subsection (1)
The Financial Plan was prepared using available information at the time of preparation and may
not contain all desired items Reasonable assumptions were made and these are noted in
the Financial Plan
2 Sub-subparagraphs 4 iii A C E subsection (1) O Reg 45307 s 3 (2)
and F of The Financial Plan was prepared using available information at the time of preparation and may
not contain all desired items Reasonable assumptions were made and these are noted in
the Financial Plan
Appendix I
SERVICE CHARGES amp RATE PROJECTIONS
Appendix I - Service Charges and Rate Projections
Service Charges amp Rate Projections - Option 1
Rate Component
2016 2017 2018 2019 2020 2021 2022 2023 2024 2025 2026 2027 2028 2029 2030 2031 2032 2033 2034 2035 2036 2037 2038 2039
Annual Water Service Charges
Annual Increase ()
241 235 262 029 915 261 157 273 101 141 376 436 143 266 245 247 248 236 235 242 229 198 200 202
15 mm
3576
3660
3756
3767
4111
4219
4285
4402
4446
4509
4678
4882
4952
5084
5209
5337
5470
5598
5730
5869
6003
6122
6245
6371
25 mm
7224
7404
7584
7606
8302
8518
8651
8887
8977
9104
9447
9859
10000
10266
10518
10777
11044
11304
11570
11850
12121
12362
12609
12864
40 mm
13200
13536
13872
13912
15185
15580
15825
16256
16421
16653
17279
18032
18291
18777
19238
19713
20201
20677
21163
21675
22171
22611
23063
23529
50 mm
16548
16956
17376
17426
19020
19516
19822
20362
20569
20859
21643
22587
22911
23520
24097
24692
25304
25900
26509
27150
27771
28322
28889
29473
75 mm
34572
35436
36324
36428
39761
40797
41437
42567
42998
43605
45245
47218
47895
49169
50374
51618
52896
54142
55415
56755
58055
59207
60392
61612
100 mm
50568
51828
53124
53276
58151
59666
60601
62254
62885
63773
66171
69056
70046
71909
73673
75491
77361
79183
81045
83005
84906
86590
88324
90107
150 mm
85992
88140
90348
90607
98898
101474
103065
105876
106948
108459
112537
117444
119127
122296
125295
128387
131568
134667
137834
141167
144399
147263
150212
153246
200 mm
129816
133056
136380
136771
149286
153175
155576
159819
161438
163718
169874
177282
179822
184606
189133
193800
198602
203279
208060
213091
217970
222294
226744
231324
250 mm
172620
176940
181368
181888
198531
203703
206896
212539
214692
217724
225911
235762
239141
245502
251522
257729
264115
270335
276693
283383
289872
295622
301541
307631
Uniform Rate
Annual Increase ()
241 235 287 878 948 291 187 303 131 170 405 465 171 294 273 274 275 262 262 268 255 224 226 227
Uniform Water Rate ($msup3) 170 174 179 195 213 219 223 230 233 237 247 258 263 270 278 285 293 301 309 317 325 333 340 348
Annual Increase ()
333 323 580 655 655 655 004 004 545 303 523 343 341 340 344 273 258 261 258 257 256 224 225 226
Uniform
Wastewater 217 224
Rate ($msup3)
237
253
269 287
287
287
303
312
328
339
351
363
375
386
395
406
416
427
438
448
458
468
Appendix I - Service Charges and Rate Projections
Service Charges amp Rate Projections - Option 2
Rate 2016 2017 2018 2019 2020 2021 2022 2023 2024 2025 2026 2027 2028 2029 2030 2031 2032 2033 2034 2035 2036 2037 2038 2039
Component
Annual Water Service Charges
Annual Increase 241 235 262 15072 915 261 157 273 101 141 376 436 143 266 245 247 248 236 235 242 229 198 200 202
()
15 mm
3576 3660 3756 9417 10279 10546 10712 11004 11115 11272 11696 12206 12381 12710 13022 13343 13674 13996 14325 14672 15008 15305 15612 15927
25 mm
7224 7404 7584 19014 20754 21295 21629 22219 22444 22761 23616 24646 24999 25665 26294 26943 27610 28261 28925 29625 30303 30904 31523 32159
40 mm
13200 13536 13872 34779 37962 38951 39561 40640 41052 41632 43197 45081 45727 46943 48094 49281 50502 51692 52907 54187 55427 56527 57659 58823
50 mm
16548 16956 17376 43565 47551 48790 49554 50906 51422 52148 54109 56468 57277 58801 60243 61730 63259 64749 66272 67874 69428 70805 72223 73682
75 mm
34572 35436 36324 91070 99403 101993 103592 106417 107495 109013 113112 118045 119737 122922 125936 129044 132241 135356 138539 141889 145137 148017 150980 154029
100 mm
50568 51828 53124 133191 145378 149165 151503 155636 157212 159432 165427 172641 175115 179773 184182 188727 193403 197958 202613 207513 212264 216475 220809 225268
150 mm
85992 88140 90348 226518 247244 253686 257662 264689 267371 271147 281342 293611 297818 305741 313238 320968 328921 336667 344585 352917 360997 368159 375530 383114
200 mm
129816 133056 136380 341928 373214 382938 388939 399548 403596 409295 424685 443205 449556 461515 472832 484500 496505 508198 520149 532727 544924 555734 566861 578309
250 mm
172620 176940 181368 454720 496327 509258 517240 531348 536731 544310 564777 589406 597852 613756 628806 644324 660288 675838 691732 708458 724679 739056 753852 769078
Uniform Rate
Annual Increase 241 235 287 -164 948 291 187 303 131 170 405 465 171 294 273 274 275 262 262 268 255 224 226 227
()
Uniform Water Rate ($msup3) 170 174 179 176 193 198 202 208 211 215 223 234 238 245 251 258 265 272 279 287 294 301 308 314
Rate
2016 2017 2018 2019 2020 2021 2022 2023 2024 2025 2026 2027 2028 2029 2030 2031 2032 2033 2034 2035 2036 2037 2038 2039 Component
Annual Wastewater Service Charges
Annual Increase 623 624 -025 -025 515 274 494 314 313 312 316 246 231 234 231 231 230 198 200 201
()
15 mm
- - - 11433 12145 12902 12870 12839 13500 13870 14555 15012 15482 15965 16470 16875 17264 17669 18077 18495 18921 19296 19681 20077
25 mm
- - - 23085 24523 26052 25987 25924 27258 28006 29389 30313 31260 32237 33256 34073 34859 35676 36501 37344 38204 38962 39740 40538
40 mm
- - - 42224 44855 47653 47534 47417 49859 51226 53755 55445 57179 58964 60829 62323 63762 65256 66765 68307 69879 71265 72689 74149
50 mm
- - - 52890 56186 59689 59541 59394 62453 64166 67333 69451 71622 73858 76194 78066 79867 81739 83629 85561 87530 89266 91049 92879
75 mm
- - - 110565 117454 124779 124468 124162 130556 134137 140758 145185 149723 154399 159281 163195 166961 170874 174824 178864 182979 186609 190336 194161
100 mm
- - - 161702 171777 182489 182035 181588 190938 196176 205859 212333 218970 225809 232949 238673 244180 249903 255681 261589 267608 272916 278367 283961
150 mm
- - - 275007 292141 310360 309588 308826 324729 333637 350105 361115 372403 384033 396176 405911 415278 425011 434837 444884 455121 464148 473419 482932
200 mm
- - - 415122 440986 468487 467321 466172 490177 503624 528482 545102 562141 579697 598026 612721 626860 641552 656384 671551 687003 700630 714624 728984
250 mm
- - - 552059 586456 623028 621478 619950 651872 669755 702814 724916 747576 770923 795298 814841 833644 853182 872907 893077 913626 931748 950359 969456
Uniform Rate
Annual Increase 333 323 580 -943 655 655 004 004 545 303 523 343 341 340 344 273 258 261 258 257 256 224 225 226
()
Uniform
Wastewater 217 224 237 215 229 244 244 244 257 265 279 288 298 308 319 328 336 345 354 363 372 381 389 398
Rate ($msup3)
Appendix I - Service Charges and Rate Projections
Service Charges amp Rate Projections - Option 3
Rate Component
2016 2017 2018 2019 2020 2021 2022 2023 2024 2025 2026 2027 2028 2029 2030 2031 2032 2033 2034 2035 2036 2037 2038 2039
Annual Water Service Charges
Annual Increase ()
241 235 262 32175 950 293 188 304 132 172 407 467 173 296 275 276 276 264 263 270 256 226 227 229
15 mm
3576
3660
3756
15841
17345
17853
18190
18743
18991
19317
20104
21042
21406
22039
22644
23268
23912
24543
25189
25868
26531
27130
27746
28380
25 mm
7224
7404
7584
31985
35023
36049
36728
37846
38346
39005
40592
42488
43222
44500
45722
46983
48282
49556
50860
52232
53571
54779
56023
57304
40 mm
13200
13536
13872
58505
64062
65938
67180
69225
70140
71345
74248
77715
79059
81396
83631
85937
88313
90643
93029
95538
97988
100198
102473
104815
50 mm
16548
16956
17376
73283
80244
82593
84149
86711
87857
89366
93003
97345
99028
101957
104755
107644
110620
113539
116528
119670
122739
125507
128357
131291
75 mm
34572
35436
36324
153196
167747
172659
175912
181267
183662
186817
194420
203497
207016
213137
218988
225027
231248
237351
243599
250167
256582
262369
268327
274460
100 mm
50568
51828
53124
224050
245330
252515
257272
265103
268606
273220
284339
297615
302762
311714
320271
329103
338202
347126
356264
365870
375253
383715
392429
401399
150 mm
85992
88140
90348
381042
417233
429452
437542
450861
456818
464666
483576
506154
514907
530132
544685
559706
575180
590358
605899
622235
638192
652585
667404
682659
200 mm
129816
133056
136380
575182
629812
648256
660468
680574
689565
701412
729957
764038
777250
800232
822199
844874
868232
891143
914602
939261
963349
985075
1007443
1030471
250 mm
172620
176940
181368
764919
837569
862098
878338
905076
917034
932788
970749
1016073
1033643
1064206
1093420
1123574
1154638
1185107
1216304
1249098
1281132
1310023
1339771
1370395
Uniform Rate
Annual Increase ()
241 235 287 535 950 293 188 304 132 172 407 467 173 296 275 276 276 264 263 270 256 226 227 229
Block 1 ($msup3)
170
174
179
189
206
213
217
223
226
230
239
251
255
262
270
277
285
292
300
308
316
323
330
338
Block 2 ($msup3)
226
248
255
260
268
271
276
287
301
306
315
323
332
342
351
360
370
379
388
396
405
Rate
Component 2016 2017 2018 2019 2020 2021 2022 2023 2024 2025 2026 2027 2028 2029 2030 2031 2032 2033 2034 2035 2036 2037 2038 2039
Annual Sanitary Sewer Service Charges
Annual Increase ()
15 mm
25 mm
40 mm
50 mm
75 mm
100 mm
150 mm
200 mm
250 mm
Uniform Rate
Annual Increase ()
-
-
-
-
-
-
-
-
-
333
-
-
-
-
-
-
-
-
-
323
-
-
-
-
-
-
-
-
-
580
19322
39015
71363
89389
186865
273291
464787
701594
933030
-294
657
20591
41577
76050
95260
199137
291239
495311
747670
994305
657
657
21944
44309
81046
101517
212219
310371
527848
796784
1059622
657
006
21957
44335
81095
101579
212347
310558
528167
797266
1060262
006
006
21970
44362
81143
101639
212474
310744
528483
797743
1060897
006
547
23172
46788
85580
107197
224092
327736
557380
841363
1118906
547
305
23879
48215
88191
110468
230930
337736
574388
867036
1153048
305
525
25132
50745
92819
116264
243047
355457
604526
912531
1213549
525
345
25998
52495
96019
120272
251426
367712
625367
943990
1255386
345
343
26889
54293
99307
124392
260038
380306
646787
976322
1298384
343
342
27808
56149
102703
128645
268929
393309
668901
1009704
1342777
342
345
28769
58089
106251
133090
278220
406898
692011
1044588
1389169
345
275
29558
59684
109168
136743
285858
418068
711008
1073265
1427305
275
259
30325
61231
111998
140288
293267
428905
729438
1101085
1464302
259
263
31121
62838
114938
143971
300967
440165
748589
1129992
1502746
263
259
31927
64466
117916
147701
308764
451568
767982
1159266
1541676
259
259
32753
66133
120965
151521
316749
463247
787845
1189249
1581549
259
257
33596
67836
124079
155421
324902
475171
808123
1219859
1622257
257
225
34353
69364
126874
158922
332222
485876
826329
1247340
1658803
225
226
35130
70934
129747
162520
339743
496876
845037
1275580
1696358
226
227
35929
72547
132696
166215
347467
508171
864247
1304578
1734923
227
Block 1 ($msup3)
217
224
237
230
245
261
261
262
276
284
299
310
320
331
342
352
361
370
380
390
400
409
418
428
Block 2 ($msup3)
276
294
313
314
314
331
341
359
371
384
397
411
422
433
445
456
468
480
491
502
513


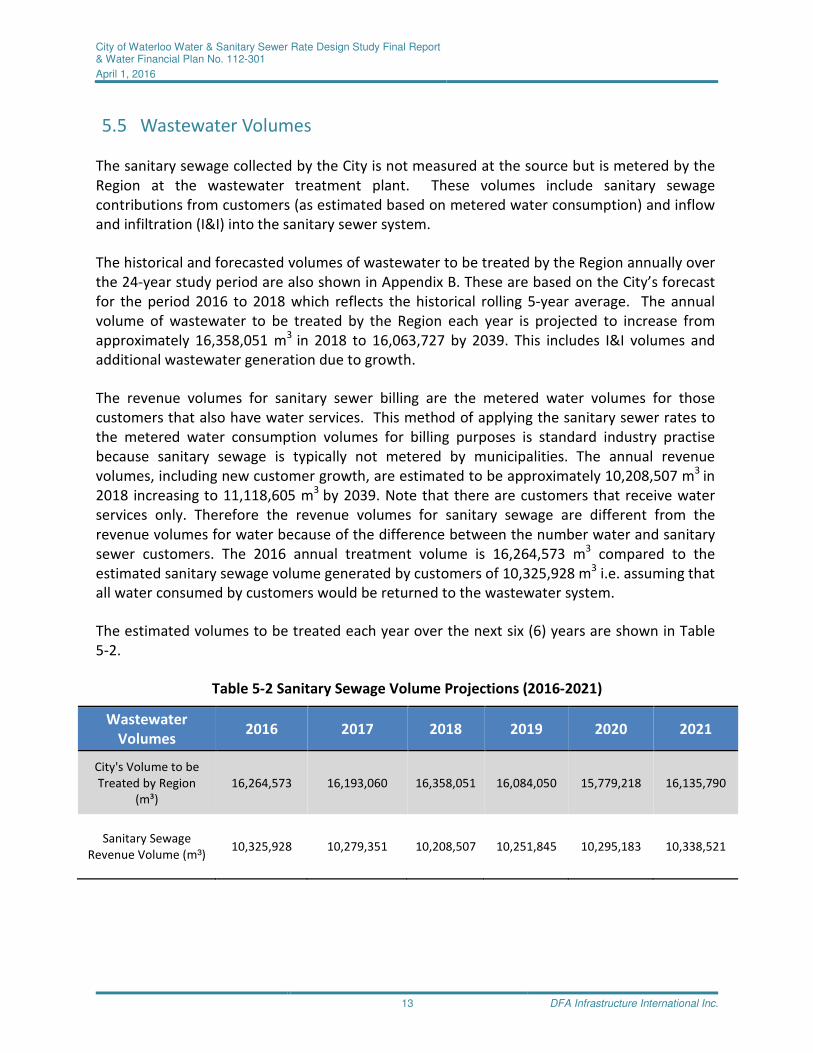


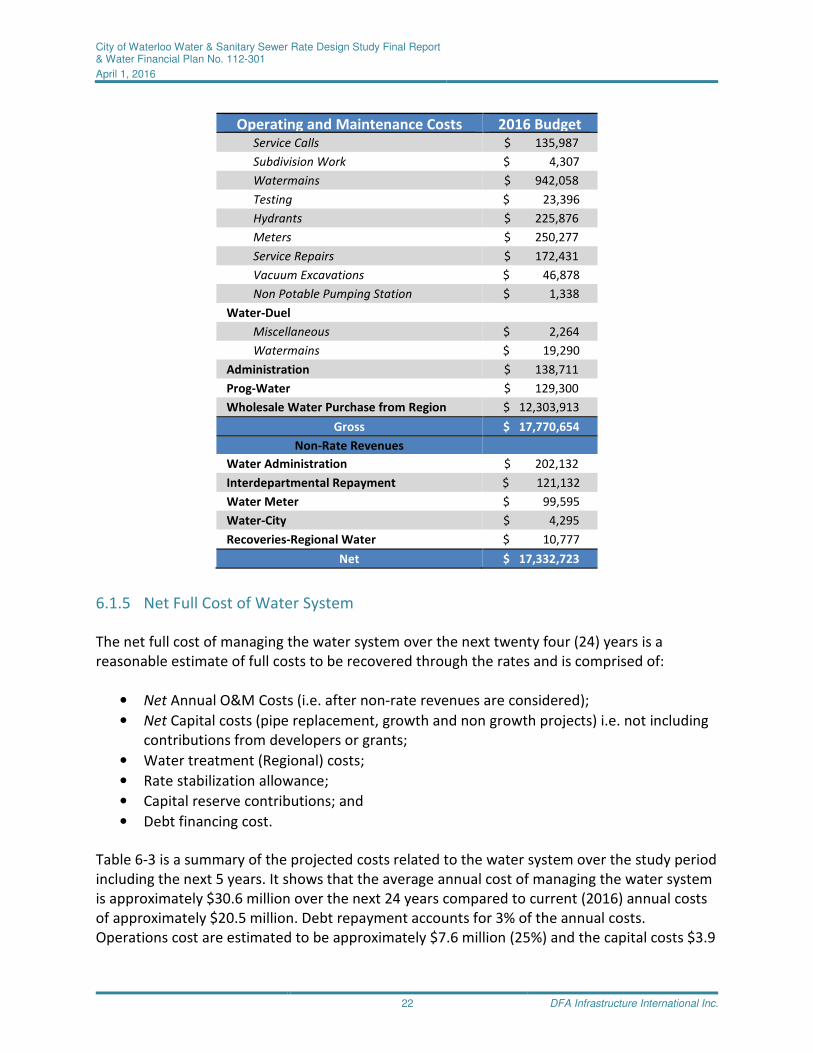


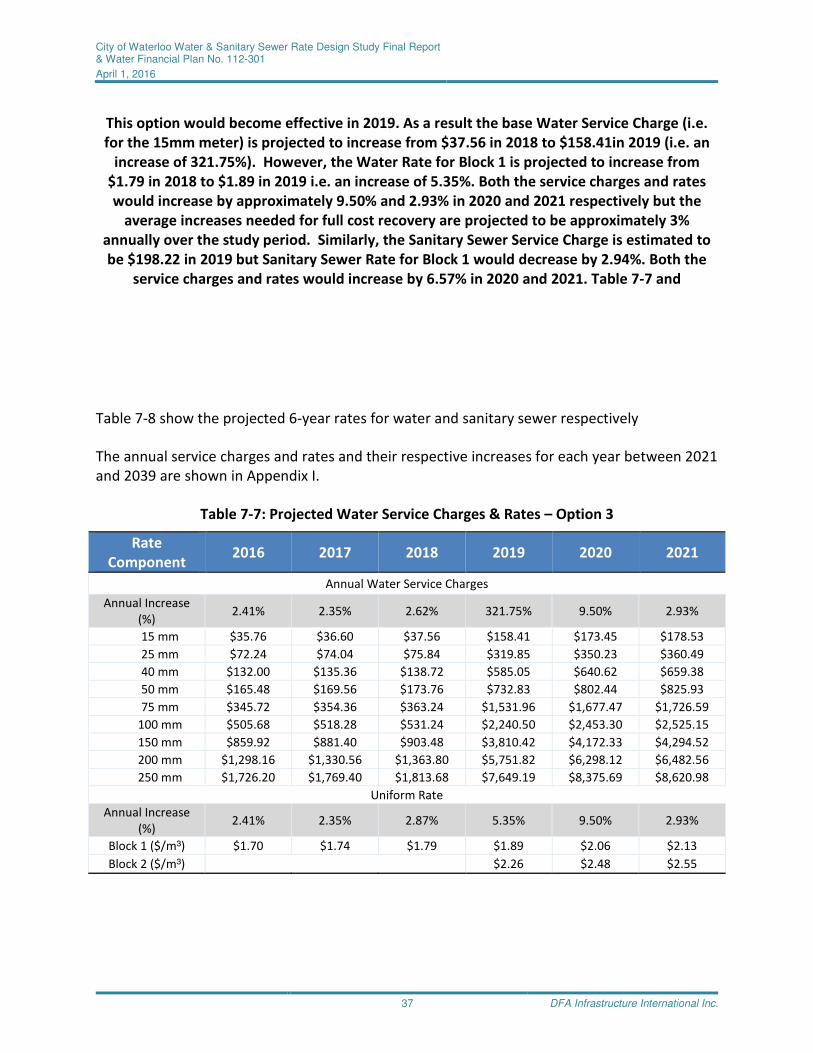
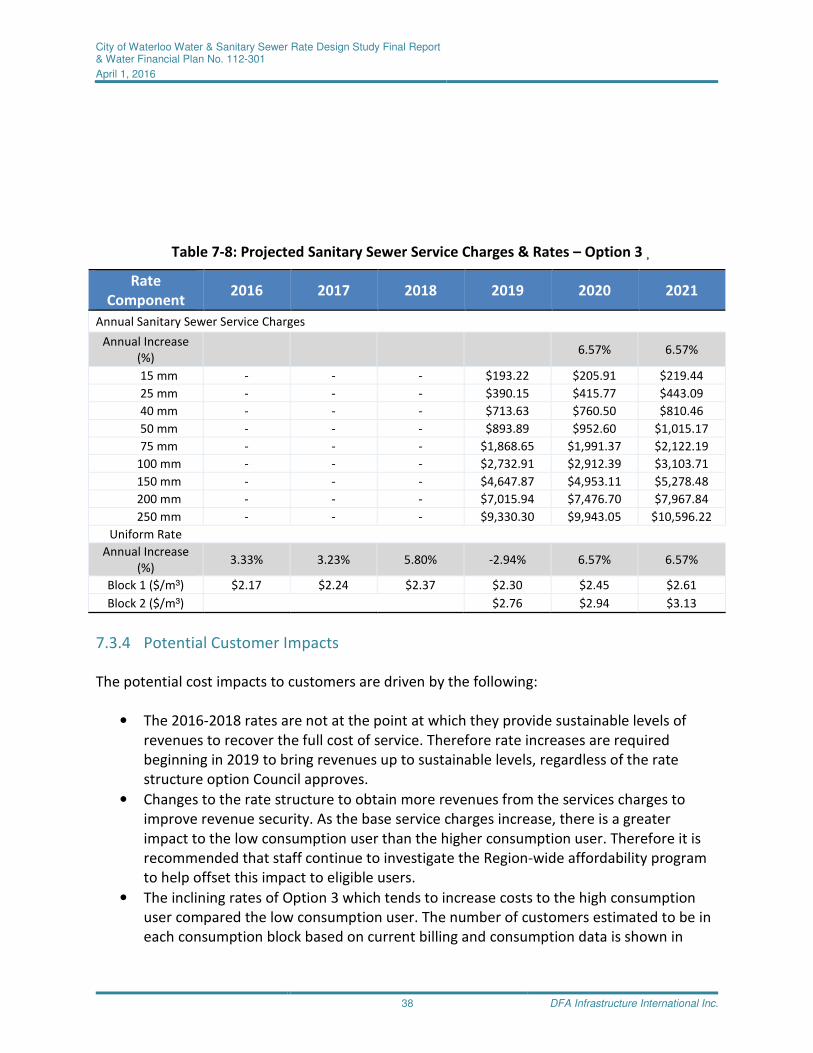


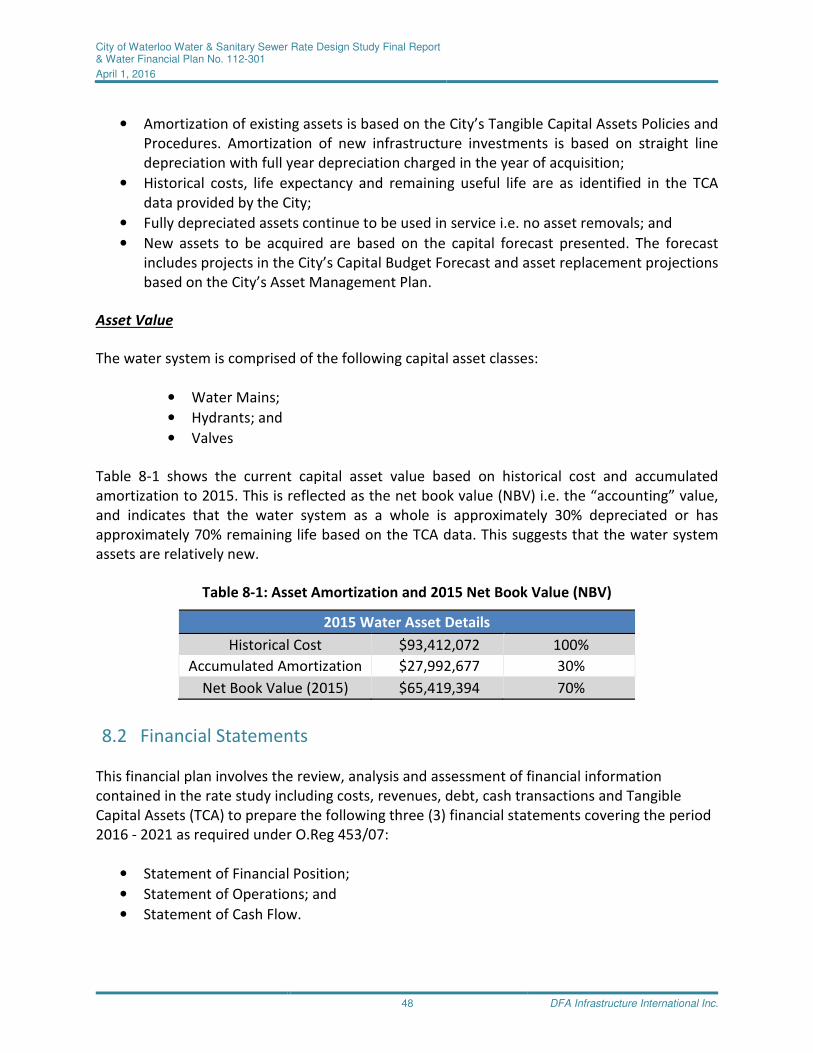


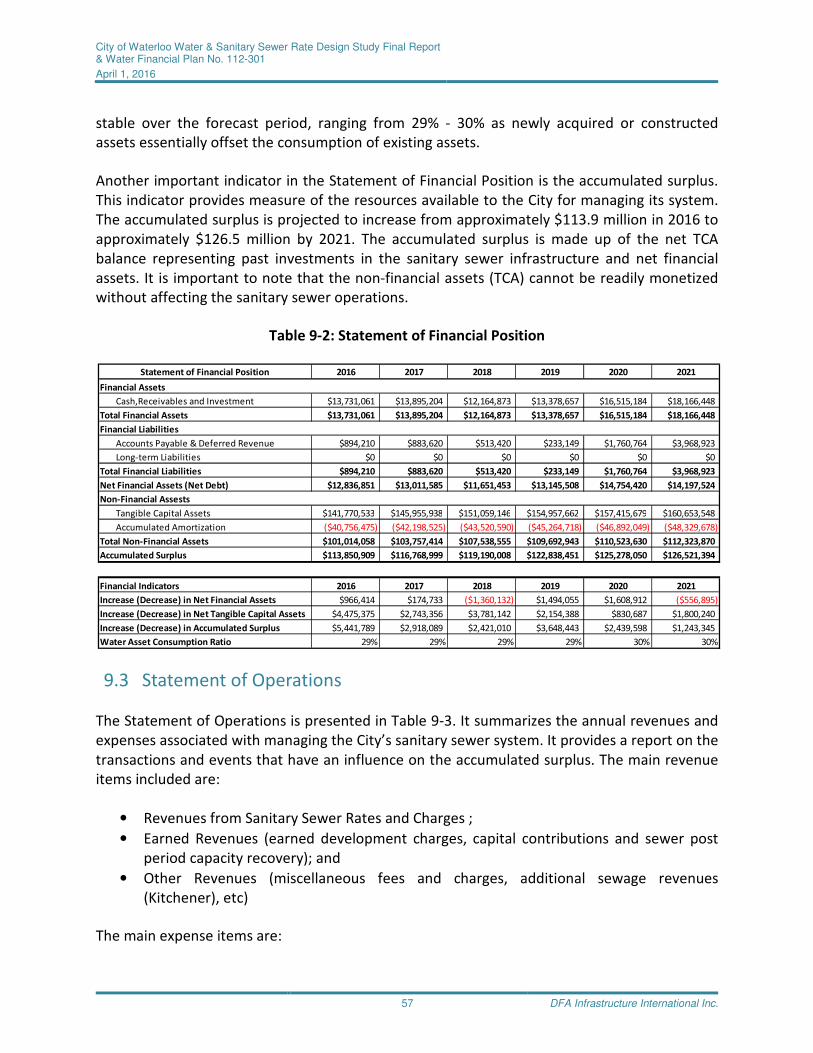


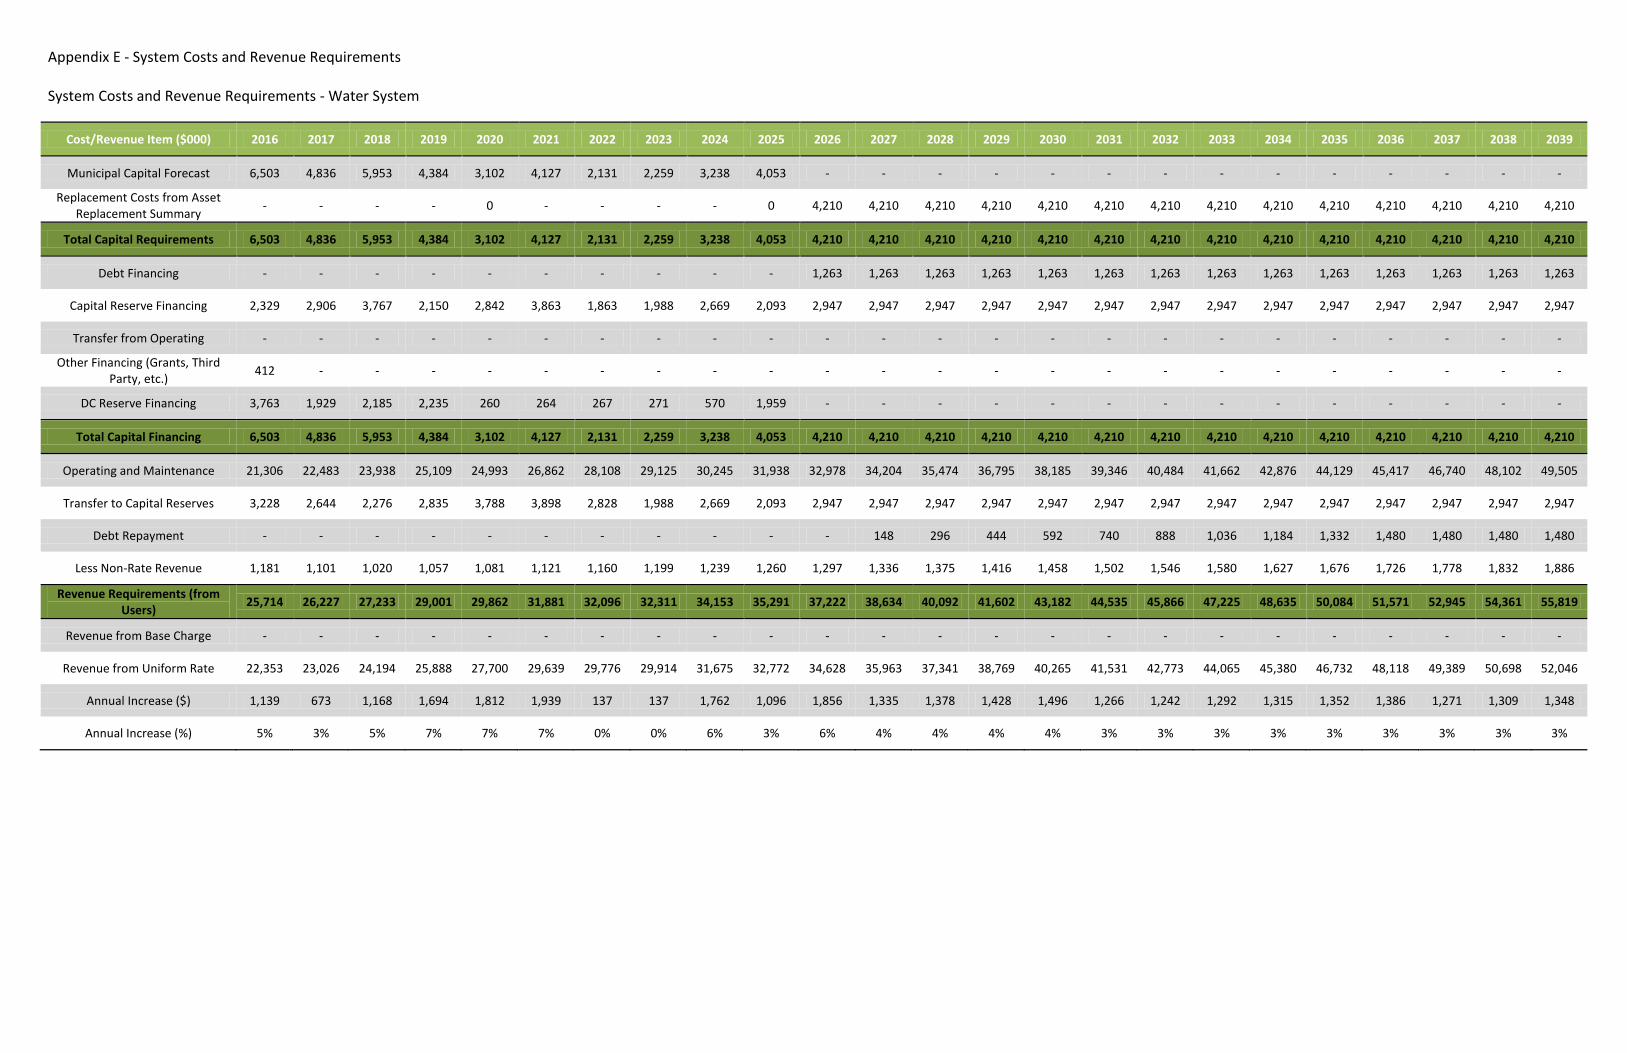


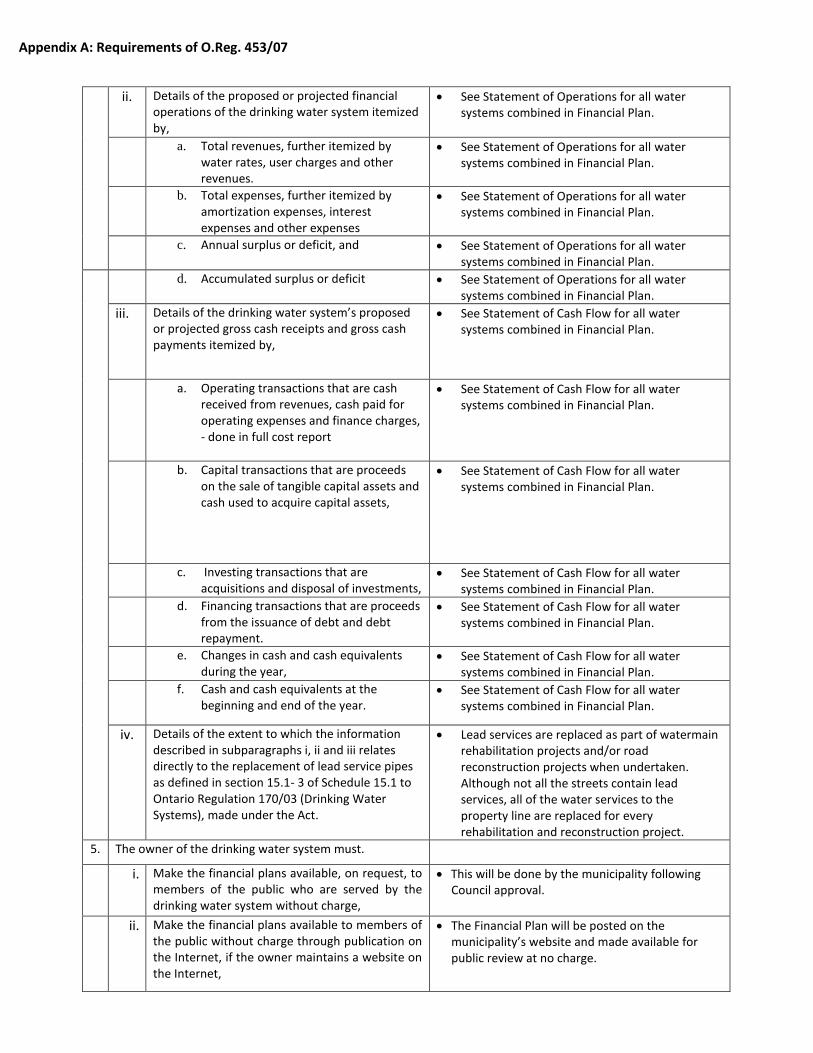


Top Related