


Languages
Pages
Legal

(c) D. J. Dunn www.freestudy.co.uk 1
CITY AND GUILDS 9210
Unit 130 MECHANICS OF MACHINES AND STRENGTH OF MATERIALS
OUTCOME 2
TUTORIAL 4 - SHEAR FORCE AND BENDING MOMENTS IN BEAMS
Outcome 2 SOLVE PROBLEMS INVOLVING SIMPLE AND COMBINED
MODES INCLUDING TORSION AND BENDING.
The learner can:
1. Explain and solve problems re. centroids, moment, second moment of areas and products
of moment of plane areas; parallel axis theorem.
2. Explain the basics of 2D and 3D stress states and stress elements.
3. Explain and solve problems in respect of torsional moments and stresses.
4. Solve problems in respect of stresses and strains due to shear forces, bending moments,
torsional moments, combination of axial loads, and bending moments.
5. Explain Mohr’s circle and use of Mohr’s circle in solving problems; Maximum shear
stress and principal stresses and principal strains.
6. Explain shear force and bending moment, sketch shear force and bending moment
diagrams and application of shear force and bending moment diagrams to solve
problems.
You should judge your progress by completing the self assessment exercises.
On completion of this tutorial you should be able to do the following.
Define a beam.
Recognise different types of beams.
Define and calculate SHEAR FORCE in a beam.
Draw SHEAR FORCE Diagrams.
Define and calculate BENDING MOMENT in a beam.
Draw BENDING MOMENT DIAGRAMS.
Determine where the maximum bending moment occurs in a beam.
It is assumed that students already understand the basic principles of moments, shear force and how to
calculate the reaction forces for simply supported beams. This information is contained in previous
tutorials. Students who are familiar with this work from previous studies may skip it.
(c) D. J. Dunn www.freestudy.co.uk 2
1. REVISION AND INTRODUCTION TO TYPES OF BEAMS AND LOADS
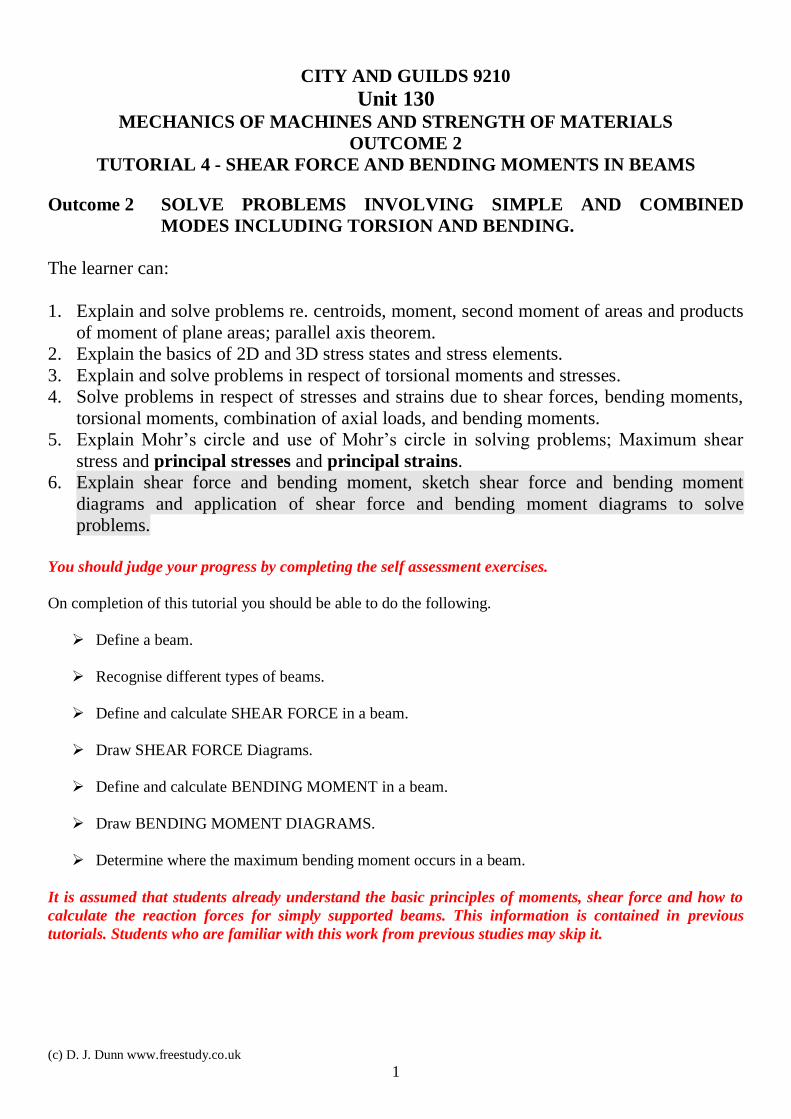
A beam is a structure, which is loaded transversely (sideways). The loads may be point loads or uniformly
distributed loads (udl).
Figure 1
The beam may be simply supported or built in.
Figure 2
Transverse loading causes bending and bending is a very severe form of stressing a structure. The bent beam
goes into tension (stretched) on one side and compression on the other.
Figure 3
The complete formula that relates bending stress to the various properties of the beam is
R
E
y
σ
I
M This was derived in tutorial 2.
POINT LOADS
A point load is shown as a single arrow and acts at a point.
UNIFORM LOADS
Uniform loads are shown as a series of arrows and has a value of w N/m. For any given length x metres, the
total load is wx Newton and this is assumed to act at the centre of that length.
Figure 4

(c) D. J. Dunn www.freestudy.co.uk 3
2. SHEAR FORCE
2.1 SHEAR
The forces on a beam produce shearing at all sections along the length. The sign convention for shear force
in beams is as shown. The best way is to remember this is that up on the left is positive.
Figure 5
Consider the shear force in a section x metres from the end as shown.
Figure 6
Only consider the forces to the left of the section.
DEFINITION The shear force is the sum of all the force acting to the left of the section.
Since the beam is in equilibrium, it must also be the sum of all the forces acting to the right
If the beam is cut at this section as shown, a force F must be placed on the end to replace the shear force that
was exerted by the material when joined. List all the forces to the left. Remember up is plus.
o There is a reaction force Ra up.
o There is a uniform load over the length x metres and this is equivalent to a downwards load of wx
Newton.
o There is a point load F1 acting down.
o
The total load to the left is F = Ra – wx – F1
If the result for F is positive (up) then it produces positive shear.
2.2 SHEAR FORCE DIAGRAMS
A shear force diagram is simply a graph of shear force plotted against x. This is best demonstrated with
several worked examples.

(c) D. J. Dunn www.freestudy.co.uk 4
WORKED EXAMPLE No.1
A cantilever carries point loads as shown. Draw the shear force diagram.
Figure 7
SOLUTION
Because there are only point loads, we only need to calculate the shear force at the loads and at the wall
as the shear force is constant n between the loads.
At the left end the shear force suddenly changes from 0 to -500 N
This remains constant up to x = 1 m and the shear force suddenly changes to 1500 N. This is then
constant all the way to the wall and it is obvious that the wall must exert an upwards reaction force of
1500 N to balance all the loads on the beam. The diagram looks like this.
Figure 8
In the case of uniformly distributed loads, the shear force increases proportional to length. If the u.d.l. is w
N/m then the shear force increases by w Newton for every metre length.
(c) D. J. Dunn www.freestudy.co.uk 5
WORKED EXAMPLE No. 2
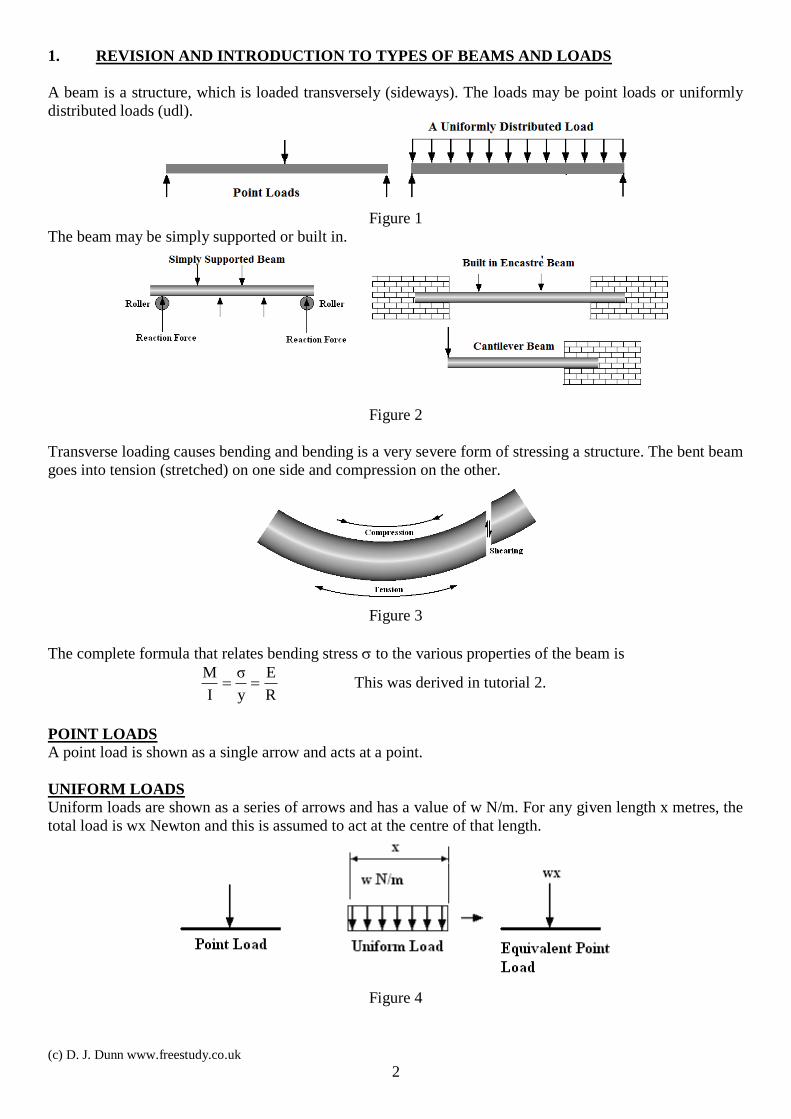
A simple cantilever beam is loaded as shown in the diagram. Draw the shear force diagram.
Figure No.9
For any value of x the total downwards load will be wx Newton.
SOLUTION
The shear force x metres from the left end is wx = 50 x
x=0 F= 50 x 0 = 0
x=1 F= 50 x 1 = 50 down so -50 N
x=2 F= 50 x 2 = 100 down so -100 N
x=3 F =50 x 3 = 150 down so -150 N
x=4 F = 50 x 4 = 200 down so -200 N
x=5 F= 50 x 5 = 250 down so -250 N
Figure No.10
(c) D. J. Dunn www.freestudy.co.uk 6
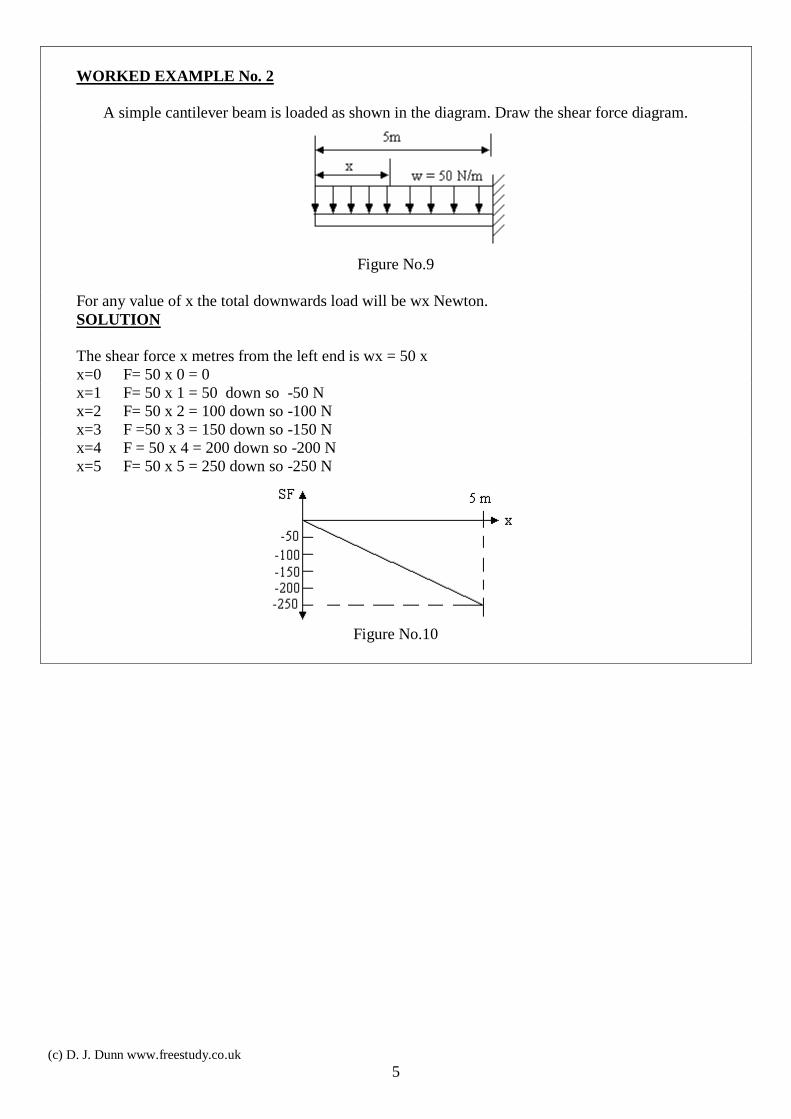
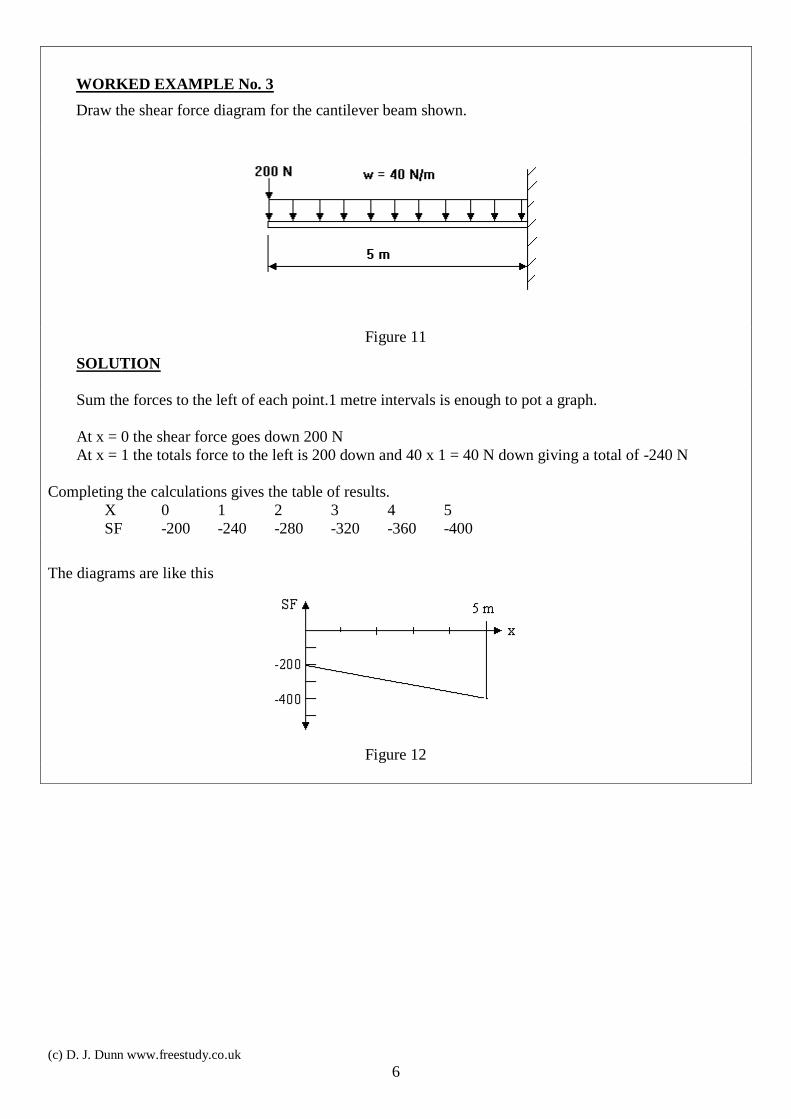
WORKED EXAMPLE No. 3
Draw the shear force diagram for the cantilever beam shown.
Figure 11
SOLUTION
Sum the forces to the left of each point.1 metre intervals is enough to pot a graph.
At x = 0 the shear force goes down 200 N
At x = 1 the totals force to the left is 200 down and 40 x 1 = 40 N down giving a total of -240 N
Completing the calculations gives the table of results.
X 0 1 2 3 4 5
SF -200 -240 -280 -320 -360 -400
The diagrams are like this
Figure 12
(c) D. J. Dunn www.freestudy.co.uk 7
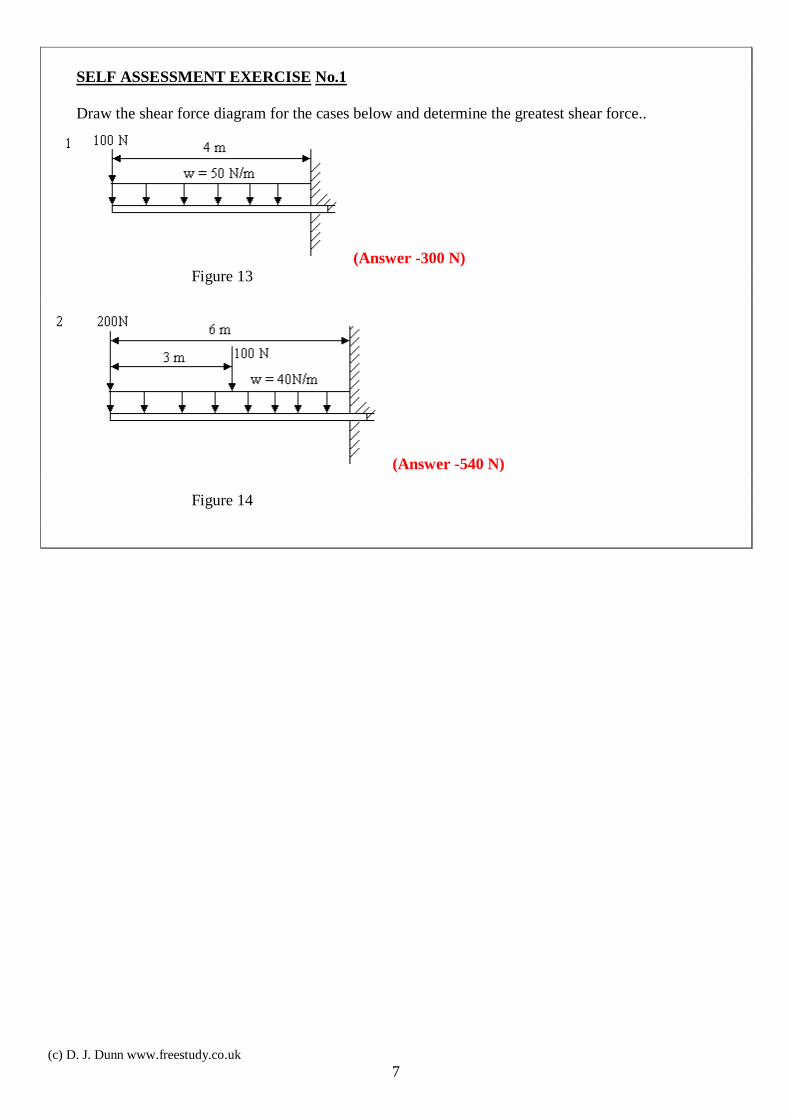
SELF ASSESSMENT EXERCISE No.1
Draw the shear force diagram for the cases below and determine the greatest shear force..
(Answer -300 N)
Figure 13
(Answer -540 N)
Figure 14
(c) D. J. Dunn www.freestudy.co.uk 8
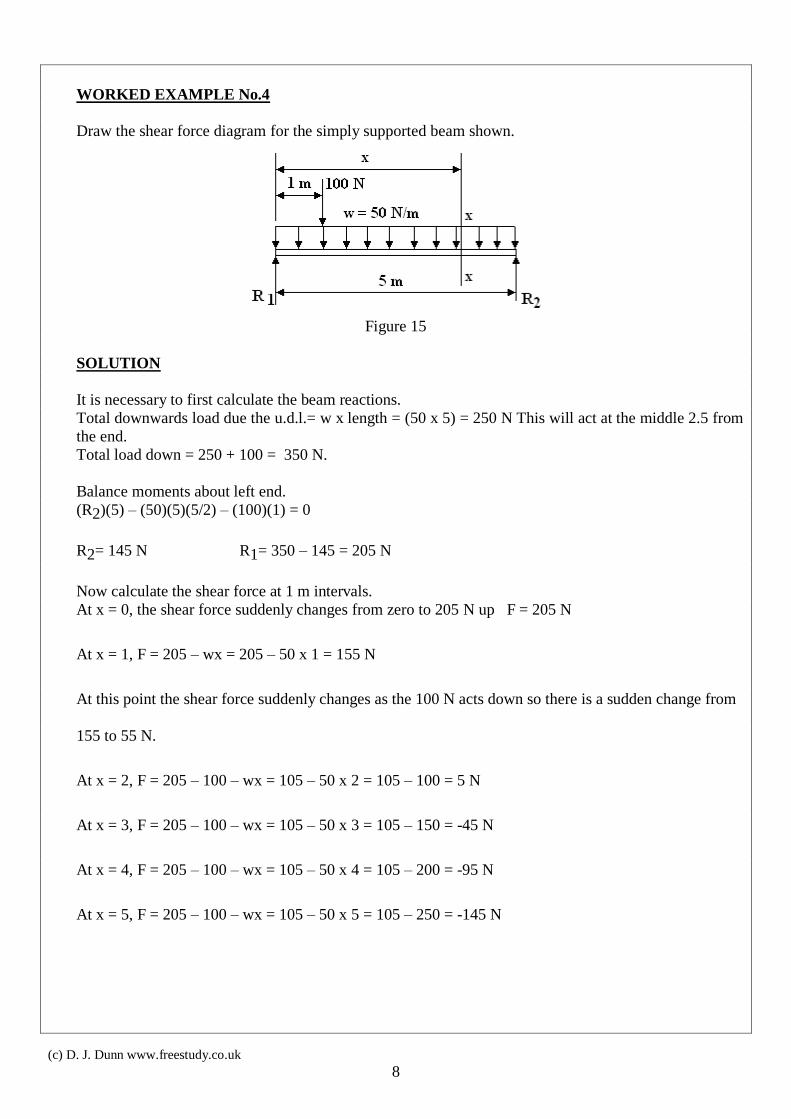
WORKED EXAMPLE No.4
Draw the shear force diagram for the simply supported beam shown.
Figure 15
SOLUTION
It is necessary to first calculate the beam reactions.
Total downwards load due the u.d.l.= w x length = (50 x 5) = 250 N This will act at the middle 2.5 from
the end.
Total load down = 250 + 100 = 350 N.
Balance moments about left end.
(R2)(5) – (50)(5)(5/2) – (100)(1) = 0
R2= 145 N R1= 350 – 145 = 205 N
Now calculate the shear force at 1 m intervals.
At x = 0, the shear force suddenly changes from zero to 205 N up F = 205 N
At x = 1, F = 205 – wx = 205 – 50 x 1 = 155 N
At this point the shear force suddenly changes as the 100 N acts down so there is a sudden change from
155 to 55 N.
At x = 2, F = 205 – 100 – wx = 105 – 50 x 2 = 105 – 100 = 5 N
At x = 3, F = 205 – 100 – wx = 105 – 50 x 3 = 105 – 150 = -45 N
At x = 4, F = 205 – 100 – wx = 105 – 50 x 4 = 105 – 200 = -95 N
At x = 5, F = 205 – 100 – wx = 105 – 50 x 5 = 105 – 250 = -145 N

(c) D. J. Dunn www.freestudy.co.uk 9
At the left end, the reaction force is 145 N up to balance the shear force of 1455 N down. The diagram
looks like this.
Figure 16
(c) D. J. Dunn www.freestudy.co.uk 10
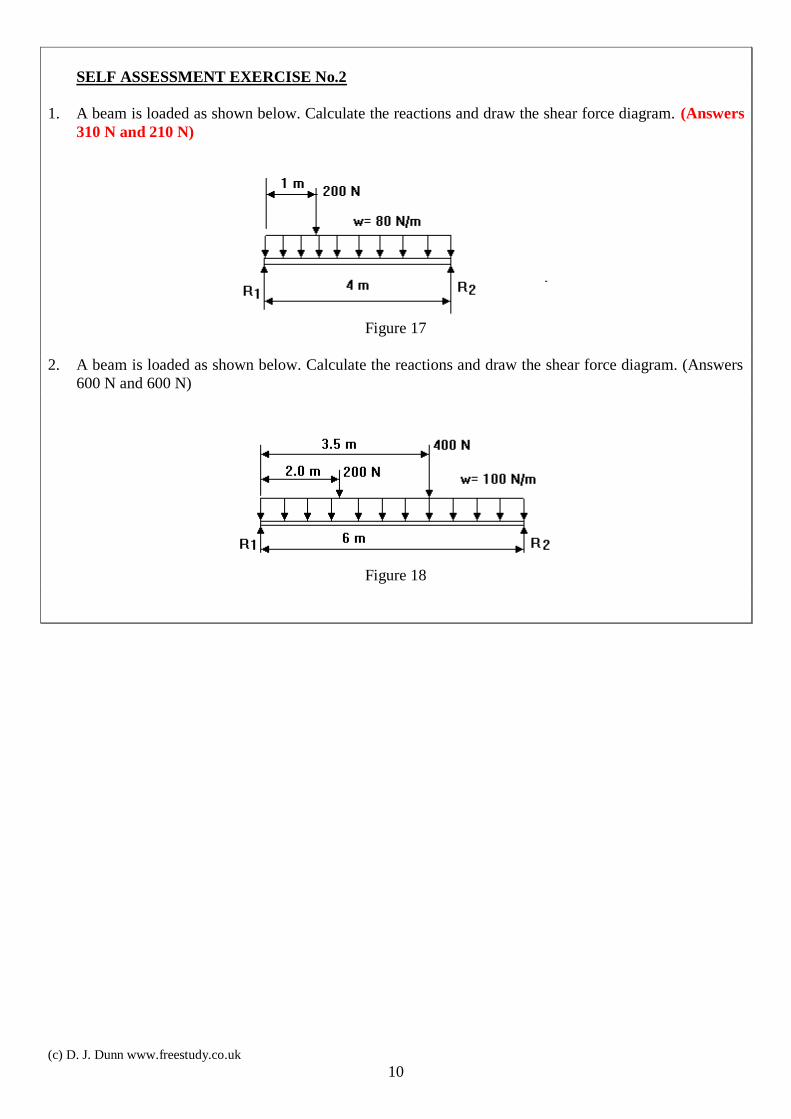
SELF ASSESSMENT EXERCISE No.2
1. A beam is loaded as shown below. Calculate the reactions and draw the shear force diagram. (Answers
310 N and 210 N)
Figure 17
2. A beam is loaded as shown below. Calculate the reactions and draw the shear force diagram. (Answers
600 N and 600 N)
Figure 18
(c) D. J. Dunn www.freestudy.co.uk 11
3. BENDING MOMENTS FOR POINT LOADED BEAMS
3.1 DEFINITION
The bending moment acting at a point on a beam is the resultant turning moment due to all the forces acting
to one side of the point.
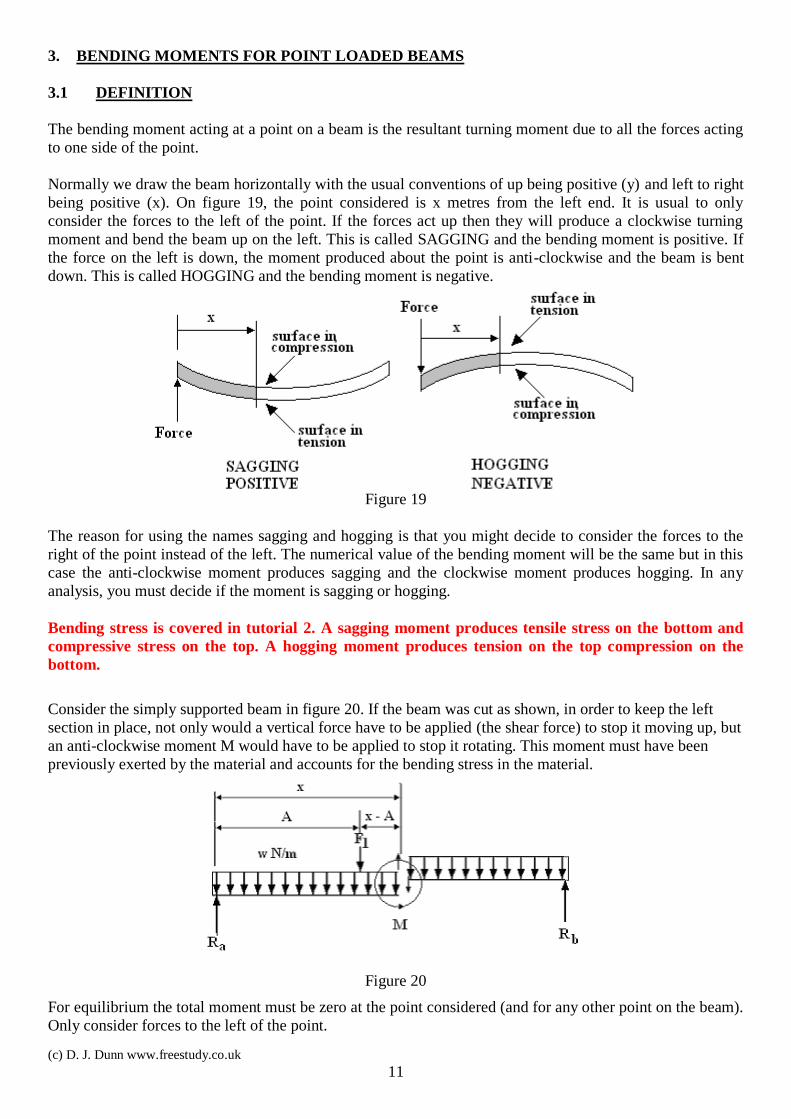
Normally we draw the beam horizontally with the usual conventions of up being positive (y) and left to right
being positive (x). On figure 19, the point considered is x metres from the left end. It is usual to only
consider the forces to the left of the point. If the forces act up then they will produce a clockwise turning
moment and bend the beam up on the left. This is called SAGGING and the bending moment is positive. If
the force on the left is down, the moment produced about the point is anti-clockwise and the beam is bent
down. This is called HOGGING and the bending moment is negative.
Figure 19
The reason for using the names sagging and hogging is that you might decide to consider the forces to the
right of the point instead of the left. The numerical value of the bending moment will be the same but in this
case the anti-clockwise moment produces sagging and the clockwise moment produces hogging. In any
analysis, you must decide if the moment is sagging or hogging.
Bending stress is covered in tutorial 2. A sagging moment produces tensile stress on the bottom and
compressive stress on the top. A hogging moment produces tension on the top compression on the
bottom.
Consider the simply supported beam in figure 20. If the beam was cut as shown, in order to keep the left
section in place, not only would a vertical force have to be applied (the shear force) to stop it moving up, but
an anti-clockwise moment M would have to be applied to stop it rotating. This moment must have been
previously exerted by the material and accounts for the bending stress in the material.
Figure 20
For equilibrium the total moment must be zero at the point considered (and for any other point on the beam).
Only consider forces to the left of the point.
(c) D. J. Dunn www.freestudy.co.uk 12
List all the turning moments due to the forces to the left of the point.
The reaction Ra produces a moment of Ra x and this is sagging so the bending moment at the section is plus.
o The force F1 produces a moment of F1 (x-A) and this is hogging so it is minus.
o Sum the moments and we get M = Ra x - F1 (x-A)
We would get the same result if we summed the moments due to all the forces on the right. It is worth noting
that the bending moment must be zero at a free end. In the case discussed, the bending moment diagram is
like this.
3.2 BENDING MOMENT DIAGRAM
A Bending Moment diagram is simply a graph of bending moment plotted vertically against distance x from
the left end. It involves working out the bending moment at strategic points along the beam. This is best
demonstrated with a series of worked examples.
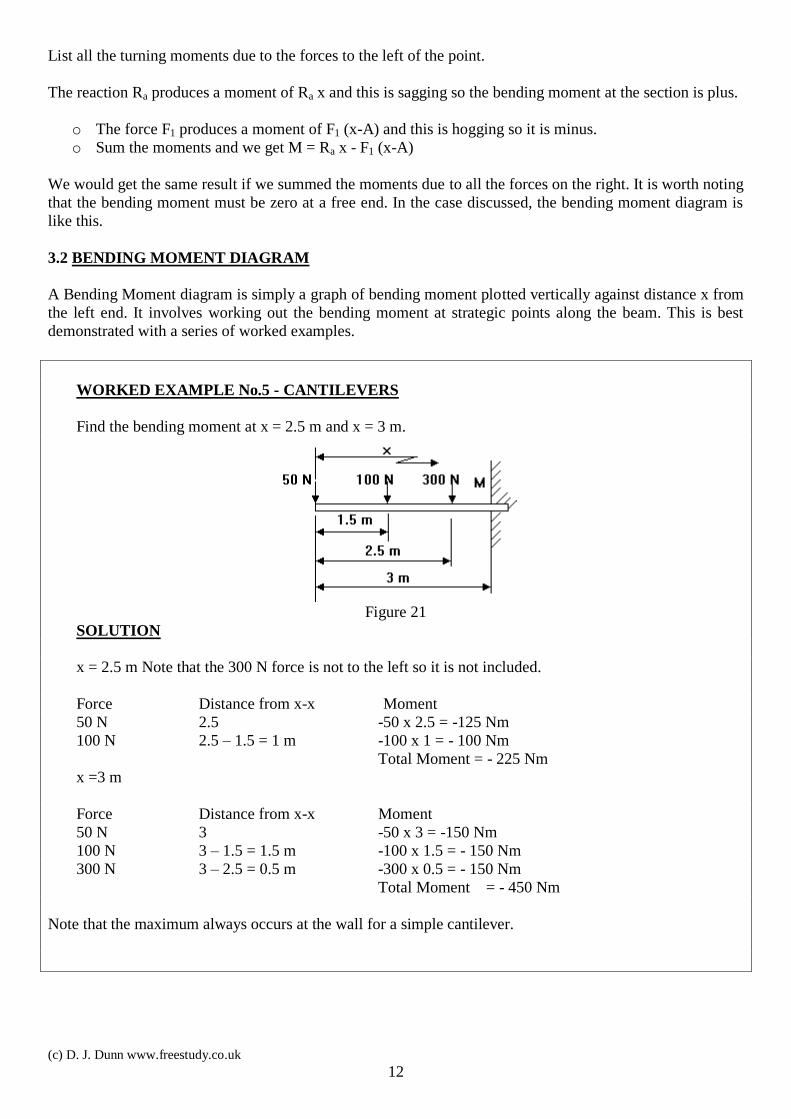
WORKED EXAMPLE No.5 - CANTILEVERS
Find the bending moment at x = 2.5 m and x = 3 m.
Figure 21
SOLUTION
x = 2.5 m Note that the 300 N force is not to the left so it is not included.
Force Distance from x-x Moment
50 N 2.5 -50 x 2.5 = -125 Nm
100 N 2.5 – 1.5 = 1 m -100 x 1 = - 100 Nm
Total Moment = - 225 Nm
x =3 m
Force Distance from x-x Moment
50 N 3 -50 x 3 = -150 Nm
100 N 3 – 1.5 = 1.5 m -100 x 1.5 = - 150 Nm
300 N 3 – 2.5 = 0.5 m -300 x 0.5 = - 150 Nm
Total Moment = - 450 Nm
Note that the maximum always occurs at the wall for a simple cantilever.

(c) D. J. Dunn www.freestudy.co.uk 13
WORKED EXAMPLE No.6 - CANTILEVER
Construct the bending moment diagram for the beam shown in figure 22.
Figure 22
SOLUTION
For any given point x metres from the left end there is only a uniformly distributed load to consider. The
u.d.l. is usually given the symbol w N/m. The total load for a length x metres long is hence wx. This
force is assumed to act at the middle of the length at x/2 from the end and it produces hogging so it is
negative. The Bending moment is hence
M = -(wx)(x/2) = -wx2/2
In this case w = 50 N/m so the bending moment may be represented by the equation:
M = -50x2/2
Since there are no other loads, the bending moment diagram is simply a graph of this equation. It is
sensible to draw up a neat table of results.
x (m) 0 1 2 3 4
M (Nm) 0 -25 -100 -225 -400
The bending moment diagram is then like this
Figure 23
(c) D. J. Dunn www.freestudy.co.uk 14
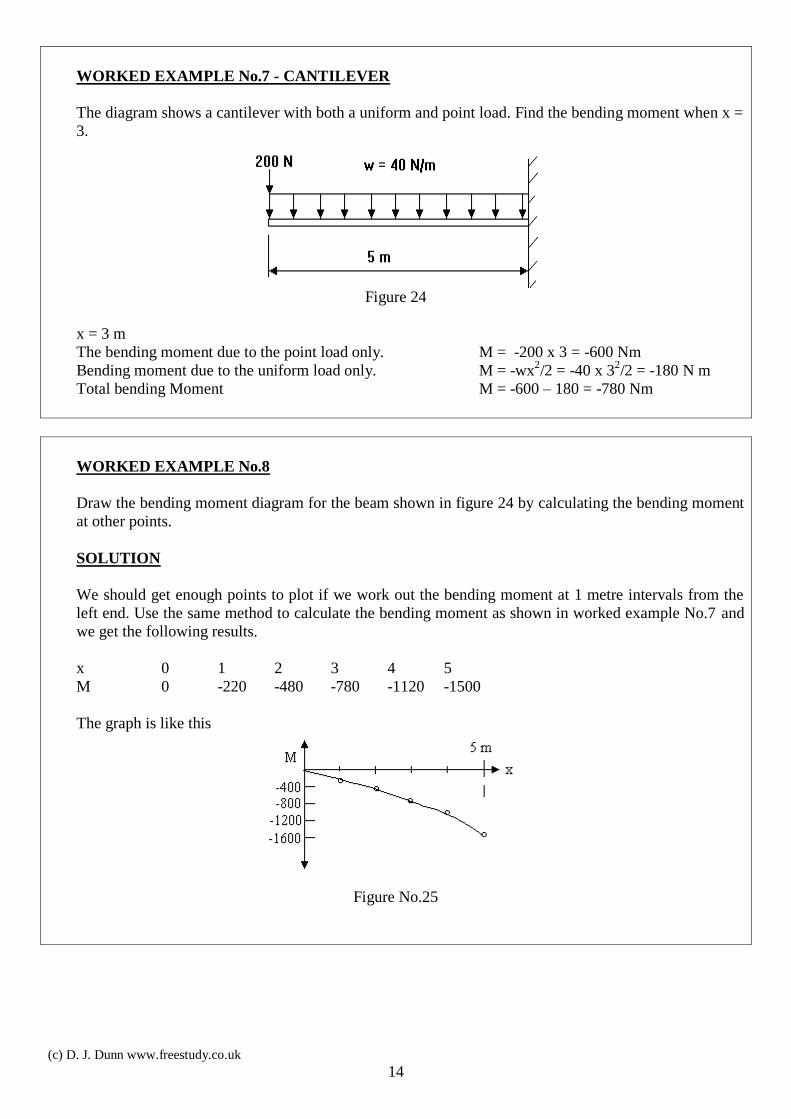
WORKED EXAMPLE No.7 - CANTILEVER
The diagram shows a cantilever with both a uniform and point load. Find the bending moment when x =
3.
Figure 24
x = 3 m
The bending moment due to the point load only. M = -200 x 3 = -600 Nm
Bending moment due to the uniform load only. M = -wx2/2 = -40 x 3
2/2 = -180 N m
Total bending Moment M = -600 – 180 = -780 Nm
WORKED EXAMPLE No.8
Draw the bending moment diagram for the beam shown in figure 24 by calculating the bending moment
at other points.
SOLUTION
We should get enough points to plot if we work out the bending moment at 1 metre intervals from the
left end. Use the same method to calculate the bending moment as shown in worked example No.7 and
we get the following results.
x 0 1 2 3 4 5
M 0 -220 -480 -780 -1120 -1500
The graph is like this
Figure No.25
(c) D. J. Dunn www.freestudy.co.uk 15
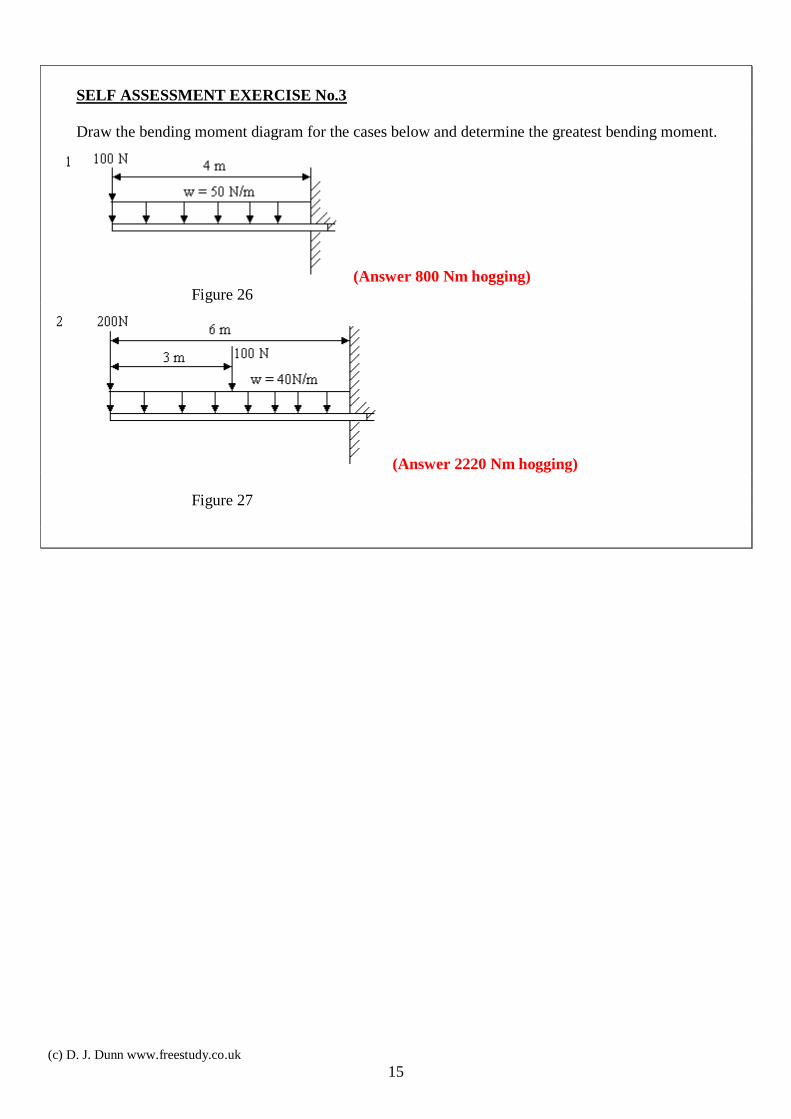
SELF ASSESSMENT EXERCISE No.3
Draw the bending moment diagram for the cases below and determine the greatest bending moment.
(Answer 800 Nm hogging) Figure 26
(Answer 2220 Nm hogging)
Figure 27
(c) D. J. Dunn www.freestudy.co.uk 16
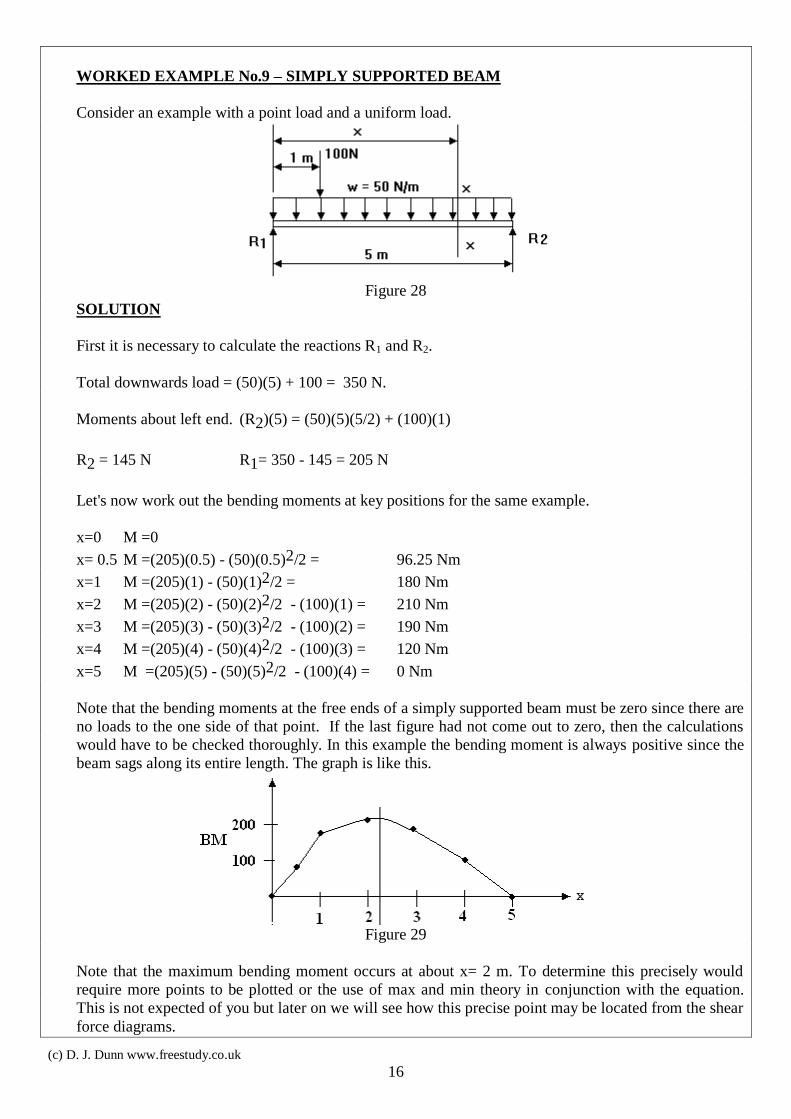
WORKED EXAMPLE No.9 – SIMPLY SUPPORTED BEAM
Consider an example with a point load and a uniform load.
Figure 28
SOLUTION
First it is necessary to calculate the reactions R1 and R2.
Total downwards load = (50)(5) + 100 = 350 N.
Moments about left end. (R2)(5) = (50)(5)(5/2) + (100)(1)
R2 = 145 N R1= 350 - 145 = 205 N
Let's now work out the bending moments at key positions for the same example.
x=0 M =0
x= 0.5 M =(205)(0.5) - (50)(0.5)2/2 = 96.25 Nm
x=1 M =(205)(1) - (50)(1)2/2 = 180 Nm
x=2 M =(205)(2) - (50)(2)2/2 - (100)(1) = 210 Nm
x=3 M =(205)(3) - (50)(3)2/2 - (100)(2) = 190 Nm
x=4 M =(205)(4) - (50)(4)2/2 - (100)(3) = 120 Nm
x=5 M =(205)(5) - (50)(5)2/2 - (100)(4) = 0 Nm
Note that the bending moments at the free ends of a simply supported beam must be zero since there are
no loads to the one side of that point. If the last figure had not come out to zero, then the calculations
would have to be checked thoroughly. In this example the bending moment is always positive since the
beam sags along its entire length. The graph is like this.
Figure 29
Note that the maximum bending moment occurs at about x= 2 m. To determine this precisely would
require more points to be plotted or the use of max and min theory in conjunction with the equation.
This is not expected of you but later on we will see how this precise point may be located from the shear
force diagrams.
(c) D. J. Dunn www.freestudy.co.uk 17
Beam problems usually involve finding the stress due to the bending moment. Bending stress is covered in
tutorial 1.The next problem brings in the stress equation.
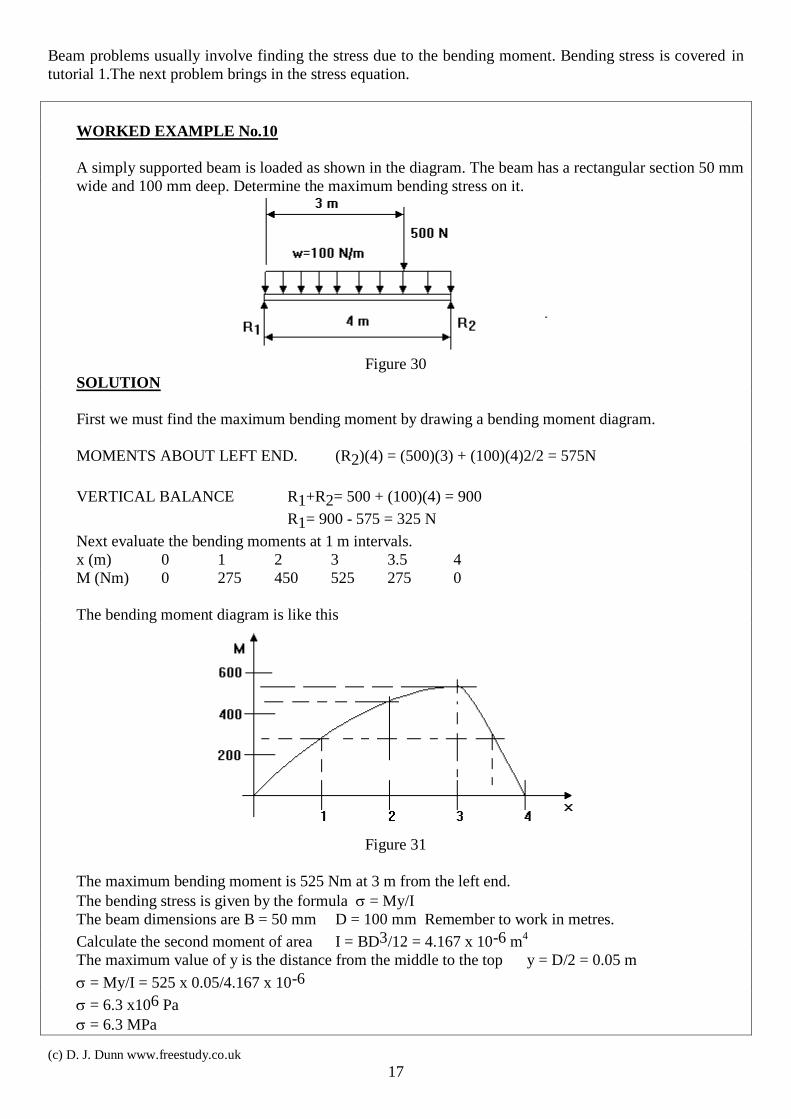
WORKED EXAMPLE No.10
A simply supported beam is loaded as shown in the diagram. The beam has a rectangular section 50 mm
wide and 100 mm deep. Determine the maximum bending stress on it.
Figure 30
SOLUTION
First we must find the maximum bending moment by drawing a bending moment diagram.
MOMENTS ABOUT LEFT END. (R2)(4) = (500)(3) + (100)(4)2/2 = 575N
VERTICAL BALANCE R1+R2= 500 + (100)(4) = 900
R1= 900 - 575 = 325 N
Next evaluate the bending moments at 1 m intervals.
x (m) 0 1 2 3 3.5 4
M (Nm) 0 275 450 525 275 0
The bending moment diagram is like this
Figure 31
The maximum bending moment is 525 Nm at 3 m from the left end.
The bending stress is given by the formula = My/I
The beam dimensions are B = 50 mm D = 100 mm Remember to work in metres.
Calculate the second moment of area I = BD3/12 = 4.167 x 10⁻⁶ m4
The maximum value of y is the distance from the middle to the top y = D/2 = 0.05 m
= My/I = 525 x 0.05/4.167 x 10-6
= 6.3 x10⁶ Pa
= 6.3 MPa
(c) D. J. Dunn www.freestudy.co.uk 18
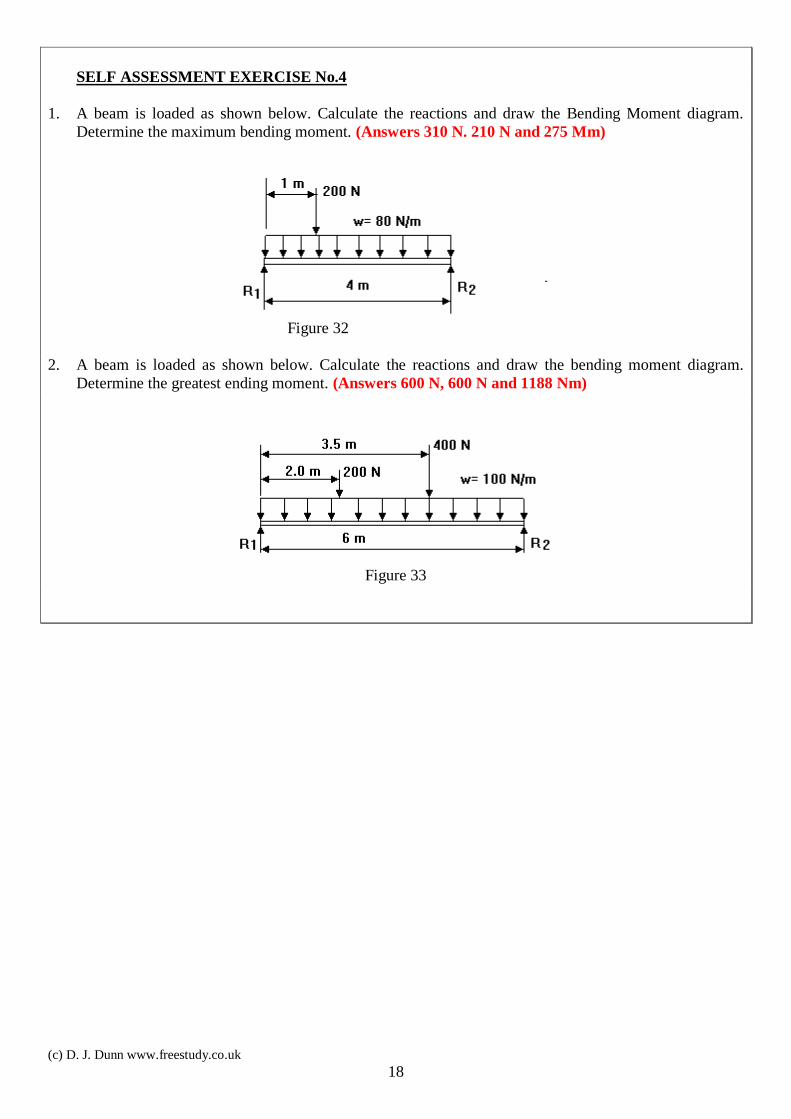
SELF ASSESSMENT EXERCISE No.4
1. A beam is loaded as shown below. Calculate the reactions and draw the Bending Moment diagram.
Determine the maximum bending moment. (Answers 310 N. 210 N and 275 Mm)
Figure 32
2. A beam is loaded as shown below. Calculate the reactions and draw the bending moment diagram.
Determine the greatest ending moment. (Answers 600 N, 600 N and 1188 Nm)
Figure 33

(c) D. J. Dunn www.freestudy.co.uk 19
3.4 DETERMINING THE POSITION OF GREATEST BENDING MOMENT.
It can be shown that where ever the shear force changes from positive to negative, the bending moment is a
maximum and where it changes from negative to positive the bending moment is a minimum. This means
that anywhere on the SF diagram where the value goes through zero, the bending moment reaches a peak.
This is illustrated by combining worked example 3 and worked example 9 which contains the solutions for
the same beam. The combined diagrams should be drawn as shown. Note that the maximum bending
moment occurs just over 2 metres from the end at the point where the SF diagram passes through zero.
Figure 34
On more complex beams, the SF diagram might pass through the zero value at several points resulting in
several maximum and/or minimum points on the BM diagram. The bending moment that produces
maximum stress could be the greatest positive value or the greatest negative value
(c) D. J. Dunn www.freestudy.co.uk 20
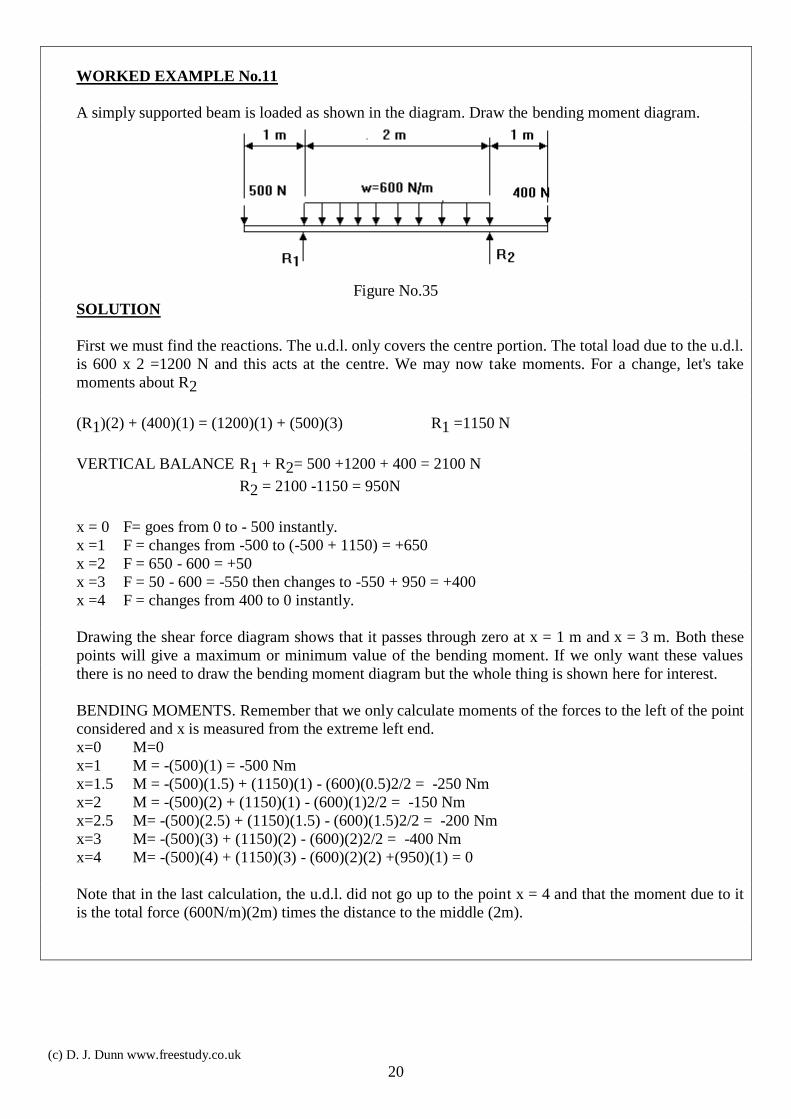
WORKED EXAMPLE No.11
A simply supported beam is loaded as shown in the diagram. Draw the bending moment diagram.
Figure No.35
SOLUTION
First we must find the reactions. The u.d.l. only covers the centre portion. The total load due to the u.d.l.
is 600 x 2 =1200 N and this acts at the centre. We may now take moments. For a change, let's take
moments about R2
(R1)(2) + (400)(1) = (1200)(1) + (500)(3) R1 =1150 N
VERTICAL BALANCE R1 + R2= 500 +1200 + 400 = 2100 N
R2 = 2100 -1150 = 950N
x = 0 F= goes from 0 to - 500 instantly.
x =1 F = changes from -500 to (-500 + 1150) = +650
x =2 F = 650 - 600 = +50
x =3 F = 50 - 600 = -550 then changes to -550 + 950 = +400
x =4 F = changes from 400 to 0 instantly.
Drawing the shear force diagram shows that it passes through zero at x = 1 m and x = 3 m. Both these
points will give a maximum or minimum value of the bending moment. If we only want these values
there is no need to draw the bending moment diagram but the whole thing is shown here for interest.
BENDING MOMENTS. Remember that we only calculate moments of the forces to the left of the point
considered and x is measured from the extreme left end.
x=0 M=0
x=1 M = -(500)(1) = -500 Nm
x=1.5 M = -(500)(1.5) + (1150)(1) - (600)(0.5)2/2 = -250 Nm
x=2 M = -(500)(2) + (1150)(1) - (600)(1)2/2 = -150 Nm
x=2.5 M= -(500)(2.5) + (1150)(1.5) - (600)(1.5)2/2 = -200 Nm
x=3 M= -(500)(3) + (1150)(2) - (600)(2)2/2 = -400 Nm
x=4 M= -(500)(4) + (1150)(3) - (600)(2)(2) +(950)(1) = 0
Note that in the last calculation, the u.d.l. did not go up to the point x = 4 and that the moment due to it
is the total force (600N/m)(2m) times the distance to the middle (2m).

(c) D. J. Dunn www.freestudy.co.uk 21
The complete diagram reveals that the bending moment is always negative (hogging) so tensile stress would occur on the top layer of the beam. This stress will be a maximum at x = 1 when the bending
moment has a value of -500 Nm. The minus sin has no bearing on the stress value and serves to tell us
that it is a hogging moment.
Figure 36
The greatest negative bending moment is -500 Nm at 1 m from the left end. Note that the sign has no
significance when it comes to working out bending stresses other than to indicate that it is hogging and
will be tensile on the top layer and compressive on the bottom layer.
(c) D. J. Dunn www.freestudy.co.uk 22
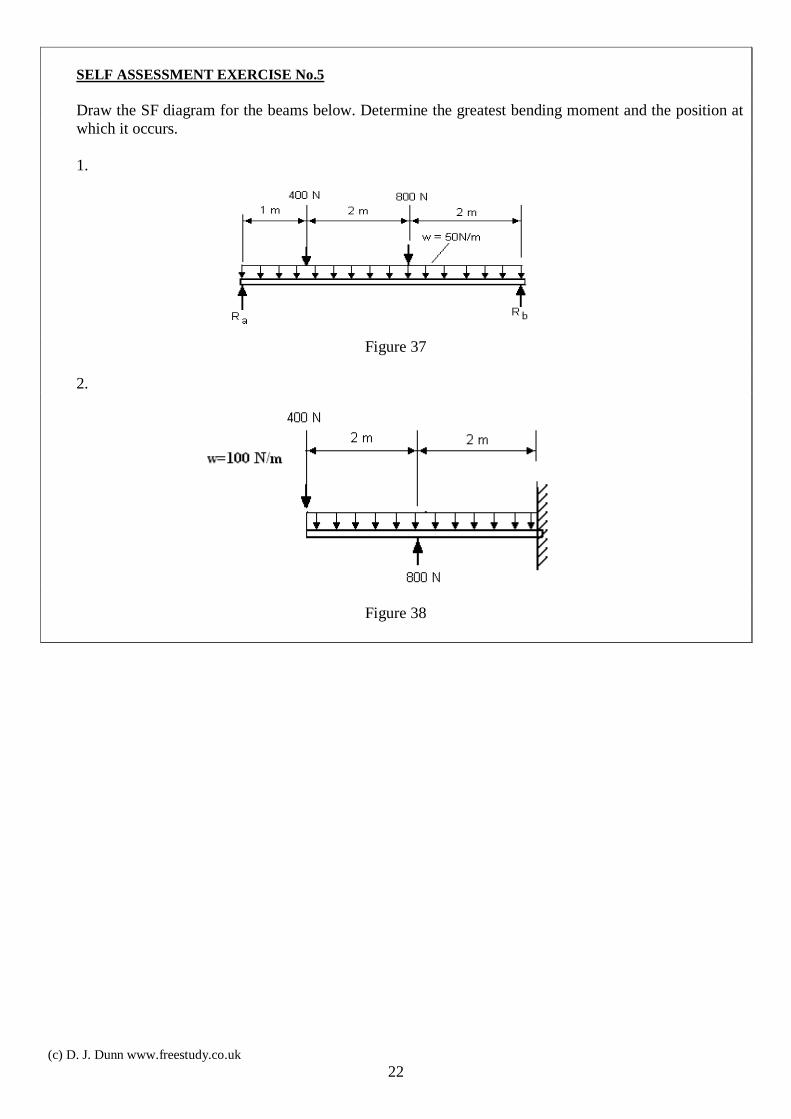
SELF ASSESSMENT EXERCISE No.5
Draw the SF diagram for the beams below. Determine the greatest bending moment and the position at
which it occurs.
1.
Figure 37
2.
Figure 38
(c) D. J. Dunn www.freestudy.co.uk 23
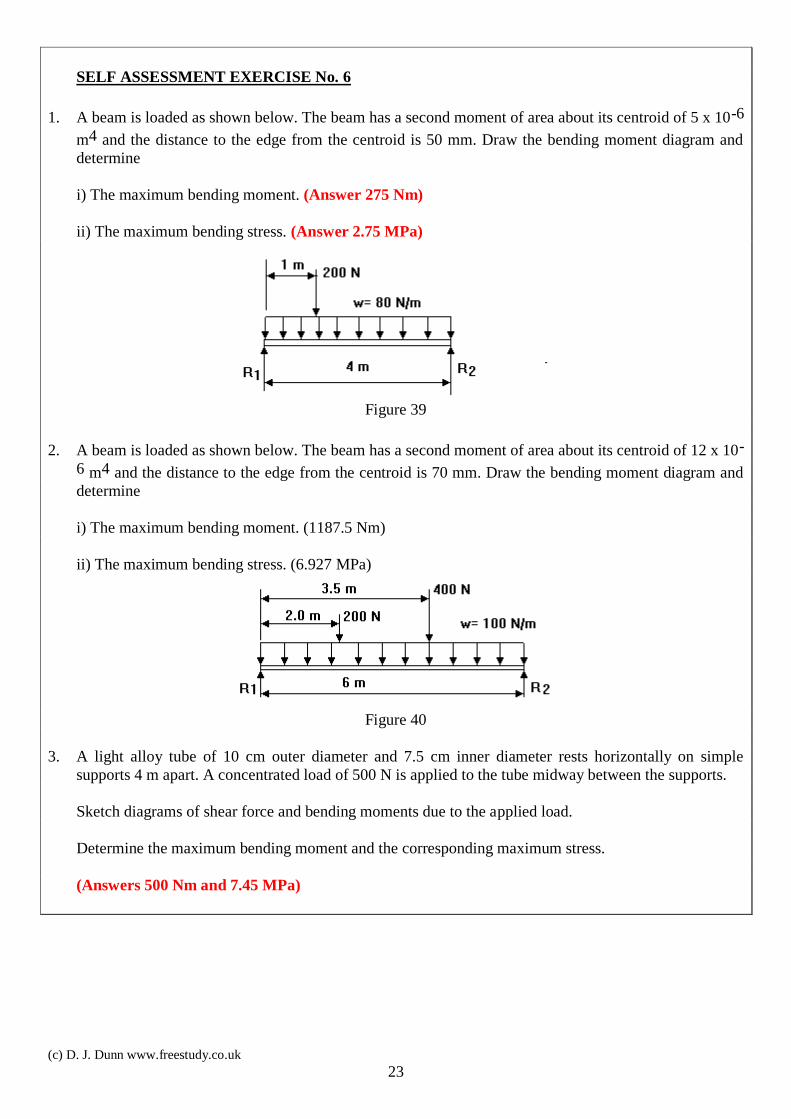
SELF ASSESSMENT EXERCISE No. 6
1. A beam is loaded as shown below. The beam has a second moment of area about its centroid of 5 x 10⁻⁶
m4 and the distance to the edge from the centroid is 50 mm. Draw the bending moment diagram and
determine
i) The maximum bending moment. (Answer 275 Nm)
ii) The maximum bending stress. (Answer 2.75 MPa)
Figure 39
2. A beam is loaded as shown below. The beam has a second moment of area about its centroid of 12 x 10-
6 m4 and the distance to the edge from the centroid is 70 mm. Draw the bending moment diagram and
determine
i) The maximum bending moment. (1187.5 Nm)
ii) The maximum bending stress. (6.927 MPa)
Figure 40
3. A light alloy tube of 10 cm outer diameter and 7.5 cm inner diameter rests horizontally on simple
supports 4 m apart. A concentrated load of 500 N is applied to the tube midway between the supports.
Sketch diagrams of shear force and bending moments due to the applied load.
Determine the maximum bending moment and the corresponding maximum stress.
(Answers 500 Nm and 7.45 MPa)

(c) D. J. Dunn www.freestudy.co.uk 24
4. Part of a test rig consists of a 15 m long elastic beam which is simply supported at one end and rests on
a frictionless roller located 5 m from the other end, as shown in fig. 41. The beam has a uniformly
distributed load of 150 N/m due to its own weight and is subjected to concentrated loads of 1000 N and
400 N as shown.
(i) Calculate the reactions. (Answers 962.5 N and 2687.5 N)
(ii) Sketch the shear force and bending moment diagrams and determine the magnitude and location of the
maximum values of the shear force and bending moment.
(Answers SF 1537.5 N 10 m from left end, BM 2 937.5 Nm 5 m from left end). (ii) Determine the maximum bending stress in the beam if the section is that shown in fig.41 and with
bending about the neutral axis x-x. (Answer 55.13 MPa)
Figure 41
5. A horizontal beam 4.2 m long, resting on two simple supports 3.0 m apart, carries a uniformly
distributed load of 25 kN/m between the supports with concentrated loads of 15 kN and 20 kN at the
ends, as shown in fig. 42.
Assuming the weight of the beam is negligible determine the reactions R1 and R2 at the supports.
(Answers 51.5 kN and 58.5 N)
Sketch diagrams of shear force and bending moments and indicate the point of maximum bending
moment.
State the greatest bending moment and shear force. (Answers -38.5 kN and 18 kNm)
The beam has a uniform rectangular cross-section, the depth being equal to 1.5 times the width.
Determine the size of the section required to limit the maximum bending stress to 375 MN/m2.
(Answers 50 mm wide and 75.6 mm deep)
Figure 42
Top Related