


Languages
Pages
Legal

8/10/2019 Choice of FACTS Device Control Inputs for Damping Interarea Oscillations
http://slidepdf.com/reader/full/choice-of-facts-device-control-inputs-for-damping-interarea-oscillations 1/9
IEEE TRANSACTIONS ON POWER SYSTEMS, VOL. 19, NO. 2, MAY 2004 1135
Choice of FACTS Device Control Inputsfor Damping Interarea Oscillations
M. M. Farsangi, Y. H. Song , Senior Member, IEEE , and Kwang Y. Lee , Fellow, IEEE
Abstract—A method is proposed in this paper to select the inputsignals for both single and multiple flexible ac transmission system(FACTS) devices in small and large powersystems. Different input-output controllability analyses are used to assess the most appro-priate input signals (stabilizing signal) for the static var compen-sator (SVC), the static synchronous compensator (SSSC), and theunified power-flow controller (UPFC) for achieving good dampingof interarea oscillations. The study presented in this paper is car-ried out on one small system with one FACTS device at a time; andone large system equipped with the SVC, the SSSC, and the UPFC.
Index Terms—FACTS devices, input-output controllability anal-ysis, input signal selection, optimal location, power system oscilla-tion, stabilizing signal.
I. INTRODUCTION
THE location and input signal play an important role in the
ability of control devices to stabilize the interarea oscilla-
tions. In a practical power system, allocation of the devices de-
pends on a comprehensive analysis of the steady-state stability,
the transient stability, the small-signal stability and the voltage
stability. Moreover, other practical factors, such as cost and in-
stallation conditions, also need to be considered.
The placing of many controllable power system devices, such
as the high voltage dc (HVDC) links and the flexible ac trans-
mission system (FACTS) devices, is based on the issues un-
related to the damping of oscillations in the system. For in-
stance, a static var compensator (SVC) improves transmission
system voltage, thereby enhancing the maximum power transfer
limit; the static synchronous compensator (SSSC) control re-
duces the transfer impedance of a long line, enhancing the max-
imum power transfer limit. An additional benefit of the FACTS
devices is the potential for improving system damping. The se-
lection of appropriate stabilizing signals and effective tuning of
such damping controls is an important consideration.
In recent years, numerous papers have been published to dis-
cuss and find ways to answer the question of which location
and feedback signal could result in the power system stabilizer
(PSS) and the FACTS devices having the maximum effect onthe system. For example, static interaction measures derived
from decentralized control theory such as the relative gain array
(RGA) and controllability and observability have been applied
Manuscript received April 30, 2003.M. M. Farsangi is with Kerman University, Kerman, Iran.Y. H. Song is with the Brunel Institute of Power Systems, Brunel University,
Uxbridge UB8 3PH, U.K. (e-mail: [email protected]).K. Y. Lee is with the Department of Electrical Engineering at the
Pennsylvania State University, University Park, PA 16802 USA (e-mail:[email protected]).
Digital Object Identifier 10.1109/TPWRS.2003.820705
to investigate both, the problems of the best location and the se-
lection of the input signals for multiple FACTS devices [1]. Sev-
eral papers also exist dealing with the combined application of
controllability and observability using the singular value anal-
ysis for power system analysis [2], [3].
Reference [4] presented a detailed study on the use of a
SVC for damping system oscillations. Having considered
several factors including observability and controllability, it
was concluded that the most suitable auxiliary input signal for
the SVC for damping improvement is the locally measured
transmission line-current magnitude. This signal is also used in
the study carried out in [5], [6]. Other studies, however, selectlocally measured active power [7], [8] or generator angular
speed [9]–[11] as a stabilizing signal.
Generally, two methodologies have been applied by most re-
searchers to simultaneously determine the location and input
signal for a single power system damping controller. Residue
analysis is derived from modal control theory of linear time-in-
variant system [7], [12] and damping torque analysis [8], [9],
[13]. As pointed out in [12], [14], residue analysis is equiva-
lent to damping torque analysis. There are other techniques that
do consider the effect of controls on other eigenvalues [15], but
such methods are limited to considering a selected number of modes rather than determining the effect of the proposed con-
trol globally on the entire system. Once applied to a practicalpower system, the designed power system damping controller
may cause other modes to become unstable because of the in-
teraction with other dynamic devices.
Reference [16] adopted a frequency domain method to coor-
dinate several SVCs in order to damp interarea oscillations in
the Mexican interconnected power system, as well as to mini-
mize the potential for adverse interaction between control loops.
Reference [17] proposed an approach to determine the
number and locations of the thyristor-controlled series com-
pensator (TCSC) in a multimachine power system. The index
of optimal allocation of the controllers is the power system sta-
bility. First, the steady-state stability is considered, and then the
transient stability is examined to find a robust allocation of theTCSC controller. Both small-signal and transient stability were
studied in [17]. For small-signal stability system eigenvalues
were used, and for transient stability the norm was used
as a performance index. Simulation results on the test system
showed that one TCSC with proper controllers satisfied the
small-signal stability requirements for the system, while four
TCSCs were required to ensure transient stability.
Rather than on the selection of the optimal location for a
FACTS device, this paper focuses on the most suitable stabi-
lizing signal for supplementary damping control on a FACTS
0885-8950/04$20.00 © 2004 IEEE

8/10/2019 Choice of FACTS Device Control Inputs for Damping Interarea Oscillations
http://slidepdf.com/reader/full/choice-of-facts-device-control-inputs-for-damping-interarea-oscillations 2/9
1136 IEEE TRANSACTIONS ON POWER SYSTEMS, VOL. 19, NO. 2, MAY 2004
device for the purpose of system damping. Often the selection
of the most suitable stabilizing signal is based on an observ-
ability index. In this paper in addition to the observability, other
indicators are also used.
A new method is proposed in the paper to select the most
responsive input signals (stabilizing signals) to the modes of os-
cillation for supplementary control of both single and multiple
FACTS devices (or in general, for any power system dampingcontrol). The method is applicable in damping out both a single
interarea oscillation mode in a small power system and multiple
interarea oscillation modes in an extensively interconnected
power system.
This method uses the minimum singular values (MSV),
the right-half plane zeros (RHP-zeros), the relative gain array
(RGA), and the Hankel singular values (HSV) as indicators
to find stabilizing signals in the single-input single-output
(SISO) and multi-input multi-output (MIMO) systems. In the
SISO system with one FACTS device, only the criterion of
RHP-zeros is used as the indicator for limiting the performance
of the closed-loop system and the HSV as the indicator for
controllability-observability. This is because the MSV and theRGA are useful indicators to quantify the degree of direction-
ality [18] and the level of interaction in the MIMO systems.
In the MIMO system, using multiple FACTS devices, all four
indicators are utilized, which are explained in the next section.
II. SELECTION OF LOCATION AND INPUT SIGNALS
FOR FACTS DEVICES
A. Minimum Singular Value (MSV)
The minimum and maximum singular values can be used to
quantify the degree of directionality in the MIMO systems. Con-
sidering a MIMO system with transfer function with inputs
and outputs, can be decomposed with the singular valuedecomposition as follows:
(1)
where is a matrix and is defined as
......
. . ....
in which the non-negative singular values
are placed diagonally in a descending order withand is an eigenvalue of , where is
the complex conjugate transpose of .
In (1), the output singular vectors compose
the matrix and the input singular vectors
compose the matrix . The matrices and can be used as
indicators to evaluate the strength and weakness of input-output
directions.
The maximum singular value of
shows the largest gain for any input direction. The smallest sin-
gular value of is a useful control-
lability measure showing the smallest gain for any input direc-
tion. The ratio between maximum and minimum singular values
Fig. 1. Block diagram of a plant with feedback.
indicates the degree of directionality of the system. If thisratio is big due to a small value of , it shows that the system is
ill-conditioned, which indicates a large sensitivity of the system
to uncertainty. To avoid the ill-conditioning, it is desired that the
minimum singular value be as large as possible when selecting
the input-output signal [18], [19].
B. Right-Half Plane Zeroes (RHP-Zeros)
By considering different inputs-outputs for any plant dif-
ferent zeros will appear. Those inputs-outputs, which produce
the RHP zeros (especially within the closed-loop bandwidth) are
undesirable because of the limiting performance of the closed
loop.
Considering the negative feedback system shown in Fig. 1with plant and a constant gain controller , the
closed-loop transfer function is
From the above closed-loop transfer function, it is obvious
that the locations of zeros are unchanged, while pole locations
are changed by the feedback. As the feedback gain decreases,
the closed-loop poles will be moved to open-loop poles and as
thefeedback gain increases, the closed-loop poles will be moved
from open-loop poles to open-loop zeros, which may lead to
gain instability.
Thus, the selection of inputs-outputs should be carried out ina way that the closed-loop plant has a minimum number of the
RHP-zeros, which are required not to lie within the closed-loop
bandwidth [18].
C. Relative Gain Array (RGA)
A measure of interactions causedby decentralized control can
be provided using a relative gain array (RGA). Assume and
are, respectively, an input and an output of a multivariable
plant with inputs and outputs, and that is controlled
by . The RGA is a matrix of the relative gains, and a relative
gain is the ratio of two gains in two extreme cases defined as
follows.
First, allother loops areopen. All other input changes arezeroand the gain is
(2)
Second, all other loops are closed. All other output changes are
zero and the gain is
(3)
where
element of on the th row and th column;
element of on the th row and th column.

8/10/2019 Choice of FACTS Device Control Inputs for Damping Interarea Oscillations
http://slidepdf.com/reader/full/choice-of-facts-device-control-inputs-for-damping-interarea-oscillations 3/9
8/10/2019 Choice of FACTS Device Control Inputs for Damping Interarea Oscillations
http://slidepdf.com/reader/full/choice-of-facts-device-control-inputs-for-damping-interarea-oscillations 4/9
1138 IEEE TRANSACTIONS ON POWER SYSTEMS, VOL. 19, NO. 2, MAY 2004
has full rank and, thus, is positive definite. Matrix
satisfies the following Lyapunov equation:
(15)
The Hankel Singular Values (HSV) is an observability-
controllability index, defined as
(16)
which reflects the joint controllability and observability of the
states of a system where is the eigenvalue of .
Thus, for choosing input and output signals, the HSV can
be calculated for each combination of inputs and outputs, the
candidate with the largest HSV shows better controllability and
observability properties. It means that this candidate can give
more information about system internal states [18].
III. PROCEDURE OF SELECTION OF STABILIZING SIGNAL(S)
FOR FACTS DEVICES
The procedure to select stabilizing signals for supplementarycontroller of the FACTS devices using the MSV, the RHP-zeros,
the RGA-number, and the HSV can be described as follows.
In a SISO system, using only one FACTS device, the RHP-
zeros and the HSV are used as indicators to select the most re-
sponsive signal to a mode of the interarea oscillation. The pro-
cedure to carry out the selection of a proper stabilizing signal is
summarized in the following steps:
Step 1) After placing a FACTS device, choosethe stabilizing
signal candidates for supplementary control.
Step 2) For each candidate, calculate the RHP-zeros. If any
RHP-zeros is encountered in the frequency range of
0.1–2 Hz that is undesirable, then the corresponding
candidate should be discarded.
Step 3) Check the observability and controllability of the
remaining candidates using the HSV. The candidate
with the largest HSV is more preferred, which shows
that the corresponding signal is more responsive to
the mode of oscillation and is the final choice.
For a MIMO system using multiple FACTS devices, in ad-
dition to using the HSV and the RHP-zeros, the MSV and the
RGA-number are also used to find the most responsive signals
to modes of the interarea oscillation. The procedure can be de-
scribed as follows:
Step 1) Place the FACTS devices in the system. Choose the
possible stabilizing signal candidate sets for supple-mentary control.
Step 2) Calculate the MSV for the candidate sets in step 1. In
the case of having a large number of candidate sets,
a range of candidate sets with larger values of the
MSV should be selected for a more detailed input-
output controllability analysis.
Step 3) Calculate the RHP-zeros for the selected candidate
sets considered in step 2. Those candidate sets,
which encounter the RHP-zeros, will be discarded.
Step 4) Calculate the RGA-number for the remaining can-
didate sets from step 3. Candidate sets with smaller
RGA-number are preferred. Few candidate sets with
Fig. 2. Single line diagram of a two-area study system.
Fig. 3. Single line diagram of a five-area study system.
the RGA-number close to the achieved smallest
RGA-number will be selected for the next step.
Step 5) The observability and controllability of the selected
candidate sets from step 4 will be checked using
the HSV. The candidate set with the largest HSVis preferred and known as the final choice for the
stabilizing signals for the supplementary controllers.
IV. MOST EFFECTIVE STABILIZING SIGNAL(S)
FOR THE STUDY SYSTEMS
Two study systems, one small and one large are used in this
paper. A brief description of the systems is given as follows.
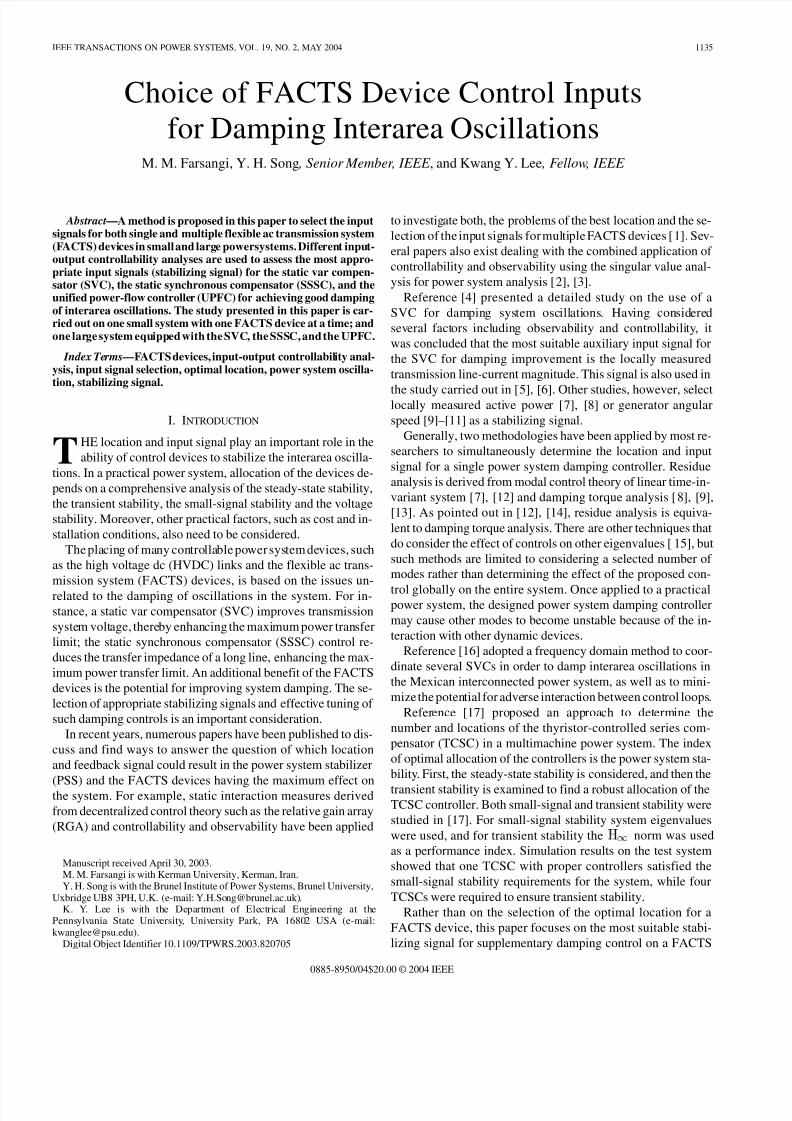
Study system 1: A 2-area-4-machine system: This test
system is illustrated in Fig. 2. The subtransient model for
the generators, the IEEE-type DC1 and DC2 excitation
system are used for machines 1 and 4, respectively, Models
IEEE-type ST3 compound source rectifier exciter modelsis used for machine 2 and first-order simplified model for
the excitation systems is used for machine 3, PSS is placed
on machines 2 and 3 and the linear models for the loads are
used. The systemdata areadopted from [23]. A three-phase
fault is applied in one of the tie circuits at bus 101 between
bus 101 and bus 13. The circuit is tripped after 70 ms.
Study system 2: A 5-area-16-machine system: The
system shown in Fig. 3, consists of 16 machines and 68
buses. This is a reduced order model of the “old” New
England (NE) New York (NY) interconnected system
[24]. The system does not represent the current New
York-New England interconnected system. The first
8/10/2019 Choice of FACTS Device Control Inputs for Damping Interarea Oscillations
http://slidepdf.com/reader/full/choice-of-facts-device-control-inputs-for-damping-interarea-oscillations 5/9
FARSANGI et al.: CHOICE OF FACTS DEVICE CONTROL INPUTS FOR DAMPING INTERAREA OSCILLATIONS 1139
TABLE IENCOUNTERED RHP-ZEROS FOR THE 4 S TABILIZING SIGNAL CANDIDATES
Fig. 4. HSV of the candidates 2 and 4 for the system 1 equipped with SVC:plus-dotted line: candidate 2; star-dotted line: candidate 4.
nine machines are the simple representation of the New
England system generation. Machines 10 to 13 represent
the New York power system. The last three machines are
the dynamic equivalents of the three large neighboring
areas interconnected to the New York power system.
The subtransient reactance model for the generators, the
first-order simplified model for the excitation systems,and the linear models for the loads and ac network are
used. Also, the system data are adopted from [24]. A
three-phase fault is applied in bus 1 between bus 1 and
bus 2. The circuit is tripped after 70 ms.
A. Study System 1 Equipped With the SVC, SSSC, and UPFC
For this system, the SVC is to be located at bus 101, the
SSSC at line 101-13, and the UPFC at bus 101 and line 101-13.
Since only one FACTS device is to be located in this system at a
time, the most effective signal is chosen based on the RHP-zeros
and HSV. Once the FACTS devices are placed in the system,
the choices for the stabilizing signal could be as ; ;; or [25].
First, the RHP-zeros for the above candidates for the SVC,
the SSSC, and the UPFC are calculated. Table I shows whether
the candidates encountered the RHP-zeros or not. For the SVC
as shown in Table I, only the candidates 1 and 3 encountered
the RHP-zeros. This analysis leaves us with the candidates 2
and 4 for a further consideration by the HSV. As illustrated in
Fig. 4, statistically the HSV for the candidate 2 is larger than the
HSV for the candidate 4. In other words, candidate 2 contains
more information about the system internal states than output 4.
Therefore, candidate 2 is more preferable than candidate 4 and
is selected as the final choice.
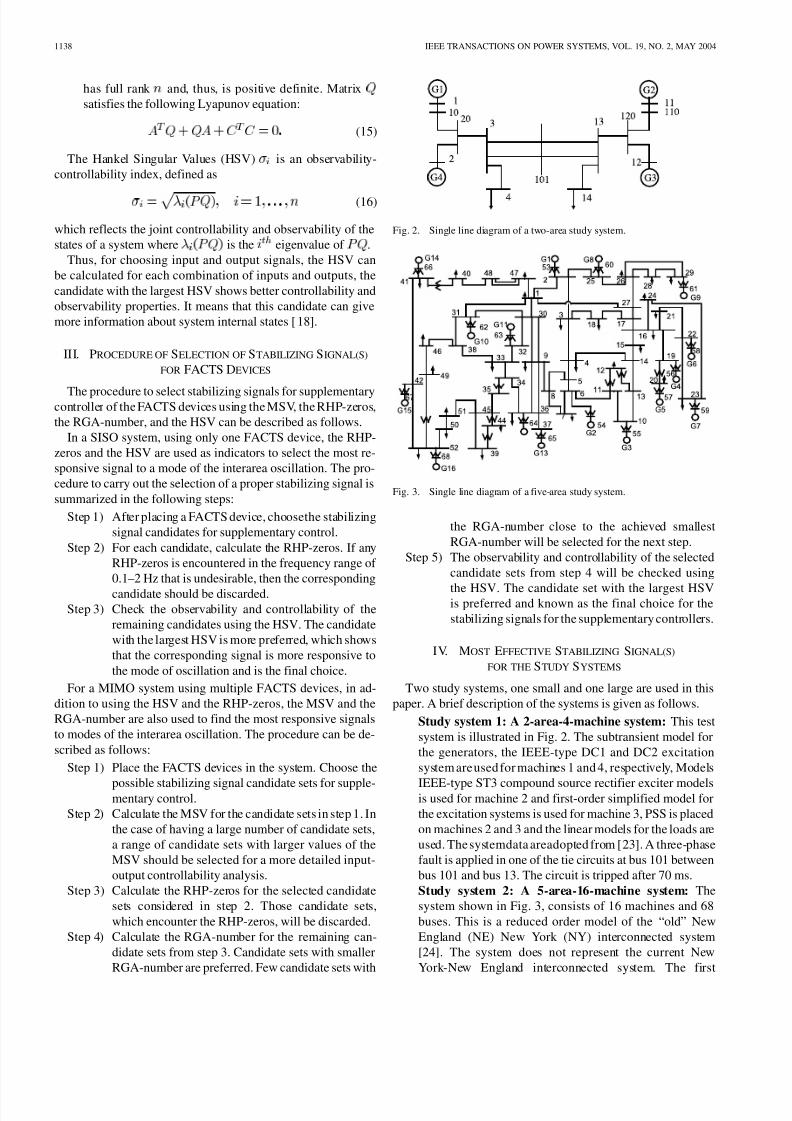
Fig. 5. HSV of the candidates 2 and 3 for the system 1 equipped with SVC:plus-dotted line: candidate 3; star-dotted line: candidate 2.
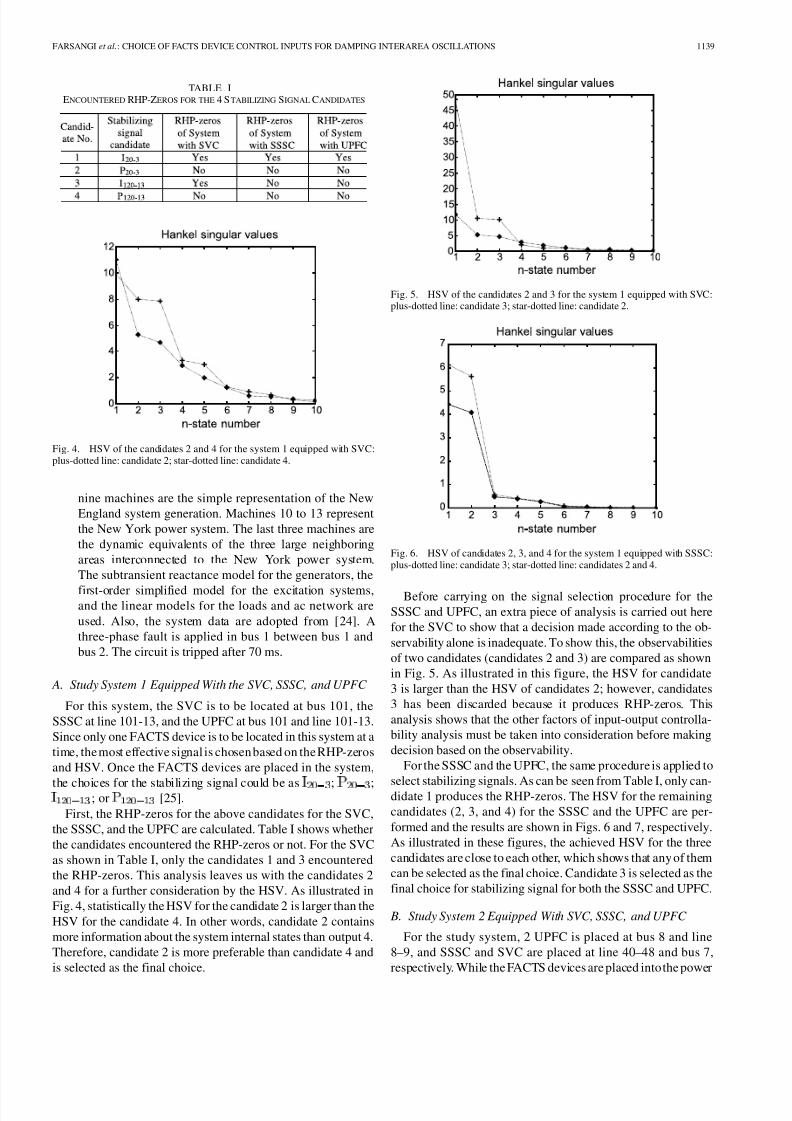
Fig. 6. HSV of candidates 2, 3, and 4 for the system 1 equipped with SSSC:plus-dotted line: candidate 3; star-dotted line: candidates 2 and 4.
Before carrying on the signal selection procedure for the
SSSC and UPFC, an extra piece of analysis is carried out here
for the SVC to show that a decision made according to the ob-
servability alone is inadequate. To show this, the observabilities
of two candidates (candidates 2 and 3) are compared as shown
in Fig. 5. As illustrated in this figure, the HSV for candidate
3 is larger than the HSV of candidates 2; however, candidates
3 has been discarded because it produces RHP-zeros. This
analysis shows that the other factors of input-output controlla-
bility analysis must be taken into consideration before making
decision based on the observability.
For the SSSC and the UPFC, the same procedure is applied to
select stabilizing signals. As can be seen from Table I, only can-didate 1 produces the RHP-zeros. The HSV for the remaining
candidates (2, 3, and 4) for the SSSC and the UPFC are per-
formed and the results are shown in Figs. 6 and 7, respectively.
As illustrated in these figures, the achieved HSV for the three
candidates are close to each other, which shows that any of them
can be selected as the final choice. Candidate 3 is selected as the
final choice for stabilizing signal for both the SSSC and UPFC.
B. Study System 2 Equipped With SVC, SSSC, and UPFC
For the study system, 2 UPFC is placed at bus 8 and line
8–9, and SSSC and SVC are placed at line 40–48 and bus 7,
respectively. While the FACTS devices are placed into the power

8/10/2019 Choice of FACTS Device Control Inputs for Damping Interarea Oscillations
http://slidepdf.com/reader/full/choice-of-facts-device-control-inputs-for-damping-interarea-oscillations 6/9
1140 IEEE TRANSACTIONS ON POWER SYSTEMS, VOL. 19, NO. 2, MAY 2004
Fig. 7. HSV of candidates 2, 3, and 4 for the system 1 equipped with UPFC:plus-dotted line: candidate 3; star-dotted line: candidate 2; dot-dotted line:candidate 4.
system, the choices of the candidates for the feedback signals
could be as follows:
For the SVC, the possible candidates are
.
For the UPFC, the possible candidates are
.
For the SSSC, the possible candidates are
.
With the above choices of feedback signals, it is desired to
select one signal for the SVC, one signal for the SSSC, and
one signal for the UPFC. Thus, the numbers of possibilities are
.
The 192 candidate sets are analyzed with detailed
input-output controllability analysis using the MSV, the
RHP-zeros, the RGA-number, and the HSV. At each step, someof the candidates are eliminated.
The MSV for all 192 candidate sets are calculated. The
achieved largest MSV value is 2.5079 and the achieved
smallest one is 0.0007. Candidate sets with very small MSV
compared to the candidate set with maximum MSV (2.5079)
cause ill-conditioning, which should be eliminated. Candidate
sets with the MSV close to 2.5079 are more preferable. How-
ever, the candidate sets with the MSV value in a wider range
between 0.0630 and 2.5079 are selected (39 candidates) for the
next step.
At this step, the RHP-zeros for these 39 candidate sets are
calculated. Since it is required to control the plant between
0.1–2 Hz, the RHP-zeros close to these values cause problemsand, therefore, are avoided. Among the 39 candidate sets,
only 20 candidates do not encounter the RHP-zeros as listed
in Table II and the other 19 candidates are eliminated. This
analysis leaves us with the 20 selected candidate sets for further
consideration by the RGA-number.
The RGA for the candidate sets having the MSV larger than
0.15 (12 candidates as bolded in Table II) are checked for the
frequency of interest. The candidates with the smallest RGA are
the best. Among these 12 candidates, candidate sets 11 –13 and
15 in Table II have smaller RGA as shown in Fig. 8. These four
candidates are chosen for the next step. The final decision is
made using the HSV analysis.
TABLE IIMSV FOR THE CANDIDATE SETS OF THE STUDY SYSTEM 2
Fig. 8. RGA plot of candidates 11, 12, 13, and 15 for the system 2: solid line:candidate15; dashed line: candidate13; dotted line: candidate12; dashed-dottedline: candidate 11.
It is found that candidate set 15 has the largest HSV among
the candidate sets 11–13 as illustrated in Figs. 9–11. These fig-
ures indicate that the candidate set 15 has better state controlla-
bility and observability properties. Therefore, the candidate set
15 is more preferable for control purposes and hence is selected
as the final choice. These stabilizing signals are used to design
the controllers for the UPFC, the SSSC, and the SVC in the later
stage of this study.
C. Performance Evaluation in the Study System 1
The purpose of this and the following sections is to show that
the selected signals are effective in controlling the modes of
oscillation. For this, the study system 1 is equipped with a SVC.
A supplementary controller is designed for the SVC using the
mixed-sensitivity method (the method is explained in [26]).
A three-phase fault is applied in one of the tie circuits at
bus 101. An eigenvalue analysis is carried out to evaluate the
damping ratios for prefault and postfault conditions. The entries
in Table III display the damping ratios and interarea modes of
8/10/2019 Choice of FACTS Device Control Inputs for Damping Interarea Oscillations
http://slidepdf.com/reader/full/choice-of-facts-device-control-inputs-for-damping-interarea-oscillations 7/9
FARSANGI et al.: CHOICE OF FACTS DEVICE CONTROL INPUTS FOR DAMPING INTERAREA OSCILLATIONS 1141
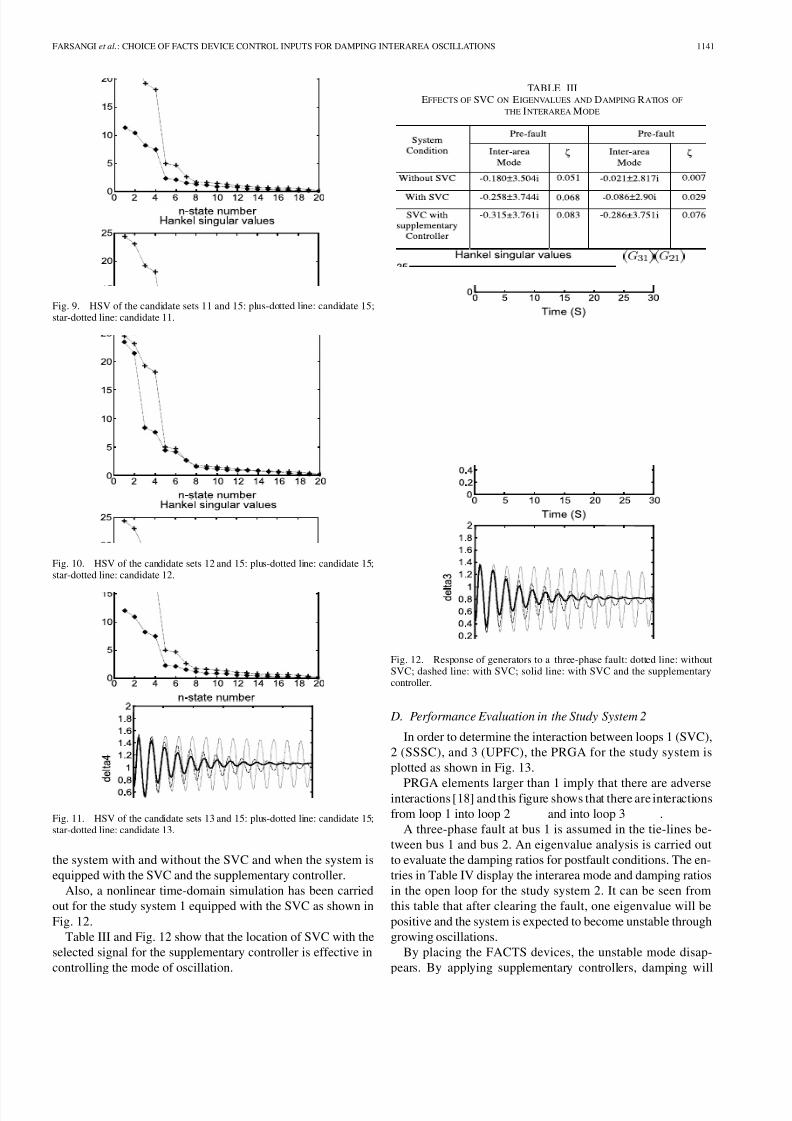
Fig. 9. HSV of the candidate sets 11 and 15: plus-dotted line: candidate 15;star-dotted line: candidate 11.
Fig. 10. HSV of the candidate sets 12 and 15: plus-dotted line: candidate 15;star-dotted line: candidate 12.
Fig. 11. HSV of the candidate sets 13 and 15: plus-dotted line: candidate 15;star-dotted line: candidate 13.
the system with and without the SVC and when the system is
equipped with the SVC and the supplementary controller.
Also, a nonlinear time-domain simulation has been carried
out for the study system 1 equipped with the SVC as shown in
Fig. 12.
Table III and Fig. 12 show that the location of SVC with the
selected signal for the supplementary controller is effective in
controlling the mode of oscillation.
TABLE IIIEFFECTS OF SVC ON EIGENVALUES AND DAMPING RATIOS OF
THE INTERAREA MODE
Fig. 12. Response of generators to a three-phase fault: dotted line: withoutSVC; dashed line: with SVC; solid line: with SVC and the supplementarycontroller.
D. Performance Evaluation in the Study System 2
In order to determine the interaction between loops 1 (SVC),
2 (SSSC), and 3 (UPFC), the PRGA for the study system is
plotted as shown in Fig. 13.
PRGA elements larger than 1 imply that there are adverseinteractions [18] and this figure shows that there are interactions
from loop 1 into loop 2 and into loop 3 .
A three-phase fault at bus 1 is assumed in the tie-lines be-
tween bus 1 and bus 2. An eigenvalue analysis is carried out
to evaluate the damping ratios for postfault conditions. The en-
tries in Table IV display the interarea mode and damping ratios
in the open loop for the study system 2. It can be seen from
this table that after clearing the fault, one eigenvalue will be
positive and the system is expected to become unstable through
growing oscillations.
By placing the FACTS devices, the unstable mode disap-
pears. By applying supplementary controllers, damping will

8/10/2019 Choice of FACTS Device Control Inputs for Damping Interarea Oscillations
http://slidepdf.com/reader/full/choice-of-facts-device-control-inputs-for-damping-interarea-oscillations 8/9
1142 IEEE TRANSACTIONS ON POWER SYSTEMS, VOL. 19, NO. 2, MAY 2004
Fig. 13. Elements of PRGA: Lines ended by square: dashed line: ; solidline: ; Lines ended by circle: dashed line: ; solid line: ; Linesended by arrow: dashed line: ; solid line: .
TABLE IVEFFECTS OF FACTS ON EIGENVALUES AND DAMPING RATIOS OF
THE INTERAREA MODES (STUDY SYSTEM 2)
TABLE VEFFECTS OF CLOSED-LOOP ON DAMPING RATIOS OF
THE INTERAREA MODES (STUDY SYSTEM 2)
be improved further. Table V shows the damping ratio of the
closed-loop system with the supplementary controllers for the
study system 2. In Table V, the location of modes changed
slightly from prefault to postfault conditions.
To verify the performance of the controllers in the face of the
system nonlinearity, a nonlinear simulation is performed.
Tables IV and V and Fig. 14 show that the locations of theFACTS devices with the selected signals for the supplementary
controller are responsive to the modes of oscillation.
V. CONCLUSION
In this paper, the importance of identifying effective stabi-
lizing signals for the FACTS devices in a power system is high-
lighted. It is concluded that the method of controllability and ob-
servability alone as an analytical tool is not adequate to identify
the most effective feedback signals. The final selection should
be carried out in a more detailed input-output controllability
Fig. 14. Dynamic response of the system following a three-phase fault at
bus 1 in the study system 2: dotted line: without FACTS devices; dashedline: FACTS devices without controllers; solid line: FACTS devices withsupplementary controllers.
analysis. In SISO systems, this task can be done using the RHP-
zeros and the HSV indicators. For MIMO systems, in addition
to the RHP-zeros and the HSV, other indicators, the MSV and
the RGA-number, are used.
With the chosen signals for SISO and MIMO systems, the
corresponding supplementary controllers are designed. The re-
sults show that the selected signals are responsive to interarea
modes.

8/10/2019 Choice of FACTS Device Control Inputs for Damping Interarea Oscillations
http://slidepdf.com/reader/full/choice-of-facts-device-control-inputs-for-damping-interarea-oscillations 9/9
FARSANGI et al.: CHOICE OF FACTS DEVICE CONTROL INPUTS FOR DAMPING INTERAREA OSCILLATIONS 1143
REFERENCES
[1] P. Zhang, A. R. Messina, A. Coonick, and B. J. Cory, “Selection of lo-cations and input signals for multiple SVC damping controllers in largescale power systems,” in Proc. IEEE Power Eng. Soc. Winter Meeting ,1998, Paper IEEE-0-7803-4403-0, pp. 667–670.
[2] A.O. Ekwue,H. B.Wan, D.T. Y. Cheng,andY.H. Song, “Singular valuedecompositionmethodfor voltagestability analysis on the NationalGridsystem (NGC),” Int. J. Elect. Power Energy Syst. , vol. 21, no. 6, pp.425–432, 1999.
[3] A.M. A.Hamdan, “An investigationof the significanceof singularvaluedecomposition in power system dynamics,” Int. J. Elect. Power EnergySyst., vol. 21, no. 6, pp. 417–424, 1999.
[4] E. V. Larsenand J. H.Chow, SVCcontroldesignconcepts forsystem dy-namic performance, in IEEE Special Publications: Application of StaticVAR Systems for System Dynamic Performance, pp. 36–53, 1987.
[5] Q. Zhao and J. Jiang, “Robust SVC controller design for improvingpower system damping,” IEEE Trans. Energy Conversion, vol. 10, pp.201–209, June 1995.
[6] , “A TCSC damping controller design using robust control theory,” Elect. Power Energy Syst., vol. 20, no. 1, pp. 25–33, 1998.
[7] N. Martins and L. T. G. Lima, “Determination of suitable locations forpower system stabilizers and Static VAR Compensators for dampingelectromechanical oscillations in large scale power systems,” IEEE Trans. Power Syst., vol. 5, pp. 1455–1469, Nov. 1990.
[8] P. Pourbeik and M. J. Gibbard, “Damping and synchronizing torques in-duced on generators by FACTS stabilizers in multimachine power sys-
tems,” IEEE Trans. Power Syst., vol. 11, pp. 1920–1925, Nov. 1996.[9] S. E. M. De Oliveira, “Synchronizing and damping torque coefficients
and power system steady-state stability as affected by static VAR com-pensators,” IEEE Trans. Power Syst., vol. 9, pp. 109–119, Feb. 1994.
[10] S. Lee and C. C. Liu, “An output feedback static var controller for thedamping of generator oscillations,” Elect. Power Syst. Res., vol. 25, no.1, pp. 9–16, 1994.
[11] E. Z. Zhou, “Application of static var compensators to increase powersystem damping,” IEEE Trans. Power Syst., vol. 8, pp. 655–661, May1993.
[12] H. F. Wang, F. J. Swift, and M. Li, “Selection of installing locationsand feedback signals of FACTS-based stabilisers in multimachine powersystems by reduced-order modal analysis,” Proc. Inst. Elect. Eng., Gen.Transm. Dist., vol. 144, no. 3, pp. 263–269, May 1997.
[13] B. T. Ooi, M. Kazerani, R. Marceau, Z. Wolanski, F. D. Galiana, D.McGillis, and G. Joos, “ Mid-point siting of FACTS devices in trans-mission lines,” IEEE Trans. Power App. Syst., vol. 100, pp. 3933–3939,
Aug. 1997.[14] H. F. Wang, F. J. Swift,and M. Li, “Indices for selectingthe bestlocation
of PSS’s or FACTS-based stabilisers in multimachine power systems: acomparative study,” Proc. Inst. Elect. Eng., Gen. Transm. Dist., vol. 144,no. 2, pp. 155–159, Mar. 1997.
[15] P. Pourbeik and M. J. Gibbard, “Simultaneous coordination of powersystem stabilizers and FACTS device stabilizers in a multimachinepower system for enhancing dynamic performance,” IEEE Trans.Power Syst., vol. 13, pp. 473–479, May 1998.
[16] A. R. Messina, S. D. Olguin, S. C. A. Rivera, and D. Ruiz-Vega, “An-alytical investigation of large scale use of Static VAr Compensation toaid damping of inter-area oscillations,” in Proc. 7th Int. Conf. AC-DC Power Transm., London, U.K., 2001, pp. 187–192.
[17] M. Ishimaru, G. Shirai, K. Y. Lee, and R. Yokoyama, “Allocation anddesign of robust TCSC controllers based on power system stabilityindex,” in Proc. IEEE Power Eng. Soc. Winter Meeting, vol. 1, 2002,pp. 573–578.
[18] S. Skogestadand I. Postethwaite, Multivariable Feedback Control, Anal- ysis and Design. New York: Wiley, 1996.
[19] K. Zhou, J. C. Dole, and K. Glover, Robust and Optimal Con-trol. Englewood Cliffs, NJ: Prentice-Hall, 1996.
[20] M. Hovd and S. Skogestad, “Simple frequency-dependent tools for con-trol system analysis, structure selection and design,” Automatica, vol.28, no. 5, pp. 989–996, Sept. 1992.
[21] P. Grosdidier and M. Morari, “Interaction measures for systems underdecentralised control,” Automatica, vol. 22, no. 3, pp. 309–319, May1986.
[22] M. Hovd and S. Skogestad, “Sequential design of decentralised con-troller,” Automatica, vol. 30, no. 10, pp. 1601–1607, 1994.
[23] G. Rogers, Power System Oscillations. Norwell, MA: Kluwer, 2000.
[24] J. H. Chow, Ed., Time Scale Modeling of Dynamic Networks With Appli-cations to Power Systems. Berlin, Germany: Springer-Verlag, 1982.[25] P. Kundur, Power System Stability and Control. New York: McGraw-
Hill, 1994.[26] M. M. Farsangi and Y. H. Song, “Sequential decentralised control of
FACTS devices in large power systems,” in Proc. 7th Int. Conf. AC-DC Power Transm., London, U.K., Nov. 2001, pp. 268–273.
M. M. Farsangi received the first degree fromKerman University, Kerman, Iran, in 1999, and thePh.D. degree in electrical engineering from BrunelInstitute of Power Systems, Brunel University,Uxbridge, U.K., in 2003.
Currently, she is with Kerman University. Her in-
terests include power system control and stability.
Y. H. Song (SM’94) is a Professor of ElectricalEnergy Systems at Brunel Institute of Power Sys-tems, Brunel University, Uxbridge, U.K., where hehas been since 1997. His research interests includepower system optimization, control, economics,FACTS, and intelligent system applications.
He is a fellow of the IEE and a chartered elec-trical engineer in the U.K. In 2002, he was awardedthe D.Sc. degree by Brunel University for his signif-
icant contributions to power system knowledge andresearch.
Kwang Y. Lee (F’01) received the B.S. degree inelectrical engineering from Seoul National Univer-sity, Korea, in 1964, the M.S. degree in electrical en-gineeringfrom North Dakota State University, Fargo,in 1968,and the Ph.D. degree inSystem Science fromMichigan State University, East Lansing, in 1971.
Currently, he is Professorof ElectricalEngineeringand Director of Power Systems Control Laboratoryat Pennsylvania State University, University Park. Hehasalso been with Michigan State,Oregon StateUni-versity, Corvallis; and the University of Houston. His
research interests include power system control, operation, planning, and intel-ligent system applications to power systems. He is Associate Editor of IEEETRANSACTIONS ON NEURAL N ETWORKS, and Editor of IEEE TRANSACTIONS
ON ENERGY CONVERSION.
Top Related