


Languages
Pages
Legal


www.wipchile.cl
CENTRO DE ESTUDIOS DE LA ECONOMÍA DIGITALCENTRO DE ESTUDIOS DE LA ECONOMÍA DIGITALCÁMARA DE COMERCIO DE SANTIAGOCÁMARA DE COMERCIO DE SANTIAGO
Exploring whys and Exploring whys and howshows: : the internet in Chile and the internet in Chile and the WIP 3.0 project*the WIP 3.0 project*
By Sergio Godoy EBy Sergio Godoy E. MBA PhD, . MBA PhD, Director or Research & Postgraduate StudiesDirector or Research & Postgraduate Studies
School of Communications School of Communications Universidad Universidad CatolicaCatolica de de ChileChile
[email protected]@puc.cl
* * A project executed with the Institute of Sociology and the School of Engineering A project executed with the Institute of Sociology and the School of Engineering ((FondecytFondecyt Nº1110098) and the support of the Ministry of Economics (MINECON)Nº1110098) and the support of the Ministry of Economics (MINECON)
www.wipchile.cl
ContentsContents
• People and organisations: WIP / BIT• BIT Chile main descriptive results 2010• WIP Chile main descriptive results 2010• Qualitative comparison UK/Chile: highlights• The WIP/BIT 3.0 project
2

www.wipchile.cl
3
3
WORLD INTERNET PROJECTWeb & IT usage in everyday life of people
Fields:
IT adoption trends & expendituresAttitudes
Media usageSocial links
E-commerceImpact on offline activities
Impact at work (productivity)Impact at school (performance)
WIP & BIT and WIP & BIT and theirtheir commoncommon fieldsfields
BIT PROJECTIT usage & impact on business
and the economy
Fields:In companies:
•IT adoption & budgets•Organisational impact(workforce, structure,
outsourcing)•Links with partners & clients
•Business results•Globalisation/geographical reach
•Chile: reputation
State of the Information Economy
Transactions & e-commerce
Overall IT usage & adoption
Performanceat work &
school
Corporate communication & reputation
The information economy

www.wipchile.cl
BIT Chile by S Godoy 4
4
Gráfico 1. Evolución comparada del sector información en Chile, Corea y EE.UU.
(porcentaje del PIB de cada país) Fuente: Avilés, 2007
Economía de la información 1990-2003
US
US
Chile Chile Korea
Korea Korea
40.00%
45.00%
50.00%
55.00%
60.00%
65.00%
70.00%
US Chile Korea Logarítmica (US) Logarítmica (Chile) Logarítmica (Korea)
US (55.87%) (63.00%) Chile (51.21%) (51.73%) Korea (51.93%) (56.54%) (59.04%)
1990 1992 1995 1996 1997 2000 2003
The information economy in Chile, S Korea and the USA’s GNP1990-2003
Source: BIT teams in each country

www.wipchile.cl
5

www.wipchile.cl
6
Chilean GNP Chilean GNP –– 20032003
Services
Material
Information
31%
8%
44%
39% 61%
52%
48%
Products
17%
Work and occupation
patterns in an (information)
economy

www.wipchile.cl
7

www.wipchile.cl
Selected organisational impacts of IT in firms, 2007Selected organisational impacts of IT in firms, 2007--20102010(% of respondents strongly agree /agree on an increase of the following phenomena)(% of respondents strongly agree /agree on an increase of the following phenomena)
8
76
81
63
73
56
33
38
42
47
51
87
87
83
81
67
63
60
59
54
44
0 20 40 60 80 100
Mgmt needs intelligent info
Workers need to retrain constantly
Nº of employees facing a screen
IT skills for low level employees
Worker collaboration with ad hoc tools
Tele-conferencing
Employees working from their homes
Geographical dispersion of the organisation
Wider mgmt's span of control
Flatter organisation
2010 2007

www.wipchile.cl
Internet Internet usersusers in in selectedselected WIP WIP countriescountries, 2009 */ 2010**, 2009 */ 2010**
Helsper & Godoy-Chile & UK comparison 9
80 78 77 7773 70 67
61 5955
51 48 47 45 4237
32
0
20
40
60
80
100
Swed
en**
USA
**
New
Zea
land
*
Cana
da*
Aus
tral
ia*
Bri
tain
**
Isra
el*
Sing
apor
e*
Mac
ao*
Chile
(Sa
ntia
go)*
*
Czec
h R
epub
lic**
Chile
**
Ital
y**
Colo
mbi
a**
Hun
gary
*
Port
ugal
**
Mex
ico*
*

www.wipchile.cl
10
Chilean internet users according to age, 2009
Source: based on CASEN survey data.
0%
10%
20%
30%
40%
50%
60%
70%
80%
5-9 10-14 15-19 20-24 25-29 30-34 35-39 40-44 45-49 50-54 55-59 60-64 65-60 70-74 75-79 80-84 85+

www.wipchile.cl
11
6%6%
12%
34%
42%
2010
12-17 18-24 25-34 35-49 50-64
3%9%
8%
39%
40%
2008
12-17 18-24 25-34 35-49 50-64
Chilean non users of the internet, 2010 vs. 2008
In 2010 adults aged 60 to 64 are included.

www.wipchile.cl
12
Chilean Internet users according to income quintiles 2000, 2003, 2006, 2009
Source: based on CASEN survey results
9% 10%15%
22%
45%
15%18%
22%
33%
59%
25%28%
33%
44%
65%
25%
32%
38%
50%
70%
0%
10%
20%
30%
40%
50%
60%
70%
80%
Quintile I (lowest) Q II Q III Q IV Quintile V (highest)
2000 2003 2006 2009

www.wipchile.cl
13
84%90%
79%
35%
15%
8%
81% 83%
44%
32%
22%
7%
78%
52%
42%37%
49%
10%
82%
75%
61%
35%
28%
8%
0%
10%
20%
30%
40%
50%
60%
70%
80%
90%
100%
School (N=165) Home (N=406) Work (N=177) Friends or relatives' home
(N=406)
Paid places (N=406)
Free places (N=406)
ABC1/C2 C3 D/E Total
Percentage of internet users according to place of usageaccording to income level, 2010
Fuente: encuestas WIP-Chile 2010. Unidad de análisis: usuarios Internet 12-64 años, residentes en Santiago.
• Highest income(c1) uses in all
places; lowest (D/E) less at home and more in paid-for
locations

www.wipchile.cl
14
Percentage of internet users using wireless connections* per year
5%
13%
25%
61%
0%
10%
20%
30%
40%
50%
60%
70%
Type of home connection
2004 2006 2008 2010
*Mobile broadband and WiFI

www.wipchile.cl
15
The 10 most popular online activities by internet users,
2010
(Percentage of users who do eachactivity at least once daily)
64%
51%
51%
48%
44%
35%
35%
32%
28%
26%
Use Facebook
Browse the Web
Visit social media
Use instant messaging
Comment on …
Read news
Send attachments
Find or check an …
Get information for …
Fuente: Encuestas WIP-Chile. Unidad de análisis: personas de 12 a 64 años, residentes en Santiago

www.wipchile.cl
16
Most frequent activities by internet users according to income level, 2010. (Percentage of users who do the activity at least once daily).
64%
51% 51%48%
44%
35% 35%
80%
59%
64%
56%
48%
37%43%
57%54%
46%
53%50%
37%33%
42%
35%
30% 30% 31% 29%
20%
0%
10%
20%
30%
40%
50%
60%
70%
80%
90%
E-mail Use Facebook Browsing the Web
Visit social media
Use instant messaging
Comment on blog/fotolog
Read local news
Total ABC1-C2 C3 D-E

www.wipchile.cl
17
Perceptions about political influence of the internet, 2010. Percentage of answers “strongly agree/agree"
71%
63%
55%
53%
35%
35%
28%
44%
38%
52%
45%
19%
38%
31%
People should be free to criticise their government by internet
It's OK to people to express their ideas on the internet, however extreme
state should increase regulation of the internet
In general, I feel comfortable saying what I think about politics
In internet it is safe to say whay one thinks about politics
I am worried companies know what I do in the internet
I am worried the state knows what I do in the internet
User Non user
Unit of analysis: persons aged 12 to 64, living in Santiago

www.wipchile.cl
18
44%
35% 35%32%
53% 53%
16%18%
54%
44%42%
36%
46%
36% 37%
42%
28%
9%
35%
14%
30%28%
46%
55%
0%
10%
20%
30%
40%
50%
60%
Use instant messaging Comment on blog/fotolog Read local news Send attachments
Total 12-17 18-24 25-34 35-49 50-64
Most frequent activities by internet users according to age, 2010. (Percentage of users who do the activity at least once daily).

www.wipchile.cl
19
Percentage of internet users and non users who own a mobile phone, 2010
Fuente: Encuestas WIP-Chile. Unidad de análisis: personas de 12 a 60 años, estratos ABC1, C2, C3 y D residentes en Santiago
86%
77%
User Non user

www.wipchile.cl
20
Payment systems of mobile phones owned by internet users and non usersaccording to income, 2010
Unit of analysis: people aged 12-64, owners of a mobile phone, residents of Santiago
61%
39%
47%53%
70%
30%
82%
18%
0%
10%
20%
30%
40%
50%
60%
70%
80%
90%
Prepaid Plan
Total ABC1-C2 C3 D-E
68%
32%
42%
58%
79%
21%
74%
26%
0%
10%
20%
30%
40%
50%
60%
70%
80%
90%
Prepaid Plan
Total ABC1-C2 C3 D-E
USERS NON USERS

www.wipchile.cl
21
The 10 most frequent activities done in mobile phones by internet users and non users, 2010.
Unit of analysis: people aged 12 to 64, owners of a mobilephone, living in Santiago
95%
84%
83%
68%
52%
43%
39%
22%
21%
17%
14%
98%
46%
66%
55%
34%
10%
21%
15%
5%
0%
2%
Talk
Send/receive text messages
Contact friends/relatives who see in person
Contact people who doesn't see in person …
For professional or work matters
Photos or videos (capture, send, etc.)
Play
Download music MP3 or ringtones
Send/receive e-mail
Find information in Google and similar seach …
Participate in social media (Facebook, Twitter)
User Non user

www.wipchile.cl
Deepening the concept of Digital Deepening the concept of Digital Exclusion: a comparison between the Exclusion: a comparison between the
UK and Chile*UK and Chile*By By
Sergio Godoy, UC School of CommunicationsSergio Godoy, UC School of CommunicationsEllen J. Ellen J. HelsperHelsper, London School of Economics, London School of Economics
**A project supported by The Conference Board / A project supported by The Conference Board / FundaciónFundación TelefónicaTelefónica

www.wipchile.cl
AimsAims
• Why some engage with ICTs while others from same background do not?– Need to go beyond the bipolar access/not access
(digital) and want/do not want (decisional) divides-
• Focus on the reasons, attitudes, fears or pressures behind this decision, which can change over time.
• Exploring in-depth within a specific & significant segment of population from Chile & UK:– Who feels technology is more or less integrated.– Motivators and obstacles, real or imaginary. – Perceptions of usefulness and purpose within a complex
network of social ties.
Helsper & Godoy-Chile & UK comparison 23

www.wipchile.cl
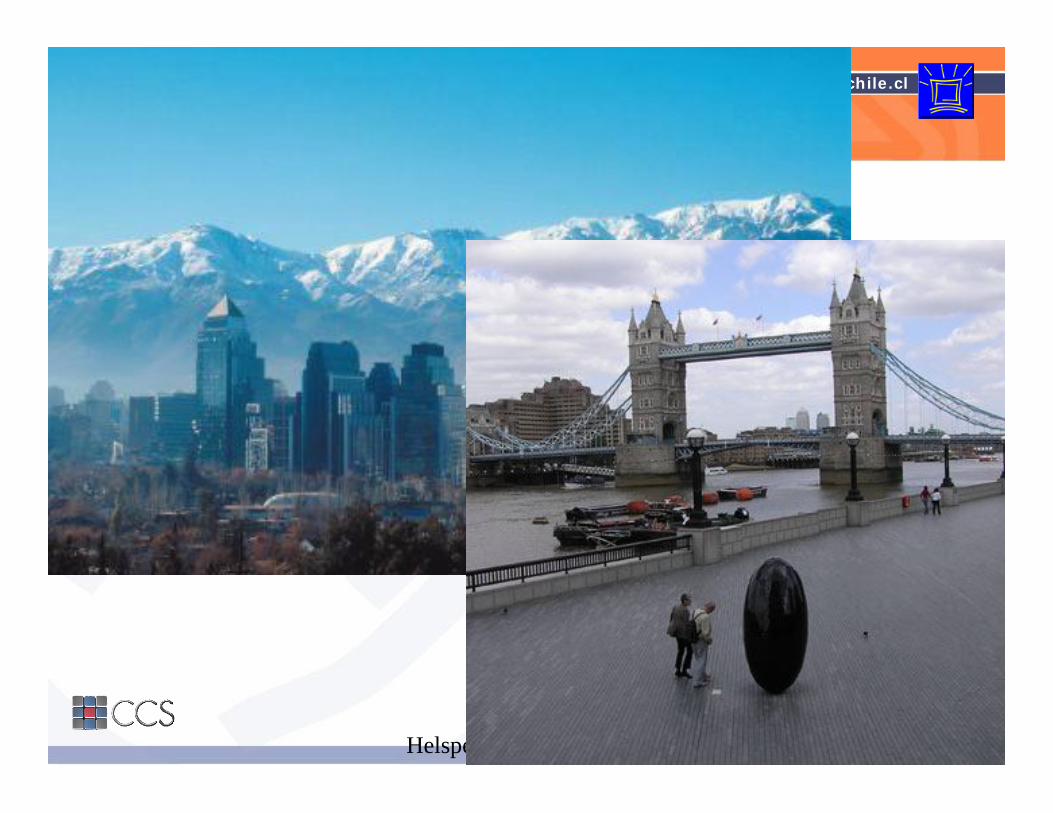
Chile and Chile and thethe UKUK
• UK and Chile: relative leaders in digital inclusion in their region (Northern Europe, Latin America), surpassed by others.
• Differences between the two could illustrate a wider range of possibilities.
Helsper & Godoy-Chile & UK comparison 24
www.wipchile.cl
Helsper & Godoy-Chile & UK comparison 25

www.wipchile.cl
SourceSource: : WorldWorld EconomicEconomic ForumForum Global Global InformationInformation TechnologyTechnology ReportReport 20102010
26

www.wipchile.cl
UK Chile
UNDP Human Development Indexranking & score, 2010
26th (0.840,“Very High”)
45th (0.634, “High”)
UNDP’s inequality-adjusted HDI scores, 2010
0.766 0.630
UNDP’s Gender Inequality Indexscore, 2010
0.355 0.505
Transparency International’sCorruption Perception Index Rank and score, 2009
17th (7.7) 25th (6.7)
27

www.wipchile.cl
QuantitativeQuantitative comparisonscomparisons: : Internet Internet usersusers in in selectedselected WIP WIP countriescountries, 2009 */ 2010**, 2009 */ 2010**
Helsper & Godoy-Chile & UK comparison 28
80 78 77 7773 70 67
61 5955
51 48 47 45 4237
32
0
20
40
60
80
100
Swed
en**
USA
**
New
Zea
land
*
Cana
da*
Aus
tral
ia*
Bri
tain
**
Isra
el*
Sing
apor
e*
Mac
ao*
Chile
(Sa
ntia
go)*
*
Czec
h R
epub
lic**
Chile
**
Ital
y**
Colo
mbi
a**
Hun
gary
*
Port
ugal
**
Mex
ico*
*

www.wipchile.cl
Model for the relationships between social and digital Model for the relationships between social and digital inclusioninclusion
Norris, 2001; Van Norris, 2001; Van DijkDijk, 2005; Witte & , 2005; Witte & MannonMannon, 2010; , 2010; HelsperHelsper, 2008; Selwyn, 2004; , 2008; Selwyn, 2004; WarschauerWarschauer, 2004, 2004
Helsper & Godoy-Chile & UK comparison 29
www.wipchile.cl
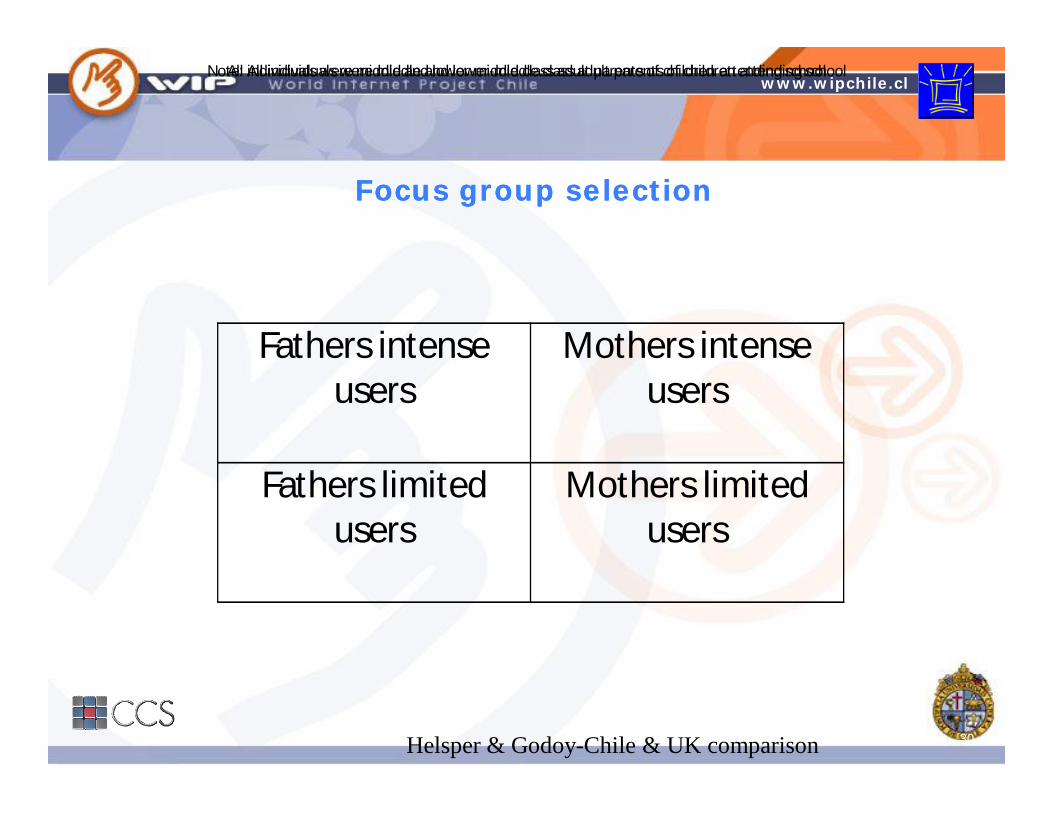
FocusFocus groupgroup selectionselection
Helsper & Godoy-Chile & UK comparison 30
Fathers intense users
Mothers intense users
Fathers limited users
Mothers limited users
Note: All individuals were middle and lower-middle class adult parents of children attending schoolAll individuals were middle and lower-middle class adult parents of children attending school

www.wipchile.cl
General engagement and valuations: commonalitiesGeneral engagement and valuations: commonalities
• ‘Digitisation inevitable’ > UK pessimistic - Chile aspirational.
• The internet and mobiles perceived as distinct technologies.
• Mobiles fundamental, extension of the body, an integral part of everyday life.
• Mothers concerned about children - fathers a wider repertoire of reasons.
• Children: a powerful driver for ICT access, very proficient but also poor trainers.
– Concern about the “copy & paste”, lazy mentality of youngsters
Helsper & Godoy-Chile & UK comparison 31

www.wipchile.cl
UK UK specificitiesspecificities
• Engagement not a free and positive choice.
• Concerns:– Safety & surveillance issues (not in Chile)– How to save money by engaging with ICT (not at all in Chile)
• Mobile phones: 24 hour safety & support.... constant access a major concern, puts people off.
• (Social) networks strengthen digital inclusion- wide, informal, instant support in relation to ICTs.
Helsper & Godoy-Chile & UK comparison 32
www.wipchile.cl
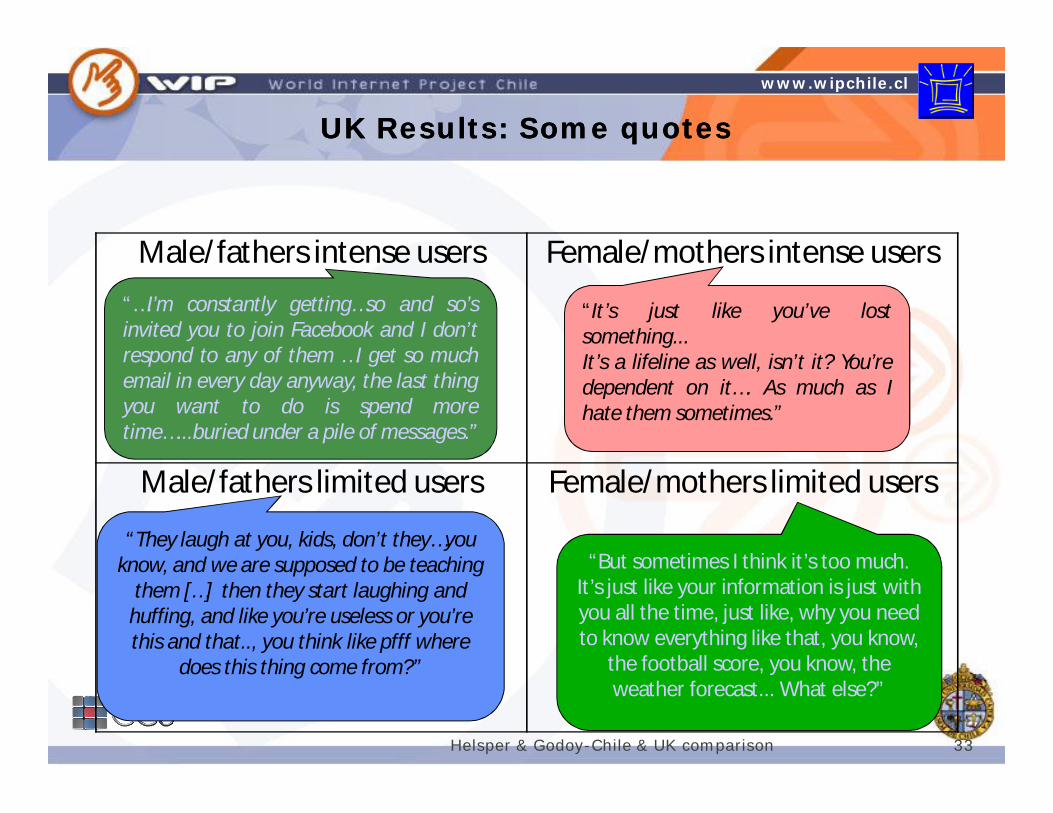
Male/fathers intense users Female/mothers intense users
Male/fathers limited users Female/mothers limited users
Helsper & Godoy-Chile & UK comparison 33
“…I’m constantly getting…so and so’sinvited you to join Facebook and I don’trespond to any of them …I get so muchemail in every day anyway, the last thingyou want to do is spend moretime…...buried under a pile of messages.”
UK Results: Some quotesUK Results: Some quotes
“It’s just like you’ve lostsomething...It’s a lifeline as well, isn’t it? You’redependent on it…. As much as Ihate them sometimes.”
“They laugh at you, kids, don’t they…you know, and we are supposed to be teaching
them […] then they start laughing and huffing, and like you’re useless or you’re this and that.., you think like pfff where
does this thing come from?”
“But sometimes I think it’s too much. It’s just like your information is just with you all the time, just like, why you need to know everything like that, you know,
the football score, you know, the weather forecast... What else?”

www.wipchile.cl
Chile Chile specificitiesspecificities
• Workplace and gender roles seem the most prominent aspects explaining engagement: – Limited users reported higher rates of free-lance work and
more unstable jobs – Children are a motivating factor to engage with ICTs– Female limited users felt backward and sacrificed
themselves (paid jobs, access to the family’s PC) for the sake of their families
– Some male Chilean infrequent users boasted about not needing the internet -they could rely on relatives and colleagues
Helsper & Godoy-Chile & UK comparison 34

www.wipchile.cl
Male/fathers intense users Female/mothers intense users
Male/fathers limited users Female/mothers limited users
ChileanChilean resultsresults: : somesome quotesquotes
Helsper & Godoy-Chile & UK comparison 35
“It is not that one hasn’t gotthe time for it. It’s rather thatkids do not leave a space (forme). I mean, when one hassome spare time, they’re(logged in) there”
“I have no motivation whatsoeverto use the internet. (I use mobilephones) for the most basic things,short and precise. (If at need) Iwould learn how to, just as I didwith the cell phone”
“Yesterday I left my cellphone at home and Iwanted to die. It was likebeing without clothing”
“Life hasn’t changed forthem (our children), it haschanged for us instead”
“Those in Facebook are full of shit in their heads”
”To learn aboutinternet] I look onthe internet…for‘Saint Google’, or Icall the internetprovider”

www.wipchile.cl
DiscussionDiscussion
• While reasons for disengagement differed between the two countries, the patterns of social exclusion were very similar
• There is greater potential for inclusion of limited users in Chile where ICT use is still more aspirational than in the UK
• Home and societal pressures are stronger in the UK, workplace and societal aspirations are in Chile
• These aspirations may change as the curve of technological diffusion in Chile approaches Britain’s.
• Motivations and “whys” –how different are they for each group, country, culture? (cfr. Presentation by G. Blank & B. Reisdorf)
Helsper & Godoy-Chile & UK comparison 36

www.wipchile.cl
WIP/BIT 3.0 proposalWIP/BIT 3.0 proposal
• Aim: determine how ICTs affect trust & confidence between organisations and their stakeholders
• Mixed methodological approach, initially qualitative and finally quantitative to generalise results:
• Three sector studies: retail, local government, telecoms/pay TV– Focus groups of stakeholders (frequent internet users vs. infrequent users)– Usability tests of online and offline interfaces– Analysis of the competitive/organisational environment (including stakeholder map) &
strategies of the chosen organisations; in-depth interviews of management
• 3rd year: (Enhanced) WIP survey to users / non (?) users:– Draw typologies by means of regression and cluster analysis
37
Top Related