


Languages
Pages
Legal


Characterizing U.S. Fruit
and Vegetable Production
Daniel Pick, Chief&
Agnes Perez, Agricultural Economist
Specialty Crops and Fibers Branch
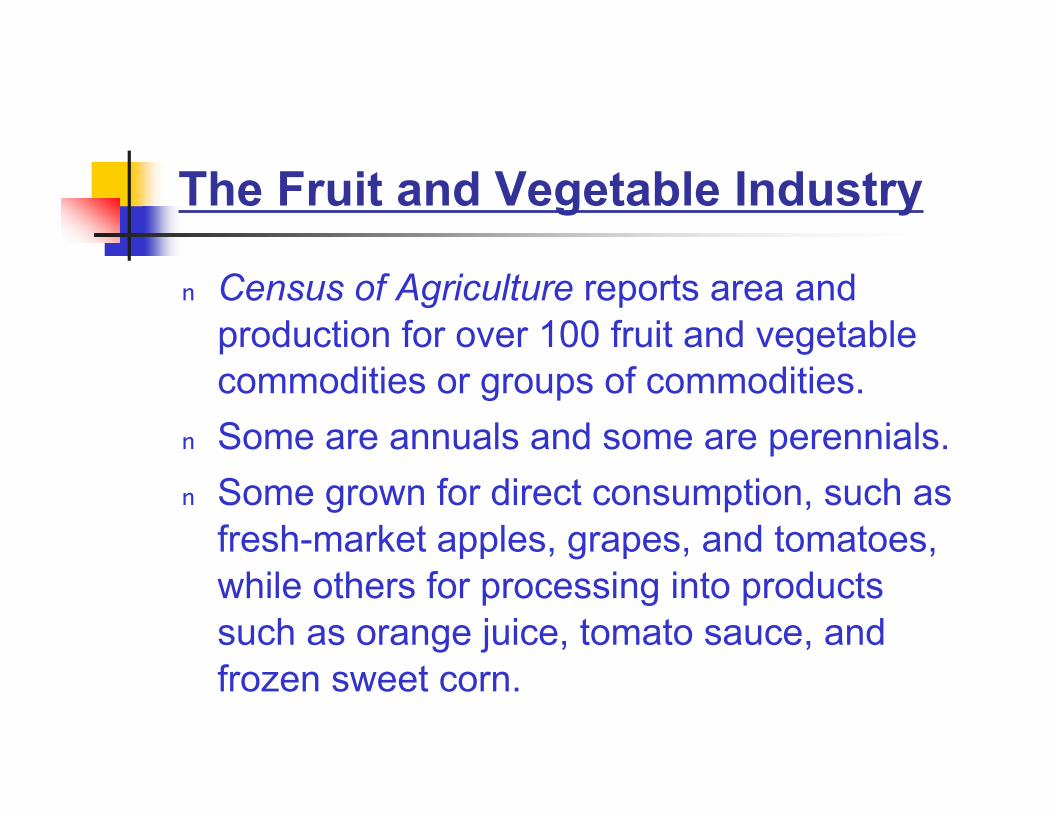
The Fruit and Vegetable Industry
n Census of Agriculture reports area and
production for over 100 fruit and vegetable
commodities or groups of commodities.
n Some are annuals and some are perennials.
n Some grown for direct consumption, such as
fresh-market apples, grapes, and tomatoes,
while others for processing into products
such as orange juice, tomato sauce, and
frozen sweet corn.

U.S. Farm Cash Receipts for Crops
7%
23%
6%
16%
30%
18%
Food grains Feed crops
Cotton & tobacco Oil crops
Fruit & vegetables Other crops
Source: USDA, Economic Research Service, Farm Income and Costs Briefing Room.
9%
24%
10%16%
26%
15%
Food grains Feed crops
Cotton & tobacco Oil crops
Fruit & vegetables Other crops
1990-92 2003-05

Vegetable Crops With Highest
Farm Cash Receipts
0.0 0.5 1.0 1.5 2.0 2.5 3.0
Dry Beans
Carrots
Broccoli
All peppers
Sweet corn
Onions
Mushrooms
Tomatoes
Lettuce
Potatoes
1990-94
1995-99
2000-05
Billion $
Source: Economic Research Service, USDA.
Average

Fruit and Tree Nut Crops With
Highest Farm Cash Receipts
0.0 1.0 2.0 3.0 4.0
Pecans
Grapefruit
Walnuts
Cherries
Peaches
Strawberries
Almonds
Apples
Oranges
Grapes
1990-94
1995-99
2000-05
Billion $
Source: Economic Research Service, USDA.
Average

Factors driving the upward trend in
U.S. fruit and vegetable production
over the last 50 years
n Improvements in production
management and technology
n Growth in domestic consumption
n Expansion in export sales

Number of Fruit and Vegetable
Farms in the United States
0
20,000
40,000
60,000
80,000
100,000
120,000
140,000
Pulses Potatoes* Vegetables** Tree fruit Berries
1987 1992 1997 2002
Source: 2002 Census of Agriculture, National Agricultural Statistics Service, USDA.
* Includes sweet potatoes.** Includes dried herbs.

Harvested Acres of U.S. Fruit and
Vegetable Farms
0.0
1.0
2.0
3.0
4.0
5.0
6.0
Pulses Potatoes* Land used
for
vegetables**
Land in
orchards
Berries
1987 1992 1997 2002
Million acres
* Includes sweet potatoes.** Includes dried herbs.
Source: Census of Agriculture, National Agricultural Statistics Service, USDA.

Growth in U.S. Fruit and Vegetable
Production Slows in Recent Years
0
20,000
40,000
60,000
80,000
100,000
120,000
1992 1994 1996 1998 2000 2002 2004 2006
vegetables fruit and nuts
1,000 short tons
Sources: Citrus Fruits Summary, Noncitrus Fruits and Nuts Summary, Vegetables,Crop Production, and Mushrooms, National Agricultural Statistics Service, USDA.

Factors slowing production
growth:
n Weather and disease problems
n Global competition
n Competition with urban land
development

Average U.S. Consumption of
Fruits and Vegetables
0100
200300400
500600700800
1975
-79
1980
-84
1985
-89
1990
-94
1995
-99
2000
-05
fruit & nuts vegetables*
Pounds per person, farm-weight
*Melons, dry peas & lentils, dry beans, and mushrooms are included.Source: Calculated by Economic Research Service, USDA.

U.S. Per Capita Consumption
of Vegetables and Melons
Fresh--39.1%
All potatoes--29.8%
Canning--22.7%
Freezing--4.8%
Pulses--1.6% Sweet potatoes--1.0%
Mushrooms--0.9%
*Average product share 2002-2006.Source: Calculated by Economic Research Service, USDA.

Harvested Acres in the U.S.
Vegetable and Melon Industry
0200400600800
1,0001,2001,4001,6001,800
Fresh-market
Processing
Potatoes
Dry beans
Melons
1992-94 2004-06
1,000 acres
Source: Vegetables and Crop Production, National AgriculturalStatistics Service, USDA.

Harvested Area for Select Fresh-
Market Vegetables and Melons
0
50
100
150
200
250
300
Swee
t cor
nHea
d le
ttuce
Onion
sLe
af/R
omai
ne
Wat
erm
elon
Brocc
oli
Tom
atoe
sCan
talo
upe
Carro
tsCab
bage
1995
2005
1,000 acres
Source: Vegetables Annual Summary, National Agricultural StatisticsService, USDA.

Harvested Acres of Select
Processing Vegetables
0
100
200
300
400
500
600
Swee
t cor
n
Tom
atoe
sG
reen
pea
sSna
p be
ans
Cuc
umbe
rs
Car
rots
1995
2005
1,000 acres
Source: Vegetables Summary, National Agricultural StatisticsService, USDA.
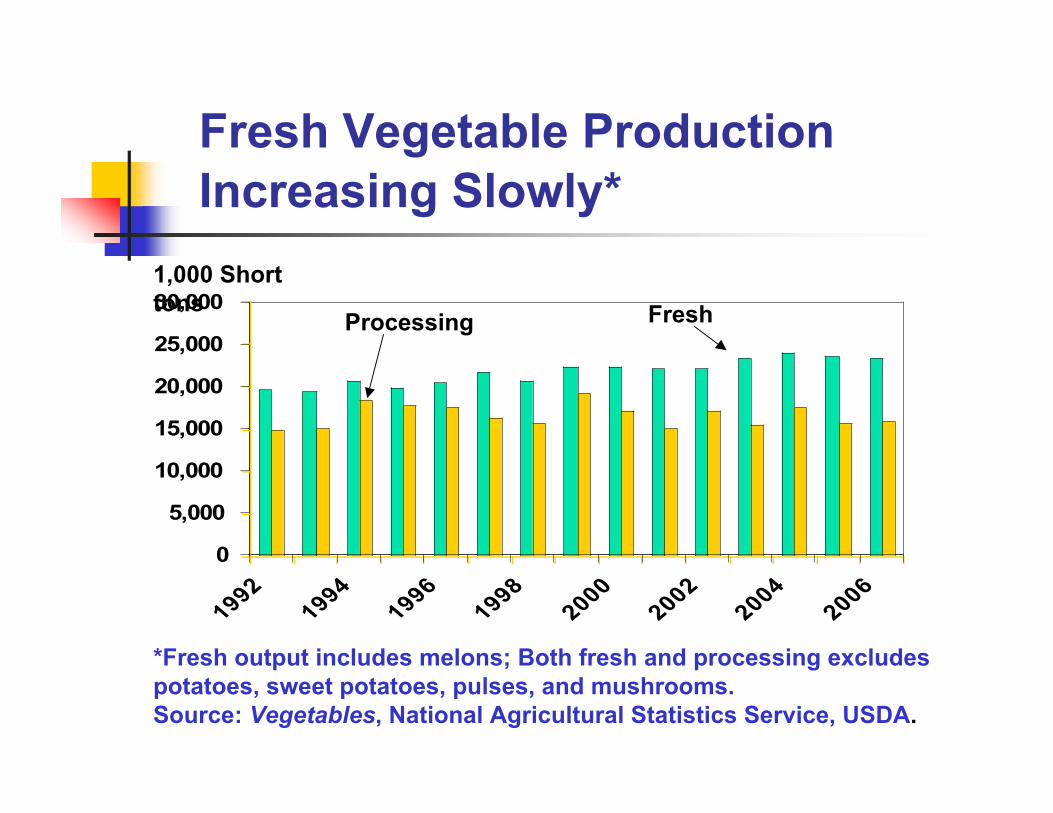
Fresh Vegetable Production
Increasing Slowly*
0
5,000
10,000
15,000
20,000
25,000
30,000
1992
1994
1996
1998
2000
2002
2004
2006
1,000 Shorttons
*Fresh output includes melons; Both fresh and processing excludespotatoes, sweet potatoes, pulses, and mushrooms.Source: Vegetables, National Agricultural Statistics Service, USDA.
FreshProcessing
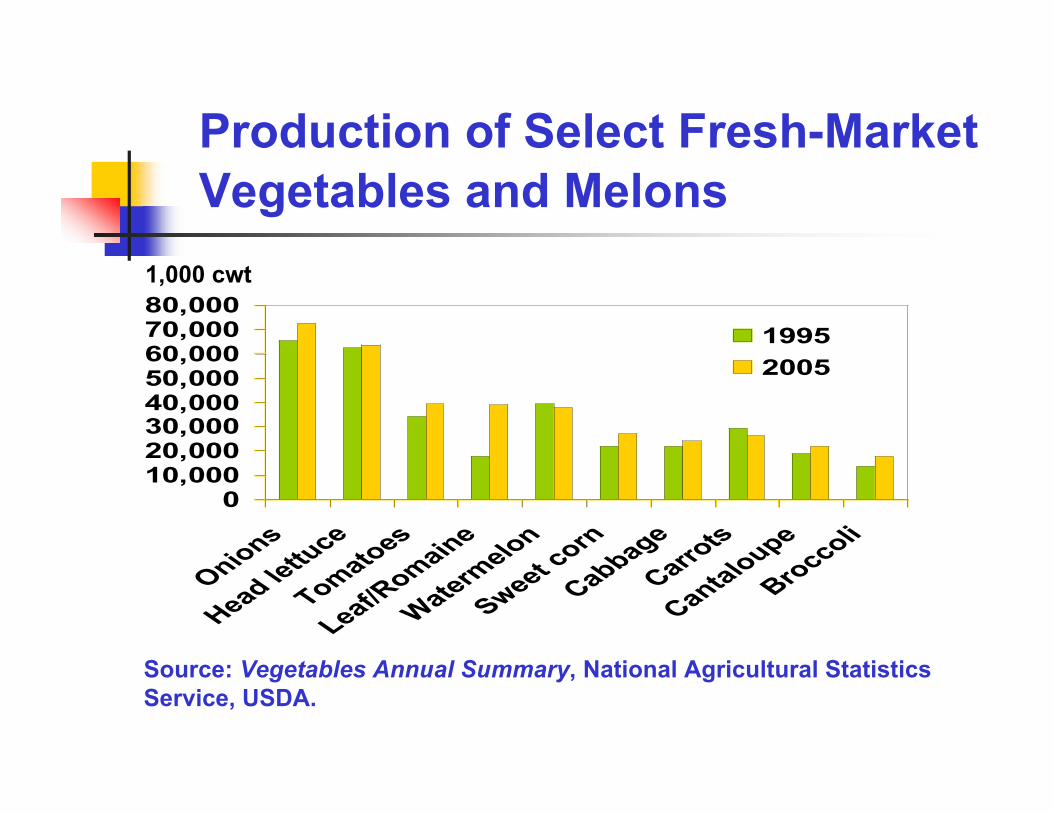
Production of Select Fresh-Market
Vegetables and Melons
010,00020,00030,00040,00050,00060,00070,00080,000
Onions
Head lettu
ce
Tomato
es
Leaf/Rom
aine
Wate
rmelo
n
Sweet corn
Cabbage
Carrots
Cantalo
upe
Broccoli
1995
2005
1,000 cwt
Source: Vegetables Annual Summary, National Agricultural StatisticsService, USDA.

Production of Select Processing
Vegetables
0
2,000
4,000
6,000
8,000
10,000
12,000
Tom
atoe
s
Sw
eet co
rn
Sna
p be
ans
Cuc
umbe
rs
Gre
en p
eas
Car
rots
1995
2005
1,000 short tons
Source: Vegetables Summary, National Agricultural StatisticsService, USDA.

Land Used for Vegetables, 2002
Source: Prepared by USDA, Economic Research Service using data fromUSDA, National Agricultural Statistics Service, 2002 Census of Agriculture.

Share of Hired Workers in U.S.
Vegetable and Melon Farms: Top 10
States*
26.3
11.4
6.4 5.0 4.0 3.9 3.8 3.7 3.4 3.0
0
5
10
15
20
25
30
35
40
Cal
iforn
ia
Florida
Was
hing
ton
Idah
o
Arizo
na
Mic
higa
n
Ore
gon
Geo
rgia
New
York
Col
orad
o
Percent
* Combined share accounted for 71 percent of total in 2002. Source: Calculated by USDA, Economic Research Service using data from 2002 Census of Agriculture, USDA, National Agricultural Statistics Service.

Hired Versus Contract Labor As A
Share of Wages in U.S. Vegetable and
Melon Farms*
0
20
40
60
80
100
120
Cal
iforn
ia
Florida
Ariz
ona
Was
hingto
n
Idah
o
Georg
ia
Ore
gon
New
York
Mic
higan
Colo
rado
Hired Contract
Percent
*Top 10 States accounted for 81 percent of total wages in 2002.Source: Calculated by USDA, Economic Research Service using data from2002 Census of Agriculture, USDA, National Agricultural StatisticsService.

U.S. Per Capita Fruit and Tree
Nuts Consumption*
Juice--42%
Fresh--35%
Wine--11%
Canned--6% Dried--3%
Frozen--2%Tree nuts--1%
*Average product share 2001-05.Source: Calculated by Economic Research Service, USDA.
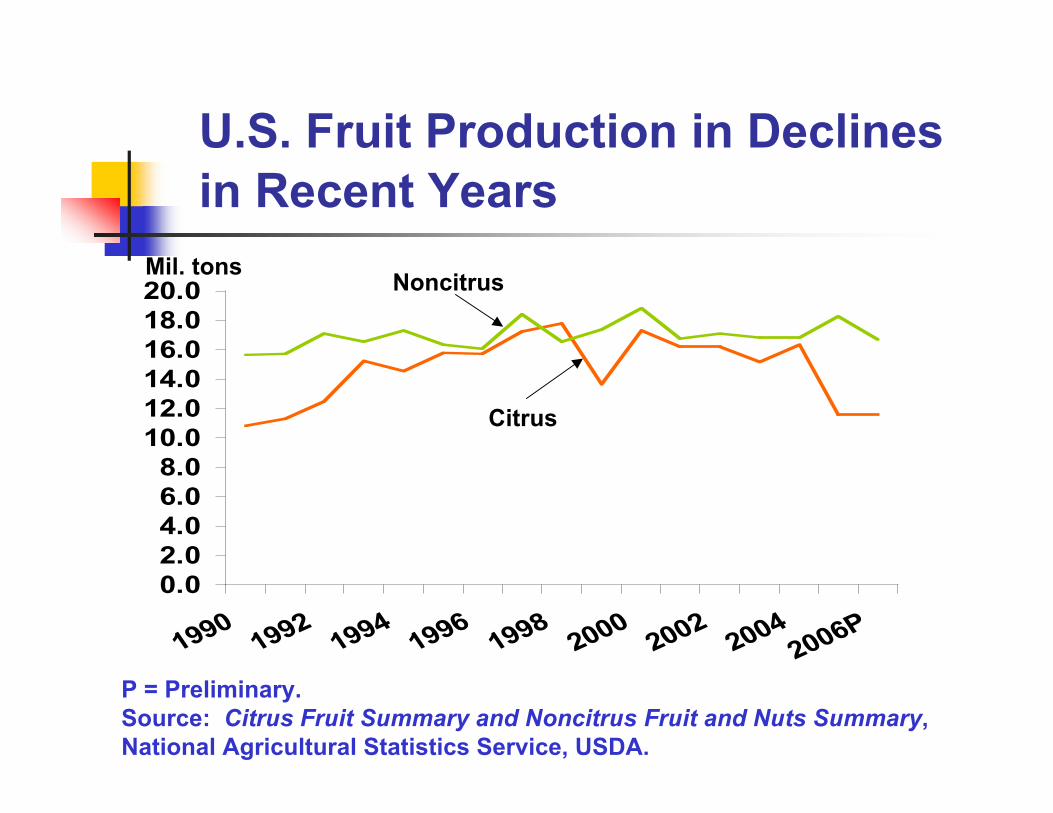
U.S. Fruit Production in Declines
in Recent Years
0.0
2.0
4.0
6.0
8.0
10.0
12.0
14.0
16.0
18.0
20.0
1990
1992
1994
1996
1998
2000
2002
2004
2006P
Mil. tonsNoncitrus
Citrus
P = Preliminary.Source: Citrus Fruit Summary and Noncitrus Fruit and Nuts Summary, National Agricultural Statistics Service, USDA.

Fruit and Tree Nuts Bearing
Acreage
0
500
1,000
1,500
2,000
2,500
19901992
19941996
19982000
20022004
2006 P
1,000 acres
Noncitrus
Citrus
Tree nuts
P = preliminary.Source: Citrus Fruits Summary and Noncitrus Fruits and Nuts Summary,National Agricultural Statistics Service, USDA.

Product Composition of U.S.
Noncitrus Fruit Production*
39%
25%
12%
9%
9% 4% 2%
Fresh Wine Dried Juice
Canned Frozen Other
* Based on 2005 utilized production of 18,299,000 short tons, fresh-equivalent.Source: Noncitrus Fruit and Nuts Summary, National Agricultural StatisticsService, USDA.

Composition of Major U.S.
Citrus Fruit Production
0 20 40 60 80 100
Lemons
Grapefruit
Oranges
Total citrus
Processed
Fresh
Percent
Source: Citrus Fruit Summary, National Agricultural Statistics Service, USDA.

U.S. Land in Orchards, 2002
Source: Prepared by USDA, Economic Research Service using data fromUSDA, National Agricultural Statistics Service, 2002 Census of Agriculture.

U.S. Berry Acres, 2002
Source: Prepared by USDA, Economic Research Service using data fromUSDA, National Agricultural Statistics Service, 2002 Census of Agriculture.
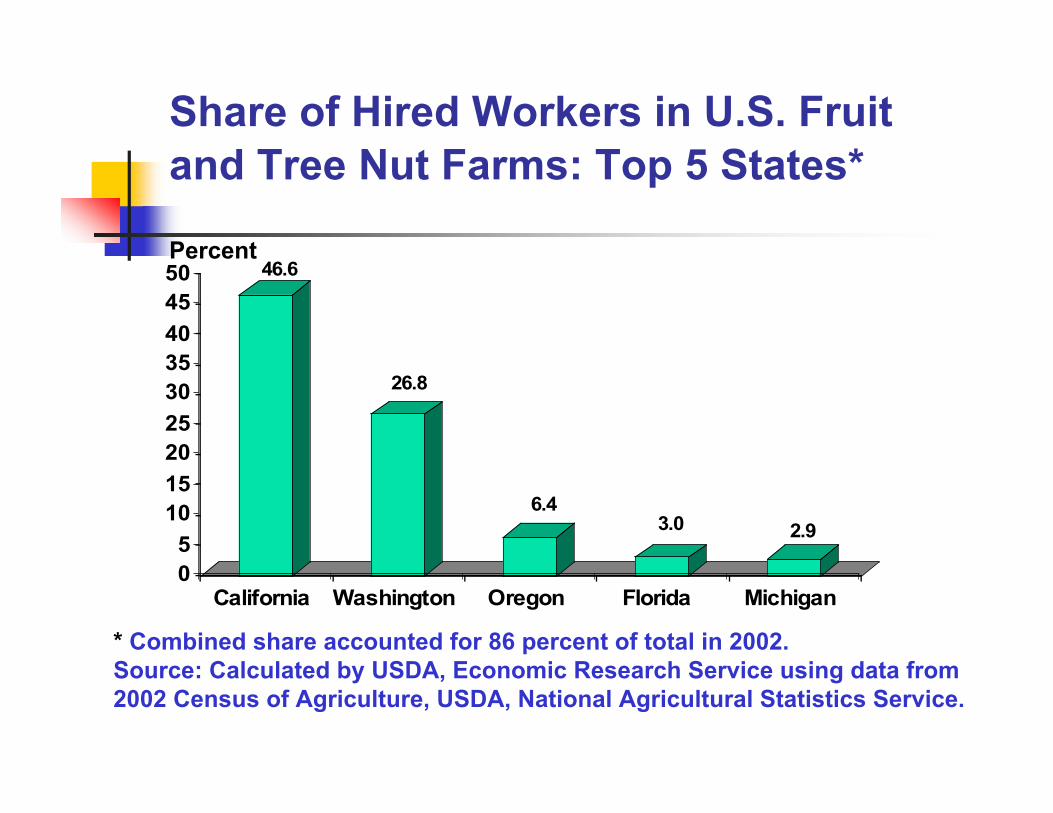
Share of Hired Workers in U.S. Fruit
and Tree Nut Farms: Top 5 States*
46.6
26.8
6.43.0 2.9
0
5
10
15
20
25
30
35
40
45
50
California Washington Oregon Florida Michigan
Percent
* Combined share accounted for 86 percent of total in 2002. Source: Calculated by USDA, Economic Research Service using data from 2002 Census of Agriculture, USDA, National Agricultural Statistics Service.

Hired Versus Contract Labor As A
Share of Wages in U.S. Fruit and Tree
Nut Farms*
0
10
20
30
40
50
60
70
80
90
100
California Washington Florida Oregon Hawaii
Hired Contract
Percent
*Top 5 States accounted for 89 percent of total wages in 2002. Source: Calculated by USDA, Economic Research Service using data from2002 Census of Agriculture, USDA, National Agricultural Statistics Service.

Change In Bearing Acreage of
Select U.S. Fruit and Tree Nuts
0100
200300400500
600700800
9001,000
Grapes
Oranges
Apples
Peaches
GrapefruitPears
Sweet cherrie
s
Strawberrie
s
Cranberries
Avocados*
Almonds
Walnuts
Pistachios
1996 2006P
1,000 acres
P = preliminary.* Most recent year is 2005.Source: Citrus Fruit Summary and Noncitrus Fruit and Nuts Summary,National Agricultural Statistics Service, USDA.
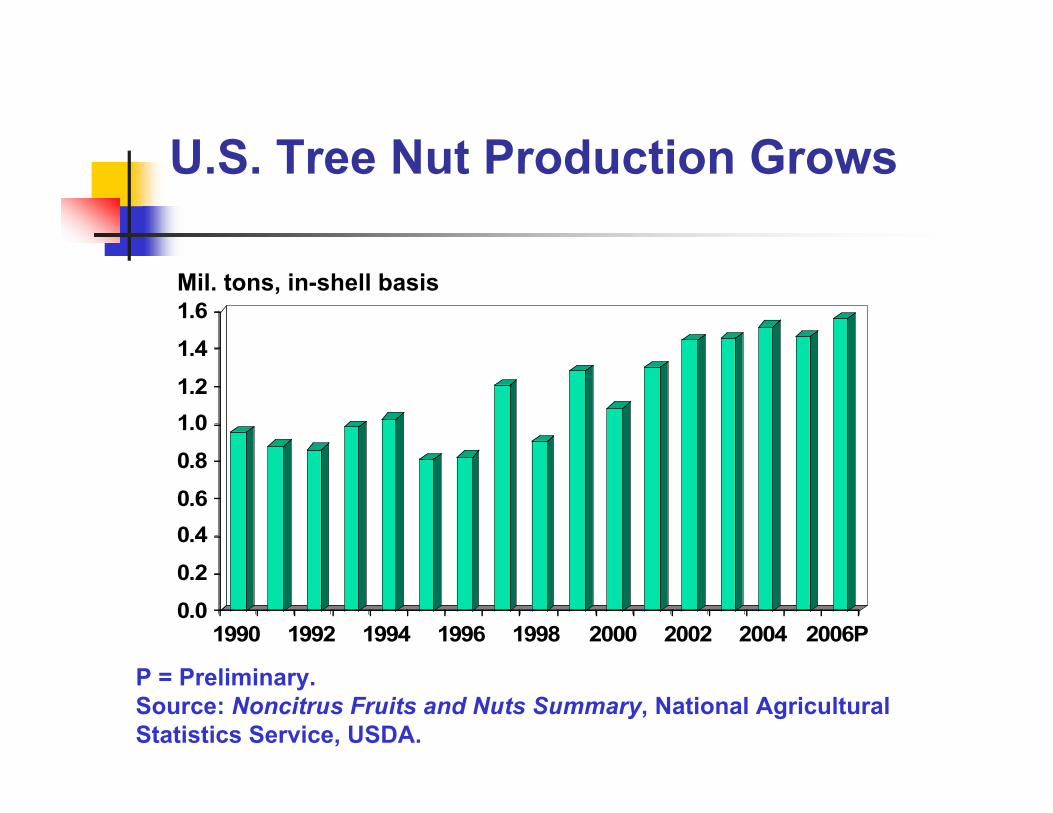
U.S. Tree Nut Production Grows
0.0
0.2
0.4
0.6
0.8
1.0
1.2
1.4
1.6
1990 1992 1994 1996 1998 2000 2002 2004 2006P
Mil. tons, in-shell basis
P = Preliminary.Source: Noncitrus Fruits and Nuts Summary, National Agricultural Statistics Service, USDA.

U.S. Strawberry Production*
0
500
1,000
1,500
2,000
2,500
1992 1994 1996 1998 2000 2002 2004 2006P
Million pounds
* Average rate of growth relatively steady at over 4.0 percent.
P=preliminary.Source: Noncitrus Fruit and Nuts Summary, NASS, USDA.

U.S. Production of Other Berries
Also Expanding
0
50
100
150
200
250
300
350
400
1992 1994 1996 1998 2000 2002 2004 2006P
Million pounds
Blueberries
Raspberries
Blackberries
Cranberries
*2.41.58.56.12000s
1.06.93.14.51990s
BlackberriesCranberriesRaspberriesBlueberriesPeriod
Average rate of increase in production (percent)
P=Preliminary.Source: Noncitrus Fruits and Nuts Summary, NASS, USDA.

U.S. Fruit and Vegetable Trade*
0
2,000
4,000
6,000
8,000
10,000
12,000
14,000
16,000
18,000
1990 1993 1996 1999 2002 2005
Imports Exports
Million dollars
*Excludes wine, essential oils, malt beverages, cut flowers, and nursery stock.Source: Prepared by USDA, Economic Research Service using data from U.S. Department of Commerce, U.S. Census Bureau.

Import share of total domestic fruit and
vegetable disappearance*
0
5
10
15
20
25
30
35
40
19901992
19941996
19982000
20022004
Fruit & tree nuts All vegetables
Percent
*Fresh and processing. Vegetables includes melons and fruit includes bananasand olives.Source: USDA, Economic Research Service.

Imports share of total domestic fresh
fruit and vegetable disappearance
0
5
10
15
20
25
30
35
40
45
50
1990 1992 1994 1996 1998 2000 2002 2004
Vegetables Fruit Fruit, without bananas
Percent
Source: USDA, Economic Research Service.
Top Related