


Languages
Pages
Legal


DEPARTMENT OF BIOLOGICAL AND ENVIRONMENTAL SCIENCES
Degree project for Master of Science (120 hec) with a major in Biology
BIO792 Degree course in Plant Ecology, 60 hec
Second cycle
Semester/year: Autumn/2016 – Spring/2017
Supervisor: Martin Lascoux, Department of Ecology and Genetics,
Uppsala University
Supervisor: Bernard Pfeil, Department of Biological and Environmental Sciences,
University of Gothenburg
Examiner: Marina Panova, Department of Marine Sciences,
University of Gothenburg
CHARACTERIZING THE GENETIC LOAD
IN CAPSELLA BURSA-PASTORIS
ACROSS ITS RANGE

Front page illustration: Origin of the Capsella bursa-pastoris samples analysed, coloured according to
the three genetically distinct clusters. Asia (ASI) = Green, Europe and Russia (EUR) = Red and Middle
East (ME) = Blue.
©Mimmi Eriksson

1
Table of Contents
Abstract ................................................................................................................................................... 2
Introduction ............................................................................................................................................. 3
Accumulation of deleterious mutations .............................................................................................. 3
Inbreeding depression ......................................................................................................................... 4
Characterisation of deleterious mutations ......................................................................................... 4
Study system and goal ......................................................................................................................... 6
Materials and methods ........................................................................................................................... 7
Genomic data ...................................................................................................................................... 7
Watterson's theta ................................................................................................................................ 7
SIFT characterising of deleterious mutations ...................................................................................... 7
Site frequency spectrum ..................................................................................................................... 9
The distribution of fitness effects ....................................................................................................... 9
Results ................................................................................................................................................... 10
SIFT characterising of deleterious mutations .................................................................................... 11
The distribution of fitness effects ..................................................................................................... 13
Discussion .............................................................................................................................................. 14
The C. bursa-pastoris subgenomes differ from their parental genomes .......................................... 14
Difference between the two subgenomes of the allotetraploid C. bursa-pastoris .......................... 15
Subpopulations of C. bursa-pastoris are different ............................................................................ 16
Beyond C. bursa-pastoris................................................................................................................... 17
Acknowledgements ............................................................................................................................... 18
References ............................................................................................................................................. 18

2
Abstract
In a fast changing world, where human activities disturb and change many habitats, species
being able to exploit these changed areas have an opportunity to rapidly expand their range.
During range expansion, the edge of a population may undergo repeated bottlenecks reducing
the genetic variation and the effective population size (Ne). Leading to a stronger effect of
genetic drift and thereby allowing deleterious alleles to accumulate. The accumulation of
deleterious alleles contributes to the genetic load, the fraction mean fitness diverges from a
theoretical optimum. The amount of genetic load can shape the future of a population’s ability
to adapt and survive in its environment. It is therefore crucial to understand how demography
and deleterious mutations interact across a population. Here, I used the allotetraploid Capsella
bursa-pastoris, with a known population structure and demographic history, to address if and
how genetic load varies across its range. Capsella. bursa-pastoris originated somewhere
between Europe and the Middle East and later spread to Asia. Additionally, I investigated
whether there is an effect of polyploidy. In particular, I tested whether one subgenome buffers
the other. Capsella bursa-pastoris is a great candidate to address these questions because it is
an allopolyploid with two distinct subgenomes and disomic inheritance. I used two separate
approaches to assess the genetic load. The first was to simply count the number of predicted
deleterious alleles in coding regions. The second approach was to estimate the distribution of
fitness effects (DFE) from sequence polymorphism data. In agreement with expectations, I
found that the subpopulation at the edge of the expansion front, in Asia, exhibited the highest
genetic load. However, in disagreement with the expectations, the European subpopulation
displayed the lowest genetic load. The main conclusion at this stage is that genetic load varies
across the range of this species, however, the variation could not be entirely explained by the
range-expansion hypothesis first assumed.
3
Introduction
The majority of mutations arising in populations are deleterious by nature and effect fitness
negatively, therefore contributing to the genetic load. The concept of genetic load was first
formulated by J. B. S. Haldane (Haldane 1937). James F. Crow built on Haldane’s ideas and
formulated genetic load in three separate ways, one being, as the reduction in mean fitness of a
population due to the presence of deleterious alleles compared to an ideal population free of
deleterious mutations (Crow 1970).
Changes in a species habitat, either directly induced by humans (such as deforestation) or
indirectly by the climate (such as drought), can force a species to expand its range in order to
survive. It has been shown that range expansion is generally accompanied by an increase in
genetic load (Peischl et al. 2013; Peischl et al. 2015). As a result of low genetic diversity and
genetic drift, the amount of genetic load can critically reduce the viability and adaptive potential
of a population (Lynch and Gabriel 1990; Lynch et al. 1995; Lohr and Haag 2015). It is
therefore of importance to understand the underlying dynamics behind the accumulation of
deleterious alleles, more specifically that due to range expansion.
Accumulation of deleterious mutations
A multitude of causes have been invoked in the literature to explain how the accumulation of
deleterious alleles contributes to genetic load. Firstly, all populations experience mutations
which are deleterious and will lead mean fitness to be less than what the optimal fitness
theoretically could be (Muller 1950). Secondly, in small populations, fixation of deleterious
alleles can occur at random through genetic drift (Crow 1970; Lynch et al. 1995; Whitlock
2000; Lohr and Haag 2015). Finally, expanding populations often undergo multiple
colonization events at the forefront of the expansion range causing repeated bottlenecks and
increasing the frequency of deleterious alleles (Hallatschek and Nelson 2010; Peischl et al.
2013; Peischl et al. 2015).
The mating system of a species also affects its genetic load, especially when comparing strictly
outcrossing species with highly self-fertilizing ones (Husband and Schemske 1996; Arunkumar
et al. 2015). In outcrossing species, deleterious alleles are maintained at low frequencies
because selection is efficient and they are mostly masked within heterozygotes. Selfing on the
other hand unmasks deleterious alleles by increasing homozygosity and strongly deleterious
alleles can be purged from the genome (Husband and Schemske 1996). However, selection is
4
less efficient in selfing species due to a reduction in the effective population size (Ne) and
thereby an increased effect of genetic drift (Charlesworth and Wright 2001). Because selection
is less effective weakly deleterious alleles behave as neutral or nearly neutral ones and can
therefore reach higher frequency and even go to fixation (Bataillon and Kirkpatrick 2000;
Charlesworth and Willis 2009).
A common phenomenon in plants is whole genome duplication (WGD), which is a duplication
of the genomes by either fusing unreduced gametes or doubling the genome of somatic tissue.
WGD can occur in two ways, either by allopolyploidy, meaning through hybridisation where
the progeny inherits the full set of one or both parental genomes or autopolyploidy where the
duplication happens within the same taxon. Little is known about the relationship between the
amount of deleterious alleles and ploidy level. By just going from a haploid genome to a diploid
genome the accumulation of deleterious alleles changes. In haploid genomes, deleterious alleles
will quickly be purged because they are always expressed and therefore will result in lower
fitness and be removed by natural selection (Mable and Otto 2001). On the other hand, in a
diploid genome, deleterious alleles will persist longer and at low frequencies in the genome due
to masking in heterozygotes.
Inbreeding depression
Populations with varying degrees of inbreeding will increase the proportion of homozygotes.
This increase in homozygous sites can in turn lead to inbreeding depression (i.e. the reduction
in fitness of inbred individuals compared to outbred ones). Two main processes leading to more
homozygous individuals having lower fitness, hence explaining inbreeding depression: (i)
overdominance or heterozygote advantage (i.e. the heterozygotes having a higher fitness than
either homozygotes) and (ii) partially recessive deleterious alleles.
Partially recessive deleterious alleles can create inbreeding depression by being expressed at a
higher rate. This increase in expression is due to the increased frequency of homozygous sites
and selection being less efficient in removing them. Overdominance will not be discussed
further since the focus here lies on deleterious mutations.
Characterisation of deleterious mutations
There are numerous ways to characterise deleterious alleles in a genome. A common method is
to estimate the distribution of fitness effects (DFE). The DFE is the distribution of the allelic
fitness effects, a gradient ranging from lethal, through neutral, to strongly beneficial. There are

5
different approaches to estimate the DFE: one method is based on mutation accumulation (MA)
experiments and has been used in model organisms with short generation time, including
Saccharomyces cerevisiae (Zeyl and DeVisser 2001; Joseph and Hall 2004) Caenorhabditis
elegans (Keightley and Caballero 1997; Vassilieva et al. 2000), Drosophila melanogaster
(García-Dorado et al. 1998; Loewe and Charlesworth 2006; Keightley and Eyre-Walker 2007)
and Arabidopsis thaliana (Schultz et al. 1999; Shaw et al. 2002). These experiments are limited
for practical and theoretical reasons. For example, not all organisms of interest are easy to
study over numerous generations due to long generation times—nor easy to keep in a constant
and benign environment to minimize the effects of selection. Additionally, only alleles that
have a high or moderate impact on fitness can be identified (Davies et al. 1999; Bataillon and
Bailey 2014). Therefore, much information is lost since the majority of mutations have a low
impact on fitness (Davies et al. 1999; Keightley and Eyre-Walker 1999; Boyko et al. 2008).
Alternative approaches to estimate the DFE are based on DNA sequence data and can be used
to get around the limits of MA experiments. A variety of models have been presented through
the years, a few that only estimate the DFE of deleterious alleles (Loewe and Charlesworth
2006; Eyre-Walker and Keightley 2009) and lately models that also consider both deleterious
and beneficial alleles (Keightley and Eyre-Walker 2007; Boyko et al. 2008; Gronau et al. 2013).
Many models build upon generating the site frequency spectrum (SFS) of both neutral alleles
and alleles under selection, fitting this spectrum to a model and finding the most likely
parameter values to represent the data. The DFE are typically modelled using a gamma
distribution, since it is flexible and can take different forms. Typically, the DFE is expected to
be L-shaped, meaning that most mutations have low or neutral effects on fitness and relatively
few have strong effects.
A complementary approach to DFE for characterising deleterious alleles is to assign the
mutation a prediction regarding the effect it might have on protein function. There are software
packages that do this, the most commonly used being PolyPhen2 (Polymorphism Phenotyping
v2) (Adzhubei et al. 2010), SIFT (Sorting Intolerant from Tolerant) (Kumar et al. 2009) and
PROVEAN (Protein Variation Effect Analyzer) (Choi et al. 2012). They all use different
approaches to make predictions. The SIFT algorithm uses alignments of orthologous genes to
calculate and assign a conservation score to mutations at each site—the rarer the mutation is at
a site, the more likely it is to be deleterious and to get a low score. Polyphen2 on the other hand
builds its predictions with a sequence and structure-based algorithm using a naïve Bayes
6
classifier. PROVEAN makes predictions based on a calculated PROVEAN score. The score is
inferred by aligning homologous sequences and calculating a sequence score before and after
the mutation is introduced. Software comparisons have shown that they produced equivalent
results (Flanagan et al. 2010; Choi et al. 2012; Renaut and Rieseberg 2015; Zhang et al. 2016).
Recently, SIFT4G (SIFT for Genomes) has been developed (Vaser et al. 2016). This is a faster
version of the original SIFT and will therefore be the software used here to predict the effect of
mutations on protein function.
Study system and goal
The self-fertilizing species Capsella bursa-pastoris is a suitable candidate to use as a study
system to tackle the questions on genetic load in an expanding and structured population and
effects of polyploidy. Firstly, C. bursa-pastoris has been shown to be an allopolyploid (Hurka
et al. 1989; Douglas et al. 2015; Roux and Pannell 2015) with strictly disomic inheritance
(Hurka et al. 1989), meaning that it is a hybrid with no recombination occurring between the
subgenomes. This gives the opportunity to treat and analyse the two subgenomes as two
separate diploid genomes while providing information about polyploidy.
Secondly, the parental species to C. bursa-pastoris are believed to be the ancestors of the
outcrossing C. grandiflora and the self-fertilizing C. orientalis (Douglas et al. 2015). The
different mating systems in the parental species in combination with C. bursa-pastoris being a
self-fertilizing species provides the possibility to investigate the genetic load from different
starting conditions.
Thirdly, C. bursa-pastoris has a wide distribution (Hurka and Neuffer 1997; Hurka et al. 2012)
and is genetically structured in at least three subpopulations (Cornille et al. 2016; Kryvokhyzha
et al. 2016): Asia (ASI), Middle East (ME) and finally Europe and Russia (EUR). Further,
Cornille et al. (2016) suggests that the origin of C. bursa-pastoris lies in the Middle East and
that there have been two main colonization events, the first colonization happened towards
Europe and the second in the direction of Asia. The recent spread of C. bursa-pastoris into
Europe and Asia will allow examination of the accumulation of deleterious alleles during range
expansion.
In order to address the issues of how polyploidy in combination with range expansion affect
genetic load, I characterized the genetic load in the three subpopulations of C. bursa-pastoris
by estimating the DFE and by using SIFT4G to characterize deleterious alleles.

7
Materials and methods
Genomic data
The data used for the analyses consisted of an alignment of 1.9 million single polymorphism
sites within coding regions across 31 C. bursa-pastoris, 10 C. orientalis and 13 C. grandiflora
samples. Whole genome DNA sequences for 10 C. bursa-pastoris accessions and all C.
orientalis and C. grandiflora samples were downloaded from GenBank (PRJNA268827,
PRJNA245911, PRJNA254516). The other 21 C. bursa-pastoris accessions were sequenced
using the same method as the downloaded C. bursa-pastoris accessions (100-bp paired-end
reads, Illumina HiSeq 2000 platform, SciLife, Stockholm, Sweden) (Kryvokhyzha et al.
unpublished). The DNA reads were mapped to the Capsella rubella reference genome (Slotte
et al. 2013) using Stampy v1.0.22 (Lunter and Goodson 2011), Picard Tools 1.115
(http://picard.sourceforge.net) was used to mark PCR duplicates which were ignored during
genotyping. HaplotypeCaller from the Genome Analysis Toolkit (GATK) v3.5 (McKenna et
al. 2010) was used for genotyping and HapCUT version 0.7 (Bansal and Bafna 2008) for
phasing each sample. The fragments HapCUT were joined into continuous sequences
descendant from either C. grandiflora or C. orientalis using custom scripts (Kryvokhyzha).
Reconstructed ancestral sequences were obtained by using the empirical Bayes joint
reconstruction method with PAML v4.6 (Yang 1997) on the tree assumed to best reflect the
true history of Capsella (Kryvokhyzha et al. unpublished).
Watterson's theta
Estimations of Watterson’s theta were obtained with Equation 1, where s is the number of
segregating sites in a sample of n sequences.
θ =
𝑠
1 +12 +
13 +⋯+
1𝑛 − 1
(1)
SIFT characterising of deleterious mutations
Two different approaches were used to assess the genetic load. First, I identified deleterious
mutations within each sample. A reference prediction file was made by classifying all variants
(A, T, G, C) for all sites within coding regions as tolerated or deleterious, hereafter referred to
8
as the SIFT annotation file. The classifications were made by the software SIFT4G using the
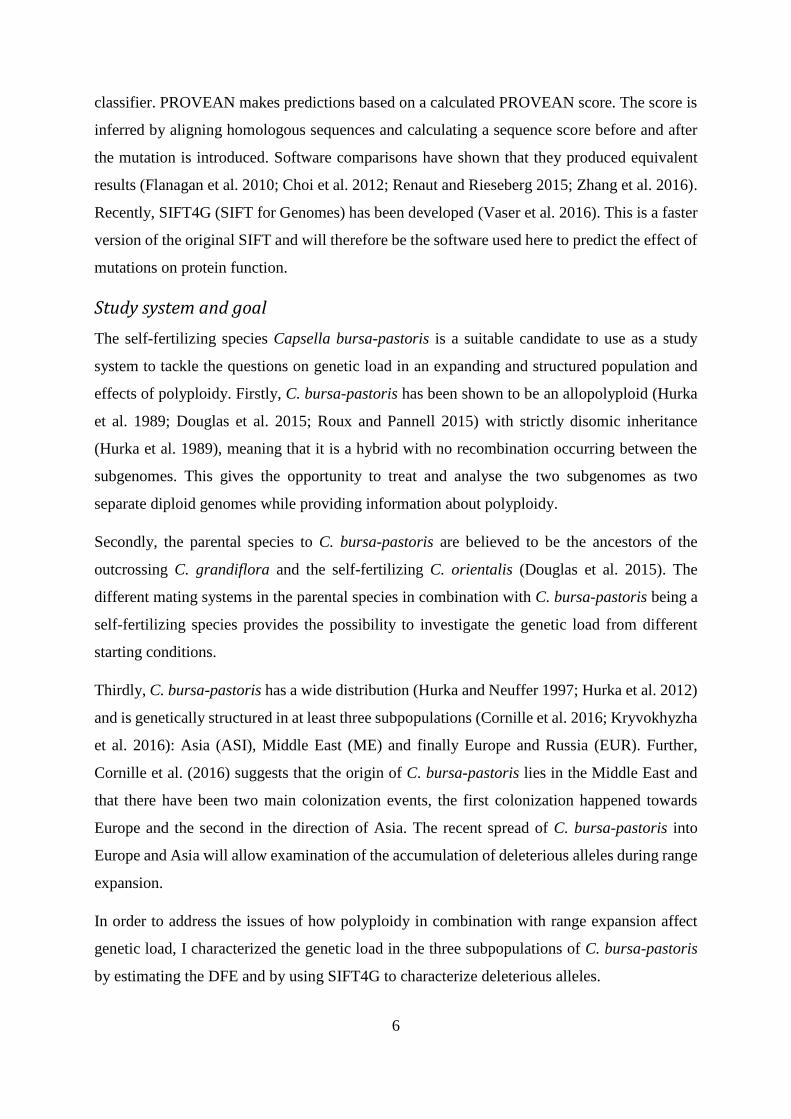
C. rubella database and mutations were polarized with three reference points (Figure 1).
Figure 1. Phylogenetic relationships of Capsella species. The three different reference points used
are marked A-C. A represents C. rubella. B represents the reconstructed ancestral sequence between
C. bursa-pastoris and C. grandiflora and C, the reconstructed ancestral sequence between C. bursa-
pastoris and C. orientalis.
Comparison between the subpopulations (ASI, EUR, ME), the subgenomes within C. bursa-
pastoris (CbpCg, CbpCo) and the parental species (C. grandiflora and C. orientalis) were made
by referencing all the SNP sites towards the SIFT4G annotation file and count variants predicted
to have a deleterious effect within each sample. This was done in four separate sets. The first,
to count all deleterious alleles within each sample. The second, to count all fixed deleterious
alleles in each subpopulation. The third, counting derived deleterious alleles in each sample by
using the reconstructed ancestral sequence (Figure 1B, Figure 1C) to polarize the alleles. Lastly,
the count of the number of fixed derived deleterious alleles in each subpopulation. Common to
all sets were that deleterious predictions with low confidence (SiFT4G annotation:
“*WARNING! Low confidence”) were ignored. However, including low confidence
predictions in the analysis did not change the outcome (Table A1, Figure A1 and Figure A2,
Appendix).
As the coverage level of the genome varied among individuals, I normalized the absolute
number of deleterious and fixed deleterious alleles by the total number of annotated sites.
Similarly, the derived deleterious and derived fixed deleterious alleles were normalized by the
total number of derived annotated sites.
9
To test whether subpopulations differed from one another a Kruskal-Wallis test and a Dunn’s
test were performed due to unequal variance among subpopulations. Each subgenome was
considered separately.
Site frequency spectrum
The site frequency spectrum (SFS) for derived mutations was constructed with the ancestral
references (Figure 1B, Figure 1C) to identify derived mutations and the SIFT4G annotation file
for classification. Each derived mutation was classified as either synonymous or
nonsynonymous, with the nonsynonymous mutations further divided into tolerated and
deleterious.
To estimate the total number of nonsynonymous and synonymous sites, a simplified method
that assumes the same mutations probability between all variants at a site was used.
Synonymous and nonsynonymous mutations were counted at all SIFT4G annotations where the
alternate allele did not equal the reference allele. The absolute numbers were then divided by 3
since three different mutations can occur at a site.
The distribution of fitness effects
The second approach used to assess the genetic load was to estimate the full distribution of
fitness effect (DFE) of mutation, based on the comparison of the synonymous and
nonsynonymous mutations SFS. Here, polyDFE was used since it can estimate the full DFE by
using polymorphism data alone (Tataru et al. 2016). Within the framework of polyDFE there
are four different models that can be used to describe the DFE. The first model (A) predicts
only deleterious alleles and uses a gamma distribution to describe their distribution. The second
(B) and third (C) models consider both deleterious and beneficial alleles. Both use a gamma
distribution to model deleterious alleles. For beneficial alleles, the second model (B) uses a
discrete distribution and the third model (C) uses an exponential distribution. The last model
(D) uses a discrete distribution and K number of selection coefficients (S1, S2,… SK) with
probabilities (p1, p2,… pK).
PolyDFE was run with the Broyden-Fletcher-Goldfarb-Shanno (bfgs) algorithm to estimate the
parameters that maximize the likelihood function. To start, all models (A, B, C, D) were run
for each data set. To be able to run the four models, the range within which the parameter values
can be estimated needs to be provided (Table A2, Appendix). Additionally, to run Model D the
number of selection coefficients to consider (K) is needed and K was set to 4. Further, Model
10
D also requires initial values for the parameters (Table A3, Appendix), each parameter value is
accompanied by a flag signalling whether the parameter value should be estimated (0) or be
kept fixed (1). Both the range values and initial parameter values were obtained from the
example files accompanying polyDFE. An additional run was performed using only model A
and fixing the maximum values the selection coefficient can take (Smax) to 0.
In choosing the model that best represents the data, the Akaike information criterion (AIC)
score was calculated and the model with the lowest score chosen. For data set where model A
had the lowest AIC score but a skewed distribution the values from the run with Smax set to 0
was used.
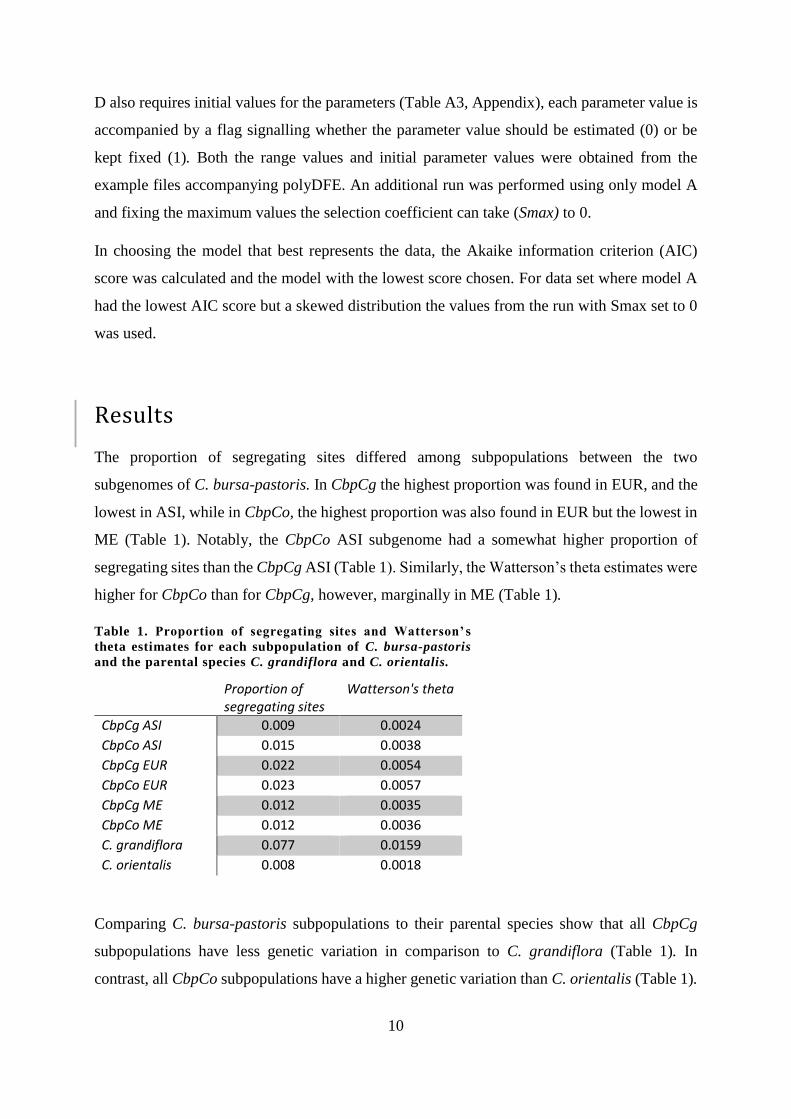
Results
The proportion of segregating sites differed among subpopulations between the two
subgenomes of C. bursa-pastoris. In CbpCg the highest proportion was found in EUR, and the
lowest in ASI, while in CbpCo, the highest proportion was also found in EUR but the lowest in
ME (Table 1). Notably, the CbpCo ASI subgenome had a somewhat higher proportion of
segregating sites than the CbpCg ASI (Table 1). Similarly, the Watterson’s theta estimates were
higher for CbpCo than for CbpCg, however, marginally in ME (Table 1).
Table 1. Proportion of segregating sites and Watterson’ s
theta estimates for each subpopulation of C. bursa-pastoris
and the parental species C. grandiflora and C. orientalis.
Proportion of segregating sites
Watterson's theta
CbpCg ASI 0.009 0.0024
CbpCo ASI 0.015 0.0038
CbpCg EUR 0.022 0.0054
CbpCo EUR 0.023 0.0057
CbpCg ME 0.012 0.0035
CbpCo ME 0.012 0.0036
C. grandiflora 0.077 0.0159
C. orientalis 0.008 0.0018
Comparing C. bursa-pastoris subpopulations to their parental species show that all CbpCg
subpopulations have less genetic variation in comparison to C. grandiflora (Table 1). In
contrast, all CbpCo subpopulations have a higher genetic variation than C. orientalis (Table 1).

11
SIFT characterising of deleterious mutations
By using SIFT4G to make predictions about the state of mutations (tolerated or deleterious) the
genetic load in the three subpopulations (ASI, EUR and ME) and the parental species (C.
grandiflora and C. orientalis) was estimated. The overall genetic load, meaning all deleterious
alleles, was significantly higher in CbpCg ASI than in CbpCg EUR (p-value 8.97E-06) (Figure
2A). Additionally, all three CbpCg subpopulations were significantly different from C.
grandiflora (p-values: ASI 1.13E-10, EUR 2.36E-04, ME 1.18E-04) (Figure 2A). Furthermore,
similarly as in the CbpCg subgenome, all three CbpCo subpopulations significantly differ from
their parental species C. orientalis (p-values: ASI 1.43E-04, EUR 3.44E-10, ME 8.76E-03)
(Figure 2A). The significantly different subpopulation in the CbpCo subgenome was EUR (p-
values: ASI 4.83E-02, ME 2.06E-02) showing the lowest genetic load, however, still higher
than the CbpCg counterpart (Figure 2A).
Figure 2. A comparison of the proportion of deleterious alleles between subgenomes of C. bursa-
pastoris and genomes of C. grandiflora and C. orientalis. (A) The proportion of deleterious alleles
within all samples. (B) Proportion of fixed deleterious alleles within each subpopulation and parental
species. Orange represents C. grandiflora and the C. bursa-pastoris Cg subgenome. The blue indicates
C. orientalis and the C. bursa-pastoris Co subgenome.
The pattern observed in the overall genetic load also hold true for the fixed number of
deleterious alleles. The CbpCg ASI subpopulation showed more fixed deleterious alleles than
12
either of the CbpCg EUR and CbpCg ME subpopulations. Similarly, CbpCo EUR displayed
the fewest fixed deleterious alleles out of the three CbpCo subpopulations (Figure 2B).
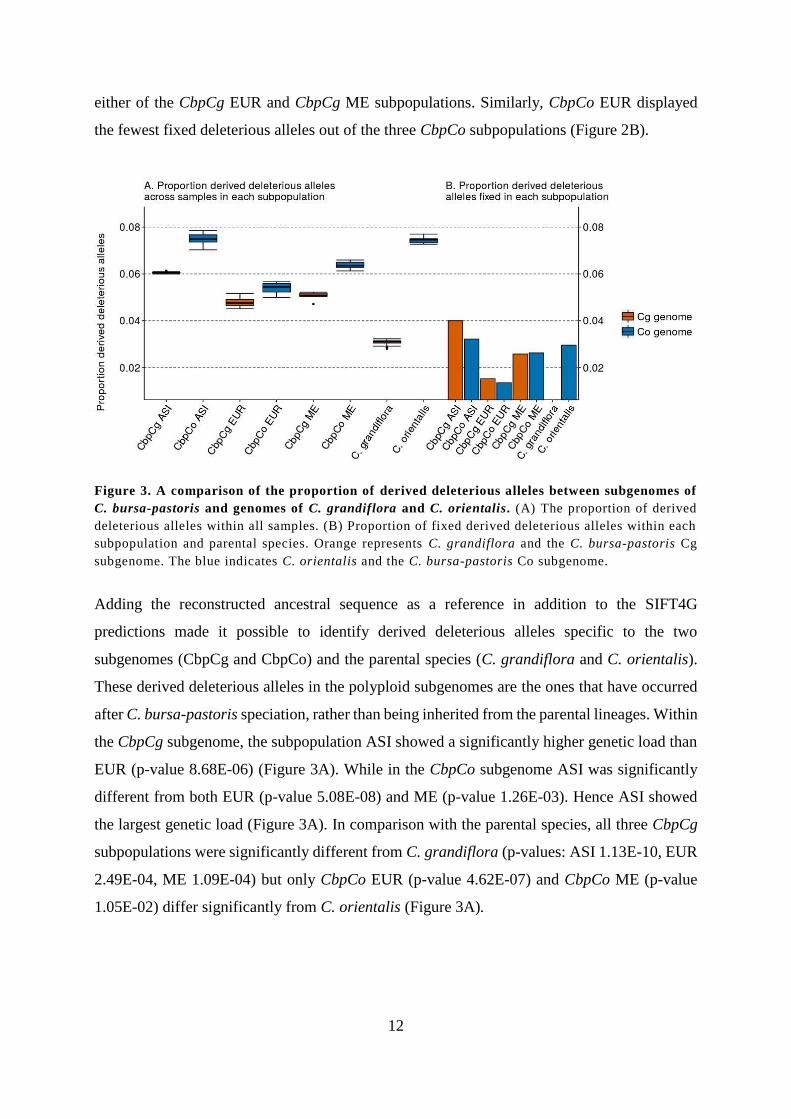
Figure 3. A comparison of the proportion of derived deleterious alleles between subgenomes of
C. bursa-pastoris and genomes of C. grandiflora and C. orientalis. (A) The proportion of derived
deleterious alleles within all samples. (B) Proportion of fixed derived deleterious alleles within each
subpopulation and parental species. Orange represents C. grandiflora and the C. bursa-pastoris Cg
subgenome. The blue indicates C. orientalis and the C. bursa-pastoris Co subgenome.
Adding the reconstructed ancestral sequence as a reference in addition to the SIFT4G
predictions made it possible to identify derived deleterious alleles specific to the two
subgenomes (CbpCg and CbpCo) and the parental species (C. grandiflora and C. orientalis).
These derived deleterious alleles in the polyploid subgenomes are the ones that have occurred
after C. bursa-pastoris speciation, rather than being inherited from the parental lineages. Within
the CbpCg subgenome, the subpopulation ASI showed a significantly higher genetic load than
EUR (p-value 8.68E-06) (Figure 3A). While in the CbpCo subgenome ASI was significantly
different from both EUR (p-value 5.08E-08) and ME (p-value 1.26E-03). Hence ASI showed
the largest genetic load (Figure 3A). In comparison with the parental species, all three CbpCg
subpopulations were significantly different from C. grandiflora (p-values: ASI 1.13E-10, EUR
2.49E-04, ME 1.09E-04) but only CbpCo EUR (p-value 4.62E-07) and CbpCo ME (p-value
1.05E-02) differ significantly from C. orientalis (Figure 3A).

13
Regarding the fixed derived deleterious mutations, there was barely any difference between the
two subgenomes in EUR nor ME (Figure 3B). On the other hand, in ASI the CbpCg subgenome
showed a higher genetic load than the CbpCo (Figure 3B).
The distribution of fitness effects
The result from polyDFE gave that model B (a full DFE) best explained the two non-
synonymous tolerated data sets in EUR. All other data sets were best explained by model A
(with only a deleterious distribution). To better compare the populations and because there was
just one population found to be best described by a full DFE model, the first model (A) was
used on all sets. Additionally, it may be a convergence issue in the software, because the result
with beneficial mutations appeared unrealistic.
Figure 4. An estimation of the proportions of non-synonymous tolerated (grey) and non-
synonymous deleterious (black) alleles occurring under varying selection coefficients (S). (A-C)
C. bursa-pastoris Cg subgenome and subpopulations. (D-F) C. bursa-pastoris Co subgenome and
subpopulations. S < 0 = deleterious, S = 0 = neutral and S > 0 = beneficial.

14
In the ASI subpopulation, most mutations are estimated to be strongly deleterious, followed by
nearly neutral and with the lowest proportion of intermediate effect alleles (Figure 4A and
Figure 4D). There are slightly less strongly deleterious and more nearly neutral in the CbpCo
subgenome in comparisons to CbpCg. Both of these two patterns are also observed in ME
(Figure 4C and Figure 4F). Continuing with the EUR subpopulation, most mutations are
estimated to be strongly deleterious and a similar proportion of mutations in the intermediate
and nearly neutral effects. Additionally, there is no striking difference between the two
subgenomes (Figure 4B and Figure 4E).
Discussion
By characterising the genetic load of the allotetraploid C. bursa-pastoris I aimed to investigate
a possible difference in the accumulation of deleterious alleles between the two subgenomes
(CbpCg and CbpCo) due to polyploidization. Further, I wanted to explore if there was an effect
of range expansion across its three subpopulations (ASI, EUR and ME).
The C. bursa-pastoris subgenomes differ from their parental genomes
Comparing the CbpCg subpopulations and C. grandiflora in the overall genetic load (Figure 2),
I found that all C. bursa-pastoris subpopulations have a higher load than C. grandiflora, both
regarding fixed and all deleterious alleles. This becomes even clearer when considering derived
deleterious alleles. There are barely any fixed alleles in C. grandiflora and notably more in all
subpopulations of CbpCg. This pattern, that CbpCg has a higher load than C. grandiflora,
agrees with estimates of genetic diversity (the proportion of segregating sites and Watterson’s
theta), given that C. grandiflora has a higher genetic diversity in comparison to CbpCg (Table
1). However, this is not surprising considering that C. grandiflora is an out-crosser, with a much
larger effective population size (Ne) than C. bursa-pastoris and is therefore more likely to keep
its genetic variation and less likely to fix deleterious alleles due to genetic drift. On the other
hand, C. bursa-pastoris is mainly a selfer and is therefore expected to experience a higher level
of genetic drift with deleterious alleles more likely to go to fixation.
Another notable observation concerns the subpopulations for CbpCo and C. orientalis. The
relationship here is almost reversed to the one between CbpCg and C. grandiflora. The
15
subpopulations have slightly less load than C. orientalis (Figure 3). This is most apparent when
considering fixed deleterious alleles (Figure 3B). Similarly, as with CbpCg and C. grandiflora,
the genetic diversity estimates correlates with the SIFT results. Capsella. orientalis displays the
highest genetic load and the lowest diversity.
One can only speculate as to why C. orientalis and CbpCo differ in this way. One explanation
could be a difference in population size. Capsella orientalis is a self-fertilising species that has
a much smaller range than C. bursa-pastoris (Hurka et al. 2012), both of which should
inevitably result in a smaller Ne, which in turn would affect the rate at which alleles go to
fixation. Additionally, keeping in mind the larger range of C. bursa-pastoris and its population
structure. Theory tells us that genetic diversity can decline in the subpopulations of a structured
population. Although, the genetic diversity in the population as a whole can still be somewhat
preserved. This is the result of different alleles getting lost due to genetic drift in the
subpopulations. However, the allele is still present in the population and can therefore be
restored in a subpopulation through gene flow.
Another source of the difference in genetic load between CbpCo and C. orientalis could be that
C. bursa-pastoris has reduced more of its genetic load than C. orientalis. One can only assume
that a single factor, such as purging deleterious alleles due to inbreeding, is not a sufficient
explanation as this is a factor present in both C. bursa-pastoris and C. orientalis.
One of the expectations is that the additional ploidy level would buffer the genetic load of the
Cbp subgenomes. Thus, polyploidy cannot be overlooked as a possible source. It has been
indicated that a neotetraploid can show an increase in mean fitness for generations due to
masking and a lower proportion of genome wide deleterious alleles, especially in comparison
to a diploid parental species (Otto and Whitton 2000). However, even if C. bursa-pastoris is a
relatively new species (100-300 kya (Douglas et al. 2015)) it might be that it has already passed
the window during which neopolyploids display a lower proportion of genome-wide deleterious
alleles. As I do not have estimates of the fitness it is hard to assess the likelihood of this
explanation but it seems plausible.
Difference between the two subgenomes of the allotetraploid C. bursa-pastoris
I also discovered that the genetic load differed between the two subgenomes of tetraploid C.
bursa-pastoris. The CbpCo subgenome displayed a higher proportion of deleterious alleles than
the CbpCg subgenome (Figure 2, Figure 3). This difference is likely partly reflecting the
16
difference between the loads inherited from the two different parental species. Capsella
orientalis provided a subgenome with a higher load and lower genetic diversity since the
genome had evolved under higher selfing regime. In contrast, C. grandiflora, as an outcrosser,
contributed a subgenome with a lower genetic load and higher genetic variation. Therefore, it
is apparent that the difference in mating system of the parental species has influenced the
amount of genetic load in the two subgenomes. However, considering the derived deleterious
alleles (mutations arisen in the two subgenomes after polyploidization) there is still a difference
when considering derived deleterious alleles within each sample (Figure 3A). This difference
between the derived deleterious alleles between CbpCg and CbpCo can possibly indicate that
one subgenome buffers the other, but further information is needed.
Subpopulations of C. bursa-pastoris are different
My analysis revealed that there were differences in genetic load between the different
subpopulations. The first expectation was that the amount of genetic load should increase along
the waves of range expansion. I therefore expected the load to be highest in the ASI
subpopulation and lowest in ME. Additionally, the polymorphism should decrease following
the expansion wave due to repeated bottlenecks and increased genetic drift. In this case ME
should be the most polymorphic and ASI the least.
The result found with SIFT does not follow these two hypotheses, therefore, range expansion
alone cannot explain the patterns of genetic load across the C. bursa-pastoris range. Firstly,
ME does not have the lowest genetic load. Actually, EUR has a significantly lower load than
both ME and ASI (Figure 2 and Figure 3). Secondly, EUR is the most polymorphic
subpopulation (Table 1) in both subgenomes followed by ME and then ASI in CbpCg and
reversed (ASI then ME) in CbpCo. This reversed relationship between the level of
polymorphisms between the subgenomes of ASI and ME can be explained by higher values in
the CbpCo ASI subpopulation due to introgression between CbpCo and C. orientalis
(Kryvokhyzha et al. unpublished).
A second expectation was to find a shift towards more deleterious alleles with nearly neutral
effects in the subpopulations with smaller Ne (however, the majority should still be deleterious
mutations with strong effects). There is a notable tendency towards this; there are more nearly
neutral mutations in ASI than in EUR and more in CbpCo than in CbpCg (Figure 4).
17
The most striking deviation from expectations is the low genetic load and higher genetic
diversity found in EUR rather than ME. Connecting the DFE result (where EUR is estimated
to have a higher occurrence of alleles with a strong deleterious effect) to the SIFT result (EUR
having a lower genetic load), suggest that selection is more efficient in EUR.
Reasons why EUR deviates from my expectations based one the range-expansion scenario
could be as follows. Firstly, purging deleterious alleles in this population could be more
effective than both ASI and ME. It has been suggested that purging occurs in two distinct ways:
by non-random mating and by genetic drift (both which are sensitive to population size), with
non-random mating expected to be more efficient (Glémin 2003). Bearing this in mind and that
EUR displays the larger Ne, one can hypothesise that genetic drift might acts as the principal
force in purging in ASI and ME due to smaller population sizes.
The second possibility for why EUR deviates from expectations is that the demographic
scenario assumed may be too simple and in need of refinement to better explain why Ne appears
lower in ME than in EUR. Similarly, as to the explanation for the reverse polymorphism in
CbpCo and CbpCg, signs of introgression have been found between CbpCg EUR and C. rubella
(Slotte et al. 2008; Kryvokhyzha et al. unpublished).
Further explanations for the deviation is that only alleles with nearly neutral effects adds to the
expansion load whereas strongly deleterious alleles do not (Peischl et al. 2013). Additionally,
simulations have indicated that range expansion with cyclic gene flow can effectively purge the
genetic load (Marchini et al. 2016). It is hard to say whether one of these explanations can
compensate for the deviation alone or whether the two can apply here.
Beyond C. bursa-pastoris
To summarise my findings, first I found that there was a difference in genetic load across the
range of C. bursa-pastoris and that it could not be explained solely by the simple range-
expansion scenario initially proposed or the available demographic model. This finding can be
applicable to all expanding species, whether they are invasive or species that are slowly
extending within an existing habitat.
In today’s world, it is becoming increasingly common for habitats to rapidly change due to
human activities. Species that can take advantage of this have an opportunity to expand their
range. For research in such species, it is therefore crucial to be aware of the genetic load,
especially since both fragmentation and habitat loss can lead to reduced Ne, thereby contributing

18
to the genetic load. The observation that genetic load varies across a population is therefore
something to consider when conducting experiments or population genetic related analyses,
whether it is to get a better understanding of evolutionary aspects or for conservation purposes.
My second finding was that there was a difference between the two subgenomes of the
polyploid species. The observed differences could possibly be a simple consequence of
polyploidization itself but part of the difference simply reflects the different mating systems of
the two parental species.
In summary, the current study illustrated well the interaction between genomic properties,
selection and demography in shaping standing genetic variation in a species.
Acknowledgements
First of all, I would like to thank the people behind SIFT4G and especially Nilesh R. Tawari
for quickly building and providing the C. rubella database. Secondly, I am grateful to my
supervisor Martin Lascoux at Uppsala University for this opportunity and for feedback and
support during the project. Further, I want to thank Dmytro Kryvokhyzha for providing the data
and for the help and feedback. Lastly, a thanks to Sylvain Glémin and my supervisor Bernard
Pfeil at University of Gothenburg for help and feedback.
References
Adzhubei, Ivan A., Steffen Schmidt, Leonid Peshkin, Vasily E. Ramensky, Anna Gerasimova, Peer
Bork, Alexey S. Kondrashov, and Shamil R. Sunyaev. 2010. 'A method and server for predicting
damaging missense mutations', Nature Methods, 7: 248-49.
Arunkumar, Ramesh, Rob W. Ness, Stephen I. Wright, and Spencer C. H. Barrett. 2015. 'The evolution
of selfing is accompanied by reduced efficacy of selection and purging of deleterious mutations',
Genetics, 199: 817-29.
Bansal, Vikas, and Vineet Bafna. 2008. 'HapCUT: an efficient and accurate algorithm for the haplotype
assembly problem', Bioinformatics, 24: i153-9.
Bataillon, Thomas, and Susan F. Bailey. 2014. 'Effects of new mutations on fitness: Insights from
models and data', Annals of the New York Academy of Sciences, 1320: 76-92.
Bataillon, Thomas, and Mark Kirkpatrick. 2000. 'Inbreeding depression due to mildly deleterious
mutations in finite populations: Size does matter', Genetical Research, 75: 75-81.
Boyko, Adam R., Scott H. Williamson, Amit R. Indap, Jeremiah D. Degenhardt, Ryan D. Hernandez,
Kirk E. Lohmueller, Mark D. Adams, Steffen Schmidt, John J. Sninsky, Shamil R. Sunyaev,
19
Thomas J. White, Rasmus Nielsen, Andrew G. Clark, and Carlos D. Bustamante. 2008.
'Assessing the evolutionary impact of amino acid mutations in the human genome', PLoS
Genetics, 4: e1000083-e83.
Charlesworth, Deborah, and John H. Willis. 2009. 'The genetics of inbreeding depression', Nature
Reviews Genetics, 10: 783-96.
Charlesworth, Deborah, and Stephen I. Wright. 2001. 'Breeding systems and genome evolution', Current
Opinion in Genetics and Development, 11: 685-90.
Choi, Yongwook, Gregory E. Sims, Sean Murphy, Jason R. Miller, and Agnes P. Chan. 2012. 'Predicting
the Functional Effect of Amino Acid Substitutions and Indels', PLoS ONE, 7: e46688.
Cornille, Amandine, Adriana Salcedo, Dmytro Kryvokhyzha, Sylvain Glémin, Karl Holm, Stephen I.
Wright, and Martin Lascoux. 2016. 'Genomic signature of successful colonization of Eurasia by
the allopolyploid shepherd's purse (Capsella bursa-pastoris)', Molecular Ecology, 25: 616-29.
Crow, James F. 1970. 'Genetic Loads and the Cost of Natural Selection.' in Ken-ichi Kojima (ed.),
Mathematical Topics in Population Genetics (Springer Berlin Heidelberg: Berlin, Heidelberg).
Davies, Esther K., Andrew D. Peters, and Peter D. Keightley. 1999. 'High frequency of cryptic
deleterious mutations in Caenorhabditis elegans', Science, 285: 1748-51.
Douglas, Gavin, Gesseca Gos, Kim Steige, Adriana Salcedo, Karl Holm, J. Arvid Ågren, Khaled M.
Hazzouri, Wei Wang, Adrian E. Platts, Emily B. Josephs, Robert J. Williamson, Barbara
Neuffer, Martin Lascoux, Tanja Slotte, and Stephen I. Wright. 2015. 'Hybrid origins and the
earliest stages of diploidization in the highly successful recent polyploid Capsella bursa-
pastoris', Proceedings of the National Academy of Sciences of the United States of America,
112: 2806-11.
Eyre-Walker, Adam, and Peter D. Keightley. 2009. 'Estimating the rate of adaptive molecular evolution
in the presence of slightly deleterious mutations and population size change', Molecular Biology
and Evolution, 26: 2097-108.
Flanagan, Sarah E., Ann-Marie Patch, and Sian Ellard. 2010. 'Using SIFT and PolyPhen to Predict Loss-
of-Function and Gain-of-Function Mutations', Genetic Testing and Molecular Biomarkers, 14:
533-37.
García-Dorado, Aurora, Juan L. Monedero, and Carlos López-Fanjul. 1998. 'The mutation rate and the
distribution of mutational effects of viability and fitness in Drosophila melanogaster', Genetica,
102: 255-65.
Glémin, Sylvain. 2003. 'How are deleterious mutations purged? Drift versus nonrandom mating',
Evolution, 57: 2678-87.
Gronau, Ilan, Leonardo Arbiza, Jaaved Mohammed, and Adam Siepel. 2013. 'Inference of Natural
Selection from Interspersed Genomic Elements Based on Polymorphism and Divergence',
Molecular Biology and Evolution, 30: 1159-71.
Haldane, John B. S. 1937. 'The Effect of Variation on Fitness', American Naturalist, 71: 337-49.
Hallatschek, Oskar, and David R. Nelson. 2010. 'Life at the front of an expanding population', Evolution,
64: 193-206.
Hurka, Herbert, Stephanie Freundner, Anthony H. D. Brown, and Ursula Plantholt. 1989. 'Aspartate
aminotransferase isozymes in the genusCapsella (Brassicaceae): Subcellular location, gene
duplication, and polymorphism', Biochemical Genetics, 27: 77-90.
Hurka, Herbert, Nikolai Friesen, Dmitry A. German, Andreas Franzke, and Barbara Neuffer. 2012.
''Missing link' species Capsella orientalis and Capsella thracica elucidate evolution of model
plant genus Capsella (Brassicaceae)', Molecular Ecology, 21: 1223-38.

20
Hurka, Herbert, and Barbara Neuffer. 1997. 'Evolutionary processes in the genus Capsella
(Brassicaceae)', Plant Systematics and Evolution, 206: 295-316.
Husband, Brian C., and Douglas W. Schemske. 1996. 'Evolution of the Magnitude and Timing of
Inbreeding Depression in Plants', Evolution, 50: 54-70.
Joseph, Sarah B., and David W. Hall. 2004. 'Spontaneous Mutations in Diploid Saccharomyces
cerevisiae', Genetics, 168: 1817.
Keightley, Peter D., and Armando Caballero. 1997. 'Genomic mutation rates for lifetime reproductive
output and lifespan in Caenorhabditis elegans', Proceedings of the National Academy of
Sciences of the United States of America, 94: 3823-27.
Keightley, Peter D., and Adam Eyre-Walker. 1999. 'Terumi Mukai and the Riddle of Deleterious
Mutation Rates', Genetics, 153: 515-23.
Keightley, Peter D., and Adam Eyre-Walker. 2007. 'Joint Inference of the Distribution of Fitness Effects
of Deleterious Mutations and Population Demography Based on Nucleotide Polymorphism
Frequencies', Genetics, 177.
Kryvokhyzha, Dmytro. 'evodify/genotype-files-manipulations '. https://github.com/evodify/genotype-
files-manipulations.
Kryvokhyzha, Dmytro, Karl Holm, Jun Chen, Amandine Cornille, Sylvain Glémin, Stephen I. Wright,
Ulf Lagercrantz, and Martin Lascoux. 2016. 'The influence of population structure on gene
expression and flowering time variation in the ubiquitous weed Capsella bursa-pastoris
(Brassicaceae)', Molecular Ecology, 25: 1106-21.
Kryvokhyzha, Dmytro, Adriana Salcedo, Mimmi Eriksson, Nilesh R. Tawari, Jun Chen, Ulf
Lagercrantz, Sylvain Glémin, Stephen I. Wright, and Martin Lascoux. unpublished. 'Population
genomics of a recent ubiquitous allopolyploid species, Capsella bursa-pastoris (Brassicaceae).'.
Kumar, Prateek, Steven Henikoff, and Pauline C. Ng. 2009. 'Predicting the effects of coding non-
synonymous variants on protein function using the SIFT algorithm', Nature protocols, 4: 1073-
81.
Loewe, Laurence, and Brian Charlesworth. 2006. 'Inferring the distribution of mutational effects on
fitness in Drosophila', Biology Letters, 2: 426.
Lohr, Jennifer N., and Christoph R. Haag. 2015. 'Genetic load, inbreeding depression, and hybrid vigor
covary with population size: An empirical evaluation of theoretical predictions', Evolution, 69:
3109-22.
Lunter, Gerton, and Martin Goodson. 2011. 'Stampy: A statistical algorithm for sensitive and fast
mapping of Illumina sequence reads', Genome Research, 21: 936-39.
Lynch, Michael, John Conery, and Reinhard Burger. 1995. 'Mutation Accumulation and the Extinction
of Small Populations', American Naturalist, 146: 489-518.
Lynch, Michael, and Wilfried Gabriel. 1990. 'Mutation load and the survival of small populations',
Evolution, 44: 1725-37.
Mable, Barbara K., and Sarah P. Otto. 2001. 'Masking and purging mutations following EMS treatment
in haploid, diploid and tetraploid yeast (Saccharomyces cerevisiae)', Genetical Research, 77: 9-
26.
Marchini, Gina L., Nena Cole Sherlock, Alisa P. Ramakrishnan, David M. Rosenthal, and Mitchell B.
Cruzan. 2016. 'Rapid purging of genetic load in a metapopulation and consequences for range
expansion in an invasive plant', Biological Invasions, 18: 183-96.
McKenna, Aaron, Matthew Hanna, Eric Banks, Andrey Sivachenko, Kristian Cibulskis, Andrew
Kernytsky, Kiran Garimella, David Altshuler, Stacey Gabriel, Mark Daly, and Mark A.

21
DePristo. 2010. 'The genome analysis toolkit: A MapReduce framework for analyzing next-
generation DNA sequencing data', Genome Research, 20: 1297-303.
Muller, Hermann J. 1950. 'Our load of mutations', American journal of human genetics, 2: 111-76.
Otto, Sarah P., and Jeannette Whitton. 2000. "Polyploid incidence and evolution." In Annual Review of
Genetics, 401-37.
Peischl, Stephan, Isabelle Dupanloup, Mark Kirkpatrick, and Laurent Excoffier. 2013. 'On the
accumulation of deleterious mutations during range expansions', Molecular Ecology, 22: 5972-
82.
Peischl, Stephan, Mark Kirkpatrick, and Laurent Excoffier. 2015. 'Expansion Load and the Evolutionary
Dynamics of a Species Range', American Naturalist, 185: E81-E93.
Renaut, Sebastien, and Loren H. Rieseberg. 2015. 'The Accumulation of Deleterious Mutations as a
Consequence of Domestication and Improvement in Sunflowers and Other Compositae Crops',
Molecular Biology and Evolution, 32: 2273-83.
Roux, Camille, and John R. Pannell. 2015. 'Inferring the mode of origin of polyploid species from next-
generation sequence data', Molecular Ecology, 24: 1047-59.
Schultz, Stewart T., Michael Lynch, and John H. Willis. 1999. 'Spontaneous deleterious mutation in
Arabidopsis thaliana', Proceedings of the National Academy of Sciences of the United States of
America, 96: 11393-98.
Shaw, Frank H., Charles J. Geyer, and Ruth G. Shaw. 2002. 'A Comprehensive Model of Mutations
Affecting Fitness and Inferences for Arabidopsis thaliana', Evolution, 56: 453-63.
Slotte, T., H. Huang, M. Lascoux, and A. Ceplitis. 2008. 'Polyploid speciation did not confer instant
reproductive isolation in Capsella (Brassicaceae)', Molecular Biology and Evolution, 25: 1472-
81.
Slotte, Tanja, Khaled M. Hazzouri, J. Arvid Ågren, Daniel Koenig, Florian Maumus, Ya-Long Guo,
Kim Steige, Adrian E. Platts, Juan S. Escobar, L. Killian Newman, Wei Wang, Terezie
Mandáková, Emilio Vello, Lisa M. Smith, Stefan R. Henz, Joshua G. Steffen, Shohei Takuno,
Yaniv Brandvain, Graham Coop, Peter Andolfatto, Tina T. Hu, Mathieu Blanchette, Richard
M. Clark, Hadi Quesneville, Magnus Nordborg, Brandon S. Gaut, Martin A. Lysak, Jerry
Jenkins, Jane Grimwood, Jarrod Chapman, Simon Prochnik, Shengqiang Shu, Daniel Rokhsar,
Jeremy Schmutz, Detlef Weigel, and Stephen I. Wright. 2013. 'The Capsella rubella genome
and the genomic consequences of rapid mating system evolution', Nature genetics, 45: 831-5.
Tataru, Paula, Maéva Mollion, Sylvain Glemin, and Thomas Bataillon. 2016. 'Inference of distribution
of fitness effects and proportion of adaptive substitutions from polymorphism data', bioRxiv.
Vaser, Robert, Swarnaseetha Adusumalli, Sim Ngak Leng, Mile Sikic, and Pauline C. Ng. 2016. 'SIFT
missense predictions for genomes', Nature protocols, 11: 1-9.
Vassilieva, Larissa L., Aaron M. Hook, and Michael Lynch. 2000. 'The Fitness Effects of Spontaneous
Mutations in Caenorhabdits elegans', Evolution, 54: 1234-46.
Whitlock, Michael C. 2000. 'Fixation of New Alleles and the Extinction of Small Populations: Drift
Load, Beneficial Alleles, and Sexual Selection', Evolution, 54: 1855-61.
Yang, Ziheng. 1997. 'PAML: A program package for phylogenetic analysis by maximum likelihood',
Computer Applications in the Biosciences, 13: 555-56.
Zeyl, Clifford, and J. Arjan G. M. DeVisser. 2001. 'Estimates of the rate and distribution of fitness
effects of spontaneous mutation in Saccharomyces cerevisiae', Genetics, 157: 53-61.
Zhang, Man, Lecong Zhou, Rajesh Bawa, Haktan Suren, and Jason A. Holliday. 2016. 'Recombination
Rate Variation, Hitchhiking, and Demographic History Shape Deleterious Load in Poplar',
Molecular Biology and Evolution, 33: 2899-910.
Appendix
22
Appendix I, Tabel and plots comparing SIFT4G result with and without low confidence
predictions for deleterious alleles.
Table A1. P-values from the group comparison made by Dunn’s test for including and excluding
low confidence deleterious alleles. Black values are below 0.05.
All deleterious Derived deleterious
Groups tested excluding including excluding including
CbpCg_ASI - CbpCg_EUR 8,97E-03 7,85E-03 8,68E-03 6,40E-03
CbpCg_ASI - CbpCg_ME 1,60E-01 1,82E-01 1,65E-01 2,19E-01
CbpCg_EUR - CbpCg_ME 4,05E-01 3,44E-01 3,89E-01 2,65E-01
CbpCg_ASI - Cg 1,13E-10 1,13E-10 1,13E-10 1,13E-10
CbpCg_EUR - Cg 2,36E-04 2,92E-04 2,49E-04 3,99E-04
CbpCg_ME - Cg 1,18E-04 8,45E-05 1,09E-04 5,07E-05
CbpCo_ASI - CbpCo_EUR 4,83E-02 3,40E-02 5,08E-08 3,79E-05
CbpCo_ASI - CbpCo_ME 5,68E-01 6,82E-01 1,26E-03 3,58E-02
CbpCo_EUR - CbpCo_ME 2,06E-02 2,29E-02 1,51E-01 1,51E-01
CbpCo_ASI - Co 1,43E-04 2,67E-04 2,45E-01 2,78E-01
CbpCo_EUR - Co 3,44E-10 3,43E-10 4,62E-07 4,06E-09
CbpCo_ME - Co 8,76E-03 7,72E-03 1,05E-02 1,20E-03
Figure A1. A comparison of the proportion of deleterious alleles when excluding (A) or including
(B) low confidence deleterious alleles. Orange represents C. grandiflora and the C. bursa-pastoris
Cg subgenome. The blue indicates C. orientalis and the C. bursa-pastoris Co subgenome.

Appendix
23
Figure A2. A comparison of the proportion of derived deleterious alleles when excluding (A) or
including (B) low confidence deleterious alleles. Orange represents C. grandiflora and the C. bursa-
pastoris Cg subgenome. The blue indicates C. orientalis and the C. bursa-pastoris Co subgenome.
Appendix
24
Appendix II, Tables with range and initial values provided in order to run polyDFE.
Table A2. Parameters estimated in the different polyDFE models and the values of the range to
estimate the parameters within.
Parameter Range Description
k 0.01 Value that controls the transformation of the range each parameter
should be estimated within.
eps an 0 0.1 Ancestral miss identification error in the SFS under selection
lambda 0 1 Accounts for the number of neutral mutations that goes to fixation during
divergence
theta bar 0 1 Scaled mutation rate per site per generation
r 0 10 The density of the gamma distribution in model A and B.
The density of the Exponential distribution in model C
beta 0 10 Shape of the gamma distribution
S bar -200 0 Specific to model A, mean of the DFE
S max 0 100 Specific to model A, the maximum value S can take
Sd 0 0.5 Specific to model B and C, mean of the DFE for S < 0
pb 0 50 Specific to model B and C, probability that S > 0
Sb 0 1 Specific to model B and C, shared selection coefficient of all positively
selected mutations
Table A3. Parameter values and flags provided in the init file for model D, polyDFE. The flags
represent, estimate parameter value (0) or that the parameter is kept fixed (1).
Parameter Flag Value Parameter Flag Value
eps an 0 0.02 S2 0 -10
eps cont 1 0.00 p2 - 0.35
lambda 0 0.005 S3 0 0
theta bar 0 0.003 p3 - 0.1
a 1 -1 S4 0 3
S1 0 -50 p4 - 0.05
p1 - 0.5 r 0 1 1 1 1 1 1 1 1
Top Related