


Languages
Pages
Legal

Characterizing Frothers by Their Bubble Size Control Properties
F ariba Azgomi
Department of Mining, Metals and Materials Engineering
McGill University
Montreal, Canada
April 2006
A thesis submitted to the Office of Graduate Studies and Research
in partial fulfillment of the requirements for the degree of Master
of Engineering
© Fariba Azgomi, 2006

1+1 Library and Archives Canada
Bibliothèque et Archives Canada
Published Heritage Branch
Direction du Patrimoine de l'édition
395 Wellington Street Ottawa ON K1A ON4 Canada
395, rue Wellington Ottawa ON K1A ON4 Canada
NOTICE: The author has granted a nonexclusive license allowing Library and Archives Canada to reproduce, publish, archive, preserve, conserve, communicate to the public by telecommunication or on the Internet, loan, distribute and sell th es es worldwide, for commercial or noncommercial purposes, in microform, paper, electronic and/or any other formats.
The author retains copyright ownership and moral rights in this thesis. Neither the thesis nor substantial extracts from it may be printed or otherwise reproduced without the author's permission.
ln compliance with the Canadian Privacy Act some supporting forms may have been removed from this thesis.
While these forms may be included in the document page count, their removal does not represent any loss of content from the thesis.
• •• Canada
AVIS:
Your file Votre référence ISBN: 978-0-494-24939-0 Our file Notre référence ISBN: 978-0-494-24939-0
L'auteur a accordé une licence non exclusive permettant à la Bibliothèque et Archives Canada de reproduire, publier, archiver, sauvegarder, conserver, transmettre au public par télécommunication ou par l'Internet, prêter, distribuer et vendre des thèses partout dans le monde, à des fins commerciales ou autres, sur support microforme, papier, électronique et/ou autres formats.
L'auteur conserve la propriété du droit d'auteur et des droits moraux qui protège cette thèse. Ni la thèse ni des extraits substantiels de celle-ci ne doivent être imprimés ou autrement reproduits sans son autorisation.
Conformément à la loi canadienne sur la protection de la vie privée, quelques formulaires secondaires ont été enlevés de cette thèse.
Bien que ces formulaires aient inclus dans la pagination, il n'y aura aucun contenu manquant.

In the name ofGod
To my parents and my dear husband
Abstract
Frothers are surface-active agents used in flotation to decrease bubble size and promote
froth stability. The common frothers are alcohols and polyglycols. One me ans to dassify
frothers is by the extent of bubble size reduction. Bubble size measurement is labour
intensive and this thesis explores the use of gas holdup as a surrogate for bubble size.
Nine frothers with different chemical structures were tested in a bubble column equipped
with instrumentation to measure bubble size and gas holdup. A correlation between
frother structure and gas holdup is observed: for alcohols, gas holdup increases with
hydrocarbon chain length and whether branched or straight chain does not seem to
matter; and for polyglycols, gas holdup increases with number of propoxy groups. The
ranking of the frother on the basis of gas holdup is the same as that given by other
methods. The assumed unique re1ationship between gas holdup and bubble size is
examined. For a given frother the re1ationship appears to hold. Evidence is presented that
the continued increase in gas holdup at high frother concentration is correlated with a
continued decrease in bubble size. When comparing frothers, however, it is shown that
for equal gas holdup bubble size can be quite different. The effect is discussed in terms of
bubble ve10city in the swarm.
1
Résumé
Les moussants sont des agents tension-actifs utilisés en flottation afin de diminuer la
taille des bulles et promouvoir la stabilité de l'écume. Les moussants communs sont des
alcools ou des polyglycols. Une façon de classifier les moussants est par l'étendue de la
réduction de la taille des bulles. La mesure de la taille des bulles est une tâche laborieuse
et cette thèse explore l'utilisation de la teneur gazeuse comme alternative à la taille des
bulles.
Neufmoussants ayant des structures chimiques différentes furent testés dans une colonne
à bulles équipée pour les mesures de la taille des bulles et de la teneur gazeuse. Une
correlation entre la structure du moussant et la teneur gazeuse est observée: pour les
alcools, la teneur gazeuse augmente avec la longueur de la chaîne d'hydrocarbures qu'elle
soit branchée ou non; et pour les polyglycols, la teneur gazeuse augmente avec le nombre
de groupements d'oxide de propylene. Cet ordre des moussants selon leur teneur gazeuse
est le même que celui observé par d'autres méthodes. La présumée relation unique entre
la teneur gazeuse et la taille des bulles est examinée. Pour un moussant donné, la relation
semble tenir. Il est prouvé que l'augmentation continue de la teneur gazeuse à des
concentrations de moussant élevées est corrélée avec la diminution continue de la taille
des bulles. En comparant les moussants, cependant, il est démontré que pour une teneur
gazeuse égale la taille des bulles peut être très différente. L'effet est discuté en termes de
la vitesse d'une population de bulles.
II

Contribution of Authors This thesis was prepared in accordance with article C of the Guidelines Conceming
Thesis Preparation of Mc Gill University. The foUowing are manuscripts written by the
author that were used in preparation of this thesis. Manuscripts 1 and 2 make up
Chapters 5 and 6, respectively.
1. Fariba Azgomi, Cesar O. Gomez and James A. Finch, "Characterizing Frothers using Gas Holdup", to be submitted.
2. Fariba Azgomi, Cesar O. Gomez and James A. Finch, "Correspondence of Gas Holdup and Bubble Size in Presence of Different Frothers", to be submitted.
AU of the manuscripts presented above are co-authored by Prof. James A. Finch in his
capacity as research supervisor. Dr. Cesar O. Gomez (Senior Research Associate in the
Department of Mining, Metals and Materials Engineering, Mc Gill University) is included
as co-author recognizing his contribution in co-supervising the research. Beyond the
contributions of the co-authors, the author performed aU of the work presented in this
dissertation.
III

Acknowledgements
l wish to express my sincerest appreciation and utmost gratitude to my supervisor, Prof.
James A. Finch for his guidance, continuous encouragement, and valuable technical
assistance and discussions. l particularly appreciate the relationship that has been
established between us along the course of my study, and that will enrich my memories
aU my life.
l would also like to express my heartfelt thanks to Dr Cesar O. Gomez where his
contribution proved priceless to the work presented in this thesis.
Gratitude and recognition go to Dr. Mitra Mimezami for being a friend and a sounding
board for problems and ideas.
Thanks must also go to the Jim Finch group members (old and new) for providing
support and encouragement during the smooth and rough rides of my work. You made
my time at McGill worthwhile and l leamed a lot from an of you, especially to Dr. Luis
Calzardo and Mr. Claudio Acuna, for valuable suggestions and fruitful discussion. l
would also like to thank Dr. Stéphanie Gélinas for help in translating the abstract of this
the sis into French.
l would also like to acknowledge financial support of the Natural Sciences and
Engineering Research Council of Canada (NSERC) under the NSERC CoUaborative
Research and Development program sponsored by Inco, Fa1conbridge, Noranda, Teck
Cominco, COREM and SGS Lakefield Research.
My parents, have been a source of inspiration aU throughout my life and the true reason
behind my achievements. They taught me the importance of a strong education and have
always encouraged me to pursue my education to the highest levels. For that, l am
etemaUy grateful.
IV

Last, but not the least, 1 could never express adequately through written words the thanks
1 owe to my husband, Sina. He has had to make many sacrifices during the past two years
in order to support me in the work 1 have been doing. 1 am certain that had it not been for
his encouragement at aH times and continuous support, 1 would never have accompli shed
my goals.
v
Table of Contents:
CHAPTER 1: INTRODUCTION ....................................................................................... 5
1.1: GENERAL BACKGROUND ......................................................................... " ................. 5 1.2: FROTHERS .............................................................................................. " .................. 7 1.3: OBJECTIVES OF THESIS .............................................................................................. 8 1.4: STRUCTURE OF THESIS .............................................................................................. 8 1.5: REFERENCES ............................................................................................................. 9
CHAPTER 2: LITERATURE REVIEW .......................................................................... Il
2.1: GAS DISPERSION ..................................................................................................... Il 2.1.1: Superjicial Gas Velocity .................................................................................. 11 2.1.2: Bubble Size ..................................................................................................... 12
2.1.2.1: Effect of Superficial Gas Velocity on Bubble size .................................. 12 2.1.2.2: Effect of Frothers on Bubble Size ............................................................ l3
2.1.3: Gas Holdup .............................................................. ....................................... 15 2.1.3.1: Effect of Superficial Gas Velocity on Gas Holdup .................................. 15 2.1.3.2: Effect of Liquid Phase Properties on Gas Holdup ................................... 16 2.1.3.3: Effect of Solid Particles on Gas Holdup .................................................. 18
2.1. 4: Surface Area Flux .... ....................................................................................... 19 2.2: FROTHERS ............................................................................................................... 19
2.2.2: General Specifications of Frothers ................................................................. 22 2.2.3: Frother Chemistry and Classification ............................................................ 23
2.2.3.1: Alcohols ................................................................................................... 23 2.2.3.2: Polyglycols ............................................................................................... 23
2.3: REFERENCES ........................................................................................................... 25
CHAPTER 3: FROTHER CHARACTERIZATION TECHNIQUES .............................. 31
3.1: DYNAMIC AND STATIC FOAM TESTS ....................................................................... 31 3.1.1: Dynamic Tests ................................................................ ................................. 31 3.1.2: Static Tests ................................................. ..................................................... 35
3.2: BUBBLE SIZE PROPERTIES ....................................................................................... 36 3.3: WATER CARRYING RATE ........................................................................................ 38 3.4: REFERENCES ........................................................................................................... 39
CHAPTER 4: EXPERIMENTAL PROCEDURES .......................................................... 42
4.1: BUBBLE COLUMN ..................................................................................................... 42 4.1.1: Basic Apparatus ........................................................... ................................... 42 4.1.2: Modified Apparatus ........................................................................................ 43
4.2: MEASUREMENTS ..................................................................................................... 44 4.2.1: Gas Holdup ........................................................ ............................................. 44 4.2.2: Bubble Size ...................................................................................................... 44 4.2.3: Disengagement Technique ................................................. ............................. 46
4.3: FROTHER TyPES ...................................................................................................... 46
1
4.4: REFERENCES ........................................................................................................... 47
CHAPTER 5: CHARACTERIZING FROTHERS USING GAS HOLDUP ................... 48
5.1: ABSTRACT ............................................................................................................... 48 5.2: INTRODUCTION ....................................................................................................... 48 5.3: EXPERIMENTAL ....................................................................................... " ............... 50
5.3.1: Apparatus ............................................. ...................................................... ..... 50 5.3.2: Frother Types ................................................................................................. 51 5.3.3: Gas Dispersion Parameters ............................................ ................................ 51
5.4: RESULTS AND DISCUSSION ....................................................................... , ............... 53 5.4.1: Reproducibility ............................................................................................... 53 5.4.2: Selecting Test Conditions ............................................................................... 54 5.4.3: Frother Classification .......................................... ........................................... 55 5.4.4: Some Features of the Gas Holdup - Frother Concentration Relationship .... 59
5.5: CONCLUSIONS ......................................................................................................... 60 5.6: ACKNOWLEDGMENTS .............................................................................. ' ................ 60 5.7: REFERENCES ........................................................................................................... 61
CHAPTER 6: CORRESPONDENCE OF GAS HOLDUP AND BUBBLE SIZE IN
PRESENCE OF DIFFERENT FROTHERS .................................................................... 63
6.1: ABSTRACT ............................................................................................................... 63 6.2: INTRODUCTION ....................................................................................................... 63 6.3: EXPERIMENTAL ....................................................................................................... 64
6.3.1: Apparatus ........................................................................................................ 64 6.3.2: Bubble Size ..................................................................................................... 65 6.3.3: Disengagement Technique ............................................. ................. , ............... 67 6.3.4: Comparison of sldbfor the Frother Types .................................................... 67
6.4: RESULTS AND DISCUSSION ...................................................................................... 68 6.4.1: Reproducibility ............................................................................................... 68 6.4.2: Comparing Basic and Modified Set-ups ............................................... .......... 69 6.4.3: The Low and High Frother Concentration Regions ...................................... 71 6.4.4: Bubble Size Measurement at Equal Gas Holdup ............................................ 76
6.5: CONCLUSIONS ......................................................................................................... 78 6.6: ACKNOWLEDGMENTS .............................................................................................. 79 6.7: REFERENCES ........................................................................................................... 79
CHAPTER 7: CONCLUSIONS AND RECOMMENDATIONS .................................... 81
7.1: CONCLUSIONS ......................................................................................................... 81 7.2: FUTURE WORK ........................................................................................................ 81
APPENDIX A: CHARACTERIZA TI ON OF A SET OF POROUS STAINLESS STEEL
PLATE SPARGERS ......................................................................................................... 83
A.l: DEFINITIONS ........................................................................................................... 83 A.2: CHARACTERIZATION OF POROUS MEDIUM ............................................................. 83
2
A.3: EXPERIMENTAL ...................................................................................................... 85 A.4: SAMPLE CALCULATIONS ........................................................................................ 86 A.5: REFERENCES .......................................................................................................... 89
APPENDIX B: CALIBRATION CURVES ..................................................................... 90
B.1: MASS FLOWMETER ................................................................................................ 90 B.2: PRESSURE TRANSDUCER ........................................................................................ 91
List of Figures:
Figure 1.1 : Schematic of flotation column, from "Column Flotation"l ............................ 6 Figure 2.1 : Cell Characterization: Sauter mean bubble size as a function of gas rate (after
N esset et al. 13) ........................................................................................................... 13 Figure 2.2 : Effect frother (Dowfroth 250) concentration on bubble size, from "Column
Flotation", Finch and Dobby7 •••••••••••••••••••••••••••••••••••••••••••••••••••••••••••••••••••••••.••••••.•••• 14 Figure 2.3 : Flow regime for bubble column .................................................................... 16 Figure 2.4 : Effect of frother dosage on gas holdup and gas rate from "Column Flotation",
Finch and Dobby7 ••••••••••••••••••••••••••••••••••••••••••••••••••••••••••••••••••••••••••••••••••••••••••••••••••••• 17 Figure 2.5 : Typical structure and orientation (MIBC) after adsorption at bubble surface
................................................................................................................................... 20 Figure 2.6 : A bubble surface with a bound water layer ................................................... 21 Figure 3.1 : Relationship between the concentration at which the Sauter mean bubble
diameter is reduced to 0.6 times that in water and DFI (adapted from Sweet et al.8)
................................................................................................................................... 34 Figure 3.2 : The effect offrother type on dynamic surface pressure for an equilibrium
surface pressure of 8 dyne/cm-I 9 •.•.•.•.•...•............•......•...••.•..•.•.....•............•....•..•.••••. 35
Figure 3.3 : Sauter mean bubble diameter as a function offrother type and bulk concentration (after Sweet et al. 8) ............................................................................. 37
Figure 3.4 : Relationship between CCC and DFI values for a series ofpolyoxpropylene alkyl ethers (adapted from Laskowski et al. l8
) ......................................................... 38 Figure 3.5 : Schematic ofbubble carrying water .............................................................. 38 Figure 3.6: Classification offrothers based on water carrying rate24
•••••••••••••••••••••••••••••• 39 Figure 4.1 : Experimental set-up: (a) basic; and (b) modified .......................................... 43 Figure 4.2 : Mc Gill bubble viewer4
.•.•.•.•.•.•.•.....•.•........•.........•....•.....•.••••••...•.•......•.•..•....• 45 Figure 5.1 : Experimental set-up ....................................................................................... 51 Figure 5.2 : Gas holdup as a function offrother concentration: effect of gas rate ........... 55 Figure 5.3 : Gas holdup as a function of frother concentration: effect of sparger porosity
................................................................................................................................... 55 Figure 5.4 : Gas holdup as a function offrother concentration: comparison ofalcohols. 56 Figure 5.5 : Gas holdup as a function offrother concentration: comparison ofpolyglycols
................................................................................................................................... 57 Figure 5.6: Gas holdup as a function offrother concentration: comparison ofall frothers
tested ......................................................................................................................... 58 Figure 5.7 : Gas holdup as a function of cost: practical comparison of all frothers tested59 Figure 6.1 : Experimental set-up: (a) basic; and (b) modified .......................................... 65
3

Figure 6.2 : McGill bubble viewer3 .......•...............•....••.•••••••••...•....•.•.•.•••.••••••••.••.........•••• 66
Figure 6.3 : The Eg - Jg relationship for modified and basic set-up .................................. 70 Figure 6.4 : Comparing images for basic (a) and modified (b) set-up .............................. 70 Figure 6.5 : Gas holdup and bubble size vs. frother concentration (MIBC) ..................... 71 Figure 6.6: Bubble images and corresponding mean diameters as a function ofMIBC
concentration ............................................................................................................. 73 Figure 6.7 : Disengagement test: bubble size as a function oftime after gas is shut off .. 75 Figure 6.8 : Disengagement time as a function of frother concentration .......................... 76 Figure 6.9 : Bubble size measurements at equal gas holdup for different frothers: Eg = 6%
................................................................................................................................... 77 Figure 6.10 : Bubble size measurements at equal gas holdup for different frothers: Eg =
8% ............................................................................................................................. 77
List of Tables:
Table 2.1 : Classification of flotation frothers .................................................................. 24 Table 4.1 : Summary offrother properties, suppliers and cost.. ....................................... 47 Table 5.1 : Summary of frother properties, suppliers and cost.. ....................................... 52 Table 5.2 : The reproducibility test results ....................................................................... 53 Table 5.3 : Summary offrother rankings .......................................................................... 58 Table 6.1 : Summary of frother properties and suppliers ................................................. 68 Table 6.2 : The reproducibility test results ....................................................................... 68 Table 6.3 : Various bubble size measurements and estimation from drift flux model ..... 74
4

Chapter 1: Introduction
1.1: General Background
Mineral processing, otherwise known as mineraI dressing, is the practice of cencentrating
valuable mineraIs from ore. The process involves two principal operations: comminution
or size reduction to liberate mineraIs, followed by separation of vaIuabie mineraIs from
the valueless mineraIs or gangue.
Comminution is the "feed preparation" step, readying the mineraIs for separation. By size
reduction partic1es are produced comprising a range in composition from free mineraI
(vaIuabie and gangue) to the range of Iocked (mixed mineraI) particle types. At a given
Ievei (degree) of Iiberation - mass fraction of mineraI in free particle form - the mineraIs
can be separated economically. Flotation, magnetic, and gravity methods are the major
separation processes. Flotation is the most widely used. Flotation or froth flotation is a
surface chemistry - based process to separate fine solids (typically < 200 ~m), taking
advantage of differences in the wettability of mineraIs. In operation, gas (typically air)
bubbles are dispersed into a vessel (cell) containing solid particles suspended in an
aqueous medium (i.e., forming a pulp or siurry). By addition of chemicai reagents known
as collectors, selected mineraIs are made hydrophobic and they adhere to the bubbles.
The bubble-particle aggregates rise and form a froth phase, which is removed to recover
the mineraIs. One type of a flotation ceIl or machine, a flotation column, is shown in
Figure 1.1 1•
5

Wash Water
Feed 0 o
Column Diameter
o 0 o 0
o 0 o 0
o 0 o
T Froth Zone
Hf
L
Concentrate
Gas
Collection Zone He
Tailings
Figure 1.1: Schematic of flotation column, (adapted from Finch and Dobbyl)
Bubbles are generated by various means: passing air through a rotating impeller in the
case of mechanical machines, various porous and jetting spargers in the case of flotation
columns, and aspiration into a plunging slurry jet in the case of Jameson œlls. Bubble
size is an important variable in flotation, for example controlling the surface area over
which solid particles and bubbles interact and contributing to system hydrodynamics,
which affect process performance2• To be efficient, it is essential to pro duce a high
population of small bubbles (0.5 - 2.5 mm, typically). Production of small bubbles is
generaHy promoted by the addition of a surfactant called a frother, which acts to prevent
bubble coalescence. This aspect offrother function is the subject ofthis thesis.
6
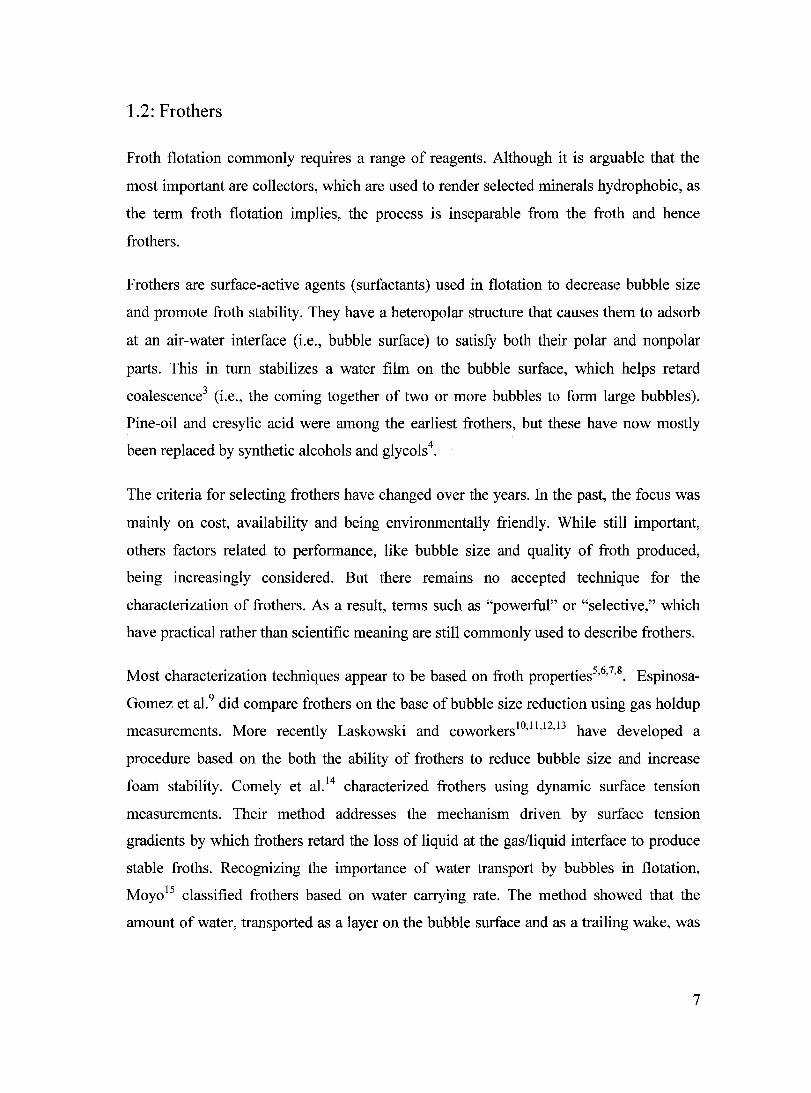
1.2: Frothers
Froth flotation commonly requires a range of reagents. Although it is arguable that the
most important are collectors, which are used to render selected mineraIs hydrophobic, as
the term froth flotation implies, the process is inseparable from the froth and hence
frothers.
Frothers are surface-active agents (surfactants) used in flotation to decrease bubble size
and promote froth stability. They have a heteropolar structure that causes them to adsorb
at an air-water interface (i.e., bubble surface) to satisfy both their polar and nonpolar
parts. This in tum stabilizes a water film on the bubble surface, which helps retard
coalescence3 (i.e., the coming together of two or more bubbles to form large bubbles).
Pine-oil and cresylic acid were among the earliest frothers, but these have: now mostly
been replaced by synthetic alcohols and glycols4.
The criteria for selecting frothers have changed over the years. In the past, the focus was
mainly on cost, availability and being environmentally friendly. While still important,
others factors related to performance, like bubble size and quality of froth produced,
being increasingly considered. But there remains no accepted technique for the
characterization of frothers. As a result, terms such as "powerful" or "selective," which
have practical rather than scientific meaning are still commonly used to describe frothers.
Most characterization techniques appear to be based on froth properties5,6,7,8. Espinosa
Gomez et a1.9 did compare frothers on the base ofbubble size reduction using gas holdup
measurements. More recently Laskowski and coworkers10,1l,12,13 have developed a
procedure based on the both the ability of frothers to reduce bubble size and increase
foam stability. Comely et al. 14 characterized frothers using dynamic surface tension
measurements. Their method addresses the mechanism driven by smface tension
gradients by which frothers retard the loss of liquid at the gas/liquid interface to produce
stable froths. Recognizing the importance of water transport by bubbles in flotation,
Moyo15 classified frothers based on water carrying rate. The method showed that the
amount of water, transported as a layer on the bubble surface and as a trailing wake, was
7

related to gas holdup and frother type. Finch et al. 16 showed that film thickness on bubble
was dependent on frother type which offers another characterization possibility.
Even though these techniques have provided valuable insights into the role of frothers in
flotation, what continues to be lacking is a full understanding of the mechanism(s) by
which frothers act, and building from this, how to achieve the desired frother functions,
bubble size reduction and froth stability.
This thesis examines primarily bubble size reduction. When bubble size decreases (e.g.,
with an increase in frother concentration) bubble rise velocity decreases and thus bubble
retention time increases, which is reflected by an increase in gas holdup17. Gas holdup,
therefore can be a surrogate for bubble size measurement and has the advantages of being
simpler to measure and can be adapted to be continuous and on-line.
1.3: Objectives ofThesis
The overall objective of this Master' s thesis is to develop a procedure to characterize
frothers by their bubble size control properties as reflected in gas holdup. The specific
research objectives are characterization of frothers using gas holdup as a surrogate for
bubble size measurement; validation of a common daim that bubble coalescence is
entirely prevented at frother concentrations exceeding the critical coalescence
concentration (CCC)18; and testing the assumption that gas holdup, at a given gas rate, is
uniquely dependent on bubble size regardless of frother type.
1.4: Structure of thesis
The thesis consists of the seven Chapters. Sorne are in the style of a manuscript for
publication so inevitably sorne repetition with other chapters occurs.
Chapter 1 gives the general overview of flotation and frothers and introduces the
objectives ofthis Master's work.
Chapters 2 and 3 are a review of so-called gas dispersion parameters, frother ehemistry
and, with specifie emphasis, frother characterization techniques.
8

In Chapter 4, experimental procedures and measurement techniques are outlined.
Chapters 5 and 6 are presented as manuscripts. Chapter 5, Characterizing Frothers
Using Gas Holdup by Azgomi F., Gomez C.O. and Finch lA. explores a possible way
to characterize (classify) frothers using gas holdup as a surrogate for bubble Slze
measurement and represents a correlation between frother type and gas holdup.
Chapter 6, Correspondence of Gas Holdup and Hubble Size in Presence of Different
Frothers by Azgomi F., Gomez C.O. and Finch J.A. investigates the effect of frother
type on gas holdup and bubble size. It is shown that at equal gas holdup and gas rate,
different frothers do not give the same bubble size.
Finally, Chapter 7 presents conclusions drawn from the work and explores further
research possibilities.
1.5: References
1 Finch J.A., Dobby G.S., "Column Flotation", Pergamon Press, New York, 1990.
2 Cooper M., Scott D., Dahlke R., Finch J.A. and Gomez C.O., "Impact of Air Distribution Profile on Banks in a Zn Cleaning Circuit", Proceedings 36th Annual Meeting of the Canadian Mineral Processors of CIM, January 20-22, 2004: 525-540.
3 Harris P.J., "Frothing Phenomena and Frothers", in Principles of Frothers, Edited by R.P. King, Chapter 13, 1982: 237-250.
4 American Cyanamid Company, "Mining Chemicals Handbook", USA, 1986.
5 Bikerman lJ., "The Unit of Foaminess", Transaction of the Faraday Society, 34, 1938: 634-638.
6 Sun S.-C., "Frothing Characteristics of Pine Oils in Flotation", Transaction of the American Institution of Mining and Metal/urgy Engineering (AIME), 256, 1952: 65-71.
7 McLaughlin J.D., Quinn P., Robertson G. and Agar G.E., "Frother Evaluation", 18th
International Mineral Processing Congress, Sydney, Australia, May 23-28, 3, 1993: 637-641.
8 Iglesias E., Anderez J., Forgiarini A. and Salager J-L., "A New Method to Estimate the Stability ofShort-Life Foams", Col/oids and Surfaces - A, 98, 1995: 167-174.
9
9 Espinosa-Gomez R., Finch J.A. and Bemert W., "Coalescence and Froth Collapse in the Presence of Fatty Acids", Colloids and Surfaces, 32 (3/4),1988:197-209.
10 Sweet C., Van Hoogstraten J., Harris M. and Laskowski J.S., "The Effect of Frothers on Bubble Size and Frothability of Aqueous Solutions", Proceedings of the second UBC-McGill Bi-annual international symposium of fundamentals of minerai processing, Edited by Finch, J.A., Rao S.R. and Holubec, L, Sudbury, Ontario, August 17-19, 1997: 235-245.
Il Cho Y.S., Laskowski J.S., "Effect of Flotation Frothers on Bubble Size and Foam Stability", International Journal of Mineral Processing, 64,2002: 69-80.
12 Laskowski J.S., "Fundamental Properties of Flotation Frothers", Proceedings of the 22nd International Mineral Processing Congress (IMPC), Edited by Lorenzen L., Bradshaw D., Cape Town, South Africa, 29 September- 3 October, 2003: 788-797.
13 Laskowski J.S., Tlhone T., Williams P. and Ding K., "Fundamental Properties of the Polyoxypropylene Alkyl Ether Flotation Frothers", International Journal of Mineral Processing, 72,2003: 289-299.
14 Comely B.A., Harris P.J., Bradshaw D.J. and Harris M.C., "Frother Characterization using Dynamic Surface Tension Measurements", International Journal of Mineral Processing, 64,2002: 81-100.
15 Moyo P. "Characterization of Frothers by Water Carrying Rate." M.Eng. Thesis, McGill University, 2005.
16 Finch 1. A., Gelinas S. and Moyo P., "Frother-Related Research at McGill University", Minerais Engineering, 19,2006: 726-733.
17 Clift R., Grace J.R. and Weber M.E., "Bubbles, Drops and Particles", Academic Press, New York, 1978.
18 Cho Y.S., Laskowski J.S., "Bubble Coalescence and its Effect on Dynamic Foam Stability", The Canadian Journal ofChemical Engineering, 80, 2002: 299-305.
10
Chapter 2: Literature Review
Flotation at the fundamentallevel is a complex physicochemical process. Tht:re are many
variables, chemical and physical, which can affect performance. This chapter reviews one
c1ass of variables, gas dispersion, which inc1udes superficial gas velocity, bubble size
distribution, gas holdup and bubble surface area flux. Specifie emphasis is given to the
effect of frother type and concentration on these variables.
In flotation, bubbles play the central role in separation of solid particles. Th{~ importance
of bubble size in controlling flotation efficiency has been recognized since the early
days l,2,3,4. A key factor controlling bubble size is the presence offrother5• Frothers appear
to function by controlling (retarding) bubble coalescence6. This stabilizes: a fine size
bubble dispersion in the slurry (pulp) phase, which both increases collision rate with
particles and enables a stable froth to form, which permits collected particles to overflow
from the cell.
2.1: Gas Dispersion
In flotation the hydrodynamic variables that characterize gas dispersion in the pulp are
superficial gas velo city (Jg) bubble size distribution (db), gas holdup (Cg) and bubble
surface area flux (Sb).
2.1.1: Superficial Gas Velocity
Superficial gas velocity, or simply gas rate (Jg, cm/s), is the volumetrie flowrate (Qg,
cm3/s) of air per cross sectional area (A, cm2) of the cell,
J = Qg g A (2.1)
Typically, superficial gas velo city in flotation systems is 0.5 - 2.5 (cm/s)7 depending on
factors such as bubble size and slurry rheology.
11
2.1.2: Bubble Size
Bubble size distribution is a factor determining metallurgical response. By virtue of the
mechanics of particle collision and attachment, bubbles must not be excessively large or
small. When bubbles are too small, particles may have insufficient contact time to attach,
or if attachment does occur, the bubble buoyancy may be too low for practical recovery.
On the other hand, as bubble size increases the strength of the bubble streamline
increases, making collision between particles and bubbles more difficult.
The Sauter mean diameter (d32) is commonly considered the mean size relevant to
flotation8• The size in flotation systems is ca. 0.5 - 2.5 mm8
• Coalescence is one
mechanism that reduces the air dispersion efficiency of a flotation system9• The bubble
size distribution depends on the balance between coalescence and breakuplO. The mean
bubble size is influenced principally by gas rate, the presence of frother, the bubble
generation device and operating pressure.
2.1.2.1: Effect of Superficial Gas Velocity on Bubble size
Several investigators report that the mean bubble size increases as gas rate lS
increased2,8,1l,12. Figure 2.1, taken from Nesset et al.13 presents bubble size (Sauter mean
diameter, d32) as a function of superficial gas velocity for a variety of cells (aIl forced
air).
12

3
2,5
Ê 2 .§.
TJ~
.~ 1.5 1/)
.!! an .c
.c :::1 III
Q,5
0.5 1.5 2.5 3
Superficlal Gas Velocity. Jg (cm/s)
Figure 2.1: Cell Characterization: Sauter mean bubble size as a function of gas rate (after
N esset et al. 13)
Bubble diameter, db, for porous spargers has been empirically re1ated to superficial gas
velocity by2,
(2.2)
where a and fJ are constants. For a variety of porous media, fJ is about 0.25 and a
depends on frother type and dosage2. Nesset et a1. 14 proposed a modification of the above
relationship,
(2.3)
where do is the bubble diameter at Jg equal zero and C and n are parameters, as a and ~ in
Equation 2.2, dependent on the bubble production mechanism, system chemistry and,
possibly, slurry properties.
2.1.2.2: Effect of Frothers on Bubble Size
Frother type and concentration affect bubble size. For aH frothers, an increase in frother
concentration decreases bubble size up to a certain concentration above which further
13

addition of frother has little effece. Figure 2.2 illustrates this for the case of Dowfroth
250.
The action of frother is commonly attributed to control of coalescence6; decreasing
coalescence with increasing frother concentration causes the decrease in bubble size.
After a certain concentration, recently termed "Critical Coalescence Concentration"
(CCC)9, the argument is that coalescence is fully retarded and bubble size is constant.
Different frothers have individual CCC values9,15,16.
, il )
:1.1)
Fro1her Concentration, ppm
Figure 2.2: Effect frother (Dowfroth 250) concentration on bubble size, (adapted from
Finch and Dobby7)
A number of investigators have tried to Hnk the frother's ability to reduce bubble size to
surface tension. Lower surface tension values are usually associated with higher frother
concentration that corresponds to smaller bubbles17,18,19,20. For a given family offrothers,
e.g., a1cohols, a relationship can be found. On the other hand, Aldrich and Feng21 found
that MIBC solutions with higher surface tension values than Dowfroth 200 solutions
14
produced smaller bubbles. It was also noted that, over the concentration ranges used in
flotation, surface tension hardly changes even though significant bubble size reduction is
taking place. In the case of salts, above a certain concentration, coalescence is also
retarded but solution surface tension increases22• These observations imply that
prevention of coalescence is not related simply to the surface tension.
2.1.3: Gas Holdup
Gas holdup (or voidage) is a dimensionless parameter defined as the volume fraction of
gas phase at any point in a cell. The average gas holdup in a total volume Vt is,
V B =~ %
g v.' t
(2.4)
where Vg is the volume of gas. Likewise, it is possible to characterize the liquid and solid
phase by their respective holdup values.
The gas holdup is one of the most important parameters used to characterize the
hydrodynamic state of bubble column reactors23,24. It is a simple parameter to measure
and useful as it combines the influence of both bubble size and gas rate. Gas holdup is
dependent on several factors, including: gas rate, liquid properties (e.g., frother type and
concentration), cell dimensions, operating temperature and pressure, gas distributor
design and solid phase properties and concentration, to mention the most important.
There are several techniques to measure gas holdup such as: pressure drop,
electroconductivity, X-ray and y-ray transmission, mean bubble residence time and
optical fiber probes23,25. Three-dimensional maps of gas holdup can be generated using
computer tomography.
2.1.3.1: Effect of Superficial Gas Velocity on Gas Holdup
Gas holdup depends directly on superficial gas velocit~6 and the relationship {>g-Jg is
often used to define the flow regime27. Figure 2.3 presents quantitatively the dependence
of flow regime on gas holdup and superficial gas velocity in bubble columns. For
columns in all manner of applications, gas holdup is found to first increase steadily with
15

increasing superficial gas velocity in the bubbly flow regime, which is followed by a
transition to an erratic response in the chum - turbulent regime 23,28,29,30,31.
Transition
BubblyF/ow Regime
Gas Flow Rate
Churn-Turbulent Flow Regime
Figure 2.3: Flow regime for bubble column
Flotation operates best in the bubbly flow regime (both columns14 and mechanical
machines32). In this flow regime the relationship between gas holdup and superficial gas
is often given in the form33:
(2.5)
where X and a are empirical constants, and a is typically 0.7 ~ a ~ 126, i.e., approximately
linear.
2.1.3.2: Effect of Liquid Phase Properties on Gas Holdup
Liquid phase properties that impact bubble formation and/or coalescence will affect gas
holdup. Addition of a small quantity of frother to water has a pronounœd effect on
reducing bubble size. Since smaller bubbles (~2mm) rise more slowly, at a given gas
rate this results in higher gas holdup. The effect of frother concentration is illustrated in
Figure 2.44, where gas holdup increases significantly upon addition of Dowfroth 250
from 0 to 15 ppm.
16

40
-~ 0 - 80 en (j.)
c: ::s :E 0 ::r: III 10 ns C)
Superficial Gas Velocity, Jg (cm/s)
Figure 2.4: Effect of frother dosage on gas holdup and gas rate (adapted from Finch and
Dobby7)
Liquid properties produce a range of effects31,34. Ozturk et a1.35 measured the gas holdup
in pure and mixed organic liquids and found that in several mixed cases the gas holdup
was higher as compared to pure liquids withthe same properties (surface tension, density,
viscosity). Their findings were comparable of those of Bhaga et al.36 who studied gas
holdup in toluene/ethanol mixtures. They also concluded that the gas holdup was higher
with high-density gases. Espinosa-Gomez et al. 6 investigated change in gas holdup upon
adding fatty acid to 20 ppm frother (TEB, 1,1,3-triethoxybutane). They found that the gas
holdup relative to that at zero fatty acid decreased by about 50% at fatty acid
concentration 20 ppm and greater. They attributed this to a coalescence effect. Recently,
Tang and Heindee7 suggested that regular tap water, which is the most frequently used
liquid in bubble columns, might cause significant reproducibility problems even in air
water two-phase studies as they observed time-dependent variations in gas holdup. This
was related to water quality, column operation mode, sparger orientation and superficial
17
gas and liquid velocities. They attributed this time-dependency to changes In
concentration of volatile coalescence inhibiting species percent in tap water.
Veera et a1.38 investigated gas holdup in the presence of a foaming agent (n-butanol) and
concluded that the effect of concentration on holdup profiles (gas holdup with height)
depended upon the sparger design, column aspect ratio and superficial gas velocity. The
authors observed that the gas holdup profiles became flatter at high foaming agent
concentrations. Zhou et a1.39 found that for different frother systems, a higher gas holdup
did not necessarily mean that a smaller bubble size was produced; that is, there appeared
to be an effect of frother type on gas holdup in addition to its role in controlling bubble
slze.
Viscosity, among the physical properties of a liquid, can have on impact on gas holdup. It
has been found that gas holdup decreases with increasing liquid viscosity40,41,42. Crabtree
and Bridgwater43 explained this behavior by suggesting that high viscosity promotes
bubble coalescence, resulting in larger bubbles that have a higher rise velocity, which
consequently lowers the gas holdup44.
An effect of surface tension on gas holdup is occasionally reported20,19,45 but this is
indirect because of the corresponding formation of smaller gas bubbles due to
coalescence inhibitation as discussed earlier.
2.1.3.3: Effect ofSolid Particles on Gas Holdup
The effect of solid particle concentration and particle Slze on gas holdup has been
investigated by a number of researchersll ,46,47,48,49,50. Several concluded that an increase
in solid concentration generally reduced the gas holdup, which is usually attributed to
coalescence creating larger, faster rising bubbles. Gandhi et a1.50, also finding that as the
solid content increased the gas hold-up decreased, attrihuted this to an increase in slurry
viscosity preventing bubble break-up
18
Most of these studies do not relate to flotation conditions. Banisi et a1. 51 studied the gas
holdup in a flotation system (i.e., presence of frother) using calcite particles (74% > 53
!lm) and again reported a decrease in gas holdup with increasing solid concentration,
which did not appear to be related to a change in bubble size. They attributed the
decrease in gas holdup to an increase in bubble rise velocity caused by wake stabilization,
and a change in the radial holdup and flow profiles.
A common deficiency in these studies is the reliance on gas holdup measurements with
few additional measurements such as bubble size. Combinations of measurements are
required to resolve this coalescence/breakage controversy.
2.1.4: Surface Area Flux
Surface area flux (Sb), a derived gas dispersion parameter, is now commonly used in
flotation to link the flotation rate with the hydrodynamic variables 12,52,53,54,55. The
flotation rate constant (k) has been correlated with surface area flUX56,57, and is usually
expressed as (for the pulp zone):
(2.6)
where P is the "flotability factor", which encompasses the contribution of particle size
and hydrophobicity. Gas holdup can be correlated with the rate constant via the following
relationship with Sb proposed by Finch et a1.58,
(2.7)
with Sb in s-J and Eg in %.
2.2: Frothers
Flotation frothers refer to those organic chemical substances that when dissolved in or
dispersed in water, reduce bubble size and enable a froth to form that remains stable long
enough to discharge from the flotation celI and then breaks down. Frother molecules are
19
heteropolar, i.e., consist of two groups, polar and non-polar. The non-polar group is a
hydrocarbon chain, containing preferably at least six carbon atoms, which can either be
straight, branched or cyclic59. It is believed that the hydrocarbon chain must not be too
long since the resulting molecule is not soluble (or possibly dispersible) enough to be a
frothing agent. The polar group could be a hydroxyl (OH), carbonyl (-C=O-), ester (
COOR-), carboxyl (-COOH), amine (-NH2), nitrile (-CN), phosphate (=P04), or sulphate
(=S04) J 6,60.
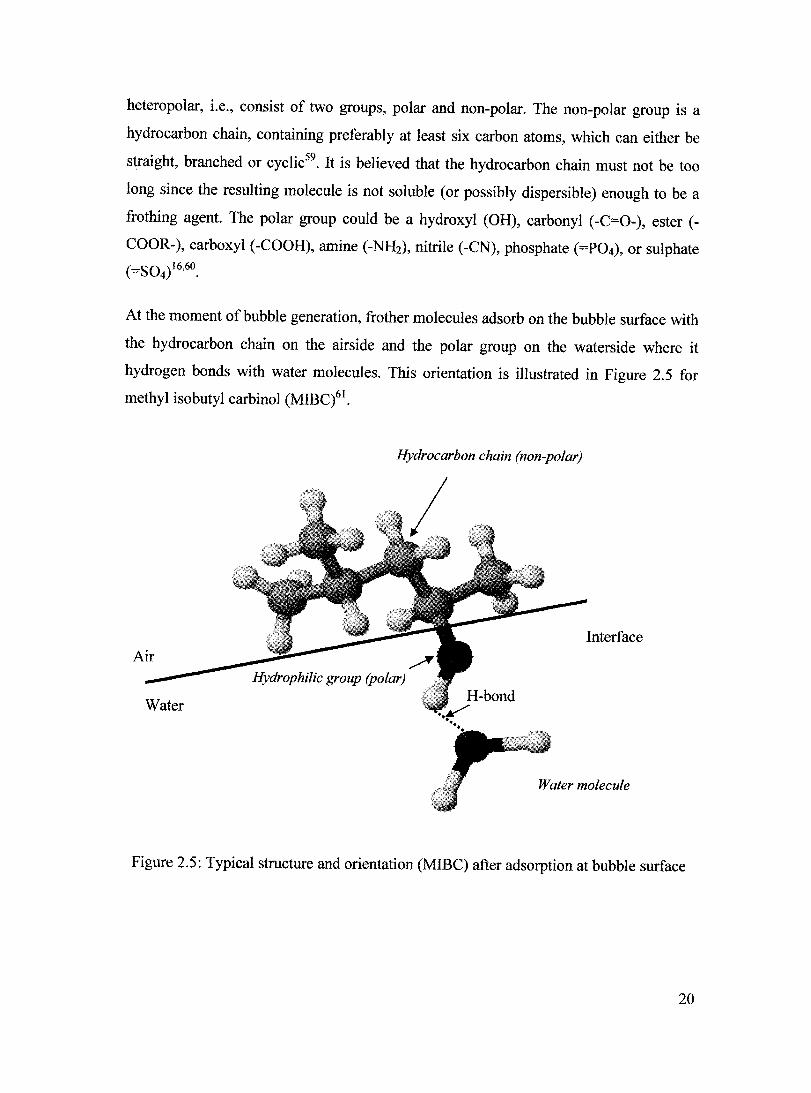
At the moment of bubble generation, frother molecules adsorb on the bubble surface with
the hydrocarbon chain on the airside and the polar group on the waterside where it
hydrogen bonds with water molecules. This orientation is illustrated in Figure 2.5 for
methyl isobutyl carbinol (MIBC)61.
Air
Water
Hydrocarbon chain (non-polar)
/ Hydrophilic group (polar)
Interface
Water molecule
Figure 2.5: Typical structure and orientation (MIBC) after adsorption at bubble surface
20

According to Gibbs, those solutes that reduce surface tension adsorb in the surface layer.
Gibbs' adsorption model can be expressed as follows6o:
where,
C da r=--x-
RT dC
r: The excess concentration of molecules adsorbed at the interface
C: Concentration of solute molecules in the bulk of the solution
cr: Surface tension
R: Gas constant
T: Absolute temperature
da : The surface activity of a surfactant dC
(2.8)
In addition to lowering surface tension, frothers also prevent coalescence. Several
mechanisms have been proposed62• One is that the hydrogen bonding with water
molecules forms a stabilized (bound) water film around the bubble, Figure 2.6. This film
resists drainage and thus retards coalescence63.
film
Figure 2.6: A bubble surface with a bound water layer
Frother type and concentration probably affect the bound water film thickness. Gelinas et
al. 63 measured the film thickness on an air bubble blown in solutions of two industrial
21
frothers, MIBC and Dowfroth 250, using inferferometry. They found that Dowfroth 250
gave a thicker water film than MIBe. The difference was attributed to the molecular
structure of the frothers, which influences the way they hydrogen bond with and order
(stabilize) water molecules.
The second mechanism relates to surface tension-driven phenomena. Upon drainage of
the intervening water layer, prompted for example by bubble collision, a drag force on
the bubble surface is induced causing the surface to flow. This reduces the local frother
concentration on the surface, which means the local surface tension increases. Hence a
surface tension gradient is established which opposes the motion of the surface (Gibbs
elasticity effect). The gradient promotes motion in the surface towards the higher surface
tension region which then promotes a flow in the adjoining water layer which furthers
counters the flow out of water (the Marangoni effect). Together these two effects oppose
film drainage and retard coalescence62.
The same forces that prevent coalescence and maintain a fine bubble dispersion in the
pulp zone also promote formation of a stable froth. In flotation systems, particles attached
to a bubble evidently enhance froth stability. In fact without solids froth rarely forms at
the frother dosages used in practice. The particles can be considered as physically
blocking water drainage, which can be modeled as an increase in effective viscosity of
the inter - bubble film.
According to the Leja-Schulman penetration theory64,65, frothers at the bubble surface
interact with collector molecules adsorbed on the solid particles during collision and
attachment. The extent to which this attribute of frothers is important remains an open
question 16.
2.2.2: General Specifications ofFrothers
Frothers must have certain practical features, such as60,66:
I. Creation of a froth that is sufficiently stable but not tough, so that it facilitates
pumping and further processing and collapses readily once outside the cell
22
II. Production of a froth that allows further separation of valuable mineraIs from
gangue through drainage of water
III. Having a low sensitivity to pH changes, collectors and dissolved salt content of
flotation pulp
IV. Being cheap, available for large-scale use and environmentally friendly
V. Being easily dispersed but not necessarily readily soluble in aqueous medium
2.2.3: Frother Chemistry and Classification
There are three main groups of reagents employed by the mineraI industry as frothers:
alcohols, alkoxy type and polyglycol type (i.e., polyglycols and polyglycol ethers). Table
2.1 summarizes sorne properties of common frothers67•
2.2.3.1: Alcohols
There are 3 subgroups in the alcohol c1ass: linear aliphatic, cyc1ic and aromatic. As
commercial products they may also contain a variety of other compounds formed during
their manufacture. The linear aliphatic inc1ude both linear and branched fomiS that have a
chain length 5 to 8 carbon atoms. Cyc1ic and aromatic alcohols are much h::ss soluble in
water than linear alcohols and are less sensitive to pH. The alcohol frothers tend to
produce a froth, which is relative1y shallow, carries little water (i.e., is dry), entrains less
gangue slimes (i.e., is selective), and is less stable and persistent68.
2.2.3.2: Polyglycols
Polyglycols divide into two groups: polypropylene or polyethylene glycols and their
ethers. They are readily soluble in water so can be diluted to any given strength. Besides
their particular structure, molecular weight plays a significant role in their performance.
The glycol frothers tend to produce a froth which is comparatively thick, carries more
water (i.e., is wet), entrains more gangue slimes (i.e., is less selective) and is re1atively
stable and persistent with, again, low sensitivity to pH changes68. This character of
polyglycols is considered an advantage when recovering coarse partic1es66•
23
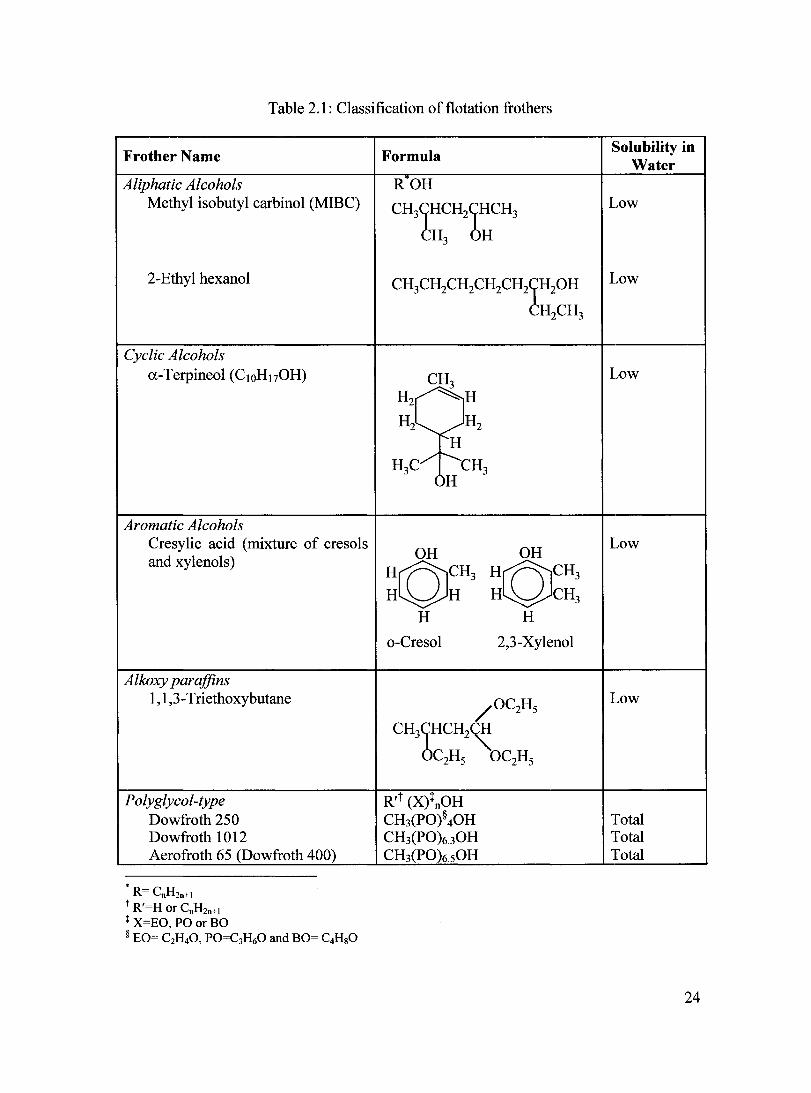
Table 2.1: Classification of flotation frothers
Frother Name
Aliphatic Alcohols Methyl isobutyl carbinol (MIBC)
2-Ethyl hexanol
Cyclic Alcohols a-Terpineol (ClOHI7OH)
Aromatic Alcohols Cresylic acid (mixture of cresols and xylenols)
Alkoxy paraffins 1,1,3-Triethoxybutane
Polyglycol-fype Dowfroth 250 Dowfroth 1012 Aerofroth 65 (Dowfroth 400)
• R= CnH2n+1
t R'=H or CnH2n+l
~ X=EO, PO or BO § EO= C2H40, PO=C3H60 and BO= C4HgO
Formula
ROH
CH3ÇHCH2ÇHCH3
CH3 OH
CH3CH2CH2CH2CH2ÇH20H
CH2CH3
CH3 H2 ~H
H2 H2 f--H
H3C/I---CH3 H
OH
:O~H3 H
o-Cresol
R,t (X)tnOH CH3(PO)§ 40H CH3(PO)6.30H CH3(PO)6.50H
OH
HQCH3
H~CH3 H
2,3-Xylenol
Solubility in Water
Low
Low
Low
Low
Low
Total Total Total
24

2.3: References
1 Ahrned N., Jarneson O.J., "The Effect of Bubble Size on the Rate of Flotation of Fine Particles", International Journal of Mineral Processing, 14 (3),1985:195-215.
2 Dobby O.S., Finch lA., "Particle Collection in Columns - Oas Rate and Bubble Size Effects", Canadian Metal/urgical Quarterly, 25 (1), 1986: 9-13.
3 Yoon RH., Luttrel H.H., "The Effect of Bubble Size on Fine Particle Flotation", Frothing inflotation: A volume in honour of Jan Leja. Edited by J.S. Laskowski, 5, 1989: 101-122.
4 Fuerstenau D.W., "Advances in Flotation Technology", Proceedings of Symposium of Advances in Flotation Technology held at the SME Annual Meeting, Edited by Parekh B.K. and Miller J.D., Society for Mining Metallurgy and Exploration, Littleton, Colorado, March 1-3, 1999: 3-21.
5 Harris C.C., "Flotation Machines in Flotation", A.MGaudin Memorial Volume, Vol. 2, Chapter 27, 1976: 753-815.
6 Espinosa-Oornez R, Finch J.A. and Bemert W., "Coalescence and Froth Collapse in the Presence of Fatty Acids", Col/oids and Surfaces, 32 (3/4), 1988:197-209.
7 Finch lA., Dobby O.S., "Column Flotation", Pergamon Press, New York, 1990.
8 Oorain B.K., Franzidis J.-P. and Manlapig E.V., "Studies on Impeller Type, Irnpeller Speed and Air Flow Rate in an Industrial Scale Flotation Cell - Part 1: Effect on Bubble Size Distribution", Minerais Engineering, 8 (6), 1995: 615-635.
9 Cho Y.S., Laskowski J.S., "Effect of Flotation Frothers on Bubble Size and Foarn Stability", International Journal of Mineral Processing, 64, 2002: 69-80.
10 Prince M.J., Blanch H.W., "Bubble Coalescence and Break-Up in Air-Sparged Bubble Columns", American Institute of Chemical Engineers (AIChE Journal), 36, 1990: 1485-1499.
Il Behkish A., "Hydrodynamic and Mass Transfer Pararneters in Large-Scale Slurry Bubble Colurnn Reactors", Ph.D. Thesis, Departrnent of Chernical Engineering, University of Pittsburgh, 2004.
12 Gomez C.O., Finch J.A., "Gas Dispersions in Flotation Machines", CIM Bulletin 95, 1066,2002: 73-78.
13 Nesset J.E., Hemandez-Aguilar J.R, Acuna C., Oornez C.O. and Finch J.A., "Sorne Oas Dispersion Characteristics of Mechanical Flotation Machines", Proceedings of International Conference SME-IMM, Centenary of Flotation, Edited by Jarneson O., Yoon R.-H. Brisbane, Australia, Jun6-9, 2005: 243-250.
25
14 Nesset J.E., Gomez C.O., Finch J.A, Hemandez-Aguilar J. and DeFeo A, "The Use of Gas Dispersion Measurements to Improve Flotation Performance", Proceeding of 37th Annual Meeting of the Canadian Mineral Processors of CIM, Ottawa, January 18-20,2005: 401--422.
15 Cho Y.S., Laskowski J.S., "Bubble Coalescence and its Effect on Dynamic Foam Stability", The Canadian Journal ofChemical Engineering, 80, 2002: 299-305.
16 Laskowski 1.S., "Frothing in Flotation II'', Edited by Laskowski J. S. and Woodbum E.T., Chapter 1, 1998.
17 Sweet C., Van Hoogstraten J., Harris M. and Laskowski J.S., "The Effect of Frothers on Bubble Size and Frothability of Aqueous Solutions", Proceedings of the second UBC-McGill Bi-annual international symposium of fundamentals of minerai processing, Edited by Finch, J.A., Rao S.R. and Holubec, 1., Sudbury, Ontario, August 17-19,1997: 235-245.
18 Comely B.A, Harris P.J., Bradshaw D.J. and Harris M.C., "Frother Characterization Using Dynamic Surface Tension Measurements", International Journal of Mineral Processing, 64, 2002: 81-100.
19 Wilkinson P .M., Spek AP. and van Dierendonck L.L., "Design Parameters Estimation for Scale-Up of High-Pressure Bubble Columns", American Institute of Chemical Engineers (AIChE Journal), 38, 1992: 544-554.
20 Kluytmans J.H.J., van Wachem B.G.M., Kuster B.F.M. and Schouten, J.C., "Gas Holdup in a Slurry Bubble Column: Influence of Electrolyte and Carbon Particles", Industrial and Engineering Chemistry Research, 40, 2001: 5326-5333.
21 Aldrich C., Feng D., "Effect of Fluid Properties on Two-Phase Froth Characteristics", Industrial and Engineering Chemistry Research, 38 (10), 2000: 4110-4112.
22 Klassen V.1. and Mokrousov V.A., "An Introduction to the Theory of Flotation", ButterWorths, London, 1963.
23 Luo x., Lee D.J., Lau R., Yang G. and Fan L., "Maximum Stable Bubble Size and Gas Holdup in High Pressure Slurry Bubble Column", American Institute of Chemical Engineers (AIChE Journal), 45 (4), 1999: 665-85.
24 Shah Y.T., "Gas-Liquid-Solid Reactor Design", McGraw-Hi11: New York, 1979.
25 Wu Y., Ong B.C., and Al-Dahhan M.H., "Prediction of Radial Gas Holdup Profiles in Bubble Column Reactors," Chemical Engineering Science, 56, 2001: 1207-1210.
26 Shah Y.T., Godbole S.P. and Deckwer W.D., "Design Parameters Estimations for Bubble Column Reactors", American Institute of Chemical Engineers (AIChE Journal), 28(3), 1982: 353-79.
26

27 Deckwer W.-D., Louisi Y., Zaidi A. and Ralek M., "Hydrodynamic Properties of the Fisher-Tropsch Slurry Process", Industrial and Engineering Chemistry Pro cess Design and Development, 19, 1980: 699-708.
28 Akita K., Yoshida, F., "Gas Holdup and Volumetric Mass Transfer Coefficient in Bubble Columns", Industrial Engineering Chemistry Process Design and Development, 12, 1973: 76-80.
29 Gorain B.K., Franzidis J.-P. and Manlapig E.V., "Studies on Impeller Type, Impeller Speed and Air Flow Rate in an Industrial Scale Flotation Cell - Part 2: Effect Gas Holdup", Minerais Engineering, 8 (12), 1995: 1557-1570.
30 Prakash A., Margaritis A. and Li H., "Hydrodynamics and Local Heat Transfer Measurements in a Bubble Column with Suspension of Y east", Biochemical Engineering Journal, 9, 2001: 155-63.
31 Hikita H., Asal S., Tanigawa K., Segawa K. and Kitao M., "Gas Holdup in Bubble Column", The Chemical Engineering Journal, 20, 1980: 59-67.
32 Dahlke R., Gomez C.O. and Finch J.A., "Technical Note: Operating Range of a Flotation Cell Determined from Gas Holdup vs. Gas Rate", Minerais Engineering, 18 (9), 2005: 977-980.
33 Deckwer W.-D., "Bubble Column Reactor", John Wiley and Sons, Chichester, 1992.
34 Sada E., Katoh S. and Y oshil H., "Performance of the Gas-Liquid Bubble Column in Molten Salt Systems", Industrial and Engineering Chemistry Process Design and Development, 23, 1984: 151-4.
35 Ozturk S.S., Schumpe A. and Deckwer W.D., "Organic Liquids in a Bubble Column: Holdups and Mass Transfer Coefficients", American Institute ofChemical Engineers (AIChE Journal), 33, 1987: 1473-80.
36 Bhaga D., Pruden D.D. and Weber M.E., "Gas Holdup in a Bubble Column Containing Organic Liquid Mixtures", The Canadian Journal of Chemical Engineering, 49, 1971: 417-420.
37 Tang C., Heindel T.J., "Time-Dependent Gas Holdup Variation in an Air-Water Bubble Column", Chemical Engineering Science, 59, 2004: 623-32.
38 Veera U.P., Kataria K.L. and Joshi J.B., "Effect ofSuperficial Gas Velocity on Gas Holdup Profiles in Foaming Liquids in Bubble Column Reactors", Chemical Engineering Journal, 99, 2004:53-8.
39 Zhou Z.A., Egiebor N.O. and Plitt, L.R., "Frother Effects on Bubble Motion in a Swarm", Canadian Metallurgical Quarterly, 32 (2), 1993:89-96.
27
40 Godbole S.P., Schumpe A., Shah Y.T. and Carr, N.L. "Hydrodynamics and Mass Transfer in Non-Newtonian Solutions in a Bubble Column", American Institute of Chemical Engineers (AIChE Journal), 30, 1984: 213- 220.
41 Yasunishi A., Fukuma M. and Muroyama, K. "Measurement of Behavior of Gas Bubbles and Gas Holdup in a Slurry Bubble Column by a Dual Electroresistivity Probe Method", Journal ofChemical Engineering of Japan, 19, 1986: 444-449.
42 Neme F., Coppola L. and Bohm, U. "Gas Holdup and Mass Transfer in Solid Suspended Bubble Columns in Presence of Structured Packings", Chemical Engineering Technology, 20, 1997: 297-303.
43 Crabtree J.R., Bridgwater J., "Bubble Coalescence in Viscous Liquids", Chemical Engineering Science, 26, 1971: 839-851.
44 Li H. and Prakash A., "Heat Transfer and Hydrodynamics in a Three-Phase Slurry Bubble Column", Industrial and Engineering Chemistry Research, 36, 1997: 4688-94.
45 Kantak M.V., Hesketh R.P. and Kelkar B.G., "Effect of Gas and Liquid Properties on Gas Phase Dispersion in Bubble Columns", Chemical Engineering Journal, 59, 1995: 91-100.
46 Kara S., Balmohan G., Shah Y.T. and Carr, N.L., "Hydrodynamics and Axial Mixing in a Three-Phase Bubble Column", Industrial Engineering Chemistry Pro cess Design and Development, 21, 1982: 584-594.
47 Koide K., Takazawa A., Komura M. and Matsunaga H., "Gas Holdup and Volumetrie Liquid-Phase Mass Transfer Coefficient in Solid-Suspended Bubble Columns", Journal ofChemical Engineering of Japan, 17, 1984: 459-466.
48 De Swart J.W.A., Krishna R., "Influence of Particles Concentration on the Hydrodynamic of Bubble Column Slurry Reactors" Chemical Engineering ResearchandDesign, 73, 1995: 308-313.
49 Banisi S., Finch J. A. and Laplante A.R., " Effect of Solid particles on Gas Hold-up in Flotation Columns: 1 - Measurement", Chemical Engineering Science, 50 (14), 1995: 2329-34.
50 Gandhi B., Prakash A. and Bergougnou M.A., "Hydrodynamic Behavior of Slurry Bubble Column at High Solids Concentrations", Powder Technology, 103, 1999: pp. 80-94.
51 Banisi S., Finch J.A. and Laplante, A.R., Weber, M.E., "Effect ofSolid Particles on Gas Holdup in Flotation Columns-II. Investigation of Mechanisms of Gas Holdup Reduction in Presence of Solids", Chemical Engineering Science, 50, 1995: 2335-2342.
28
52 Deglon, D.A., Egya-Mensah D. and Franzidis J.P., "Review of Hydrodynamics and Gas Dispersion in Flotation Cells on South African Platinum Concentrators", MineraIs Engineering, 13 (3), 2000:235-244.
53 Yianatos J.B., Bergh L.G., Condori P. and Aguilera J., "Hydrodynamic and Metallurgical Characterization of Industrial Flotation Banks for Control Purposes", MineraIs Engineering, 14(9),2001: 1033-1046.
54 Grau R.A., Heiskanen, K., "Gas Dispersion Measurements in a Flotation Cell", MineraIs Engineering, 16,2003: 1081-1089.
55 Hunold M., KrauthaufT., Muller J. and Putz H.-J., "Effect of Air Volume and Air Bubble Size Distribution on Flotation in Injector-Aerated Deinking Cells", Journal ofPulp and Paper Science, 23 (12), 1997: 555-560.
56 Gorain B.K., Franzidis J.-P. and Manlapig E.V., "Studies on Impeller Type, Impeller Speed and Air Flow Rate in an Industrial Scale Flotation Cell - Part 4: Effect of Bubble Surface Area Flux on Flotation Performance", MineraIs Engineering, 10, 1997: 367-379.
57 Hemandez H., Gomez C.Q. and Finch J.A., "A Test of the Flotation Rate vs. Bubble Surface Area Flux Relationship", Preceding 4th UBC-McGill Symposium on Fundamentals in Mineral Processing, Edited by Finch J.A., Rao S.R. and Huang L., Met. Soc. CIM, Toronto, August26-29, 2001: 59-74.
58 Finch J.A., Xiao J., Hardie C. and Gomez, C.Q., "Gas Dispersion Properties: Bubble Surface Area Flux and Gas Holdup", MineraIs Engineering, 13 (4), 2000: 365-372.
59 Taggart A. F., "Handbook of Mineral Dressing", Section 12, John Wiley and Sons, New York, 1947.
60 Wrobel S.A., "Flotation Frothers, Their Action, Composition, Properties and Structure", Recent development in mineraI processing, IMM symposium, September 23-25, 1953: 431-454.
61 Weber T., Gomez C.Q. and Finch J.A., "A Frother Concentration Meter", Proceedings 35th Annual Meeting of the Canadian Mineral Processors (division of CIM), January 21-23,2003: 639-652.
62 Harris P.J., "Frothing Phenomena and Frothers", in Principles of Frothers, Edited by R.P. King, Chapter 13, 1982: 237-250.
63 Gélinas S., Finch J.A. and Gouet-Kaplan M., "Comparative Real-Time Characterization of Frother Bubble Thin Films", Journal of Col/oid and Interface Science, 291(1),2005: 187-191.
29

64 Leja J., Schulman J.H., "Flotation Theory: Molecular Interactions between Frothers and Collectors at Solid Liquid Air Interfaces", Transaction of the American Institution of Mining and Metallurgy Engineering (AIME), 199, 1954: 221-228.
65 Leja J., "Mechanism of Collector Adsorption and Dynamic Attachment of Particles to Air Bubbles as Derived from Surface Chemical Studies", Transaction of Institution of Mining and Metallurgy (IMM), 66, 1956/57: 425-437.
66 Klimpel R.R., Hansen R.D., "Reagents in Mineral Technology", Surfactant Science Series, 27, 1988: 385-409.
67 Rao S.R., "Surface Chemistry of Froth Flotation" New York, London: Kluwer Academic/Plenum Publishers, 2004.
68 American Cyanamid Company, "Mining Chemicals Handbook ", USA, 1986.
30
Chapter 3: Frother Characterization Techniques
Flotation frothers have periodically been the focus of attention over the years. These
studies have led to a number of procedures to characterize frothers, which are
summarized in this chapter.
3.1: Dynamic and Static Foam** Tests
Two types of foam stability test are generally used, dynamic and static. In dynamic tests,
air is constantly supplied and foam grows until steady state is reached where rate of
formation is in equilibrium with rate of decay (bubble bursting). In a static test the rate of
foam formation is zero: once the foam is formed, it is allowed to collapse without further
supply of gas or agitation 1•
3.1.1: Dynamic Tests
Bikerman proposed the original dynamic test2,3. He defined a unit of foaminess (L), as
the average lifetime of a bubble in foam. The idea was to propose L as a physical
property of a frother solution just like its density and viscosity. Measurements were
carried out in a cylinder. Air was dispersed through a sparger and the foam was allowed
to grow until equilibrium was reached. Foam height or volume was then measured. The
dynamic foam stability (L) was expressed as:
(3.1)
where, Jij is the foam volume, Qg the gas volumetric flowrate and Hmax and A are the total
foam height and the cross-sectional area of the vessel, respectively. It was found that L
was independent of the gas flowrate, the shape of container and the average pore size of
sparger.
•• The word 'foam' is employed when no solids are present; when solid particles are included the term froth is generally used.
31

Sun4 designed a frother-meter specially to measure the foaming characteristics of pine
oils and other frothing reagents. He defined a foamability index (FI) as the ratio of foam
volume produced to the volume of foam produced from a chosen standard solution of n
hexyl-alcohol. He also defined a stability index (SI) as the ratio of the persistence (time
for foam to collapse) of the frother under test to the standard frother.
Malysa et al. 5,6 studied the surface rheology and foamability of n-octanoic acid and n
octanol solutions. They determined the Marangoni surface elasticity by using the pulsing
bubble method and quantified foamability in terms of the retention time (rt) values. The
retention time was determined under steady-state conditions based on the total gas
volume contained in both the foam and the solution, hence determining the average time
necessary for unit gas volume to pass through the system. Graphically, rt is the slope of
the linear section of the dependence of the total gas volume contained in the system, Vg,
on the gas flow rate, Qg,
(3.2)
They found that retenti on time values increased more rapidly at low than at high
concentration and also determined rt to be independent of the gas flowrate and the
dimensions of the measuring equipment. The "Dynamic Foamability Index" (DFI), defined as the limiting slope of the rt dependence on concentration (c) for c ~ 0, was
proposed as the parameter to compare frothers and their action under conditions of
identical foamability.
DFI=(::)~ (3.3)
Malysa et al. 7 related foamability (rt) to surface elasticity of a bubble film. The bubble
was made to oscillate with known amplitude and frequency immediately after formation.
It was found that the effective surface elasticity (Eeff) and rt varied in a similar manner
with the chain length of n-alcohols. Both Eeff and rt showed dependences on carbon chain
length with the maximum observed for C6 - Cg and then rapidly decreased for n-nonanol
32

and n-decanol. The magnitude of these maX1ma depended mainly on the solute
concentration.
Sweet et a1.8 characterized different frothers using the DFI and CO.6, the concentration at
which the Sauter mean diameter is reduced to 0.6 times that in water, Figure 3.1. They
determined that normal alcohols behaved differently from branched chain alcohols. For
n-alcohols the correlation is given by:
C _o_.6_ = DFr1
0.059 (3.4)
and for branched chain alcohols:
C _o_.6_ = DFr2
65.91 (3.5)
where al and a2 are constant and equal to 0.64 and 1.16, respectively.
Comely et a1.9 characterized frothers using dynamic (time dependent) surface tension
measurements (determined by the maximum bubble pressure technique). Figure 3.2
shows the results for a series of alcohols. The technique was refined to facilitate
measurement at high bubble rates, an important criterion with respect to the analysis of
small, fast adsorbing molecules at low concentration such as flotation frothers. They
developed an adsorption model, which was used to interpret the behaviour of frothers
with respect to bubble size in flotation.
33

1.E-03
'7 C4 \~ MIBC E "C -"0 \ E ID \ 0 \ Il e;; \ "C -.. \ "C .c::: 1.E-04
\ u :ë \u-Terpineol ~ C7 Â\ .. CIl c  2-f:thyl hexanol 0
:;:::; \ e - \ c
CI) u ~ DF400 c 0
(J 1.E-OS •
1.E+02 1.E+03 1.E+04 1.E+OS 1.E+06 1.E+01
OFI, sdm3/mOr1
Figure 3.1: Relationship between the concentration at which the Sauter mt::an bubble
diameter is reduced to 0.6 times that in water and DFI (adapted from Sweet et al.8)
Although in two-phase systems several techniques have been used to measure foam
stability, transfer to three-phase systems might not be straightforward since the presence
of solids also affects the stability of foam lO• In this regard, sorne work has been carried
out to investigate the effect of solids upon the stability of froths 11•
Barbian et al. 12,13 developed a dynamic stability test for mineraI flotation froths, that
could be used in both laboratory and industrial scale conditions. They also tried to relate
the unit of foaminess to flotation performance. Froth growth was monitored with time
and the following relationship was found,
H =H (l_e t/
T) f max (3.6)
where Hmax is the total froth height, Hf is the froth height at time t and r is the
characteristic average bubble lifetime (i.e., L). They found that the equilibrium height and
the dynamic stabilityfactor depended significantly upon both the airflow rate and the
frother concentration.
34

10 1 Butanol MIBC
6
4
2
o 2 8 10
Surface Agè (19)
Figure 3.2: The effect offrother type on dynamic surface pressure for an equilibrium
surface pressure of 8 dyne/cm-19
3.1.2: Static Tests
Iglesias et al. 14 modified Bikerman's technique by switching off gas once the dynamic
equilibrium height was reached. The decay of foam volume was measuredl with time; a
parameter t1/2 was defined as the time for the foam to decay to halfthe original height (for
constant cross sectional area). This parameter was used to characterize the persistence of
the foam produced from a solution of known concentration.
Xu et al. I5 proposed a new method of evaluating froth stability and foamability. Their
argument was based on the fact that when frothers were compared at the same
concentration they would produce different froth heights and hence different froth
stabilities (different tll2). Foam heights were plotted against t1/2 and a good linear
correlation was obtained for different frothers. It was found that alcohols (MIBC, n
heptanol, n-octanol and 2-octanol) had the same slope, which showed that they had
almost the same foam stability.
35
3.2: Bubble Size Properties
Gourram-Badri et al. 11 studied the coalescence of bubbles in the pulp zone of flotation
cells. They carried out experiments at laboratory scale under similar conditions to those
found in industrial flotation machines to study the coalescence of two mineralized
bubbles and the role that flotation frother (MIBC) plays in flotation selectivity. They
developed a method to quantify the ability of MIBC to reduce bubble coalescence and to
determine the effect of solids on the foaminess of the reagent. They determined the
foaminess of MIBC by measuring the total froth height, including the solution and the
froth zone, as a function of time. They found that the total froth height increased with
time and after 2 min it reached a steady-state value that varied with frother concentration.
These findings were similar to those previously reported by Johansson and PughlO• They
found that the total foam height depends on the presence of particles in the froth, being
lower with particles. This difference in height increases as the MIBC concentration
increases. AIso, it was found that more hydrophobic particles did not produce a stable
steady-state height.
Cho and Laskowski l6,17 studied the effect of flotation frothers on bubble size and its
implications for foam stability. Following the procedure previously introduced by Malysa
et al. 6, they performed experiments to measure the dynamic foamability index in a two
phase system using different frothers and spargers. They found a) that the bubble size is
not affected by variations in the frother concentration if bubbles cannot collide with each
other, and b) when the frother concentration reaches a certain concentration, tagged the
critical coalescence concentration (CCC), bubble coalescence is totally prevented. They
correlated the CCC values and the dynamic foamability index, and proposed that both are
determined by bubble coalescence.
A correlation between dynamic surface tension and bubble size can be seen by comparing
Figure 3.3, the bubble size data from Sweet et al.8, and Figure 3.2.
36

.. eUlallOl
• Pentanol
• Hexanol ,. Heplanol
• 0cIan0I
•• < • r 0 MISC
0.& l....-____ ....J.. _____ J..-____ ....J.. _____ .J
0.0011+00 $.00e-1)4 1.00&-03 1.50&-03 2.00&-03 Concentration moI.dm.s
Figure 3.3: Sauter mean bubble diameter as a function offrother type and bulk
concentration (after Sweet et a1.8)
Laskowski et al. 18 investigated a series of polyoxypropylene alkyl ethers (DF 200, DF250
and DF1012). They found a relationship between the number of propoxy (PO, OC3H6)
groups in the CH3(OC306)nOH and the CCC value, and the values of the dynamic
foamability index, Figure 3.4. It was also found that blending frothers at a molar ratio
could be based on the corresponding CCC values of individual frothers. Laskowski 19
suggested that frothers characterized by low CCC and high DFI values have properties of
strong frothers, while those with high CCC and low DFI values are more sel(:ctive.
37

300000,-----------------,
200000
'0 E -... E "0 II)
iL: 100000 C
O-t---+--+----l----i---t-"'---I o 0.1 0.2 0.3 0.4 0.5 0.6
CCC, mmol/dm3
Figure 3.4: Relationship between CCC and DFI values for a series ofpolyoxpropylene
alkyl ethers (adapted from Laskowski et al. 18)
3.3: Water Carrying Rate
In flotation, the amount of water reporting to the concentrate is closely related to the
recovery of gangue particles by entrainment, which is detrimental to the float product
grade20• Water is transported both as a film on the bubble surface and as a tailing wake,
Figure 3.5 Bubble size21, gas rate22
, froth depth22 and frother type23 influence the amount
of water to overflow.
Wake
Figure 3.5: Schematic ofbubble carrying water
38
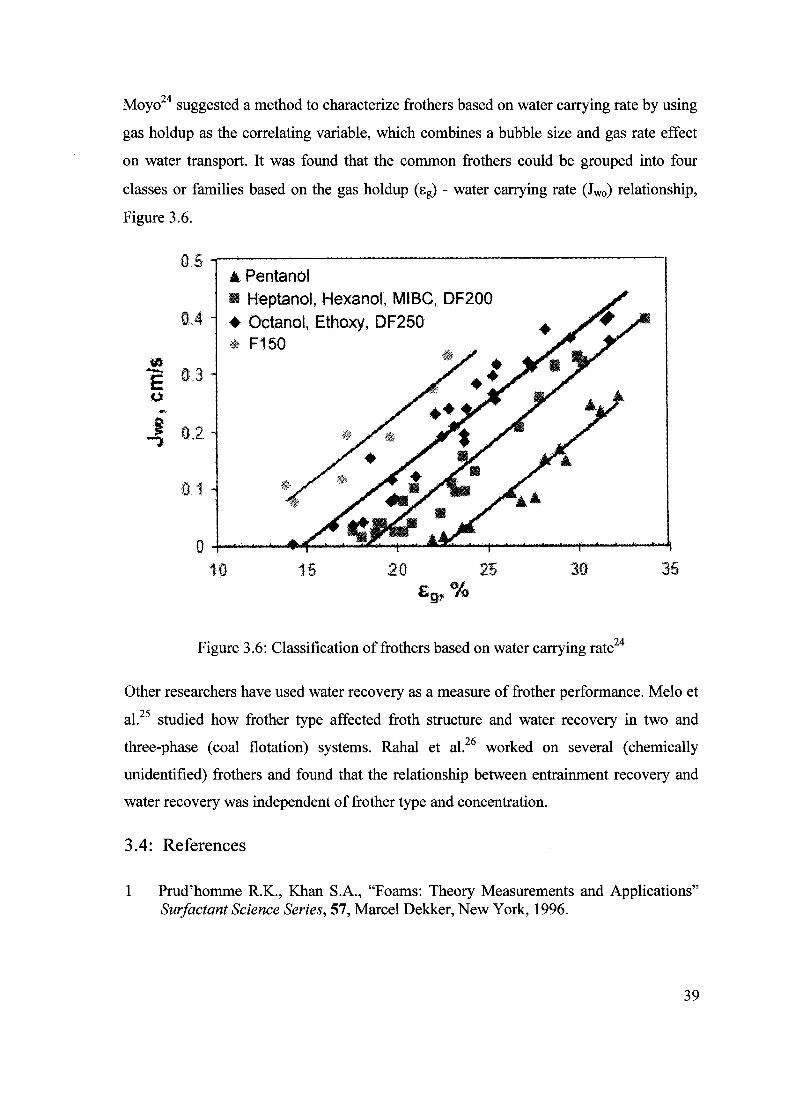
Moy024 suggested a method to characterize frothers based on water carrying rate by using
gas holdup as the correlating variable, which combines a bubble size and gas rate effect
on water transport. It was found that the common frothers could be grouped into four
classes or families based on the gas holdup (eg) - water carrying rate (Jwo) relationship,
Figure 3.6.
0.5 -r---------------------I Il Pentanol Il Heptanol, Hexanol, MIBC, DF200
(J.4 • Oetanol, Ethoxy, DF250 • F150
10 15 20 JO 35
Figure 3.6: Classification offrothers based on water carrying rate24
Other researchers have used water recovery as a measure of frother performance. Melo et
al. 25 studied how frother type affected froth structure and water recovery in two and
three-phase (coal flotation) systems. Rahal et al.26 worked on several (chemically
unidentified) frothers and found that the relationship between entrainment recovery and
water recovery was independent of frother type and concentration.
3.4: References
1 Prud'homme R.K., Khan S.A., "Foams: Theory Measurements and Applications" Surfactant Science Series, 57, Marcel Dekker, New York, 1996.
39
2 Bikerman J.1., "The Unit of Foaminess", Transaction of the Faraday Society, 34, 1938:634-638.
3 Bikerman J.J., "Foams", Applied Physics and Engineering, 10, Springer-Verlag, Berlin, 1973.
4 Sun S.-C., "Frothing Characteristics of Pine Oils in Flotation", Transaction of the American Institution of Mining and Metallurgy Engineering (AIME), 256, 1952: 65-71.
5 Malysa K., Czubak-Pawlikowska J. and Pomianowski A., "Frothing properties of solutions and their influence on floatability", Proceedings of i h International Congress of Surface Active Substances, Moscow, 3, 1978: 513-520.
6 Malysa K., Lunkenheimer K., Miller R. and Hartenstein C., "Surface Elasticity and Frothability of n-octanol and n-octanoic Acid Solutions", Colloids and Surfaces, 3, 1981: 329-338.
7 Malysa K., Lunkenheimer K., Miller R. and Hempt C., "Surface Elasticity and Dynamic Stability ofWet Foams", Colloids and Surfaces, 16, 1985:9-20.
8 Sweet C., Van Hoogstraten J., Harris M. and Laskowski J.S., "The Effect of Frothers on Bubble Size and Frothability of Aqueous Solutions", Proceedings of the second UBC-McGill Bi-annual international symposium offundamentals ofmineral processing, Edited by Finch, J.A., Rao S.R. and Holubec, L, Sudbury, Ontario, August 17-19,1997: 235-245.
9 Comely B.A., Harris P.J., Bradshaw D.J. and Harris M.C., "Frother Characterization using Dynamic Surface Tension Measurements", International Journal Mineral Processing, 64, 2002: 81-100.
10 Johansson G., Pugh R.J., "The Influence of Particle Size and Hydrophobicity on the Stability of Mineralized Froths", International Journal Mineral Processing, 34, 1992: 1-21.
Il Gourram-Badri F., Conil P. and Morizot G., " Measurements of Selectivity due to Coalescence between Two Mineralized Bubbles and Characterization of MIBC Action on Froth Flotation", International Journal of Mineral Processing, 51, 1997: 197-208.
12 Barbian N., Ventura-Medina E. and CiUiers J.J., "Dynamic Froth Stability in Froth Flotation", Minerais Engineering, 16,2003:1111-1116.
13 Barbian N., Hadler K., Ventura-Medina E. and Cilliers J.J., "The Froth Stability Column: Linking Froth Stability and Flotation Performance", Minerais Engineering, 18,2005: 317-324.
40
14 Iglesias E., Anderez J., Forgiarini A. and Salager, J-L., "A New Method to Estimate the Stability ofShort-Life Foams", Collide and Surface, 98A, 1995: 167-174.
15 Xu Z., Zhang R., Zhu J. and Xi L., "A Study on Evaluation Method of Flotation Frother's Froth Stability", 15th Proceedings- Annual International Pittsburgh Coal Conference, 1998: 1573-1579.
16 Cho Y.S., Laskowski J.S., "Effect of Flotation Frothers on Bubble Size and Foam Stability", International Journal of Mineral Processing, 64,2002: 69-80.
17 Cho Y.S., Laskowski lS., "Bubble Coalescence and its Effect on Dynamic Foam Stability", The Canadian Journal ofChemical Engineering, 80, 2002: 299-305.
18 Laskowski J.S., Tlhone T., Williams P. and Ding K., "Fundamental Properties of the Polyoxypropylene Alkyl Ether Flotation Frothers", International Journal of Mineral Processing, 72,2003: 289-299.
19 Laskowski J.S., "Fundamental Properties of Flotation Frothers", Proceedings of the 22nd International Mineral Processing Congress (IMPC), Edited by Lorenzen L., Bradshaw D., Cape Town, South Africa, 29 September - 3 October, 2003: 788-797.
20 Bisshop J.P., White M.E., "Study of Particle Entrainment in Flotation Froths", Transactions of the Institution of Mining and Metallurgy, Section C: Mineral Processing and Extractive Metallurgy, 85, 1976: 191-4.
21 Clift R., Grace J.R. and Weber M.E., "Bubbles, Drops and Particles", Academic Press, New York, 1978.
22 Engelbrecht J.A., Woodburn E.T., "The Effects of Froth Height, Aeration Rate, and Gas Precipitation on Flotation", Journal of the South African Institute of Mining & Metallurgy, 76, 1975: 125-32.
23 Subrahmanyam T.V., Forssberg E., "Frother Performance in Flotation of Cu and Pb-Zn Ores", Transactions of the Institution of Mining and Metallurgy, Section C: Mineral Processing and Extractive Metallurgy, 97, 1988: 134-142.
24 Moyo, P. "Characterization of Frothers by Water Carrying Rate.", M.Eng. Thesis, Mc Gill University, 2005.
25 Melo F., Laskowski J.S., "Fundamental Properties of Flotation Frothers and Their Effect on Flotation", Minerais Engineering, 19,2006: 766-773.
26 Rahal K., Manlaping E. and Franzidis J.-P., "Effect of Frother Type and Concentration on the Water Recovery and Entrainment Recovery Relationship", Mineral & Metallurgical Processing, 18(3),2001: 138-141.
41
Chapter 4: Experimental Procedures
To characterize frothers by their bubble size control properties, a bubble column is used
equipped with instrumentation to measure bubble size, gas holdup and superficial gas
velocity. In this chapter a description of the column is given along with the
instrumentation and measurement techniques.
4.1: Bubble Column
4.1.1: Basic Apparatus
Figure 4.l(a) shows the basic set-up: a 238 cm x 10.16 cm diameter Plexiglas column.
The column was operated batch, the feed solution being introduced using a pump (Cole
Palmer model 7520-25). The bubble generator was a porous, stainless steel plate
spargertt that covered the base. A pressure transmitter (PBot) was placed 11.5 cm above
the sparger to monitor the total head in the column. A calibrated mass flow metertt (F)
was used to control the gas flow rate. Temperature sensors (Thermopar type K)
monitored input air (Tair) and solution temperature (Tsol) in the column. AU the tests were
carried out at temperature range of 20 ± 3 oC. Average of temperature between T air and
T sol and PBot was used to correct the air mass flow meter reading to the conditions of the
test. A visual basic pro gram was developed to convert air mass flowrate to volumetric
flowrate1• A differential pressure transmitter (~P) (Bailey model PTSDDD) was located
between 67 cm and 136.5 cm above the sparger to determine gas holdup. AU the
instruments were connected to an interface and signal conditioner, Opto 22. Readings
were carried out under steady state conditions and outputs were monitored every second
through a software package, Intellution IFix, instaUed in a PC. Data were stored and
processed using an in-house historical data extraction program.
tt See Appendix A for characterization ofa set of plate spargers. ti: Calibration curves are presented in Appendix B.
42

Bubble Viewer
1 Diffuser
Sampling Tube Light
0 0 o 0
• 0 0 ~ 10.16 em Column o 0
0
00 0 00 0
0 0 00 00
69.5em 0 0 0 0
0 112.5em 00 0
Solution 0 0
Make-up Tank 5.08 em Column
~0 ~ 1 Air Air
S.S Porous plate
(a) (b)
Figure 4.1: Experimental set-up: (a) basic; and (b) modified
4.1.2: Modified Apparatus
To limit the number ofbubbles entering the bubble viewer and thus improve reliability of
bubble size measurement by reducing bubble clustering, most bubble size measurements
were carried out in a modified set-up, Figure 4.1 (b). The column was divided into three
sections: base section, 56 cm x 10.16 cm, mid section 142 cm x 5.08 cm, and top section
81 cm x 10.16 cm. Gas holdup was measured in the mid section and bubble images were
taken from the top section.
43
4.2: Measurements
4.2.1: Gas Holdup
When the system contains no solids (as here), gas holdup can be accurately estimated
from the pressure difference, using Equation 4.1 2,
4.2.2: Bubble Size
M [; =-x100
g L (4.1)
The McGill bubble size analyser3,4 or "bubble viewer" was used (Figure 4.2). The bubble
viewer consists of a sampling tube attached to a viewing chamber with a window inclined
15° from the vertical (in this case). The viewing chamber (31.7 x 22.1 x 13.0 cm) is made
of PVC with two facing glass windows. To operate, the sampling tube is closed (note the
globe valve) and the assembly filled with water of similar temperature and chemistry
(e.g., the same frother and concentration) as present in the bulk (to preserve the bubble
environment and prevent bubble coalescence). The sample tube is immersed to the
desired location below the froth and is opened. Bubbles rise into the sampling tube by
buoyancy and enter the viewing chamber where they spread into a single plane after
contact with the inclined window. Due to diffused (note the 'filter') backlighting, bubbles
cast shadows, which are digitally imaged as the bubbles slide up the window.
44
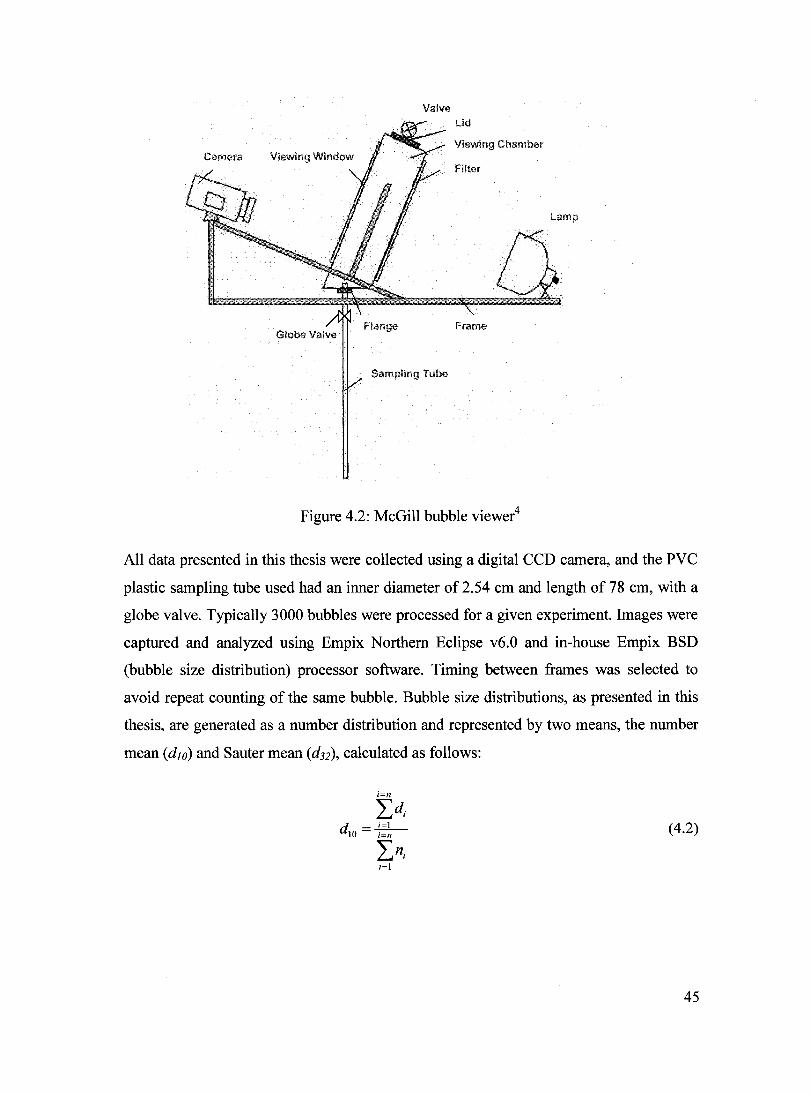
Valve Ud
Viewing Chamber Camera Viewing Window
Filter
Lamp
Frame
Sampling Tube
Figure 4.2: McGill bubble viewer4
AlI data presented in this thesis were collected using a digital CCD camera, and the PVC
plastic sampling tube used had an inner diameter of 2.54 cm and length of 78 cm, with a
globe valve. Typically 3000 bubbles were processed for a given experiment. Images were
captured and analyzed using Empix Northem Eclipse v6.0 and in-house Empix BSD
(bubble size distribution) processor software. Timing between frames was selected to
avoid repeat counting of the same bubble. Bubble size distributions, as presented in this
thesis, are generated as a number distribution and represented by two means, the number
mean (dJO) and Sauter mean (d32), calculated as follows:
(4.2)
45

(4.3)
where,
di: Equivalent spherical bubble diameter. For each bubble, the maximum and minimum
axes are computed by software and di is obtained from: db = V dmax
2 dmin , where dmax and
dmin are the maximum and minimum diameters, respectively.
n: Total number ofbubbles
4.2.3: Disengagement Technique
To help detect fine bubbles, at the end of sorne bubble size measurement tests the gas was
switched off, i.e., a disengagement technique was used. The bubble images were recorded
with time, and the time for bubbles to exit (disengage) the column was determined as a
function of frother dosage; the longer the disengagement time the greater the fine bubble
population. Images were captured each second to remove any duplication of bubbles in a
sequence of frames. The disengagement time was determined by adapting the image
analysis software to indicate when a frame is free ofbubbles.
4.3: Frother Types
Table 4.1 gives a summary of the frothers examined. Frothers were used as supplied.
Solutions (w/w) were made using Montreal tap water. Between each test, the column was
emptied and carefully cleaned.
46

Table 4.1: Summary of frother properties, suppliers and cost
Molecular Density Solubility Cost
Frother Structure Weight Supplier g/g.mol.
g/cm3 in water (US$/lb)§§
3 Methyl- Aliphatic 88.15 0.809 Moderate Sigma 0.55 I-butanol alcohol Aldrich I-Pentanol Aliphatic 88.15 0.815 Moderate Sigma 0.7
alcohol Aldrich MIBC Aliphatic 102.18 0.802 Low Sigma 0.9
alcohol Aldrich I-Hexanol Aliphatic 102.18 0.814 Low Sigma 0.9
alcohol Aldrich I-Heptanol Aliphatic 116.20 0.822 Slightly Sigma 0.9
alcohol low Aldrich 1-0ctanol Aliphatic 130.22 0.827 Slightly Sigma 0.85
alcohol low Aldrich Dowfroth Polyglycol 264.35 0.98 Very good The Dow 0.7
250 ether chemical company,
USA Dowfroth Polyglycol 206.29 0.97 Very good Flottee, 0.8
200 ether USA F150 Polyglycol 425 1.01 Very good Flottee, 1.1
USA
4.4: References
1 Acuna C., Ph.D. Student, Department of Mining, Metals and Materials
Engineering, McGill University, Personal Communication, 2004.
2 Finch J.A., Dobby G.S., "Column Flotation", Pergamon Press, New York, 1990.
3 Chen F., Gomez c.a. and Finch J.A., "Technical Note Bubble Size Measurement
in Flotation Machines", MineraIs Engineering, 14(4),2001: 427-432.
4 Hemandez-Aguilar J.R., Coleman R.G., Gomez c.a. and Finch J.A., "A
Comparison between Capillary and Imaging Techniques for Sizing Bubbles in
Flotation Systems", MineraIs Engineering, 17 (1), 2004: 53-61.
§§ Costs for bulk supplied by Frank Cappuecitti, Flottee, USA, June 2005
47
Chapter 5: Characterizing Frothers Using Gas Holdup
5.1: Abstract
A possible way to characterize (classify) frothers using gas holdup as a surrogate for
bubble size was explored. Nine industrial frothers with different chemical structures were
selected and tested in a bubble column equipped with instrumentation to measure gas
holdup and superficial gas velocity. A correlation between frother type and gas holdup
was observed: for alcohols, gas holdup increased with hydrocarbon chain length and the
effect was the same whether branched or straight chained; for polyglycols, gas holdup
increased with number of propoxy groups. A ranking using gas holdup gave the same
result as other frother characterization techniques.
5.2: Introduction
The importance of bubble size in controlling flotation efficiency has been recognized
since the early days l,2,3,4. Flotation or froth flotation commonly requires a range of
reagents. Frothers are surface-active agents (surfactants) used in flotation to decrease
bubble size and promote froth stability.
Flotation frothers refer to those organic chemical agents that when dissolved or dispersed
in water help produce small bubbles and form a froth. Frother molecules are heteropolar,
i.e., consist of two groups, polar and non-polar. The non-polar group is a hydrocarbon
chain, containing preferably at least six carbon atoms, which can either be straight,
branched or cyclic5• It is believed that the hydrocarbon chain must not be too long since
the resulting molecule is not soluble enough to be a frothing agent. Their heteropolar
structure causes them to adsorb at an air-water interface (i.e., bubble surface) to satisfy
both their polar and non-polar parts. This in turn stabilizes a water film on the bubble
surface, which helps retard coalescence (i.e., the coming together of two or more bubbles
to form larger bubbles)6. Pine-oïl and cresylic acid were among the earliest frothers, but
these have now been mostly replaced by synthetic alcohols and glycols.
48
The criteria for selecting frothers are changing. In the past, focus was mainly on cost,
availability and being environmentally friendly. These factors remain importlmt but other
parameters related to performance, notably the bubble size produced and the quality of
froth generated, are increasingly considered. However, there remains no accepted
technique for the characterization of frothers. As a result, terms such as "powerful" or
"selective," which have practical rather than scientific meaning are still commonly used
to describe the performance of frothers. To select frothers for industrial applications
empirical tests involving trial-and-error batch flotation tests are generally conducted.
Most characterizing techniques appear to be based on froth properties 7,8,9,10,11. Two types
of tests are generally used, dynamic and static. In dynamic tests, air is supplied
continuously and foam is allowed to grow until steady state is reached where the rate of
formation is in equilibrium with rate of decay (bubble bursting). In static tests the rate of
foam formation is zero: once the foam is formed, it is allowed to collapse without further
gas input or agitation.
There have been other measures. Espinosa- Gomez et al. 12 compared frothers on the basis
of bubble size reduction using gas holdup measurements. More recently Laskowski and
coworkers 13,14,15,16 have developed a procedure based on both the ability of frothers to
reduce bubble size and increase foam stability. Comely et al. 17 characterized frothers
using dynamic surface tension measurements. Recognizing the importlillce of water
transport by bubbles in flotation, Moyo18 classified frothers based on water carrying rate.
The method showed that the amount ofwater, transported as a layer on the bubble surface
and as a trailing wake, was related to frother type and gas holdup.
Even though these techniques have provided valuable insights into the role of frothers in
flotation, what continues to be lacking is a full understanding of the mechanism(s) by
which frothers act, and building from this, how to achieve the desired frother functions,
bubble size reduction and froth stability.
It is well known that when bubble size decreases (e.g., with an increase in frother
concentration) bubble rise velocity decreases and thus bubble retention time increases,
which is reflected by an increase in gas holdup19,20. Gas holdup, therefore can be a
49
surrogate for bubble size measurement and has the advantages of being simpler to
measure and can be adapted to be continuous and on-line12• Based on these observations,
in this work a possible way to characterize (classify) frothers using gas holdup was
explored.
5.3: Experimental
5.3.1: Apparatus
Figure 5.1 shows the set-up: a 238 cm x 10.16 cm diameter Plexiglas column. The
column was operated batch, the feed solution being introduced using a pump (Cole
Palmer model 7520-25). The bubble generator was a porous, stainless steel plate sparger
that covered the base. A pressure transmitter (PSot) was placed Il.5 cm above the sparger
to monitor the total head in the column. A calibrated mass flow meter (F) was used to
control the gas flow rate. Temperature sensors (Thermopar type K) monitored input air
(Tair) and solution temperature (Tsol) in the column. AlI the tests were carried out over the
temperature range 20 ± 3 OC. The average of the temperature between T air and T sol and
PSot was used to correct the air mass flow meter reading to the conditions of the test. A
Visual Basic pro gram was developed to convert air mass flowrate to volumetric flowrate.
A differential pressure transmitter (~P) (Bailey model PTSDDD) was located between 67
cm and 136.5 cm above the sparger to determine gas holdup. AlI of the above-mentioned
instruments were connected to an interface and signal conditioner, Opto 22. Readings
were carried out under steady state conditions and outputs were monitored every second
through a software package, Intellution IFix, installed in a PC. Data were stored and
processed using an in-house historical data extraction program.
50
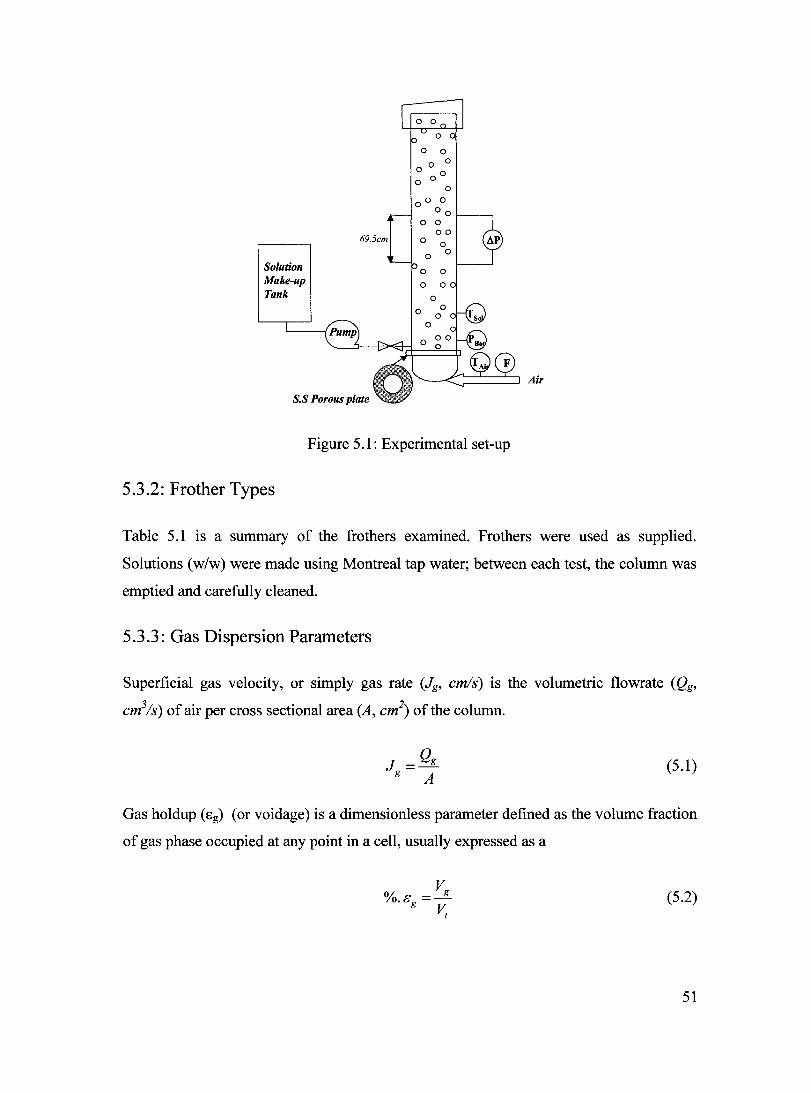
Solution Make-up Tank
69.5cm
S.S Porous plate
o 0 o 0
o 0 o 0
o 00 0
00 o 0
00 o 0
o 0
o 0
Figure 5.1: Experimental set-up
5.3.2: Frother Types
Table 5.1 is a summary of the frothers examined. Frothers were used as supplied.
Solutions (w/w) were made using Montreal tap water; between each test, the column was
emptied and carefully cleaned.
5.3.3: Gas Dispersion Parameters
Superficial gas velocity, or simply gas rate (Jg, cm/s) is the volumetrie flowrate (Qg,
cm3/s) of air per cross sectional area (A, cm2) ofthe column.
J = Qg g A
(5.1)
Gas holdup (8g) (or voidage) is a dimensionless parameter defined as the volume fraction
of gas phase occupied at any point in a cell, usually expressed as a
(5.2)
51

where Vg and Vt are volume fraction of gas phase and total volume, respective:ly.
When the system con,tains no solids, gas holdup (Eg) can be accurately measured from the
pressure difference, using Equation 5.32°,
M &g =-x100
L
Table 5.1: Summary of frother properties, suppliers and cost
Molecular Frother Structure Formula Weight
~gmol 3 Methyl- Aliphatie
CH3~HCH2bH2 88.15
I-butanol alcohol H3 H
I-Pentanol Aliphatie CH3CH2CH2CH2b:2
88.15 alcohol
MISC"n Aliphatic CH3~HCH2bHCH3 102.18 alcohol
H3 H
I-Hexanol Aliphatie CH3CH2CH2CH2CH2X:2
102.18 alcohol
I-Heptanol Aliphatie CH3CH2CH2CHzCH2CHzb:2
116.20 alcohol
1-0etanol Aliphatic CH3CH2CH2CH2CH2CH2CH2b:2 130.22 alcohol
Dowfroth Polyglyeol CH3(PO)+:n 40H 264.35 250 ether
Dowfroth Polyglyeol CH3(PO)30H 206.29 200 ether F150 Polyglyeol H(PO)70H 425
••• Costs for bulk supplied by, Frank Cappueeitti, Flottee, USA, June 2005 ttt Methyl isobutyl earbinol mpO=C3H60
Supplier
Sigma Aldrich
Sigma Aldrich
Sigma Aldrich
Sigma Aldrich
Sigma Aldrich
Sigma Aldrich
The Dow ehemieal company, USA Flottee, USA Flottee, USA
(5.3)
Cost*** (US$/lb)
0.55
0.7
0.9
0.9
0.9
0.85
0.7
0.8
1.1
52
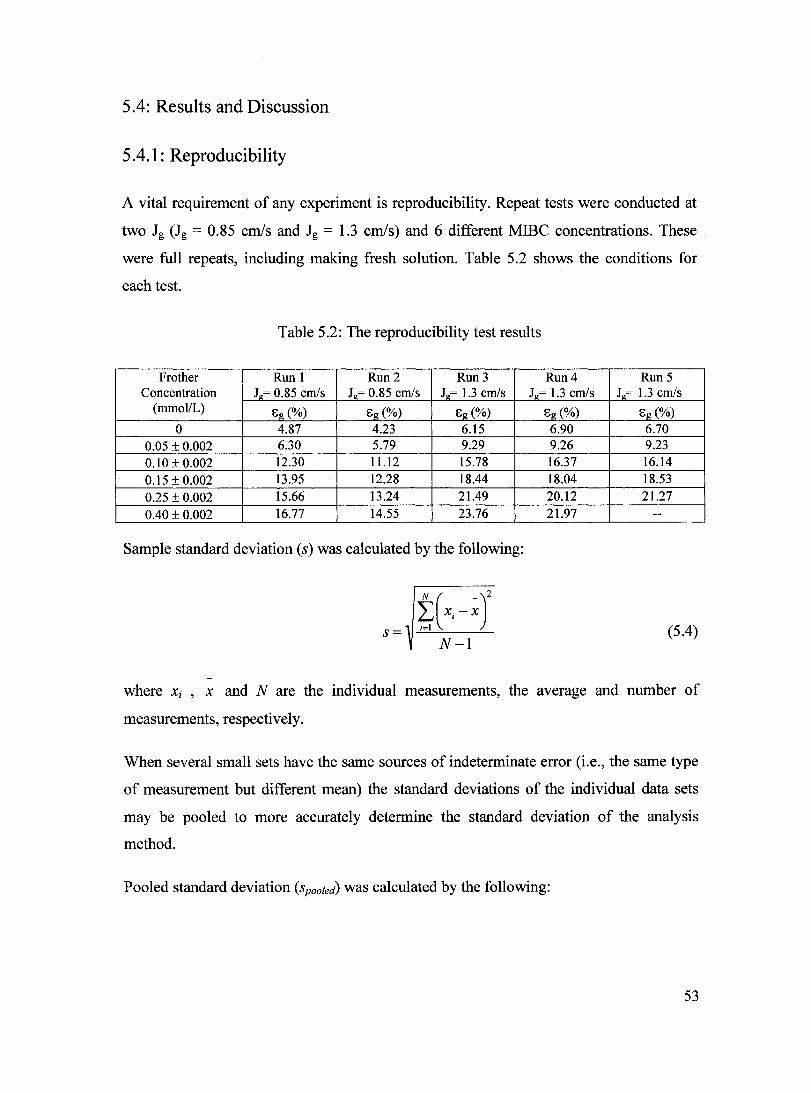
5.4: Results and Discussion
5.4.1: Reproducibility
A vital requirement of any experiment is reproducibility. Repeat tests were conducted at
two Jg (Jg = 0.85 cmls and Jg = 1.3 cmls) and 6 different MIBe concentrations. These
were full repeats, including making fresh solution. Table 5.2 shows the conditions for
each test.
Table 5.2: The reproducibility test results
Frother Run 1 Run2 Run3 Run4 Run5 Concentration Jg= 0.85 cmls Jg= 0.85 cm/s Jg= 1.3 cmls Jg= 1.3 cmls Jg= 1.3 cmls
(mmol/L) Eg(%) Eg(%) Eg(%) Eg(%) Eg(%) 0 4.87 4.23 6.15 6.90 6.70
0.05 ± 0.002 6.30 5.79 9.29 9.26 9.23
0.10 ± 0.002 12.30 11.12 15.78 16.37 16.14
0.15 ± 0.002 13.95 12.28 18.44 18.04 18.53
0.25 ± 0.002 15.66 13.24 21.49 20.12 21.27
0.40 ± 0.002 16.77 14.55 23.76 21.97 --
Sample standard deviation (s) was calculated by the following:
N-l (5.4) s=
where Xi , X and N are the individual measurements, the average and number of
measurements, respectively.
When several small sets have the same sources of indeterminate error (i.e., the same type
of measurement but different mean) the standard deviations of the individual data sets
may be pooled to more accurately determine the standard deviation of the analysis
method.
Pooled standard deviation (Spooled) was calculated by the following:
53
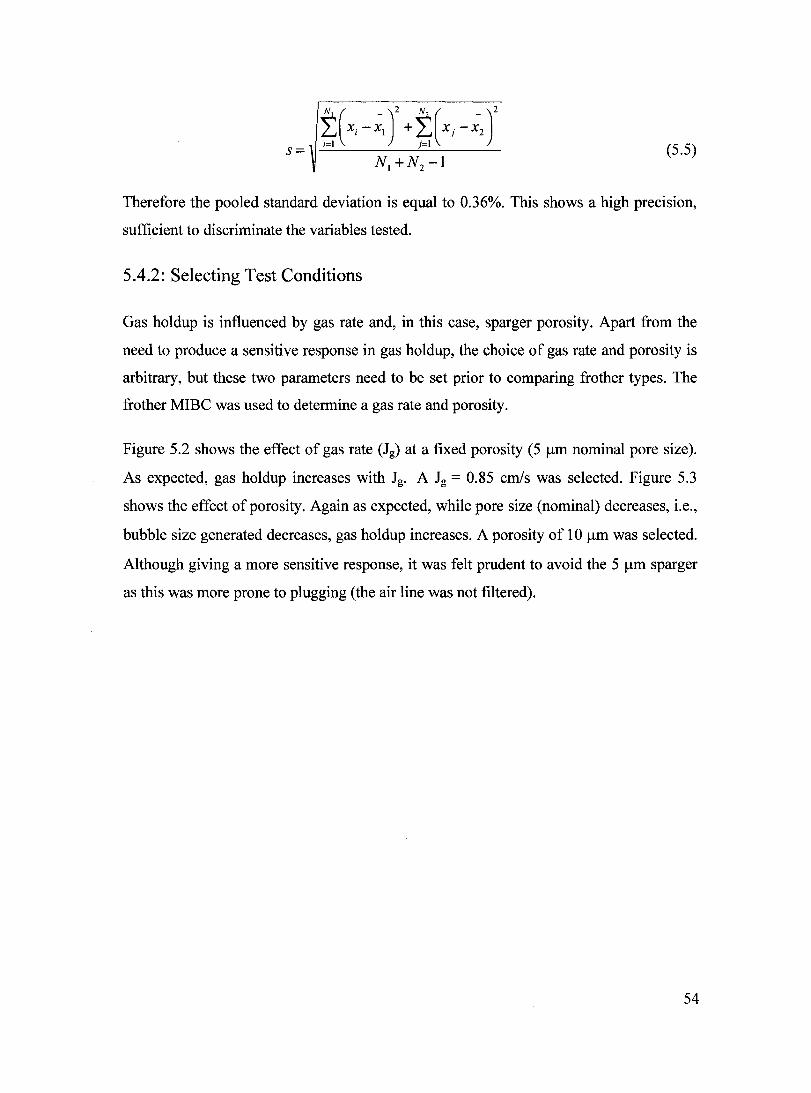
t(X; -;S + t(XJ -;,)'
NI +N2 -1 (5.5) s=
Therefore the pooled standard deviation is equal to 0.36%. This shows a high precision,
sufficient to discriminate the variables tested.
5.4.2: Selecting Test Conditions
Gas holdup is influenced by gas rate and, in this case, sparger porosity. Apart from the
need to pro duce a sensitive response in gas holdup, the choice of gas rate and porosity is
arbitrary, but these two parameters need to be set prior to comparing frotht~r types. The
frother MIBC was used to determine a gas rate and porosity.
Figure 5.2 shows the effect of gas rate (Jg) at a fixed porosity (5 J.lm nominal pore size).
As expected, gas holdup increases with Jg• A Jg = 0.85 cmls was selected. Figure 5.3
shows the effect of porosity. Again as expected, while pore size (nominal) decreases, i.e.,
bubble size generated decreases, gas holdup increases. A porosity of 10 J.lm was selected.
Although giving a more sensitive response, it was felt prudent to avoid the 5 J.lm sparger
as this was more prone to plugging (the air line was not filtered).
54
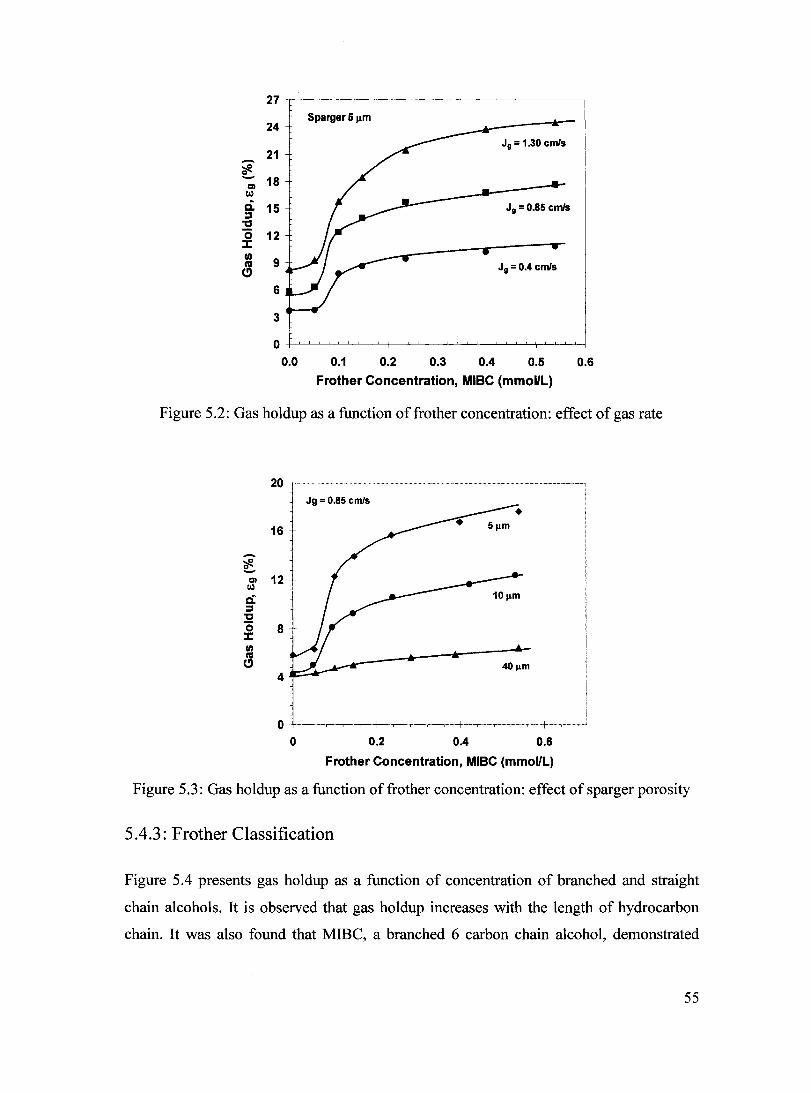
27
24 Sparger 5 !lm
J g = 1.30 cmls 21
~ - 18 al CI)
ci 15 J g = 0.85 cmls :::J
"C ë J:
12
IIJ 9 cv J g =0.4 cmls (!)
6
3
0 0.0 0.1 0.2 0.3 0.4 0.5 0.6
Frother Concentration, MIBC (mmoIlL)
Figure 5.2: Gas holdup as a function offrother concentration: effect of gas rate
20----~-~------ -~----._.--------.--.~------.-.--------------.,
Jg = 0.85 cm/s
16
-~ e.... al 12
CI)
ci :::J "C ë 8 J: IIJ cv
C) 40l1m 4
0 0 0.2 0.4 0.6
Frother Concentration, MIBC (mmoIlL)
Figure 5.3: Gas holdup as a function offrother concentration: effect ofsparger porosity
5.4.3: Frother Classification
Figure 5.4 presents gas holdup as a function of concentration of branched and straight
chain alcohols. It is observed that gas holdup increases with the length of hydrocarbon
chain. It was also found that MIBC, a branched 6 carbon chain alcohol, demonstrated
55
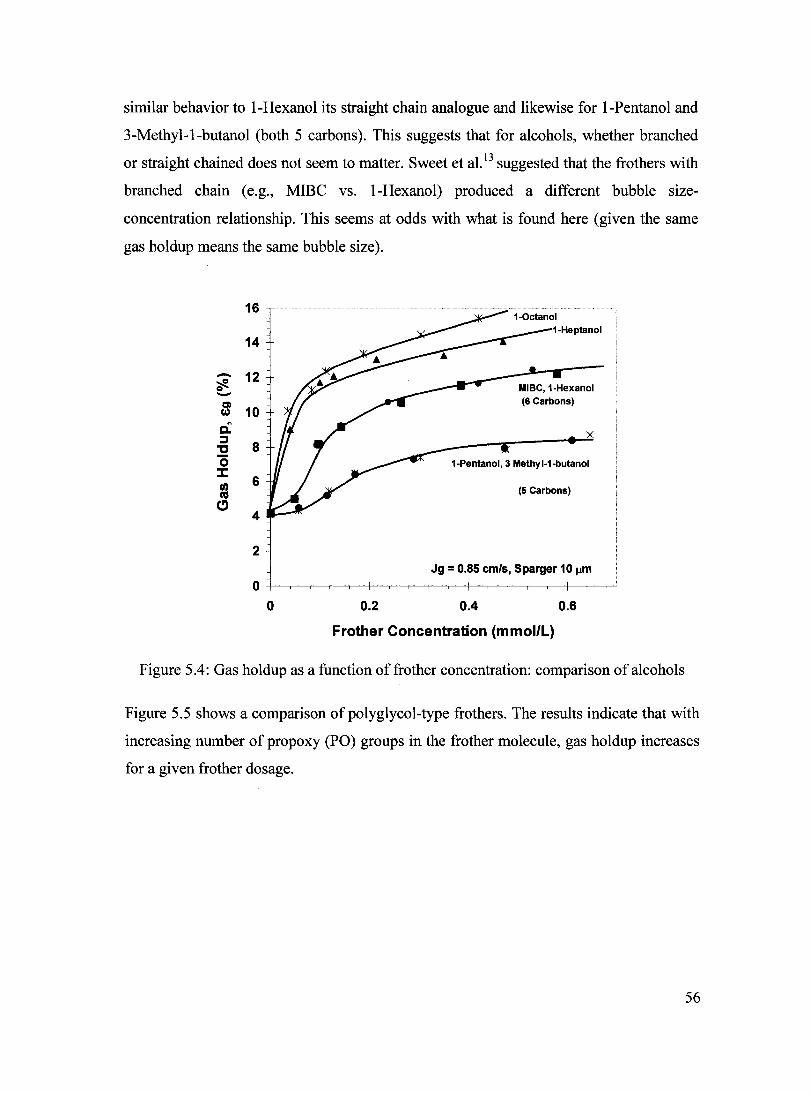
similar behavior to I-Hexanol its straight chain analogue and likewise for I-Pentanol and
3-Methyl-l-butanol (both 5 carbons). This suggests that for alcohols, whether branched
or straight chained does not seem to matter. Sweet et al. 13 suggested that the frothers with
branched chain (e.g., MIBe vs. I-Hexanol) produced a different bubble size
concentration relationship. This seems at odds with what is found here (given the same
gas holdup means the same bubble size).
16
14
- 12 ~ 0 -Cl
10 Col)
ci. ::l
8 " '0 ::I:
6 tn cv (5 Carbons)
C) 4
2 Jg = 0.85 cm/s, Sparger 10 lJIll
0
0 0.2 0.4 0.6
Frother Concentration (mmoI/L)
Figure 5.4: Gas holdup as a function offrother concentration: comparison ofalcohols
Figure 5.5 shows a comparison of polyglycol-type frothers. The results indicate that with
increasing number of propoxy (PO) groups in the frother molecule, gas holdup increases
for a given frother dosage.
56

16
14
- 12 ~ CI -CI
10 Col)
ci :::J
8 "C "0 J:
6 CI) cu (!)
4
2 Jg = 0.85 cm/s, Sparger 10 J.Inl
0
0 0.05 0.1 0.15 0.2 0.25 0.3
Frother Concentration (mmoI/L)
Figure 5.5: Gas holdup as a function offrother concentration: comparison ofpolyglycols
Figure 5.6 shows the results for aH frothers tested. There are clear differences in gas
holdup among the frothers. The order (ranking) is from the least effect (on increasing gas
holdup) by 5 carbon alcohols to greatest effect by F150. The order is essentiaHy the same
as that given in terms of bubble size13,16, dynamic foamability index (DFI)13,16 and water
carrying rate l8 as Table 5.3 demonstrates. The correspondence with bubble size lS
expected (it was the basis for using gas holdup). The similarity to DFI ranking lS
probably because as part of that determination the increase in solution volume upon
introducing gas is measured; this measure contains the effect of gas holdup (it there is no
foam buildup the increase in volume is entirely due to the gas holdup). As for water
carrying rate, Moyo 18 used the relationship with gas holdup as the means of dividing the
frothers into classes. The current findings support that gas holdup is related to frother
type.
57
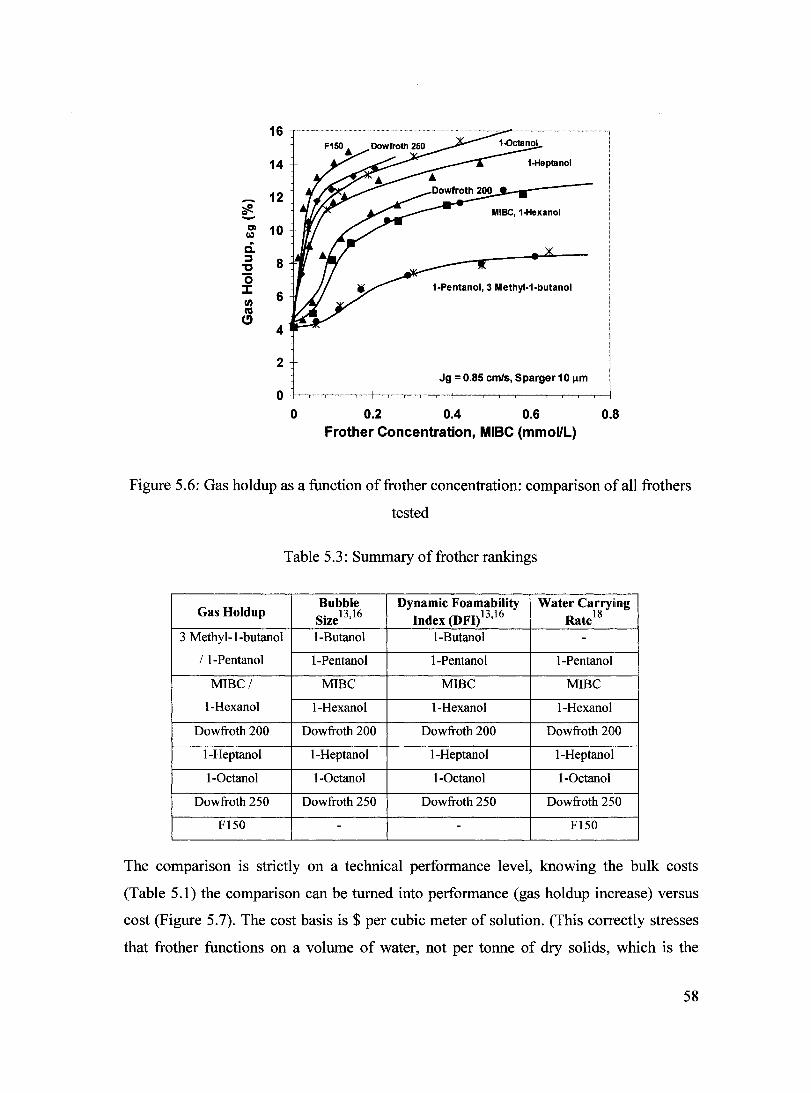
16 ' •••• m ... _ •• w ••••••••• _ ••• _
14
- 12 ?ft. -CI 10 CI)
ci: :::J 8 " '0
1-Pentanol, 3 Methyl-1-butanol ~ 6 II) ni
C) 4
2 Jg = 0.85 cmls, Sparger 10 !lm
0 0 0.2 0.4 0.6 o.n
Frother Concentration, MIBC (mmoIlL)
Figure 5.6: Gas holdup as a function of frother concentration: comparison of aH frothers
tested
Table 5.3: Summary offrother rankings
Gas Holdup Bubble Dynamic Foamability Water Carryiing
S' 13,16 Index (DFI)13,16 RatelS Ize 3 Methyl-l-butanol I-Butanol I-Butanol -
/ I-Pentanol I-Pentanol I-Pentanol I-Pentanol
MIBe/ MIBe MIBe MIBe
I-Hexanol I-Hexanol I-Hexanol I-Hexanol
Dowfroth 200 Dowfroth 200 Dowfroth 200 Dowfroth 200
I-Heptanol I-Heptanol I-Heptanol I-Heptanol
l-Octanol l-Octanol l-Octanol l-Octanol
Dowfroth 250 Dowfroth 250 Dowfroth 250 Dowfroth 250
F150 - - F150
The comparison is strictly on a technical performance level, knowing the bulk costs
(Table 5.1) the comparison can be tumed into performance (gas holdup increase) versus
cost (Figure 5.7). The cost basis is $ per cubic meter of solution. (This correctly stresses
that frother functions on a volume of water, not per tonne of dry solids, which is the
58
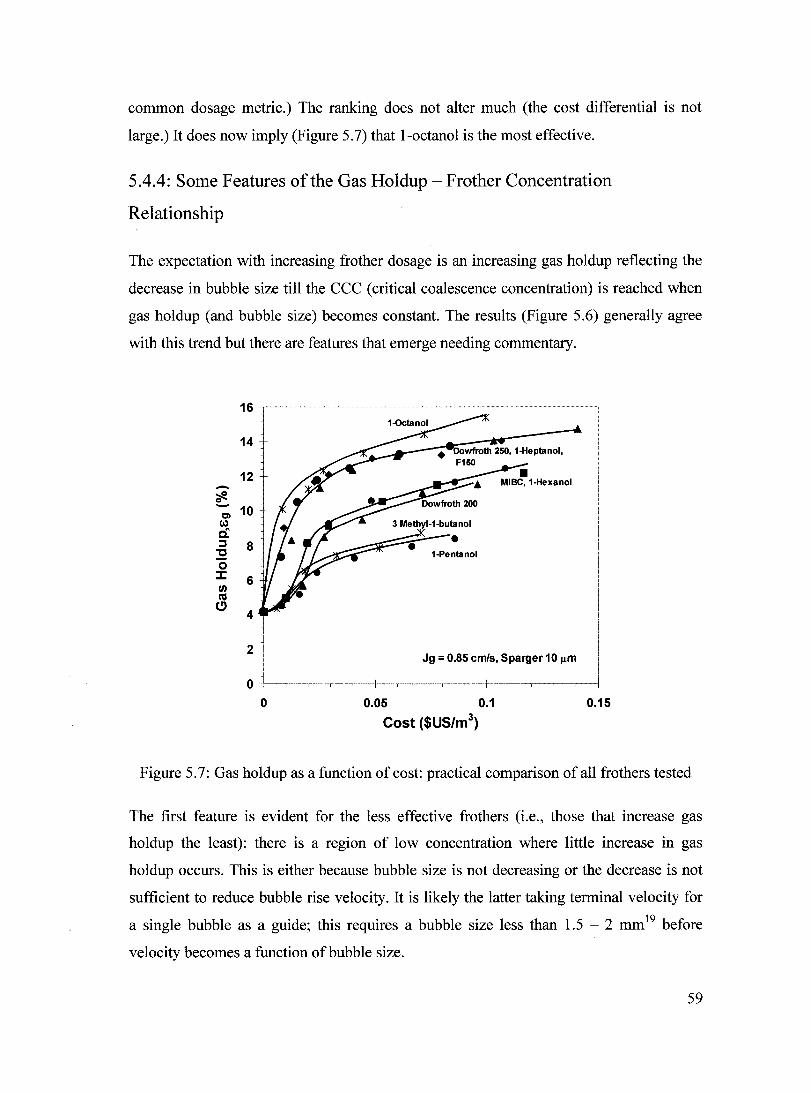
common dosage rnetric.) The ranking does not alter rnuch (the cost differential is not
large.) It does now irnply (Figure 5.7) that l-octanol is the rnost effective.
5.4.4: Sorne Features of the Gas Holdup - Frother Concentration
Relationship
The expectation with increasing frother dosage is an increasing gas holdup reflecting the
decrease in bubble size till the CCC (critical coalescence concentration) is reached when
gas holdup (and bubble size) becornes constant. The results (Figure 5.6) generaIly agree
with this trend but there are features that ernerge needing cornrnentary.
16
14
12 -~ 0 - 10 Cl Coll c: :::J 8 'C
3 Methyl·1-butanol . ____ ~~=i.~=-. 1-Pentanol
0 :::I: ln
6 cu
(!) 4
2 Jg = 0.85 cm/s, Sparger 10 ~m
0
0 0.05 0.1 0.15
Cost ($US/m3)
Figure 5.7: Gas holdup as a function of cost: practical cornparison of aIl frothers tested
The first feature is evident for the less effective frothers (i.e., those that increase gas
holdup the least): there is a region of low concentration where little increase in gas
holdup occurs. This is either because bubble size is not decreasing or the decrease is not
sufficient to reduce bubble rise velocity. It is likely the latter taking terminal velocity for
a single bubble as a guide; this requires a bubble size less than 1.5 - 2 rnrn19 before
velocity becornes a function ofbubble size.
59

At higher concentration, for all frothers the second feature is evident: the gas holdup
continues to increase steadily, apparently not reaching a maximum. This means either
that the bubble size continues to decrease with increasing frother dosage or there is sorne
unanticipated phenomenon causing the velo city of the bubble in the swarm to decrease.
To help answer, bubble size measurements are required. Initial measurement attempts
were thwarted in the basic set-up as the bubble population in sorne situations was too
numerous for clear discrimination between bubbles.
The next chapter shows how the apparatus was modified to solve this problem. The
bubble size information is then used to probe the two features described. The data were
also interrogated to answer whether at equal gas holdup the bubble size was the same
regardless of frother type. This is the expected situation, as, for example, use of drift flux
analysis to estimate bubble size assumes21,22. However, at least one reference challenging
this is known23. Given the assumed correlation between gas holdup and bubble Slze
applied in this Chapter this needs assessing.
5.5: Conclusions
A possible way to characterize frothers using gas holdup was explored. A correlation
between frother type and gas holdup was observed: for alcohols gas holdup increases
with hydrocarbon chain length and is independent of whether the chain is branched or
not; for polyglycols, gas holdup increases with number of propoxy (PO) groups.
A ranking of frothers based on gas holdup was identical to that given by more elaborate
techniques. The gas holdup - concentration trends are more or less as anticipated from
the relative impact of the frothers on bubble size but sorne unexpected features are noted.
5.6: Acknowledgments
This work was funded by Chair Renewal Grant, under the Collaborative Research and
Development pro gram of NSERC (Natural Sciences and Engineering Research Council
of Canada) sponsored by Inco, Noranda, Falconbridge, Teck Cominco, COREM, and
60

SGS Lakefield Research. Assistance of Mr. Claudio Acuna in developing software is also
gratefully acknowledged.
5.7: References
1 Ahmed N., Jameson G.J., "The Effect of Bubble Size on the Rate of Flotation of Fine Particles", International Journal of Mineral Processing, 14 (3), 1985:195-215.
2 Dobby G.S., Finch J.A., "Particle Collection in Columns - Gas Rate and Bubble Size Effects", Canadian Metallurgical Quarterly, 25 (1), 1986: 9-13.
3 Yoon R.H., Luttre! H.H., "The Effect of Bubble Size on Fine Particle Flotation", Frothing inflotation: A volume in honour of Jan Leja. Edited by J.S. Laskowski, 5, 1989: 101-122.
4 Fuerstenau D.W., "Advances in Flotation Technology", Proceedings of Symposium of Advances in Flotation Technology held at the SME Annual Meeting, Edited by Parekh B.K. and Miller J.D., Society for Mining Metallurgy and Exploration, Littleton, Colorado, March 1-3, 1999: 3-21.
5 Taggart A. F., "Handbook of Mineral Dressing", Section 12, John Wiley and Sons, New York, 1947.
6 Harris P.J., "Frothing Phenomena and Frothers", in Principles of Frothers, Edited by R.P. King, Chapter 13, 1982: 237-250.
7 Bikerman J.J., "The Unit of Foaminess", Transaction of the Faraday Society, 34, 1938: 634-638.
8 Sun S.-C., "Frothing Characteristics of Pine Oils in Flotation", Transaction of the American Institution of Mining and Metallurgy Engineering (AIME), 256, 1952: 65-71.
9 MCLaughlin J.D., Quinn P., Robertson G. and Agar G.E., "Frother Evaluation", 18th
International Mineral Processing Congress, Sydney, Australia, May 23-28, 3, 1993: 637-641.
10 Iglesias E., Anderez J., Forgiarini A. and Salager J-L., "A New Method to Estimate the Stability of Short-Life Foams", Colloids and Surfaces - A, 98, 1995: 167-174.
Il Barbian N., Ventura-Medina E. and Cilliers J.J., "Dynamic Froth Stability in Froth Flotation", Minerais Engineering, 16,2003:1111-1116.
12 Espinosa-Gomez R., Finch J.A. and Bemert W., "Coalescence and Froth Collapse in the Presence of Fatty Acids", Colloids and Surfaces, 32 (3/4), 1988:197-209.
61

13 Sweet C., Van Hoogstraten 1., Harris M. and Laskowski J.S., "The Effect of Frothers on Bubble Size and Frothability of Aqueous Solutions", Proceedings of the second UBC-McGill Bi-annual international symposium of fundamentals of minerai processing, Edited by Finch, J.A., Rao S.R. and Holubec, L, Sudbury, Ontario, August 17-19, 1997: 235-245.
14 Cho Y.S., Laskowski J.S., "Effect of Flotation Frothers on Bubble Size and Foam Stability", International Journal of Mineral Processing, 64, 2002: 69-80.
15 Laskowski J.S., "Fundamental Properties of Flotation Frothers", Proceedings of the 22nd International Mineral Processing Congress (IMPC), Edited by Lorenzen L., Bradshaw D., Cape Town, South Africa, 29 September- 3 October, 2003: 788-797.
16 Laskowski 1.S., Tlhone T., Williams P. and Ding K., "Fundamental Properties of the Polyoxypropylene Alkyl Ether Flotation Frothers", International Journal of Mineral Processing, 72,2003: 289-299.
17 Comely B.A., Harris P.J., Bradshaw D.J. and Harris M.C., "Frother Characterization using Dynamic Surface Tension Measurements", International Journal of Mineral Processing, 64,2002: 81-100.
18 Moyo P. "Characterization of Frothers by Water Carrying Rate." M.Eng. Thesis, Mc Gill University, 2005.
19 Clift R., Grace J.R. and Weber M.E., "Bubbles, Drops and Particles", Academic Press, New York, 1978.
20 Finch J.A., Dobby G.S., "Column Flotation", Pergamon Press, New York, 1990.
21 Dobby G.S., Yianatos J.B. and Finch J.A., "Estimation of Bubble Diameter in Flotation Columns from Drift Flux Analysis", Canadian Metallurgical Quarterly, 27 (2), 1988: 85-90.
22 Banisi S., Finch J. A., "Technical Note: Reconciliation of Bubble Size Estimation Methods Using Drift Flux Analysis", Minerais Engineering, 7 (12), 1994: 1555-1559.
23 Zhou Z.A., Egiebor N.O. and Plitt, L.R., "Frother Effects on Bubble Motion in a Swarm", Canadian Metallurgical Quarterly, 32 (2), 1993: 89-96.
62
Chapter 6: Correspondence of Gas Holdup and Bubble Size in
Presence of Different Frothers
6.1: Abstract
Chapter 5 has shown that frothers can be classified (ranked) according to gas holdup. The
argument in using gas holdup is a correspondence with bubble size. This is examined in
this chapter. With MIBC as an example, the two regions identified in Chapter 5 are
examined: l, low concentration where gas holdup varied little, and II, high concentration
where a steady, continuous increase in gas holdup occurred. By adapting the test
apparatus, bubble size data are obtained which contribute to an explanation. Another test
is to examine whether the bubble size is the same at equal gas holdup regardless of
frother type. This is shown not to be the case, for example F150 producing significantly
larger bubbles than I-Pentanol. This is not predicted, drift flux analysis for example,
assumes a unique relationship among bubble size, gas holdup and gas rate. Possible
explanations are discussed.
6.2: Introduction
In Chapter 5 it was shown that the gas holdup - concentration relationship was dependent
on frother type. This permitted a ranking of frothers, which corresponded to those
reported using other measures. Thus it was shown that the simple measure of gas holdup
could be used to characterize frothers.
This use of gas holdup was predicated on its relationship with bubble size: as bubble size
decreases, gas holdup increases. In Chapter 5, the relationship was assumed but not tested
and there were sorne intriguing results that raised sorne question regarding the
relationship that required further exploration. One was the insensitivity of gas holdup at
low concentration with the 'lower ranked' frothers; another was the steady increase in gas
holdup at higher concentration, evident for aH frothers. In this chapter those two
observations are examined.
63
An additional point, which was also raised was whether the bubble size at equal gas
holdup (and gas rate) is the same regardless of frother type. This is the common
consumption, for example in applying drift flux analysis to estimate bubble size. 1
To address these points the set-up had to be modified as at high population of smaIl
bubbles there was significant bubble clustering which the CUITent software cannot
discriminate (clusters are eliminated) leading to poor counting statistics (as weIl as
possible biasing as clusters may not contain a random sample ofindividual bubbles).
The modified apparatus is described. It is tested to make sure the results are the same as
in the 'basic' set-up. Using MIBC as an example, the low and high concentration region
effects are probed. And, bubble size data at equivalent gas holdup (6% and 8%) are
compared across a suite of frothers.
6.3: Experimental
6.3.1: Apparatus
The basic and modified test rigs are shown in Figure 6.1 (a) and (b), respectively. The
basic set-up is as described in Chapter 5.
The modification was designed to reduce the number of bubbles entering the bubble
viewer and thus improve reliability of bubble size measurement. The same column was
divided into three sections: base section (as before), 56 cm x 10.16 cm, mid section (new)
142 cm x 5.08 cm, and top section (as before) , 81 cm x 10.16 cm. Gas holdup was
measured in the mid section and bubble images were taken from the top section, where
they had spread and thus the number sampled and entering the viewing chamber is
reduced. The angle connecting the two end sections to the mid section was shaIlow (70)
to limit bubble collision and possible coalescence in the transition. It will b~: verified that
the gas holdup - gas rate relationship measured in the mid section is the same as in the
basic set-up (i.e., the source of the original data in Chapter 5). AlI the measurement
devices and instruments are the same as in the basic set-up. In this Chapter just the
bubble size measurement is described.
64
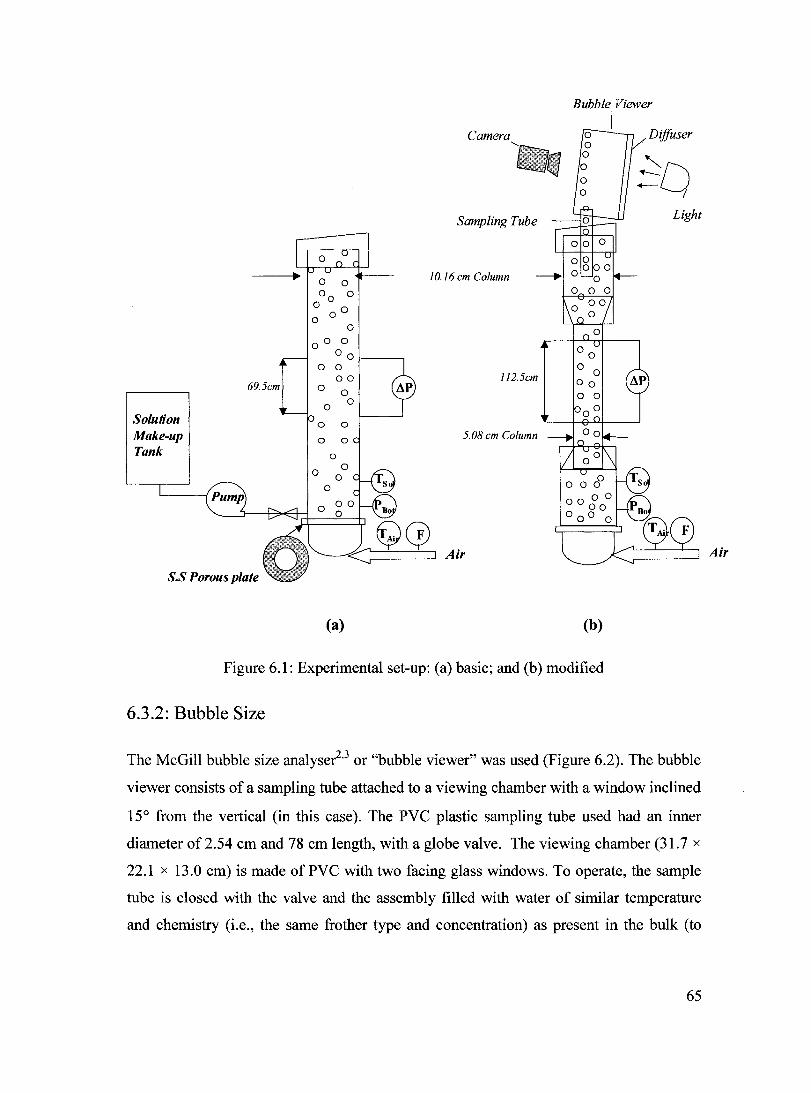
Bubble Viewer
1
. Diffuser Camera
Sampling Tube Light
0 0 10.16 em Co/umn
00
0
o 0 o 0
0 0 00 0
00 00
0 0 0 0
00 112.5em 69.5em 0 00
0 0 0 0
0
Solution 0 0
Make-up 5.08 em Co/umn
Tank
~0 <: 1 Air
S.S Porous plate
(a) (b)
Figure 6.1: Experimental set-up: (a) basic; and (b) modified
6.3.2: Bubble Size
The McGill bubble size analyser2,3 or "bubble viewer" was used (Figure 6.2). The bubble
viewer consists of a sampling tube attached to a viewing chamber with a window inclined
15° from the vertical (in this case). The PVC plastic sampling tube used had an inner
diameter of2.54 cm and 78 cm length, with a globe valve. The viewing chamber (31.7 x
22.1 x 13.0 cm) is made ofPVC with two facing glass windows. To operate, the sample
tube is closed with the valve and the assembly filled with water of similar temperature
and chemistry (i.e., the same frother type and concentration) as present in the bulk (to
65
Air
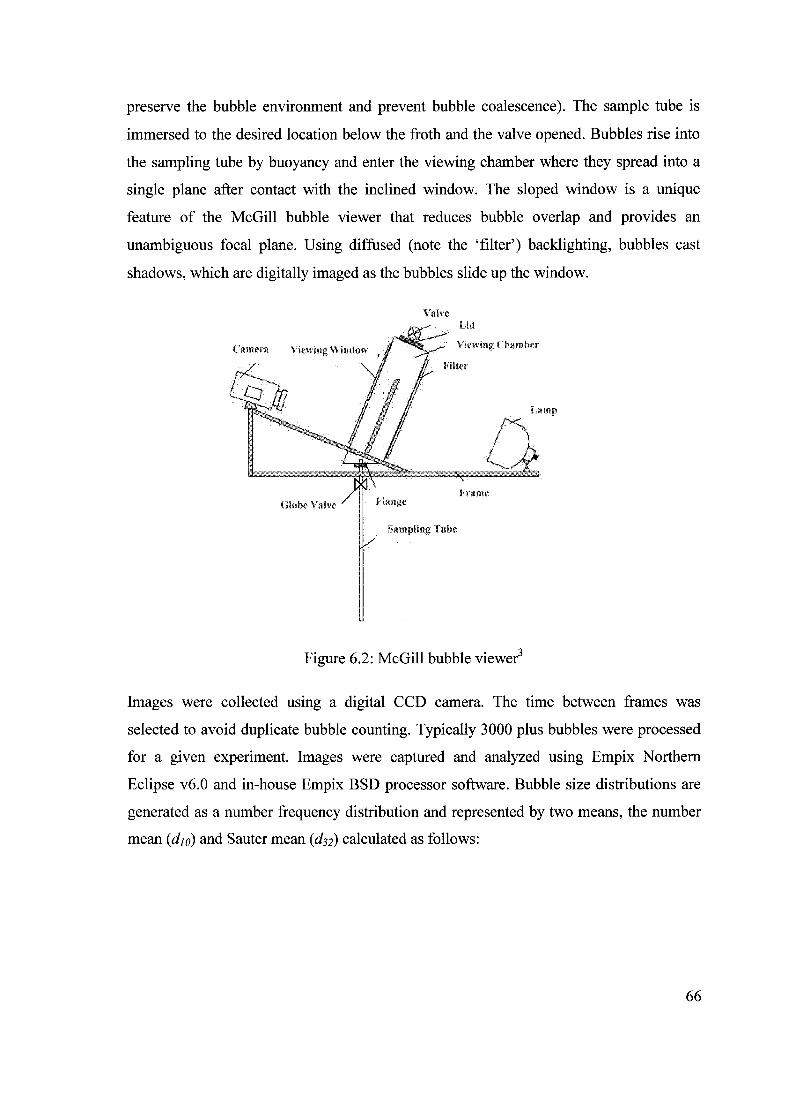
preserve the bubble environment and prevent bubble coalescence). The sample tube is
immersed to the desired location below the froth and the valve opened. Bubbles rise into
the sampling tube by buoyancy and enter the viewing chamber where they spread into a
single plane after contact with the inclined window. The sloped window is a unique
feature of the McGill bubble viewer that reduces bubble overlap and provides an
unambiguous focal plane. Using diffused (note the 'filter') backlighting, bubbles cast
shadows, which are digitally imaged as the bubbles slide up the window.
Valve ut!
CalUrn, . Vicwing Clllllllher
Lamp
Fra.me Glohe Valve
SlIlllpling Tube
Figure 6.2: McGill bubble viewer3
Images were collected using a digital CCD camera. The time between frames was
selected to avoid duplicate bubble counting. Typically 3000 plus bubbles were processed
for a given experiment. Images were captured and analyzed using Empix Northem
Eclipse v6.0 and in-house Empix BSD processor software. Bubble size distributions are
generated as a number frequency distribution and represented by two means, the number
mean (dIa) and Sauter mean (d32) calculated as follows:
66

(6.1)
(6.2)
where,
di: Equivalent spherical bubble diameter. For each bubble, the maximum and minimum
axes are computed by software and di is obtained from: db = V dmax 2 dmin , where dmax and
dmin are the maximum and minimum diameters, respectively.
n: Total number ofbubbles
6.3.3: Disengagement Technique
To help detect fine bubbles at the high frother concentration conditions, at the end of a
test the gas was switched off and the bubble images were recorded over time till the
bubbles aIl had exited the column. This is known as a 'disengagement' technique and the
time to exit is the disengagement time (the longer the time the greater the fine bubble
population). The procedure was repeated for a range in frother (MIBC) concentration.
Images were captured each second to remove any duplication of bubbles in a sequence of
frames. The disengagement time was deterrnined by adapting the image analysis software
to indicate when a frame is free of bubbles.
6.3.4: Comparison of Egfdb for the Frother Types
Table 6.1 is a summary of the frothers examined, chosen to give a wide range of gas
holdup - frother concentration (Figure 5.6). The experimental conditions were as in
Chapter 5. Agas holdup was selected that was attained by aIl frother types at the selected
conditions (Jg and sparger porosity) used in Chapter 5 in order to compare db.
67
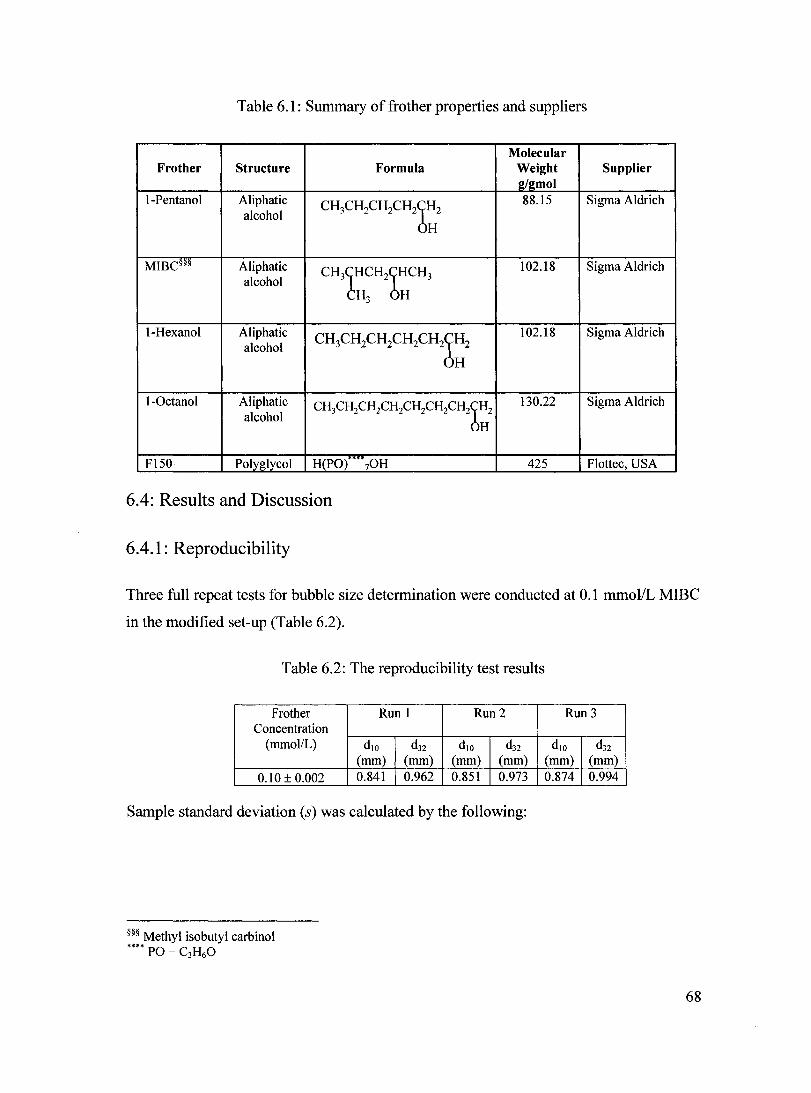
Table 6.1: Summary of frother properties and suppliers
Molecular Frother Structure Formula Weight Supplier
g/gmol 1-Pentanol Aliphatic
CH3CH2CH2CH2X:2 88.15 Sigma Aldrich
alcohol
MIBC999 Aliphatic CH31HCH2LHCH3
102.18 Sigma Aldrich alcohol
H3 H
1-Hexanol Aliphatic eH3eH2eH2eH2eH2~:2
102.18 Sigma Aldrich alcohol
1-0ctanol Aliphatic CH3CH2CH2CH2CH2CH2CH2b:2
130.22 Sigma Aldrich alcohol
F150 Polyglycol H(PO) 70H 425 Flottee, USA
6.4: Results and Discussion
6.4.1: Reproducibility
Three full repeat tests for bubble size determination were conducted at 0.1 mmollL MIBe
in the modified set-up (Table 6.2).
Table 6.2: The reproducibility test results
Frother Run 1 Run2 Concentration
(mmol/L) d lO d32 d lO d32 (mm) (mm) (mm) (mm)
0.10 ± 0.002 0.841 0.962 0.851 0.973
Sample standard deviation (s) was calculated by the following:
§§§ Methyl isobutyl carbinol •••• PO = C
3H
60
Run3
dlO d32 (mm) (mm) 0.874 0.994
68
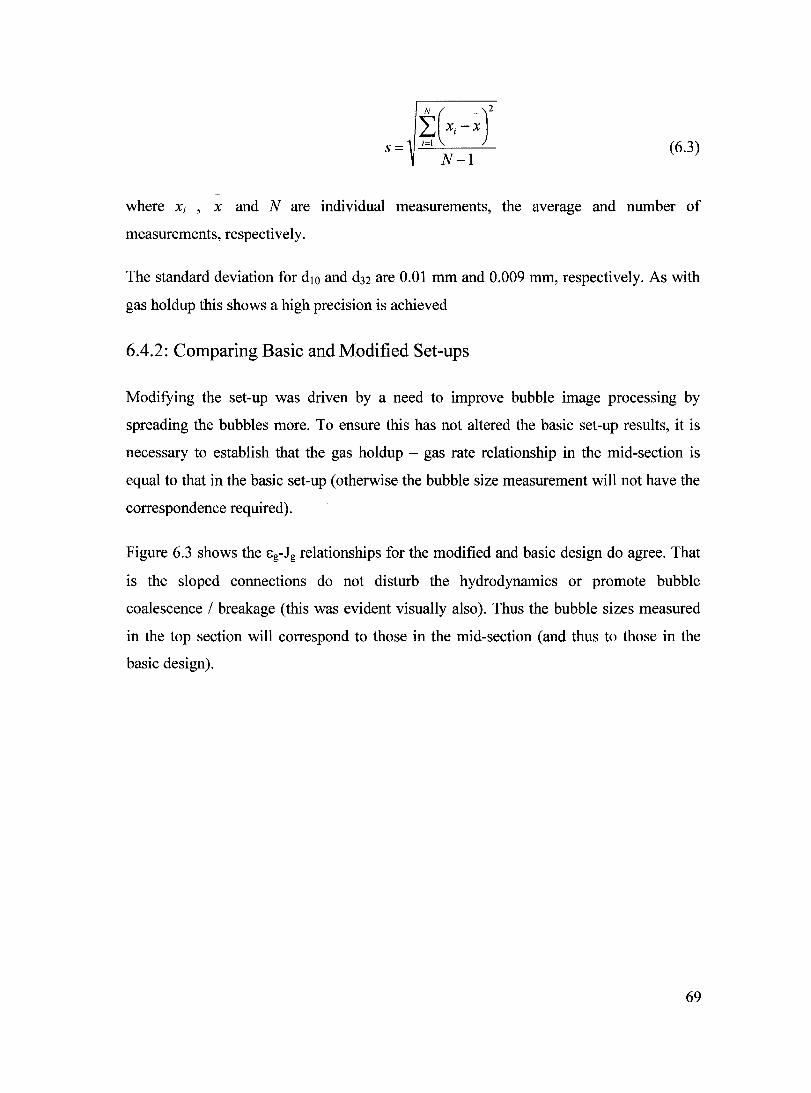
N-1 (6.3) s=
where Xi , X and N are individual measurements, the average and number of
measurements, respectively.
The standard deviation for d IO and d32 are 0.01 mm and 0.009 mm, respectively. As with
gas holdup this shows a high precision is achieved
6.4.2: Comparing Basic and Modified Set-ups
Modifying the set-up was driven by a need to improve bubble image processing by
spreading the bubbles more. To ensure this has not altered the basic set-up results, it is
necessary to establish that the gas holdup - gas rate relationship in the mid-section is
equal to that in the basic set-up (otherwise the bubble size measurement will not have the
correspondence required).
Figure 6.3 shows the Eg-Jg relationships for the modified and basic design do agree. That
is the sloped connections do not disturb the hydrodynamics or promote bubble
coalescence / breakage (this was evident visually also). Thus the bubble sizes measured
in the top section will correspond to those in the mid-section (and thus to those in the
basic design).
69
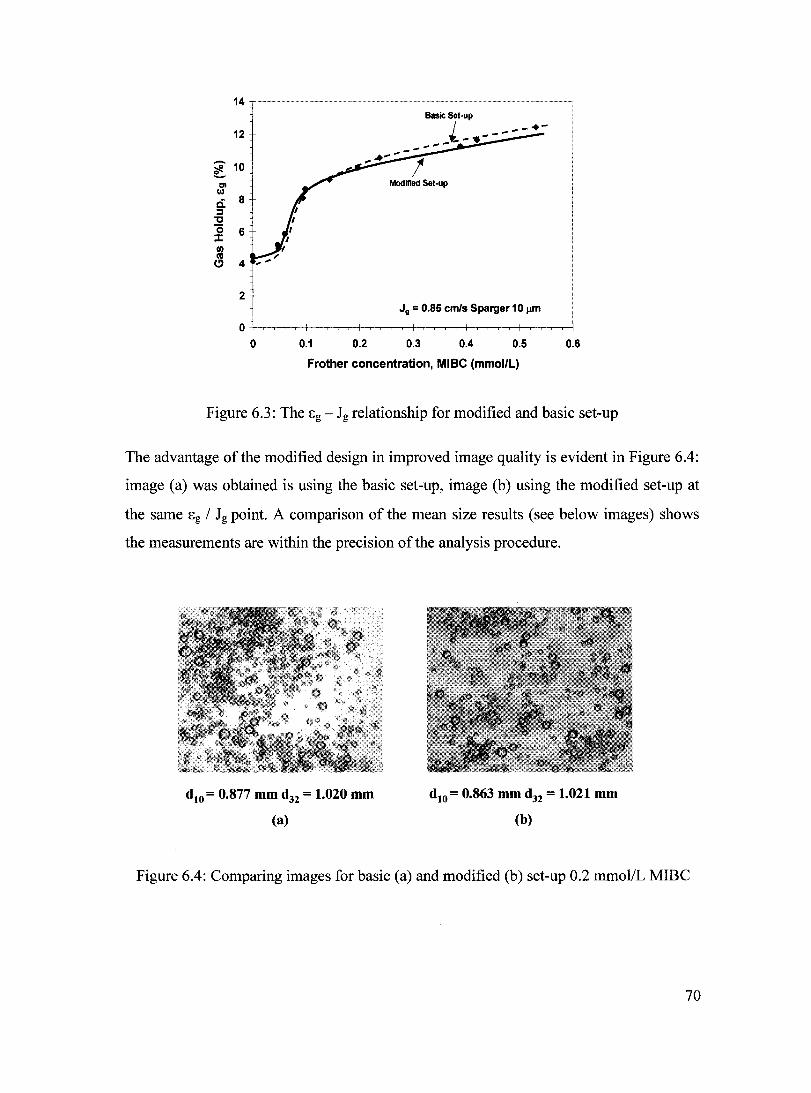
14
12
~ 10 ~
CI II)
ci. 8 ::::1 -C (5 6 J: fi) l'II
C!) 4
2
0 0 0.1
Basic Set·up
/ --.. -i.- .. -_ .... ... --....... .".-... !
Modified Set·up
J g = 0.85 cmls Sparger 10 !lm
0.2 0.3 0.4 0.5
Frother concentration, MIBC (mmol/L)
0.6
Figure 6.3: The 8g - Jg relationship for modified and basic set-up
The advantage of the modified design in improved image quality is evident in Figure 6.4:
image (a) was obtained is using the basic set-up, image (b) using the modi:fied set-up at
the same 8 g / Jg point. A comparison of the mean size results (see below images) shows
the measurements are within the precision of the analysis procedure.
d lO = 0.877 mm d32 = 1.020 mm
(a)
d lO = 0.863 mm d32 = 1.021 mm
(b)
Figure 6.4: Comparing images for basic (a) and modified (b) set-up 0.2 mmol/L MIBC
70

6.4.3: The Low and High Frother Concentration Regions
The frother selected was MIBC as it showed the two Sg regions (low and high
concentration) that were to be explored (Figures 5.2 and 5.6). The gas holdup and bubble
size versus concentration relationships determined in the modified set-up are shown in
Figure 6.5.
14 ' , "" ........... " ......... "" ... m ................... um ." ........... "' ....... " ............................. ~ .. ,.,., :~.5
12 3 -E E - 10 2.5 -~ 0
0 .... - "'0 CD tA:) CI)
c. 8 :2 .~ ::::1 CI)
:2 ~ 0 6 '1.5 oC :I: oC 1/) ::::1 ca
4 1 m
(!) 1:: ca CI)
2 10.5 :lE J g = 0.85 cm/s Sparger 10 Ilm
0 10
0 0.2 0.4 0.6 0.8 1
Frother Concentration, MIBC (mmoI/L)
Figure 6.5: Gas holdup and bubble size vs. frother concentration (MIBC)
1) Low Concentration region
Although not as definitive, as was seen in Figures 5.2 and 5.6, Figure 6.5 shows that gas
holdup was less influenced by frother (MIBC) dosage initially, up to ca. 0.08 mmol/L,
than beyond.
The bubble size corresponding to the start of the more rapid increase in gas holdup is
about 1.5 mm. From the relationship between bubble size and terminal velocity4, it is
71
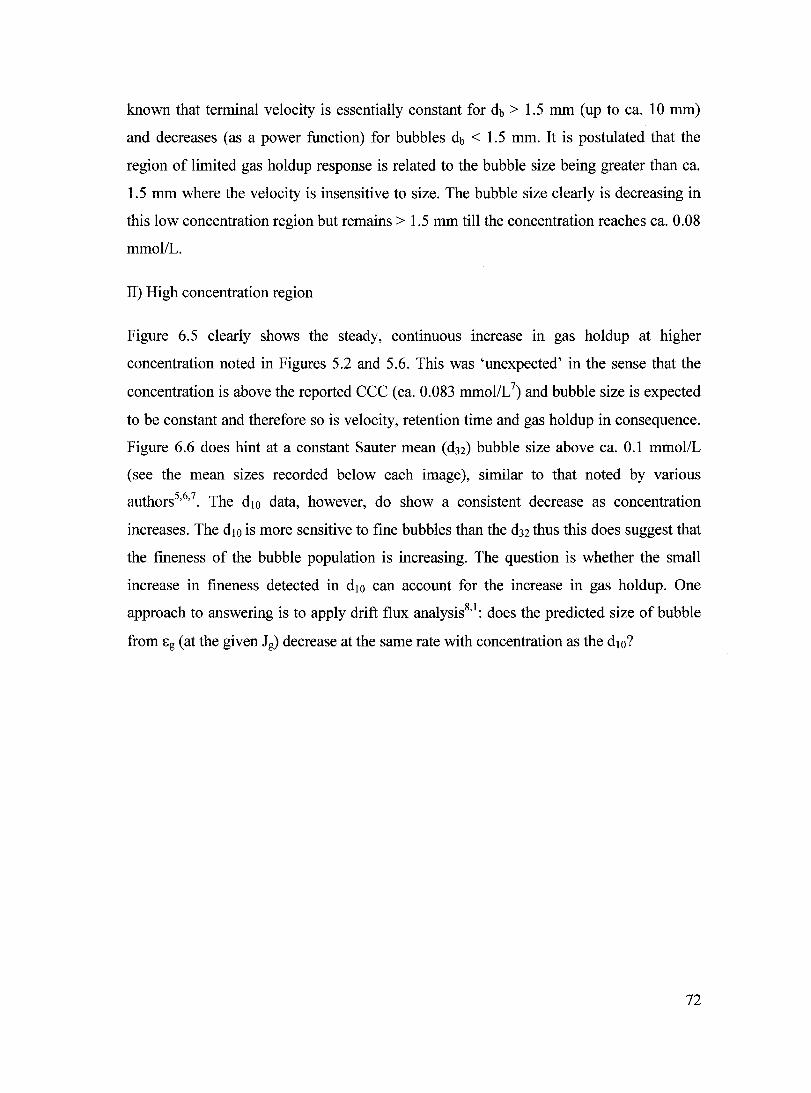
known that terminal velocity is essentially constant for db > 1.5 mm (up to ca. 10 mm)
and decreases (as a power function) for bubbles db < 1.5 mm. It is postulated that the
region of limited gas holdup response is related to the bubble size being greater than ca.
1.5 mm where the velocity is insensitive to size. The bubble size clearly is decreasing in
this low concentration region but remains > 1.5 mm till the concentration reaches ca. 0.08
mmollL.
II) High concentration region
Figure 6.5 clearly shows the steady, continuous increase in gas holdup at higher
concentration noted in Figures 5.2 and 5.6. This was 'unexpected' in the sense that the
concentration is above the reported CCC (ca. 0.083 mmollL7) and bubble size is expected
to be constant and therefore so is velocity, retention time and gas holdup in consequence.
Figure 6.6 does hint at a constant Sauter mean (d32) bubble size above ca. 0.1 mmol/L
(see the mean sizes recorded below each image), similar to that noted by various
authors5,6,7. The diO data, however, do show a consistent decrease as concentration
increases. The diO is more sensitive to fine bubbles than the d32 thus this does suggest that
the fineness of the bubble population is increasing. The question is whether the small
increase in fineness detected in diO can account for the increase in gas holdup. One
approach to answering is to apply drift flux analysis8,1: does the predicted size of bubble
from Eg (at the given Jg) decrease at the same rate with concentration as the diO?
72
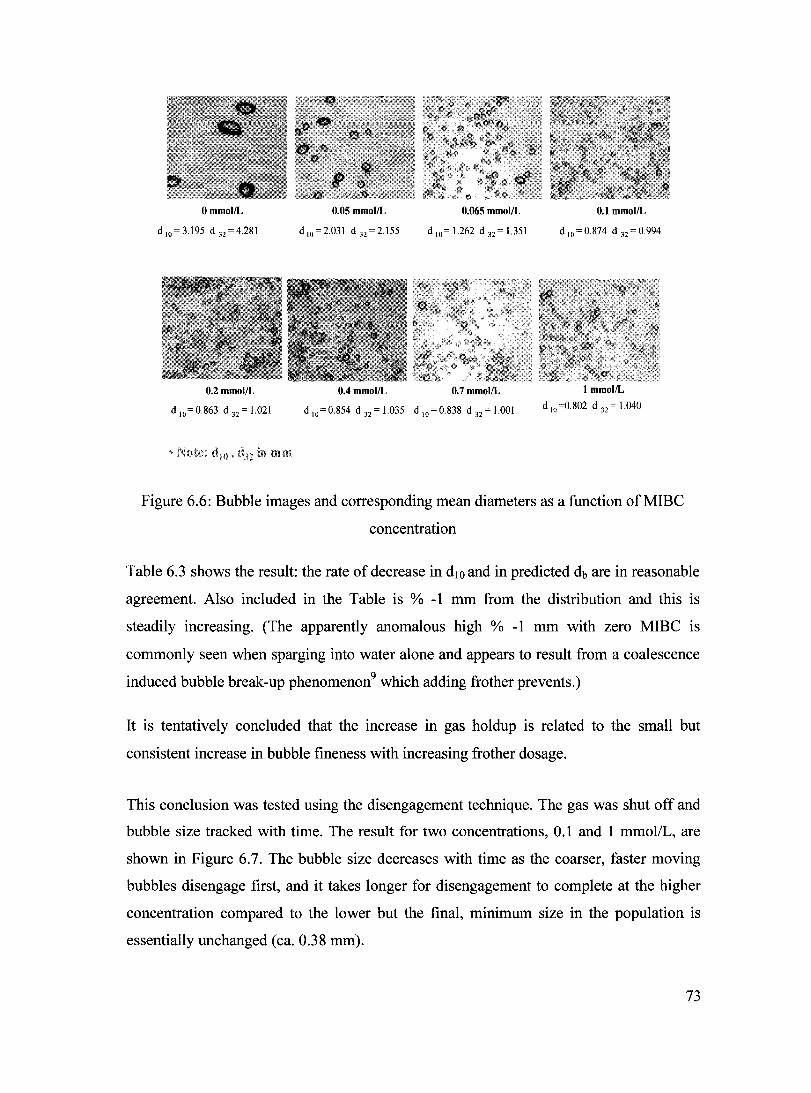
OmmollL
d 1o =3.195 d ]2=4.281
0.2mmollL
d 10 = 0.863 d 32 = 1.021
in l'ilm
0.05 mmollL
d 10 = 2.031 d]2 = 2.155
0.4mmollL
0.065 mmollL
d 10= 1.262 d 32 = 1.351
0.7mmollL
0.1 mmollL
d lO =0.874 d ]2=0.994
1 mmollL
d 10 =0.802 d 32 = 1.040
Figure 6.6: Bubble images and corresponding mean diameters as a function ofMIBC
concentration
Table 6.3 shows the result: the rate of decrease in dIO and in predicted db are in reasonable
agreement. Aiso included in the Table is % -1 mm from the distribution and this is
steadily increasing. (The apparently anomalous high % -1 mm with zero MIBC is
commonly seen when sparging into water alone and appears to result from a coalescence
induced bubble break-up phenomenon9 which adding frother prevents.)
It is tentatively concluded that the increase in gas holdup is related to the small but
consistent increase in bubble fineness with increasing frother dosage.
This conclusion was tested using the disengagement technique. The gas was shut off and
bubble size tracked with time. The result for two concentrations, 0.1 and 1 mmol/L, are
shown in Figure 6.7. The bubble size decreases with time as the coarser, faster moving
bubbles disengage first, and it takes longer for disengagement to complete at the higher
concentration compared to the lower but the final, minimum size in the population is
essentially unchanged (ca. 0.38 mm).
73
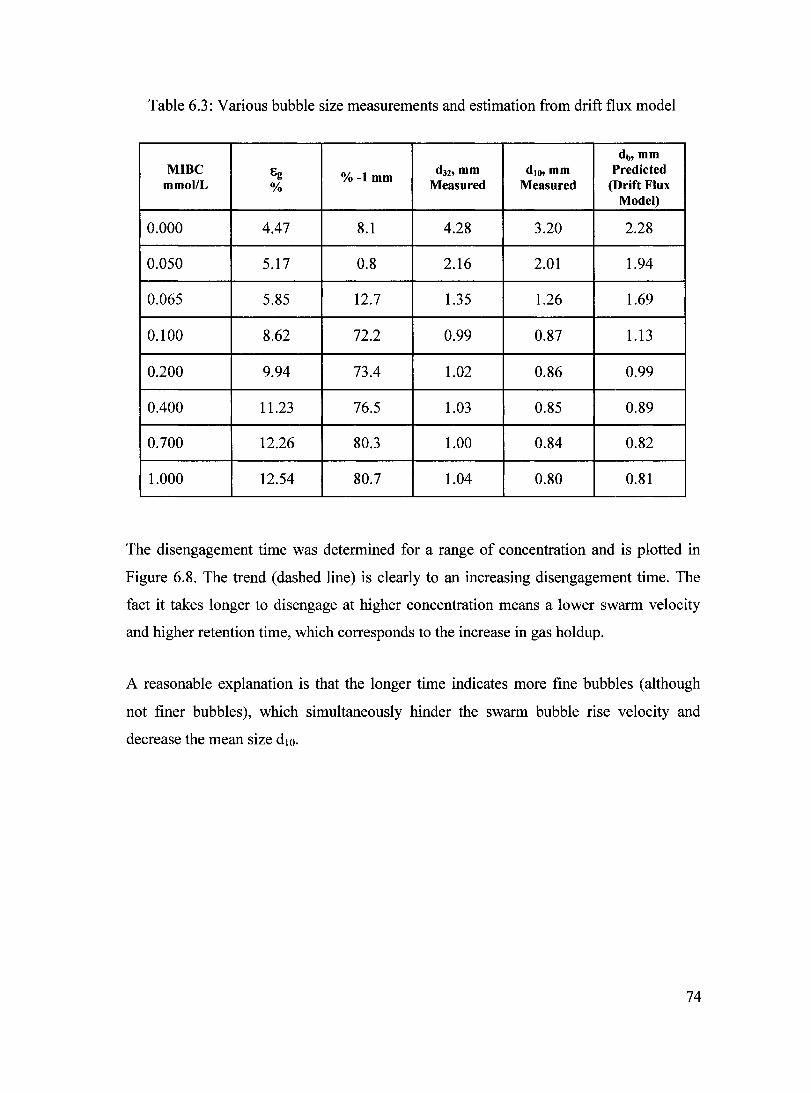
Table 6.3: Various bubble size measurements and estimation from drift flux model
db' mm MIBe Eg %-1 mm
d3Z, mm d lO, mm Predicted mmol/L 0/0 Measured Measured (Drift Flux
Model)
0.000 4.47 8.1 4.28 3.20 2.28
0.050 5.17 0.8 2.16 2.01 1.94
0.065 5.85 12.7 1.35 1.26 1.69
0.l00 8.62 72.2 0.99 0.87 1.13
0.200 9.94 73.4 1.02 0.86 0.99
0.400 11.23 76.5 1.03 0.85 0.89
0.700 12.26 80.3 1.00 0.84 0.82
1.000 12.54 80.7 1.04 0.80 0.81
The disengagement time was determined for a range of concentration and is plotted in
Figure 6.8. The trend (dashed line) is clearly to an increasing disengagemlmt time. The
fact it takes longer to disengage at higher concentration me ans a lower swarm velocity
and higher retention time, which corresponds to the increase in gas holdup.
A reasonable explanation is that the longer time indicates more fine bubbles (although
not finer bubbles), which simultaneously hinder the swarm bubble ri se velo city and
decrease the mean size d 10.
74
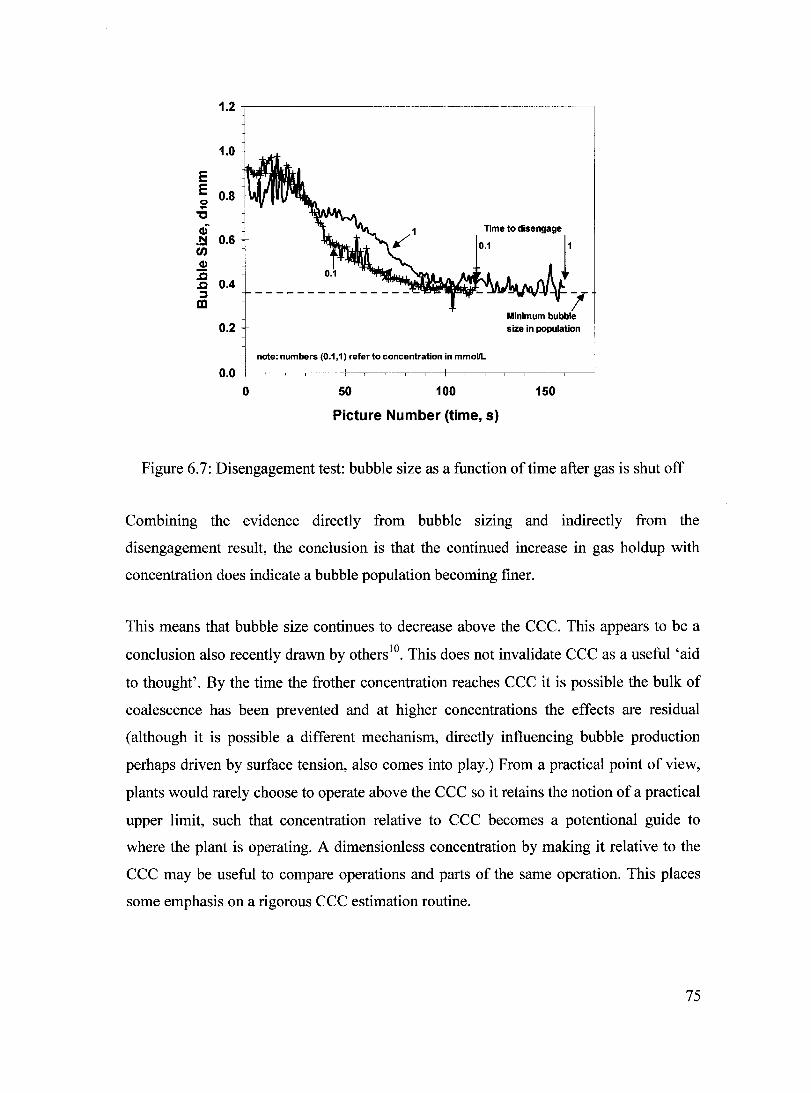
1.2
1.0
E E 0.8 ~
"'C
af .~ 0.6 en CI)
jS 0.4 Jl
::s al
0.2
0.0 note: numbers (0.1,1) refer toconcentration in mmoliL
0 50 100
Picture Number (time, s)
-, Minimum bubble size in population
150
Figure 6.7: Disengagement test: bubble size as a function oftime after gas is shut off
Combining the evidence directly from bubble slzmg and indirectly from the
disengagement result, the conclusion is that the continued increase in gas holdup with
concentration does indicate a bubble population becoming flner.
This means that bubble size continues to decrease above the ccc. This appears to be a
conclusion also recently drawn by othersJO• This does not invalidate CCC as a useful 'aid
to thought'. By the time the frother concentration reaches CCC it is possible the bulk of
coalescence has been prevented and at higher concentrations the effects are residual
(although it is possible a different mechanism, directly influencing bubble production
perhaps driven by surface tension, also cornes into play.) From a practical point ofview,
plants would rarely choose to operate above the CCC so it retains the notion of a practical
upper limit, such that concentration relative to CCC becomes a potentional guide to
where the plant is operating. A dimensionless concentration by making it relative to the
CCC may be useful to compare operations and parts of the same operation. This places
sorne emphasis on a rigorous CCC estimation routine.
75
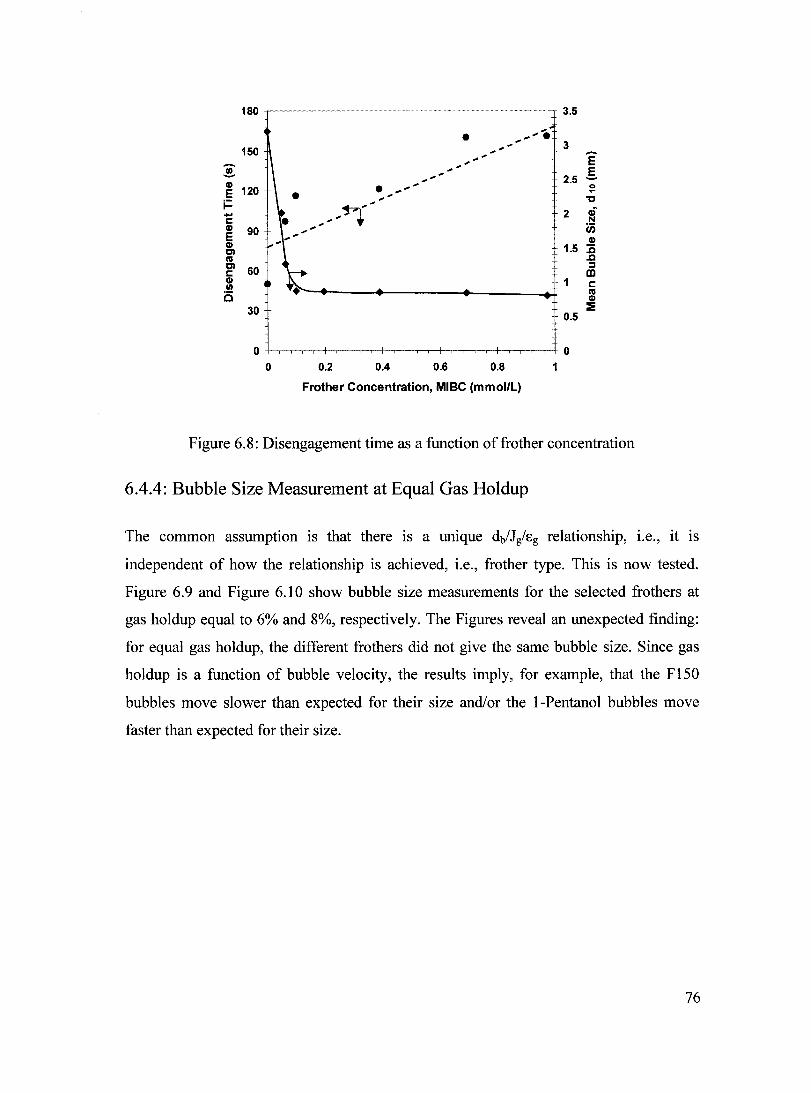
180 3.5
... • ...... . "
... 3 150 " Ê
:!: .. , .§. ...... ' 2.5 CI)
120 • ......... 0
E ~ , 'C j::
~ rD .... "
2 c N CI) 90 ... ' ëi5 E ...... ... ... CI) CI) 1.5 ::c Cl cv ,Q
Cl 60 ::l
C III CI)
C 1/1 ëS cv
CI)
30 :::E 0.5
0 0
0 0.2 0.4 0.6 0.8 1
Frother Concentration, MIBC (mmoI/L)
Figure 6.8: Disengagernent tirne as a function offrother concentration
6.4.4: Bubble Size Measurement at Equal Gas Holdup
The cornrnon assurnption is that there is a unique db/Jg/8g relationship, i.e., it is
independent of how the relationship is achieved, i.e., frother type. This is now tested.
Figure 6.9 and Figure 6.10 show bubble size rneasurernents for the selected frothers at
gas holdup equal to 6% and 8%, respectively. The Figures reveal an unexpected finding:
for equal gas holdup, the different frothers did not give the same bubble size. Since gas
holdup is a function of bubble velocity, the results irnply, for exarnple, that the F150
bubbles rnove slower than expected for their size and/or the I-Pentanol bubbles rnove
faster than expected for their size.
76
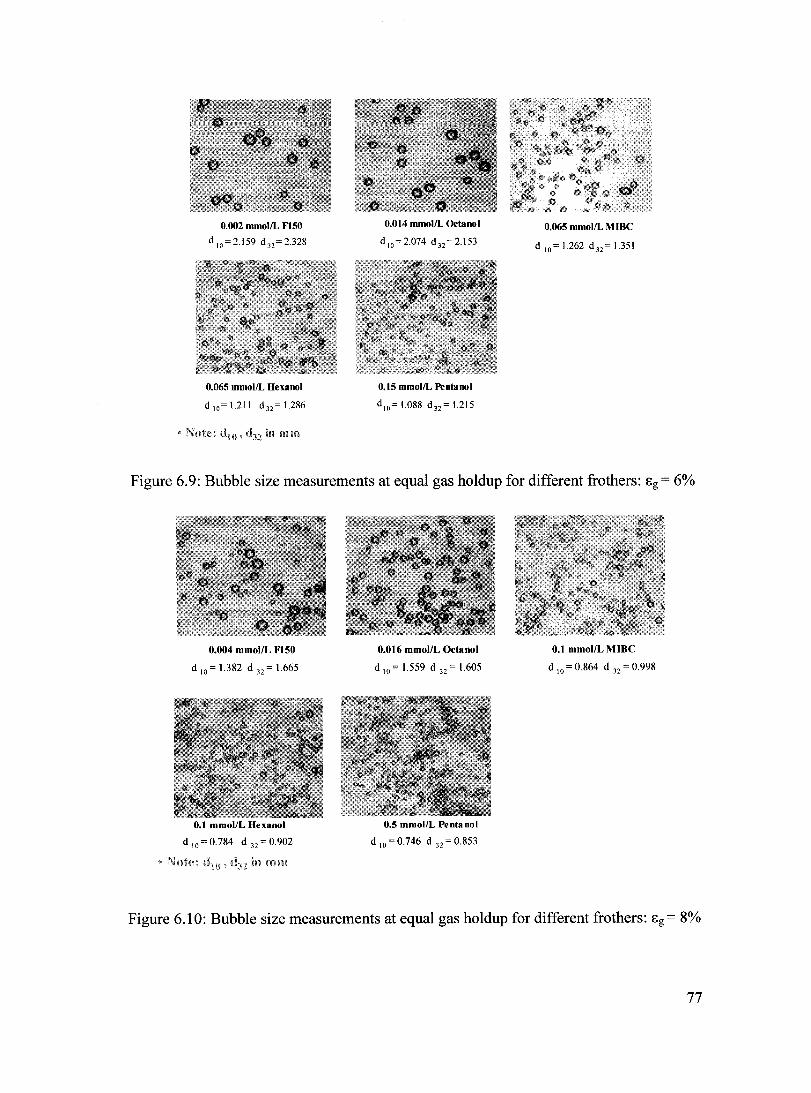
0.002 mmol/L F150
d 10 = 2.159 d 32 = 2.328
0.065 mmol/L Hexanol
d 10= 1.211 d 32 = 1.286
• Note: inmm
0.014 mmol/L Octanol
d lO =2.074 d 32 =2.153
0.15 mmol/L Pentanol
d lO =1.088 d 32 =1.215
0.065 mmol/L M IDC
d 10= 1.262 d 32 = 1.351
Figure 6.9: Bubble size measurements at equal gas holdup for different frothers: Eg= 6%
0.004 mmol/L F150
d 10 = 1.382 d 32 = 1.665
0.1 mmol/L Hexanol
0.016 mmol/L Octanol
d 10 = 1.559 d 32 = 1.605
0.5 mmol/L Pentanol
d \0 = 0.746 d 32 = 0.853
0.1 mmol/L MIBC
d 10 = 0.864 d 32 = 0.998
Figure 6.10: Bubble size measurements at equal gas holdup for different frothers: Eg = 8%
77
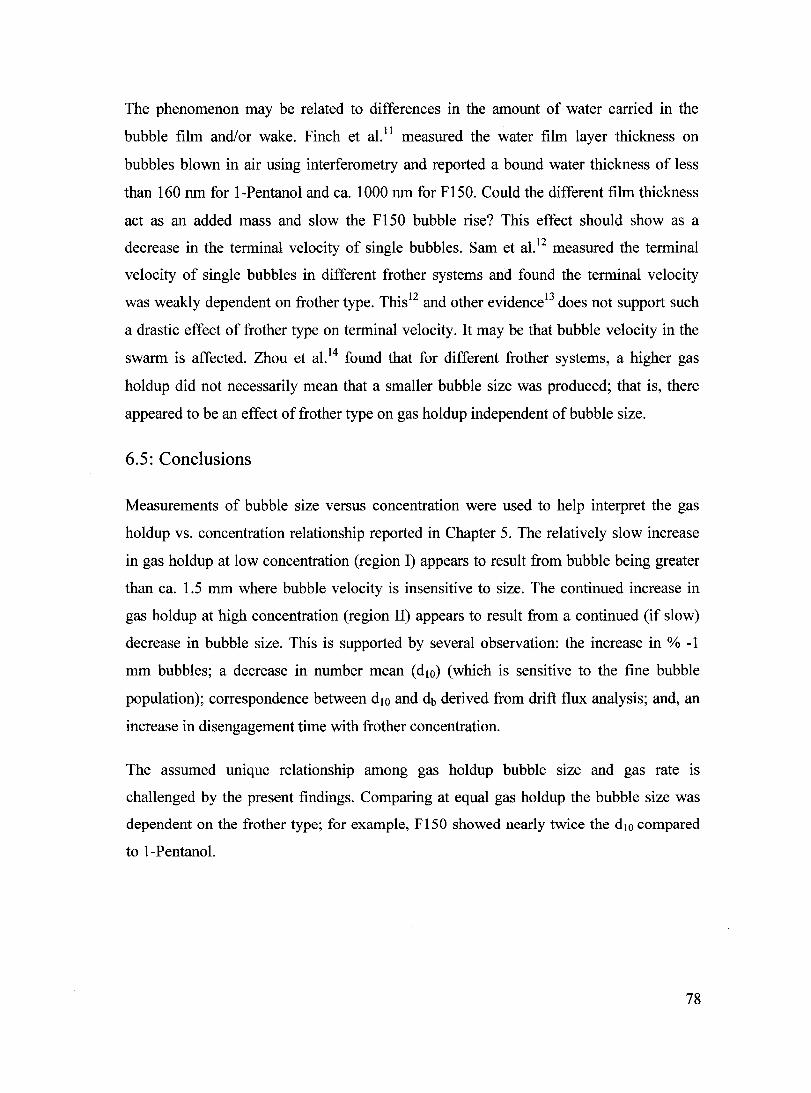
The phenomenon may be related to differences in the amount of water carried in the
bubble film and/or wake. Finch et al. 11 measured the water film layer thickness on
bubbles blown in air using interferometry and reported a bound water thickness of less
than 160 nm for 1-Pentanol and ca. 1000 nm for F150. Could the different film thickness
act as an added mass and slow the F150 bubble rise? This effect should show as a
decrease in the terminal velocity of single bubbles. Sam et al. I2 measured the terminal
velocity of single bubbles in different frother systems and found the terminal velocity
was weakly dependent on frother type. Thisl2 and other evidencel3 does not support such
a drastic effect of frother type on terminal velocity. It may be that bubble velocity in the
swarm is affected. Zhou et a1. 14 found that for different frother systems, a higher gas
holdup did not necessarily mean that a smaller bubble size was produced; that is, there
appeared to be an effect offrother type on gas holdup independent ofbubble size.
6.5: Conclusions
Measurements of bubble size versus concentration were used to help interpret the gas
holdup vs. concentration relationship reported in Chapter 5. The relatively slow increase
in gas holdup at low concentration (region 1) appears to result from bubble being greater
than ca. 1.5 mm where bubble velocity is insensitive to size. The continued increase in
gas holdup at high concentration (region II) appears to result from a continued (if slow)
decrease in bubble size. This is supported by several observation: the increase in % -1
mm bubbles; a decrease in number mean (dIO) (which is sensitive to the fine bubble
population); correspondence between d IO and db derived from drift flux analysis; and, an
increase in disengagement time with frother concentration.
The assumed unique relationship among gas holdup bubble Slze and gas rate is
challenged by the present findings. Comparing at equal gas holdup the bubble size was
dependent on the frother type; for example, F150 showed nearly twice the d IO compared
to 1-Pentanol.
78
6.6: Acknowledgments
This work was funded by Chair Renewal Grant, under the Collaborative Research and
Development pro gram of NSERC (Natural Sciences and Engineering Research Council
of Canada) sponsored by Inco, Noranda, Falconbridge, Teck Cominco, COREM, and
SGS Lakefield Research. Assistance ofMr. Claudio Acuna in developing software is also
gratefullyacknowledged.
6.7: References
1 Banisi S., Finch 1. A., "Technical Note: Reconciliation of Bubble Size Estimation Methods Using Drift Flux Analysis", MineraIs Engineering, 7 (12), 1994: 1555-1559.
2 Chen F., Gomez C.O. and Finch J.A., "Technical Note Bubble Size Measurement in Flotation Machines", MineraIs Engineering, 14(4),2001: 427-432.
3 Hernandez-Aguilar J.R., Coleman R.G., Gomez C.O. and Finch J.A., "A Comparison between Capillary and Imaging Techniques for Sizing Bubbles in Flotation Systems", Minerais Engineering, 17 (1), 2004: 53-61.
4 CHft R., Grace J.R. and Weber M.E., "Bubbles, Drops and Particles", Academie Press, New York, 1978.
5 Espinosa-Gomez R., Finch J.A. and Bernert W., "Coalescence and Froth Collapse in the Presence of Fatty Acids", Colloids and Surfaces, 32 (3/4), 1988:197-209.
6 Finch J.A., Dobby G.S., "Column Flotation", Pergamon Press, New York, 1990.
7 Cho Y.S., Laskowski J.S., "Effect of Flotation Frothers on Bubble Size and Foam Stability", International Journal of Mineral Processing, 64,2002: 69-80.
8 Dobby G.S., Yianatos J.B. and Finch J.A., "Estimation of Bubble Diameter in Flotation Columns from Drift Flux Analysis", Canadian Metallurgical Quarterly, 27 (2), 1988: 85-90.
9 Tse K.L., Martin T., McFarlane C.M. and Nienow, A.W., " Small Bubble Formation via a Coalescence Dependent Break-up Mechanism",Chemical Engineering Science, 58, 2003: 275-286.
10 Grau R. A., Laskowski J. S. and Heiskanen K., "Effect of Frothers on Bubble Size", International Journal of Mineral Processing, 76, 2005: 225-233.
79
Il Finch J. A., Gelinas S. and Moyo P., "Frother-Related Research at Mc Gill University", Minerais Engineering, 19,2006: 726-733.
12 Sam A., Gomez c.a. and Finch J.A., "Axial Velocity Profiles of Single Bubbles in Water/Frother solutions", International Journal of Mineral Processing, 47, 1996: 177-196.
13 Krzan M., Malysa K., "Profile of Local Velocities of Bubbles in n-butanol, nhexanol and n-nonanol Solutions", Colloids and Surfaces, 207, 2002: 279-291.
14 Zhou Z.A., Egiebor N.O. and Plitt, L.R., "Frother Effects on Bubble Motion in a
Swarm", Canadian Metallurgical Quarterly, 32 (2), 1993: 89-96.
80

Chapter 7: Conclusions and Recommendations
7.1: Conclusions
The following conclusions were reached:
A possible way to characterize frothers using gas holdup was explored. A correlation
between frother type and gas holdup was observed: for alcohols gas holdup increases
with hydrocarbon chain length and is independent of whether the chain is branched or
not; for polyglycols, gas holdup increases with number of propoxy (PO) groups.
A ranking of frothers based on gas holdup was identical to that given by more elaborate
techniques.
Measurements of bubble size versus concentration were used to help interpret the gas
holdup vs. concentration relationship. The relatively slow increase in gas holdup at low
concentration (region 1) appears to result from bubbles being greater than ca. 1.5 mm
where bubble velo city is insensitive to size. The continued increase in gas holdup at high
concentration (region II) appears to result from a continued (if slow) decrease in bubble
size. This is supported by the following evidence: the increase in % -1 mm bubbles; a
decrease in number mean (d lO) (which is sensitive to the fine bubble population);
correspondence between d lO and db derived from drift flux analysis; and, an increase in
disengagement time with frother concentration.
The assumed unique relationship among gas holdup bubble size and gas rate is
challenged by the present findings. Comparing at equal gas holdup the different frothers
gave a different bubble size; for example, F150 showed nearly twice the d lO compared to
I-Pentanol.
7.2: Future Work
To further understand frother properties the following recommendations are made:
81

Since gas holdup is a function of gas velocity, it is worth studying the effect of frother
type on bubble ri se velo city in the swarm. A re-check of the effect of frother type on
terminal velocity of a single bubble is also suggested. It is possible frother chemistry
affects velocity by influencing the motion (zig-zag vs. straight) of a bubble. It is
recommended to conduct experiments to study bubble motion.
It is suggested to conduct a study to investigate effect of solids on frother properties, to
identify solid types that alter gas holdup and / or bubble size.
Test quality of water. It will be interesting to further investigate how the quality of water
influences gas dispersion parameters, e.g., the role of dissolved salts, as in lconcentrator
recycle water compared to 'tap' water.
82

Appendix A: Characterization of a Set of Porous Stainless Steel Plate Spargers
A.1: Definitions
Permeability is a property of a porous medium and is a measure of the capacity of a
medium to transmit fluids. The particular numerical value of the permeability is constant
and independent of the fluid used in the measurement. Applying Darcy's theory to the
present case, the pressure drop across a sparger is directly proportional to the volume rate
of flow of fluid passing through and inversely proportional to the viscosity of the fluid. 1
A porous medium has permeability of one Darcy when a single-phase fluid of one
centipoise viscosity passes through a cross-sectional area of one square centimeter at a
rate of one cubic centimeter per second under a pressure of one atmosphere.
A.2: Characterization ofPorous Medium
Spargers can be characterized according to their permeability by applying Darcy's la~,
which can be represented as:
Ji = _ Ki [dP _ pg dZ] Jii ds ds
where,
Ji: Volume Flux across a unit of the porous medium in unit of time, mis
K: Permeability of the medium, m2
Jii: Viscosity of the fluid, kg/m.s
dP : Pressure gradient along S at the point to which Ji refers dS
S: Direction of the flow
Pi: Density of the fluid, kg/m3
g: Gravit y acceleration, mls2
Z: Vertical coordination directed downward
(A. 1)
83
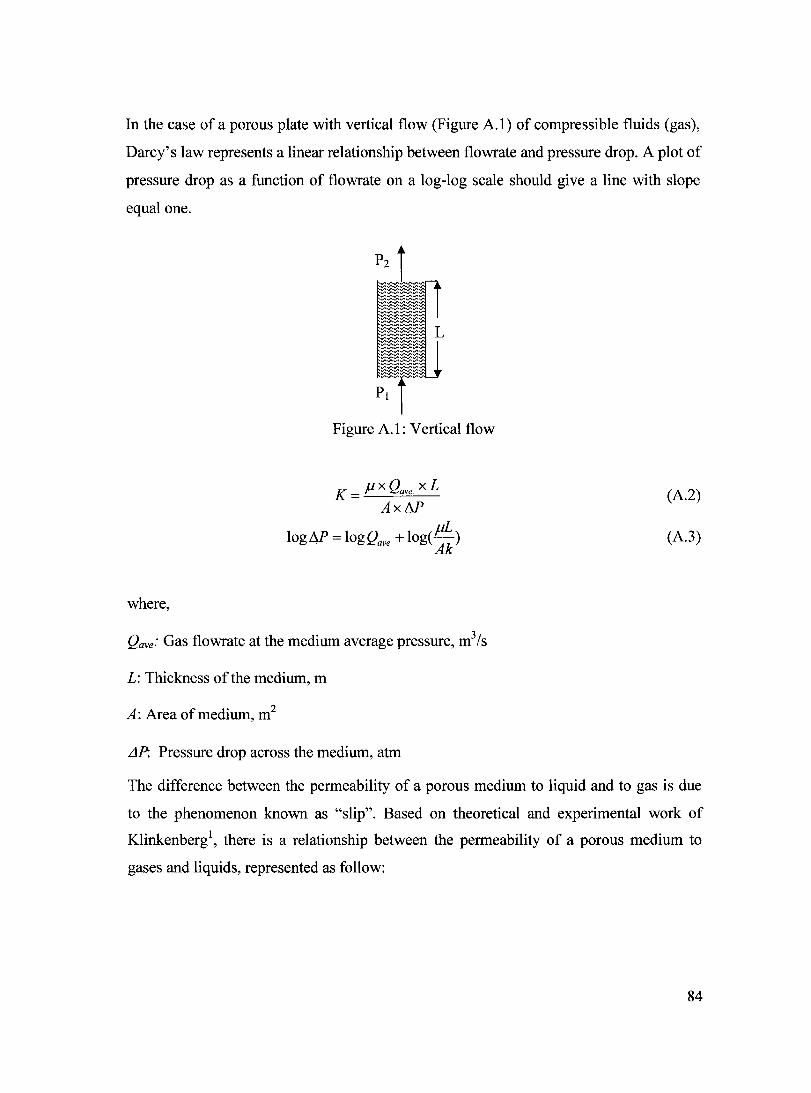
In the case of a porous plate with vertical flow (Figure A.I) of compressible fluids (gas),
Darcy' s law represents a linear relationship between flowrate and pressure drop. A plot of
pressure drop as a function of flowrate on a log-log scale should give a line with slope
equalone.
where,
Figure A.I : Vertical flow
K = Ji x Qave X L AxM
log M = log Qave + loge J1L ) Ak
Qave: Gas flowrate at the medium average pressure, m3/s
L: Thickness of the medium, m
A: Area of medium, m2
iJP. Pressure drop across the medium, atm
(A.2)
(A.3)
The difference between the permeability of a porous medium to liquid and to gas is due
to the phenomenon known as "slip". Based on theoretical and experimental work of
Klinkenberg l, there is a relationship between the permeability of a porous medium to
gases and liquids, represented as follow:
84
where:
K K - g L- b
1+Pm
(A. 4)
KL: Permeability of the medium to a single liquid phase completely filling th~~ pores of the
medium
Kg: Permeability of the medium to agas completely filling the pores of the medium
B: Klinkenberg's constant for a given gas and for a given porous medium
Pm: Aigebraic sparger mean spargers, (Pj+P2)/2
According to Equation A.4 a plot of Kg vs. lIP m should also result in a straight line with
an intercept of KL and a slpoe of bKL.
A.3: Experimental
A bubble column 10.16 cm diameter and 250 cm height, was used for characterization of
a set of plate spargers. Table A.1 shows the characteristics of each sparger. Air was
selected as test fluid. The airflow was measured and controlIed by mass flowmeter;
experiments were performed with 5 mass air flowmeters (MKS instruments) covering
ranges 0-5, 0-20, 0-30, 0-200 & 0-400 l/min. Temperature (Transduction Ltd. Model
ICTD P/N1662) and pressure difference (Bailey model PTSDDD) were measured. AlI the
above-mentioned instruments were connected to an interface and signal conditioner, Opto
22, with outputs monitored every second through a software package, Intellution IFix,
installed on a PC. One side of the sparger was open to the atmosphere and once the
pressure reached steady state, an average reading over 3 minutes was taken for each
condition and set of variables.
85
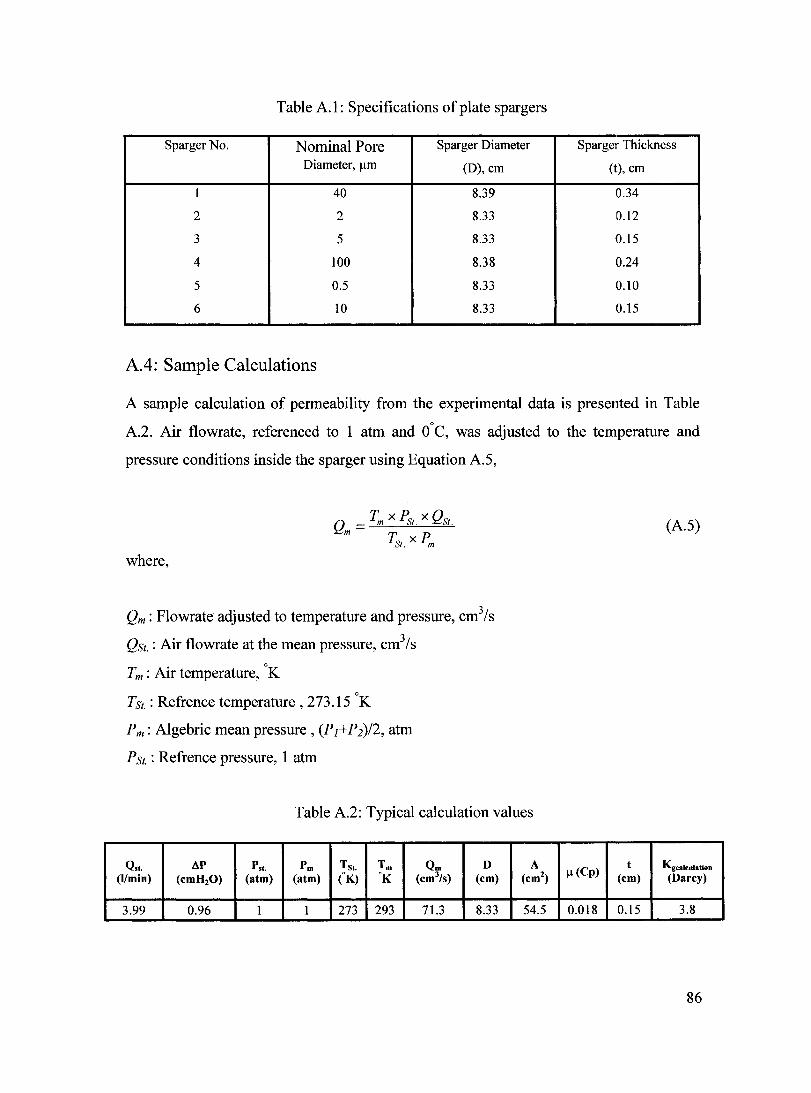
Table A.I: Specifications of plate spargers
SpargerNo. Nominal Pore Sparger Diameter Sparger Thickness
Diameter, /lm (D), cm (t), cm
1 40 8.39 0.34
2 2 8.33 0.12
3 5 8.33 0.15
4 100 8.38 0.24
5 0.5 8.33 0.10
6 10 8.33 0.15
A.4: Sample Calculations
A sample calculation of permeability from the experimental data is presented in Table
A.2. Air flowrate, referenced to 1 atm and O°C, was adjusted to the temperature and
pressure conditions inside the sparger using Equation A.5,
where,
Qm : Flowrate adjusted to temperature and pressure, cm3/s
QSt. : Air flowrate at the mean pressure, cm3/s
Tm : Air temperature, OK
Tst.: Refrenee temperature, 273.15 OK
Pm: Aigebric mean pressure, (P1+P2)/2, atm
PSt. : Refrenee pressure, 1 atm
Table A.2: Typical calculation values
Q'I. AP P'I. Pm Tsi. Tm Qm D A (I/min) (cmH2O) (atm) (atm) (K) OK (cm3/s) (cm) (cm2
)
3.99 0.96 1 1 273 293 71.3 8.33 54.5
(A.5)
j.1(Cp) t Kgcalculation
(cm) (Darcy)
0.018 0.15 3.8
86

Based on Darcy's law, plotting QnlA versus 91t should give a line with a slope of Klf.1
and plotting of the inverse of the mean pressure (1 IP m) against the permeability calculated
according to Equation A.2, should also result in a straight line with an intercept of KL
(permeability of liquid). Specimen plots for sparger No. 3 are presented in Figure A.2
(QnlA vs. 91t) and Figure A.3 (Kg vs. lIPm). Since the best working range ofmass flow
meters is between 20%-80% of full scale, aIl calculations respected this range.
y = 181.27x 5 R2 = 0.9949
4
2 K / J1 = 181 .27
1
o 0.01 0.02 0.03 0.04
Figure A.2: Sparger # 3: Measurement ofpermeability to gas (Kg)
87
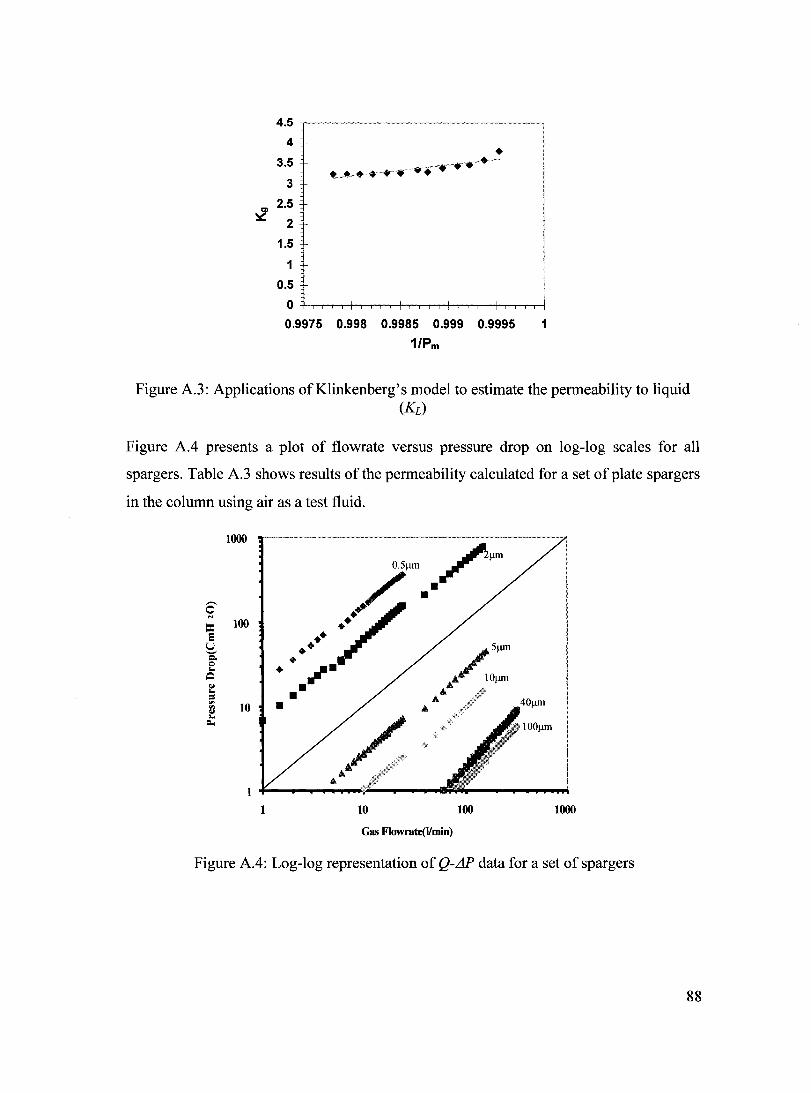
4.5
4
3.5
3
..z 2.5
2
1.5
1
0.5
0
0.9975 0.998 0.9985 0.999 0.9995 1
1/Pm
Figure A.3: Applications of Klinkenberg's model to estimate the permeability to liquid (KL)
Figure A.4 presents a plot of flowrate versus pressure drop on log-log scales for aB
spargers. Table A.3 shows results of the permeability calculated for a set of plate spargers
in the column using air as a test fluid.
1000
100
10
1
•• •• • . .... • • •
~Ilm O.51lm F
r/·· ••
10 100 1000
Gas Flowrate(l/min)
Figure A.4: Log-log representation of Q-LJP data for a set of spargers
88

Table A.3: Results ofPermeability calculation
Nominal Pore Mass Flowrate Kgcalculation Kgmeasurement KI
I>iameter (~m) (l/min) (I>arcy) (I>arcy) (I>arcy)
0.5 0-5 0.04 0.03 0.03
0.5 0-30 0.037 0.04 0.03
2 0-5 0.11 0.11 0.11
2 0-20 0.11 0.11 0.11
2 0-30 0.11 0.11 0.11
2 0-200 0.11 0.11 0.11
5 0-20 3.36 3.28 3.10
5 0-30 3.17 3.12 3.17
5 0-200 3.37 3.24 3.20
10 0-5 8.60 8.95 8.50
10 0-20 8.92 8.96 8.91
10 0-30 9.09 9.03 9.07
10 0-200 9.63 9.28 9.60
40 0-200 115.24 104.98 115
40 0-400 87.97 79.93 87
100 0-5 86.21 87.78 85
100 0-30 111.95 114.30 115
100 0-200 114.07 108.06 110
100 0-400 90.05 84.36 87
A.5: References
1 American Petroleum Institute, "Recommendation Practice for Determining
Permeability ofPorous Media", Third edition, 1956: 1-27.
2 Escudero R.G. "Characterization of Rigid Spargers and Their Selection for
Flotation Columns", Ph.D. Thesis, Mc Gill University, 1998.
89

Appendix B: Calibration Curves
B.I: Mass Flowmeter
5
4
... a) ..
3 a)
:::ai: .. II) (1)
1-.... 2 a)
3:
1
0
0
y = 0.9599x + 0.0581
R2 = 0.9985
1 2 3
Mass Flowmeler (0-5 I/min)
4 5
15 ~----------------------------~
... 10 (1) .... (1)
:::ai:
li 1-.... ~ 5
o
y = 0.9586x - 0.3365
R2 = 0.9988
5 10 15 Mass Flowmeler (0-20 I/min)
20
90

15 ... CI) -CI)
:E - 10 fi) CI) 1--~
5
o
B.2: Pressure Transducer
70
60
-2 50 J:
E ~ CI)
40 0 c CI) ... := 0 30 I!:! :::1 fi) fi) CI) 20 ... a..
10
0
0 10
y = 1.0051x - 1.3578
R2 = 0.9989
5 10 15
Mass Flowmeter (0-30 IImin)
y = 0.9721x
R2 = 0.9978
20 30 40
Distance (cm)
50
20
60 70
91
Top Related