


Languages
Pages
Legal

Copyright 2002 Prentice-Hall, Inc.
Modern Systems Analysisand Design
Third Edition
Jeffrey A. Hoffer Joey F. George
Joseph S. Valacich
Chapter 8Structuring System
Requirements: Process Modeling
8.1
Learning Objectives
Understand the logical modeling of processes through studying data flow diagrams
How to draw data flow diagrams using rules and guidelines
How to decompose data flow diagrams into lower-level diagrams
Balancing of data flow diagrams
8.2
Learning Objectives
Explain the differences among four types of DFDs: current physical, current logical, new physical and new logical
Discuss the use of data flow diagrams as analysis tools
Compare and contrast data flow diagrams with Oracle’s process modeling tool and with functional hierarchy diagrams
Discuss process modeling for Internet applications
8.3
Process Modeling
Graphically represent the processes that capture, manipulate, store and distribute data between a system and its environment and among system componentsData flow diagrams (DFD) Graphically illustrate movement of data
between external entities and the processes and data stores within a system
8.4

Process Modeling
Modeling a system’s process Utilize information gathered during
requirements determination Structure of the data is also modeled in
addition to the processes
Deliverables and Outcomes Set of coherent, interrelated data flow
diagrams
8.5

Process Modeling
Deliverables and outcomes (continued) Context data flow diagram (DFD)
Scope of system DFDs of current system
Enables analysts to understand current system DFDs of new logical system
Technology independent Show data flows, structure and functional
requirements of new system
8.6
Process Modeling
Deliverables and outcomes (continued) Project dictionary and CASE repository
8.7
Data Flow Diagramming Mechanics
Four symbols are used See Figure 8-2 Two different standard sets can be used
DeMarco and Yourdan Gane and Sarson
8.8
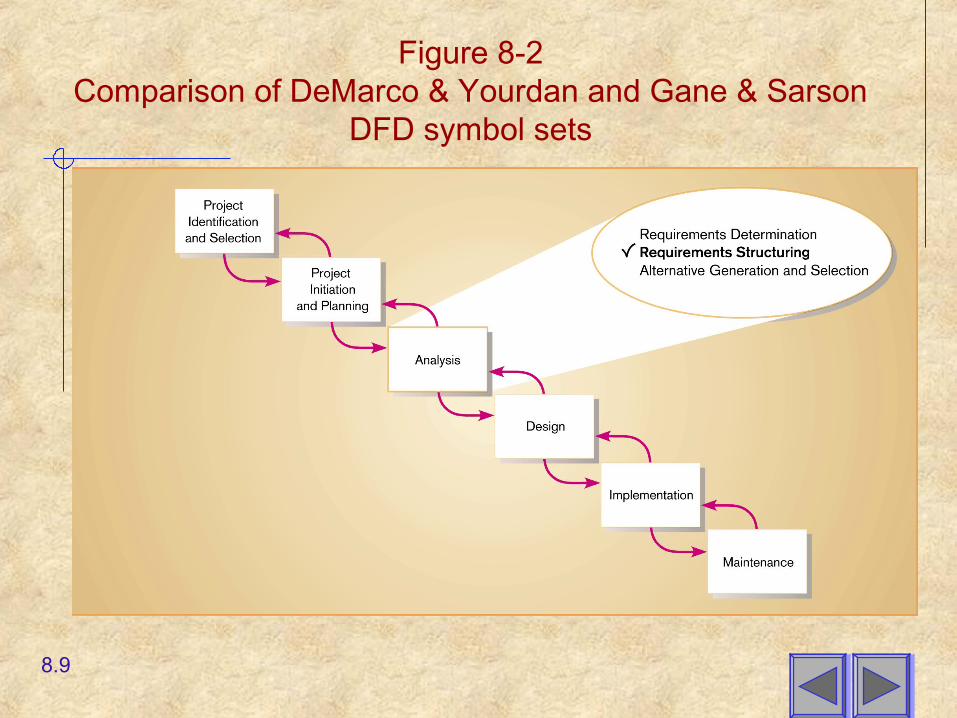
Figure 8-2Comparison of DeMarco & Yourdan and Gane & Sarson
DFD symbol sets
8.9

Data Flow Diagramming Mechanics
Data Flow Depicts data that are in motion and moving
as a unit from one place to another in the system.
Drawn as an arrow Select a meaningful name to represent the
data
8.10
Data Flow Diagramming Mechanics
Data Store Depicts data at rest May represent data in
File folder Computer-based file Notebook
The name of the store as well as the number are recorded in between lines
8.11
Data Flow Diagramming Mechanics
Process Depicts work or action performed on data
so that they are transformed, stored or distributed
Number of process as well as name are recorded
8.12
Data Flow Diagramming Mechanics
Source/Sink Depicts the origin and/or destination of the
data Sometimes referred to as an external entity Drawn as a square symbol Name states what the external agent is Because they are external, many
characteristics are not of interest to us
8.13
Data Flow Diagramming Definitions
Context Diagram A data flow diagram (DFD) of the scope of an
organizational system that shows the system boundaries, external entities that interact with the system and the major information flows between the entities and the system
Level-O Diagram A data flow diagram (DFD) that represents a
system’s major processes, data flows and data stores at a high level of detail
8.14

Developing DFDs: An Example
Hoosier Burger’s automated food ordering system
Context Diagram (Figure 8-4) contains no data stores
Next step is to expand the context diagram to show the breakdown of processes (Figure 8-5)
8.15
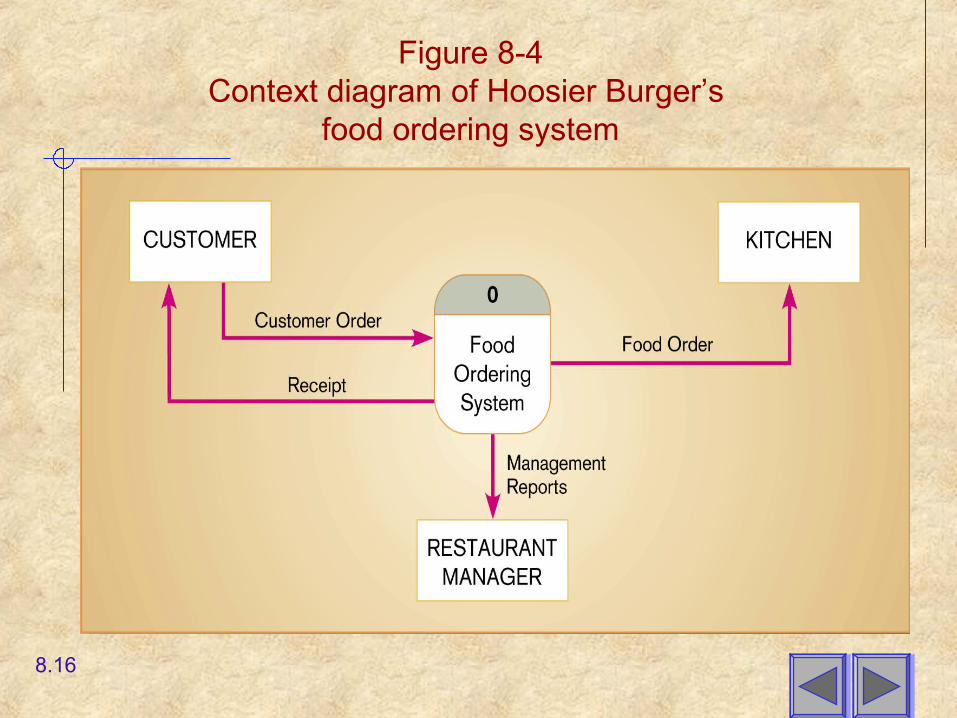
Figure 8-4Context diagram of Hoosier Burger’s
food ordering system
8.16

Figure 8-5Level-0 DFD of Hoosier Burger’s food ordering system
8.17
Data Flow Diagramming Rules
Basic rules that apply to all DFDs Inputs to a process are always different
than outputs Objects always have a unique name
In order to keep the diagram uncluttered, you can repeat data stores and sources/sinks on a diagram
8.18

Data Flow Diagramming Rules
Process No process can have
only outputs (a miracle)
No process can have only inputs (black hole)
A process has a verb phrase label
Data Store Data cannot be moved
directly from one store to another
Data cannot move directly from an outside source to a data store
Data cannot move directly from a data store to a data sink
Data store has a noun phrase label
8.19
Data Flow Diagramming Rules
Source/Sink Data cannot move
directly from a source to a sink
A source/sink has a noun phrase label
Data Flow A data flow has only one
direction of flow between symbols
A fork means that exactly the same data goes from a common location to two or more processes, data stores or sources/sinks
8.20

Data Flow Diagramming Rules
Data Flow (Continued)L. A join means that exactly the same data comes
from any two or more different processes, data stores or sources/sinks to a common location
M. A data flow cannot go directly back to the same process it leaves
N. A data flow to a data store means updateO. A data flow from a data store means retrieve or
useP. A data flow has a noun phrase label
8.21
Decomposition of DFDs
Functional decomposition Act of going from one single system to many
component processes Repetitive procedure Lowest level is called a primitive DFD
Level-N Diagrams A DFD that is the result of n nested
decompositions of a series of subprocesses from a process on a level-0 diagram
8.22

Balancing DFDs
When decomposing a DFD, you must conserve inputs to and outputs from a process at the next level of decompositionThis is called balancingExample: Hoosier Burgers In Figure 8-4, notice that there is one input to the
system, the customer order Three outputs:
Customer receipt Food order Management reports
8.23

Balancing DFDs
Example (Continued) Notice Figure 8-5. We have the same
inputs and outputs No new inputs or outputs have been
introduced We can say that the context diagram and
level-0 DFD are balanced
8.24

Balancing DFDs
An unbalanced example Figure 8-10 In context diagram, we have one input to
the system, A and one output, B Level-0 diagram has one additional data
flow, C These DFDs are not balanced
8.25

Figure 8-10An unbalanced set of data flow diagrams
(a) Context diagram(b) Level-0 diagram
8.26

Balancing DFDs
We can split a data flow into separate data flows on a lower level diagram (see Figure 8-11)
Balancing leads to four additional advanced rules (See Table 8-3)
8.27
Four Different Types of DFDS
Current Physical Process label includes an identification of
the technology (people or systems) used to process the data
Data flows and data stores are labeled with the actual name of the physical media on which data flow or in which data are stored
8.28
Four Different Types of DFDS
Current Logical Physical aspects of system are removed as much
as possible Current system is reduced to data and processes
that transform them
New Logical Includes additional functions Obsolete functions are removed Inefficient data flows are reorganized
8.29

Four Different Types of DFDS
New Physical Represents the physical implementation of
the new system
8.30
Guidelines for Drawing DFDs
Completeness DFD must include all components
necessary for system Each component must be fully described in
the project dictionary or CASE repository
Consistency The extent to which information contained
on one level of a set of nested DFDs is also included on other levels
8.31
Guidelines for Drawing DFDs
Timing Time is not represented well on DFDs Best to draw DFDs as if the system has
never started and will never stop.
Iterative Development Analyst should expect to redraw diagram
several times before reaching the closest approximation to the system being modeled
8.32
Guidelines for Drawing DFDs
Primitive DFDs Lowest logical level of decomposition Decision has to be made when to stop
decomposition
8.33
Guidelines for Drawing DFDs
Rules for stopping decomposition When each process has been reduced to a
single decision, calculation or database operation
When each data store represents data about a single entity
When the system user does not care to see any more detail
8.34
Guidelines for Drawing DFDs
Rules for stopping decomposition (continued) When every data flow does not need to be split
further to show that data are handled in various ways
When you believe that you have shown each business form or transaction, on-line display and report as a single data flow
When you believe that there is a separate process for each choice on all lowest-level menu options
8.35
Using DFDs as Analysis Tools
Gap Analysis The process of discovering discrepancies
between two or more sets of data flow diagrams or discrepancies within a single DFD
Inefficiencies in a system can often be identified through DFDs
8.36

Using DFDs in Business Process Reengineering
Example: IBM Credit See Figure 8-20 – before reengineering Credit approval process required six days
before BPR Figure 8-21 depicts DFD after
reengineering IBM was able to process 100 times the
number of transactions in the same amount of time
8.37

Oracle’s Process Modeler and Functional Hierarchy Diagrams
Process Modeler Unique to Oracle Similar to DFDS but outputs and methods differ in
several ways. Table 8-4 illustrates differences
Functional Hierarchy Diagrams Picture of various tasks performed in a business
and how they are related Tasks are broken down into their various parts Does not include data flows
8.38
Summary
Data flow diagrams (DFD) Symbols Rules for creating Decomposition Balancing
Four different kinds of DFDs Current Physical Current Logical New Logical New Physical
8.39
Summary
DFDs for Analysis
DFDs for Business Process Reengineering (BPR)
Oracle’s Process Modeler
Functional Hierarchy Diagrams
8.40
Top Related