


Languages
Pages
Legal

Chapter - VI
Profitability Analysis of Indian General Insurance Industry
As a result of the various reforms introduced by the Government of
India in the insurance sector, private companies have made their entry into the
field. It has thrown a new challenge before the public sector companies. Now it
has become quite tough for the companies to work in a competitive
environment. It has resulted in reduction of product prices, increases in
distribution cost and better service quality. There is uncertainty regarding the
effect of these reforms on the profitability of these companies which is
important for the safety and soundness of insurance industry.
6.1 Concept of Profitability
The term „profit‟ is an accounting concept which shows the excess of
income over expenditure viewed during a specified period of time. Profit is the
main reason for the continued existence of every commercial organization. On
the other hand, the term 'profitability' is a relative measure where profit is
expressed as a ratio, generally as a percentage. Profitability depicts the
relationship of the absolute amount of profit with various other factors.
Profitability is the most important and reliable indicator as it gives a broad
indicator of the ability of a insurance company to raise its income level. In
practice, executives define profits as the difference between total earnings from
all earning assets and total expenditure on managing entire asset-liabilities
portfolio (Kaur and Kapoor, 2007).
6.2 Drivers of Profitability
To analyze the drivers of profitability, it is useful to decompose ROE
into its main components. Profits are determined first by underwriting
performance (losses and expenses, which are affected by product pricing, risk
selection, claims management, and marketing and administrative expenses);
and second, by investment performance, which is a function of asset allocation
and asset management as well as asset leverage. The first fork of the
decomposition shows that an insurer‟s ROE is determined by earnings after
155
taxes realized for each unit of net premiums (or profit margin) and by the
amount of capital funds used to finance and secure the risk exposure of each
premium unit (solvency). The after-tax profit margin equals the pre-tax profit
margin times one minus the corporate tax rate. The tax rate depends upon
individual tax strategies and is otherwise an exogenous parameter of the
industry. The pre-tax profit margin is the sum of the underwriting result (or
underwriting margin) and the investment result. The investment result is
determined by total investment yield (relative performance including realized
capital gains) multiplied by invested assets (asset leverage).The underwriting
result - in per cent of net premiums - is determined by the loss ratio, the
expense ratio (Rudolf, 2001). The benefit of this type of decomposition is to
separate the various factors affecting profitability, isolating them for further
analysis. Though they will be analyzed separately, they are interrelated through
the decision-making processes of insurers.
6.3 Comparative Profitability Analysis of the Public and Private Sector
General Insurance Companies in the Post-reform Period
Claim Ratio
Claims incurred ratio may be defined as total net incurred claims divided
by net written premium (NWP). This indicator is a good complement to the
picture of economics, client value and service quality of the various insurance
schemes. The acceptable level for this indicator cannot be determined, but
generally, the higher it is, the better it would be.
156

Table 6.1
Claim Ratio of General Insurance Companies during the Post-reform
Period
(Percentage)
Name of the
Company 2002
-03
2003
-04
2004
-05
2005
-06
2006
-07
2007
-08
Mean
Med
ian
S.D
.
National 76.01 84.10 79.92 105.49 83.85 89.05 86.40 83.98 10.33
New India 82.46 74.65 74.58 83.64 76.68 85.01 79.50 79.57 4.73
Oriental 77.23 78.09 86.04 82.57 81.91 90.40 82.71 82.24 4.94
United India 91.06 85.63 91.99 91.77 84.68 87.00 88.69 89.03 3.30
Mean 81.69 80.62 83.13 90.87 81.78 87.86 84.33 83.98 6.97
Median 79.84 81.095 82.98 87.705 82.88 88.025 83.975
S.D. 6.84 5.13 7.53 10.57 3.59 2.36 6.96
Royal
Sundaram 53.68 57.33 56.40 54.45 52.30 55.93 55.02 55.19 1.88
Reliance 99.48 68.73 61.91 62.01 34.34 56.13 63.77 61.96 21.12
IFFCO-Tokio 40.70 54.63 50.79 51.03 68.65 68.42 55.70 52.83 10.97
TATA AIG 47.41 44.84 48.31 47.55 49.81 46.77 47.45 47.48 1.65
Bajaj Allianz 59.01 52.59 47.22 58.68 53.44 53.96 54.15 53.70 4.36
ICICI Lombard 39.89 53.96 48.23 53.04 56.10 69.02 53.37 53.50 9.60
CHOLAMAN
DALAM 13.78 43.23 61.16 69.94 44.44 48.47 46.84 46.46 19.25
HDFC CHUBB 13.34 34.99 58.94 55.50 60.12 68.49 48.57 57.22 20.55
Mean 45.91 51.29 54.12 56.53 52.40 58.40 53.11 53.82 13.60
Median 44.055 53.275 53.595 54.975 52.87 56.03 53.82
S.D. 27.41351 10.23206 6.16237 6.99937 10.24469 9.10119 13.59524
Source: IRDA Annual Reports from 2002-03 to 2007-08.
Test of Significance
Test Ratio Z-value Asymp. Sig. (2-tailed)
Mann- Whitney Test Claim Ratio -6.61 0.00
Table 6.1 exhibits the ratio of claim incurred as a percentage of net
written premium of the public and private sector general insurance companies
on a year to year basis during the period 2002-03 to 2007-08. The table also
reveals the mean, median and standard deviation for each general insurance
company over the study period and also for each year across the 12 companies.
The sector-wise analysis shows that the claim incurred ratio of the public sector
157

general insurance companies is higher than that of the private sector general
insurance companies throughout the study period. Among the public sector
companies, United India Insurance Co. Ltd. showed a maximum average claim
ratio of 88.69 per cent followed by National Insurance Co. Ltd. and Oriental
Insurance Co. Ltd. with respective percentages of 86.40 per cent and 82.71 per
cent respectively. However, among the private insurers, Reliance General
Insurance Co. showed a maximum average claim ratio of 63.77 per cent
followed by IFFCO-Tokio and Royal Sundaram with the respective
percentages of 55.70 per cent and 55.02 per cent. Cholamandalam General
Insurance Co., the private insurer showed the least average claim ratio of 46.84
per cent followed by TATA-AIG with the ratio of 47.45 per cent. The average
claim ratio of all the public sector insurers is 84.33 per cent and that of private
insurers is 53.11 per cent, which clearly indicates a huge difference between
the public and private insurers' claim ratio. The standard deviation values of the
public and private sector general insurance companies are 6.97 and 13.60
which exhibit that public insurers are more consistent than the private insurers
in paying claim to the customers. Year-wise analysis indicates that the average
claim ratio of the public sector is the highest, i.e., 90.87 per cent in the year
2005-06 followed by 87.86 per cent in the year 2007-08. The private insurers'
average claim ratio is also the highest in the year 2005-06 followed by the year
2007-08. A closer investigation of the product portfolio, reveals that it is
mainly due to the fact that the private companies are concentrating more on the
creamy business. In respect of loss making portfolio, such as motor business,
they have avoided to enter these businesses to reduce their claim incurred ratio.
Further investigation reveals that public sector insurance companies do not get
much of their business reinsured in contrast to the private sector players, who
get most of the business reinsured to reduce their claim incurred ratio. Mann-
Whitney test further shows that there is significant difference between the
claim ratio of the public and the private sector general insurance companies.
158
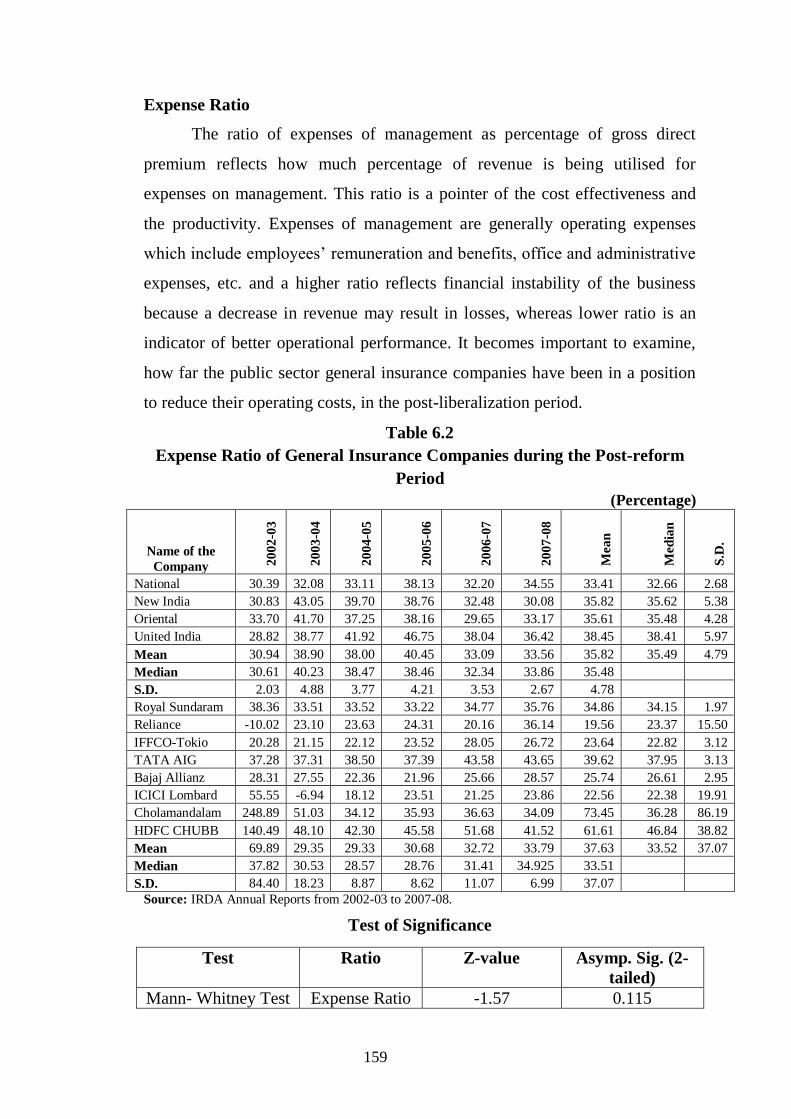
Expense Ratio
The ratio of expenses of management as percentage of gross direct
premium reflects how much percentage of revenue is being utilised for
expenses on management. This ratio is a pointer of the cost effectiveness and
the productivity. Expenses of management are generally operating expenses
which include employees‟ remuneration and benefits, office and administrative
expenses, etc. and a higher ratio reflects financial instability of the business
because a decrease in revenue may result in losses, whereas lower ratio is an
indicator of better operational performance. It becomes important to examine,
how far the public sector general insurance companies have been in a position
to reduce their operating costs, in the post-liberalization period.
Table 6.2
Expense Ratio of General Insurance Companies during the Post-reform
Period
(Percentage)
Name of the
Company 20
02-0
3
20
03-0
4
20
04-0
5
20
05-0
6
20
06-0
7
20
07-0
8
Mea
n
Med
ian
S.D
.
National 30.39 32.08 33.11 38.13 32.20 34.55 33.41 32.66 2.68
New India 30.83 43.05 39.70 38.76 32.48 30.08 35.82 35.62 5.38
Oriental 33.70 41.70 37.25 38.16 29.65 33.17 35.61 35.48 4.28
United India 28.82 38.77 41.92 46.75 38.04 36.42 38.45 38.41 5.97
Mean 30.94 38.90 38.00 40.45 33.09 33.56 35.82 35.49 4.79
Median 30.61 40.23 38.47 38.46 32.34 33.86 35.48
S.D. 2.03 4.88 3.77 4.21 3.53 2.67 4.78
Royal Sundaram 38.36 33.51 33.52 33.22 34.77 35.76 34.86 34.15 1.97
Reliance -10.02 23.10 23.63 24.31 20.16 36.14 19.56 23.37 15.50
IFFCO-Tokio 20.28 21.15 22.12 23.52 28.05 26.72 23.64 22.82 3.12
TATA AIG 37.28 37.31 38.50 37.39 43.58 43.65 39.62 37.95 3.13
Bajaj Allianz 28.31 27.55 22.36 21.96 25.66 28.57 25.74 26.61 2.95
ICICI Lombard 55.55 -6.94 18.12 23.51 21.25 23.86 22.56 22.38 19.91
Cholamandalam 248.89 51.03 34.12 35.93 36.63 34.09 73.45 36.28 86.19
HDFC CHUBB 140.49 48.10 42.30 45.58 51.68 41.52 61.61 46.84 38.82
Mean 69.89 29.35 29.33 30.68 32.72 33.79 37.63 33.52 37.07
Median 37.82 30.53 28.57 28.76 31.41 34.925 33.51
S.D. 84.40 18.23 8.87 8.62 11.07 6.99 37.07
Source: IRDA Annual Reports from 2002-03 to 2007-08.
Test of Significance
Test Ratio Z-value Asymp. Sig. (2-
tailed)
Mann- Whitney Test Expense Ratio -1.57 0.115
159

Table 6.2 reports the results of insurer-wise expense of management
ratio from the year 2002-03 to 2007-08. The table also reveals mean, median
and standard deviation for each general insurance company over the study
period and also for each year across the 12 companies. The results show that
average expense of management ratio of the public sector general insurance
companies is 35.82 per cent, whereas that of the private sector companies is
37.63 per cent which is higher by 1.81 per cent in the case of private sector
general insurance companies during the period 2002-03 to 2007-08. However,
the Mann-Whitney test results indicate that the gap in expense of management
ratio of both the public and private sector companies is insignificant. Among
the public sector insurers, United India has registered the highest expense of
management ratio (38.45 per cent) followed by New India (35.82 per cent),
Oriental (35.61 per cent) and National (33.41 per cent). Among the private
sector insurers, Cholamandalam has exhibited the highest average expense ratio
of 73.45 per cent followed by HDFC CHUBB (61.61 per cent) and Tata-AIG
39.62 per cent. However, Reliance has registered the least average expense of
management ratio of 19.56 per cent followed by ICICI Lombard with 22.56 per
cent. Year-wise results explain that the average expense ratio of the public
sector companies during the year 2002-03 was 30.94 per cent which increased
to 40.45 per cent in the year 2005-06. However, it came down to 33.56 per cent
during the year 2007-08. Among the private sector insurers, the average
expense ratio in the year 2002-03 was 69.89 per cent which reduced to 33.79
per cent in the year 2007-08. So, it is evident from the table that in the initial
years of reforms the private sector had to spend more on advertisements,
commission and other expenses. But with the passage of time, these private
sector general insurance companies took various cost effective measures which
led to improve their operational performance. The standard deviation of
expense of management ratio in the case of public sector companies is 4.79 per
cent, whereas it is 37.07 per cent in private sector companies. It is clear that
there was wide variation in the expense ratio of the private sector general
insurance companies during the period 2002-03 to 2007-08.
160

Combined Ratio
This ratio reflects the combined effect of expenses of management and
claim incurred. It is the most common measure of underwriting profitability.
Financial analysts rely on it for comparing the profitability of insurance
business of different companies and for comparing different lines of business.
The companies use it for steering their business (Holzheu, 2006).
Table 6.3
Combined Ratio of General Insurance Companies during the Post-reform
Period
(Percentage) Name of the
Company 2002-03 2003-04 2004-05 2005-06 2006-07 2007-08 Mean Median S.D.
National 106.40 116.18 113.03 143.63 116.05 123.60 119.82 116.12 12.92
New India 113.28 117.71 114.28 122.39 109.16 115.09 115.32 114.69 4.45
Oriental 110.93 119.79 123.29 120.73 111.56 123.57 118.31 120.26 5.67
United India 119.89 124.40 133.91 138.53 122.72 123.42 127.14 123.91 7.33
Mean 112.62 119.52 121.13 131.32 114.87 121.42 120.15 119.84 8.89
Median 112.10 118.75 118.78 130.46 113.80 123.49 119.84
S.D. 5.62 3.57 9.67 11.48 5.960 4.22 8.89
Royal
Sundaram 92.04 90.84 89.92 87.67 87.07 91.69 89.87 90.38 2.08
Reliance 89.47 91.84 85.54 86.32 54.50 92.27 83.32 87.90 14.39
IFFCO-Tokio 60.97 75.78 72.91 74.55 96.71 95.13 79.34 75.17 13.90
TATA AIG 84.69 82.15 86.80 84.95 93.39 90.42 87.07 85.88 4.14
Bajaj Allianz 87.33 80.14 69.58 80.64 79.09 82.53 79.89 80.39 5.83
ICICI Lombard 95.44 47.02 66.35 76.55 77.35 92.87 75.93 76.95 17.87
Cholaman
Dalam 262.67 94.27 95.28 105.86 81.07 82.56 120.28 94.78 70.35
HDFC CHUBB 153.83 83.09 101.24 101.08 111.80 110.01 110.18 105.63 23.68
Mean 115.81 80.64 83.45 87.20 85.12 92.18 90.74 87.20 29.95
Median 90.75 82.62 86.17 85.63 84.07 91.98 87.2
S.D. 64.88 15.01 12.59 11.10 16.77 8.58 29.94
Source: Compiled from IRDA Annual Reports from 2002-03 to 2007-08.
Test of Significance
Test Ratio Z-value Asymp. Sig. (2-
tailed)
Mann- Whitney
Test
Combined Ratio -6.236 0.00
The insurer-wise combined ratio results for the period 2002-03 to 2007-
08 have been exhibited in table 6.3. The table also reflects the mean, median
and standard deviation for each general insurance company over the study
period. The results reveal that the average combined ratio in the case of public
sector general insurance companies during the period 2002-03 to 2007-08 is
161

120.15 per cent, whereas it is 90.74 per cent in private sector insurance
companies. It is evident that combined ratio of the public sector is higher by
29.41 per cent than the private sector. This has been due to higher claim ratio
of the public sector. Among the public insurers, United India exhibits the
highest average combined ratio of 127.14 per cent followed by National 119.82
per cent, Oriental 118.31 per cent and New India 115.32 per cent. However,
among the private insurers, Cholamandalam has exhibited the highest average
combined ratio of 120.28 per cent followed by HDFC CHUBB 110.18 per cent,
Royal Sundaram 89.87 per cent, Tata AIG 87.07 per cent, Reliance 83.32 per
cent, Bajaj Allianz 79.89 per cent, IFFCO-Tokio 79.34 per cent and ICICI
Lombard 75.93 per cent. Year-wise, the average combined ratio of the public
sector in the year 2002-03 was 112.62 per cent which increased to 131.32 per
cent in the year 2005-06. Again, it showed a decreasing trend and reached at
121.42 per cent in the year 2007-08. The average combined ratio of the private
sector general insurance companies in the year 2002-03 was 115.81 per cent
which reduced to 92.18 per cent in the year 2007-08. Both the public and
private sector general insurance companies showed a standard deviation of 8.89
per cent and 29.95 per cent respectively. It indicates that the variation in the
combined ratio of the private sector general insurance companies is higher. The
results of Mann-Whitney test also indicate that the combined ratio of the public
sector is significantly higher than that of the private sector general insurance
companies.
Underwriting Results Ratio
The underwriting results ratio of a general insurance company is
depicted by taking net written premium minus increase in the unexpired risk
reserve minus expense of management minus claim incurred minus
commission. The underwriting results indicate the performance of an insurance
company from core insurance business. The underwriting results ratio is
calculated by dividing underwriting results to net written premium.
162

Table 6.4
Underwriting Results Ratio of General Insurance Companies during the
Post-reform Period
(Percentage)
Name of the
Company
2002
-03
2003
-04
2004
-05
2005
-06
2006
-07
2007
-08
Mean
Med
ian
S.D
.
National -14.14 -21.00 -18.96 -40.64 -19.13 -28.92 -23.80 -20.07 9.55
New India -13.82 -18.96 -17.57 -27.50 -13.72 -17.18 -18.12 -17.38 5.05
Oriental -13.21 -22.77 -27.56 -26.52 -18.12 -23.65 -21.97 -23.21 5.42
United India -19.08 -25.09 -34.37 -39.94 -28.90 -29.62 -29.50 -29.26 7.23
Mean -15.06 -21.95 -24.62 -33.65 -19.97 -24.84 -23.35 -21.89 7.79
Median -13.98 -21.88 -23.26 -33.72 -18.62 -26.28 -21.88
S.D. 2.70 2.60 7.86 7.68 6.40 5.76 7.78
Royal Sundaram -21.59 -6.24 -3.98 -3.65 -1.43 -8.05 -7.49 -5.11 7.27
Reliance -41.10 -15.63 -8.02 10.86 -6.07 -20.49 -13.41 -11.83 17.28
IFFCO-Tokio -4.57 -0.61 1.79 -2.21 -2.39 -8.43 -2.74 -2.30 3.50
TATA AIG -19.27 -6.02 0.79 -0.15 -1.61 -4.46 -5.12 -3.04 7.39
Bajaj Allianz -2.07 0.39 7.81 3.29 1.55 -1.77 1.53 0.97 3.68
ICICI Lombard -34.05 13.90 0.84 -4.65 -3.82 -4.82 -5.43 -4.24 15.72
Cholamandalam -237.78 -44.95 -15.88 -16.17 -1.15 -5.06 -53.50 -16.03 91.57
HDFC CHUBB -147.39 -38.15 -12.42 -4.77 -6.41 -20.47 -38.27 -16.45 54.83
Mean -63.48 -12.17 -3.63 -2.18 -2.67 -9.19 -15.55 -4.71 40.35
Median -27.82 -6.13 -1.595 -2.93 -2 -6.55 -4.71
S.D. 84.29 20.01 7.98 7.69 2.66 7.27 40.34
Source: Compiled from IRDA Annual Reports from 2002-03 to 2007-08.
Test of Significance
Test Ratio Z-value Asymp. Sig. (2-tailed)
Mann- Whitney Test Underwriting
Results Ratio
-4.539 0.00
The underwriting results to net written premium ratio of both the public
and private sector general insurance companies from 2002-03 to 2007-08 have
been presented in table 6.4. It is clear that the average underwriting results ratio
of the public sector general insurance companies is -23.35 per cent and that of
private sector companies is -15.55 per cent. Thus, the underwriting losses of
public sector companies are higher as compared to the private sector
companies. Among the public sector companies, United India has registered the
highest average underwriting losses of -29.50 per cent followed by National -
23.80 per cent, Oriental -21.97 per cent and New India -18.12 per cent which
means that all the public sector general insurance companies have shown huge
163
underwriting losses. However, among the private insurers, Cholamandalam has
shown the highest average underwriting loss of -53.50 per cent followed by
HDFC CHUBB -38.27 per cent, Reliance -13.41 per cent, Royal Sundaram -
7.49 per cent, ICICI Lombard -5.43 per cent, Tata AIG -5.12 per cent and
IFFCO-Tokio -2.74 per cent of all the private insurers, only Bajaj Allianz
earned average underwriting profits of 1.53 per cent. Year-wise, the public
insurers showed an increasing trend during the period 2002-03 to 2005-06,
when average underwriting losses increased from -15.06 per cent to -33.65 per
cent and again reduced to -24.84 per cent in the year 2007-08. However, the
private insurers showed decreasing trend except during the year 2007-08. The
average underwriting losses of the private sector companies during the year
2002-03 were -63.48 per cent which reduced to just -2.67 per cent in the year
2006-07 and again increased to -9.19 per cent in the year 2007-08. All the
private insurers except Cholamandalam and HDFC CHUBB, exhibited
underwriting losses lower than the public sector insurers. The standard
deviation of the underwriting results ratio of the public insurers is 7.79 per
cent, whereas that of the private insurers is 40.35 per cent which clearly
indicates that the variation in underwriting results of the private sector general
insurance companies is higher. The Mann-Whitney test also reveals that there
is a significant gap between underwriting losses of the public and private
insurers. The main reason for higher underwriting losses of the public insurers
is mainly ascribed to low reinsurance of their business and higher expenses of
management and incurred claim. Their excessive management expenses have
been higher due to massive strength of manpower. On the other hand, private
companies get most of their business reinsured to reduce their losses from
underwriting. Moreover, they have minimum staff strength and advanced
technology at their disposal. So, public sector general insurance companies
need to reduce the staff strength and use more advanced technology to compete
with the private sector. The general insurance business in India has been
detariffed with effect from 1st January, 2007; and even companies are allowed
to change the policy wordings with effect from 1st April, 2008. Now, it is the
164
right time for the public sector to revisit their loss making portfolios to improve
upon their underwriting results.
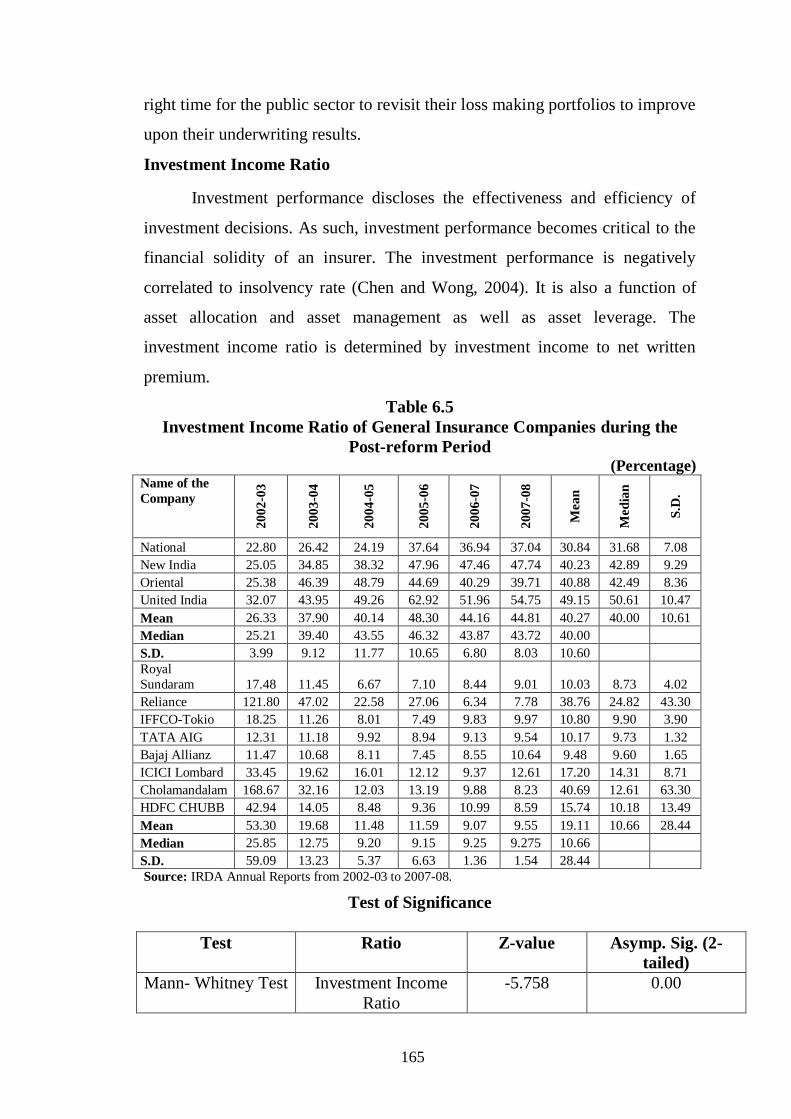
Investment Income Ratio
Investment performance discloses the effectiveness and efficiency of
investment decisions. As such, investment performance becomes critical to the
financial solidity of an insurer. The investment performance is negatively
correlated to insolvency rate (Chen and Wong, 2004). It is also a function of
asset allocation and asset management as well as asset leverage. The
investment income ratio is determined by investment income to net written
premium.
Table 6.5
Investment Income Ratio of General Insurance Companies during the
Post-reform Period (Percentage)
Name of the
Company
20
02
-03
20
03
-04
20
04
-05
20
05
-06
20
06
-07
20
07
-08
Mea
n
Med
ian
S.D
.
National 22.80 26.42 24.19 37.64 36.94 37.04 30.84 31.68 7.08
New India 25.05 34.85 38.32 47.96 47.46 47.74 40.23 42.89 9.29
Oriental 25.38 46.39 48.79 44.69 40.29 39.71 40.88 42.49 8.36
United India 32.07 43.95 49.26 62.92 51.96 54.75 49.15 50.61 10.47
Mean 26.33 37.90 40.14 48.30 44.16 44.81 40.27 40.00 10.61
Median 25.21 39.40 43.55 46.32 43.87 43.72 40.00
S.D. 3.99 9.12 11.77 10.65 6.80 8.03 10.60
Royal
Sundaram 17.48 11.45 6.67 7.10 8.44 9.01 10.03 8.73 4.02
Reliance 121.80 47.02 22.58 27.06 6.34 7.78 38.76 24.82 43.30
IFFCO-Tokio 18.25 11.26 8.01 7.49 9.83 9.97 10.80 9.90 3.90
TATA AIG 12.31 11.18 9.92 8.94 9.13 9.54 10.17 9.73 1.32
Bajaj Allianz 11.47 10.68 8.11 7.45 8.55 10.64 9.48 9.60 1.65
ICICI Lombard 33.45 19.62 16.01 12.12 9.37 12.61 17.20 14.31 8.71
Cholamandalam 168.67 32.16 12.03 13.19 9.88 8.23 40.69 12.61 63.30
HDFC CHUBB 42.94 14.05 8.48 9.36 10.99 8.59 15.74 10.18 13.49
Mean 53.30 19.68 11.48 11.59 9.07 9.55 19.11 10.66 28.44
Median 25.85 12.75 9.20 9.15 9.25 9.275 10.66
S.D. 59.09 13.23 5.37 6.63 1.36 1.54 28.44
Source: IRDA Annual Reports from 2002-03 to 2007-08.
Test of Significance
Test Ratio Z-value Asymp. Sig. (2-
tailed)
Mann- Whitney Test Investment Income
Ratio
-5.758 0.00
165

Table 6.5 highlights the investment income to net written premium ratio
of the public and private insurers for the period 2002-03 to 2007-08. The
results indicate that the average investment income ratios of the public and
private insurers are 40.27 per cent and 19.11 per cent respectively. Thus, it is
21.16 per cent higher in the case of public sector insurers. Among the public
sector insurers, United India exhibits the highest average investment income
ratio of 49.15 per cent followed by Oriental 40.88 per cent, New India 40.23
per cent and National 30.84 per cent. However, among the private insurers,
Cholamandalam exhibits the highest average investment income ratio of 40.69
per cent followed by Reliance 38.76 per cent, ICICI Lombard 17.20 per cent,
HDFC CHUBB 15.74 per cent, IFFCO-Tokio 10.80 per cent, Tata AIG 10.17
per cent, and Royal Sundaram 10.03 per cent. Bajaj Allianz has shown the least
average investment income ratio. There is a wide gap in the investment income
ratio of Cholamandalam and Reliance with other private sector insurance
companies and this is mainly due to the investment income ratio during the first
two years.
Year-wise, the average investment income of all the public insurers in
the year 2002-03 was 26.33 per cent which showed an increasing trend up to
2005-06 when it rose to 48.30 per cent. Then it showed a downward trend and
became 44.81 per cent in the year 2007-08. However, the private insurers'
average investment income ratio continuously exhibited a downward trend and
during the period 2002-03 to 2007-08, it decreased from 53.30 per cent to 9.55
per cent. The standard deviation of investment income ratio of the public
insurers is 10.61 per cent, while it is 28.44 per cent in the case of private
insurers which explains more variation in the investment income of the private
insurers. It brings out that the private sector has accumulated fewer
underwriting losses and generated less investment income and having been in
business much longer, the public sector companies have considerable
investment portfolios and have benefited greatly from the strong performance
of the Indian economy. The substantial investment portfolios of the public
sector have compensated for their relatively weaker underwriting performance.
166
The Mann-Whitney test also indicates that the gap in the investment income of
public sector insurance companies is significantly greater than that of the
private sector.
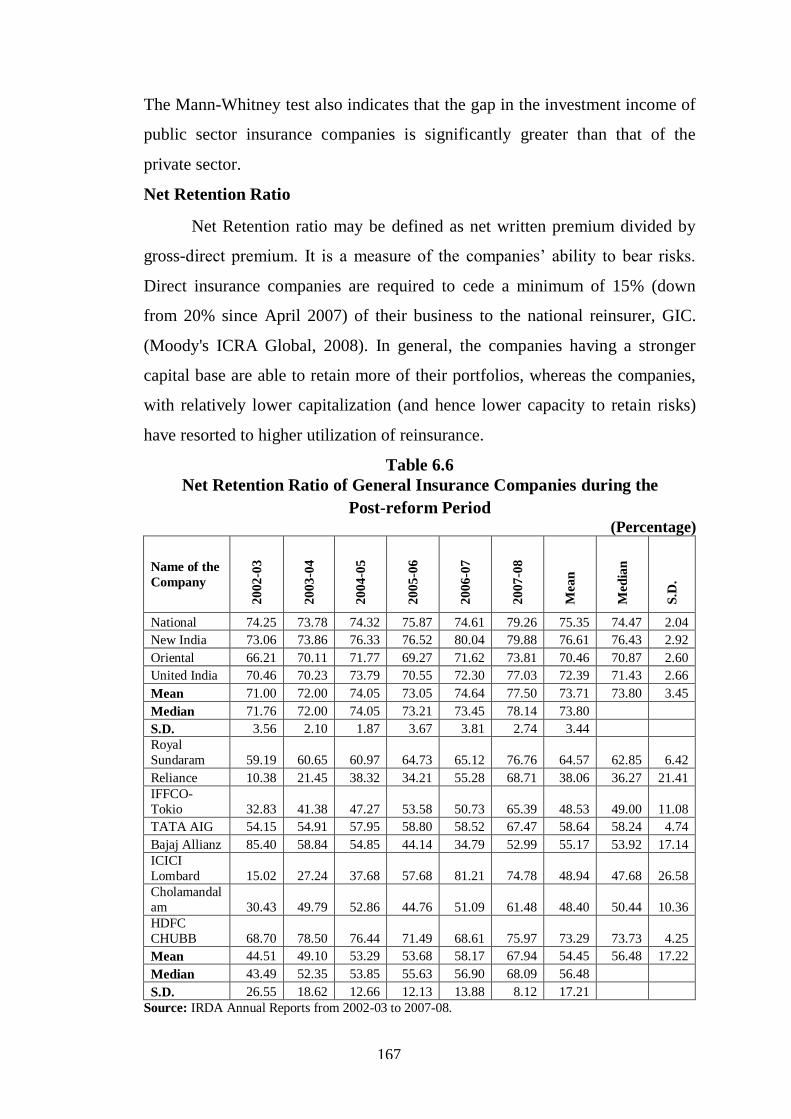
Net Retention Ratio
Net Retention ratio may be defined as net written premium divided by
gross-direct premium. It is a measure of the companies‟ ability to bear risks.
Direct insurance companies are required to cede a minimum of 15% (down
from 20% since April 2007) of their business to the national reinsurer, GIC.
(Moody's ICRA Global, 2008). In general, the companies having a stronger
capital base are able to retain more of their portfolios, whereas the companies,
with relatively lower capitalization (and hence lower capacity to retain risks)
have resorted to higher utilization of reinsurance.
Table 6.6
Net Retention Ratio of General Insurance Companies during the
Post-reform Period (Percentage)
Name of the
Company
20
02-0
3
20
03-0
4
20
04-0
5
20
05-0
6
20
06-0
7
20
07-0
8
Mea
n
Med
ian
S.D
.
National 74.25 73.78 74.32 75.87 74.61 79.26 75.35 74.47 2.04
New India 73.06 73.86 76.33 76.52 80.04 79.88 76.61 76.43 2.92
Oriental 66.21 70.11 71.77 69.27 71.62 73.81 70.46 70.87 2.60
United India 70.46 70.23 73.79 70.55 72.30 77.03 72.39 71.43 2.66
Mean 71.00 72.00 74.05 73.05 74.64 77.50 73.71 73.80 3.45
Median 71.76 72.00 74.05 73.21 73.45 78.14 73.80
S.D. 3.56 2.10 1.87 3.67 3.81 2.74 3.44
Royal
Sundaram 59.19 60.65 60.97 64.73 65.12 76.76 64.57 62.85 6.42
Reliance 10.38 21.45 38.32 34.21 55.28 68.71 38.06 36.27 21.41
IFFCO-
Tokio 32.83 41.38 47.27 53.58 50.73 65.39 48.53 49.00 11.08
TATA AIG 54.15 54.91 57.95 58.80 58.52 67.47 58.64 58.24 4.74
Bajaj Allianz 85.40 58.84 54.85 44.14 34.79 52.99 55.17 53.92 17.14
ICICI
Lombard 15.02 27.24 37.68 57.68 81.21 74.78 48.94 47.68 26.58
Cholamandal
am 30.43 49.79 52.86 44.76 51.09 61.48 48.40 50.44 10.36
HDFC
CHUBB 68.70 78.50 76.44 71.49 68.61 75.97 73.29 73.73 4.25
Mean 44.51 49.10 53.29 53.68 58.17 67.94 54.45 56.48 17.22
Median 43.49 52.35 53.85 55.63 56.90 68.09 56.48
S.D. 26.55 18.62 12.66 12.13 13.88 8.12 17.21
Source: IRDA Annual Reports from 2002-03 to 2007-08.
167

Test of Significance
Test Ratio Z-value Asymp. Sig. (2-tailed)
Mann- Whitney Test Net Retention
Ratio
-5.05 0.00
Table 6.6 presents the trends of net retention ratio of all the public and
private sector general insurance companies from the years 2002-03 to 2007-08.
The average net retention ratio of the public insurers during the period of study
is 73.71 per cent, whereas it is 54.45 per cent in the case of private insurers. It
is evident that the average net retention ratio of the public insurers is 19.26 per
cent higher than that of the private insurers. Among the public insurers, New
India has exhibited the highest average net retention ratio of 76.61 per cent
followed by National with a percentage of 75.35 per cent, United India has
72.39 per cent and Oriental 70.46 per cent. Among the private insurers, HDFC
CHUBB has exhibited the highest average net retention ratio of 73.29 per cent
followed by Royal Sundaram with a percentage of 64.57 per cent, Tata AIG
58.64 per cent, Bajaj Allianz 55.17 per cent, ICICI Lombard 48.94 per cent,
IFFCO-Tokio 48.53 per cent, Cholamandalam 48.40 per cent and Reliance
38.06 per cent. The Year-wise trends indicate that, the public insurers have
reported on upward trend. Their average net retention ratio in the year 2002-03
was 71.00 per cent which increased to 77.50 per cent in the year 2007-08.
Similarly, the private insurers also reported an upward trend. Their average net
retention ratio in the year 2002-03 was 44.51 per cent which increased to 67.94
per cent in the year 2007-08. The standard deviation values of the net retention
ratio of both the public and private insurers are 3.45 per cent and 17.22 per cent
respectively, indicating higher consistency of the public insurers regarding net
retention. As is evident from the above analysis, the investment income offset
the effect of underwriting loss and contributing to the profitability of insurers.
The main reason for greater investment income of the public sector companies
is their high net retention which enables them to use more premiums in
investments. So, in order to increase their investment income and profitability,
the private sector companies need to enhance their net retention.
168
In general, the strong capital base of public sector companies has
enabled them to retain more of their portfolio, which the private insurers with a
weak capitalization (and hence lower capacity to retain risks) have resorted to
higher utilization of reinsurance resulting in lower net retention. The Mann-
Whitney test indicates that there is a significant gap between the net retention
ratio of public and private insurers.
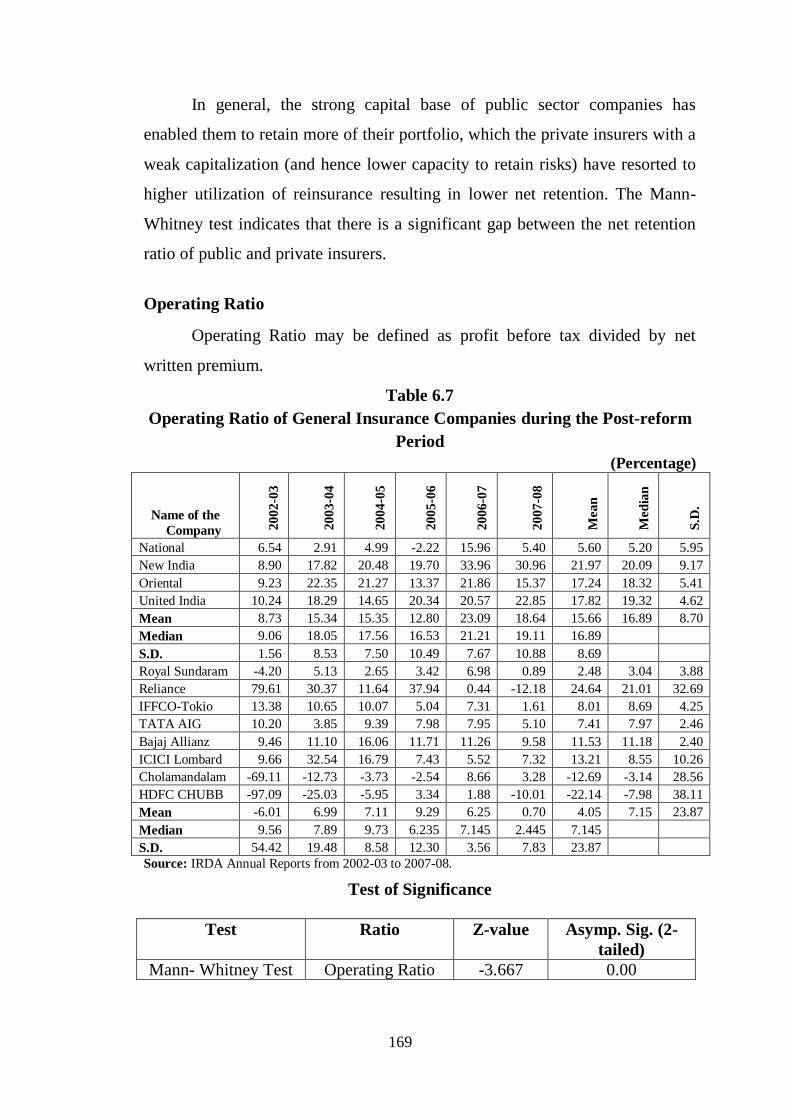
Operating Ratio
Operating Ratio may be defined as profit before tax divided by net
written premium.
Table 6.7
Operating Ratio of General Insurance Companies during the Post-reform
Period
(Percentage)
Name of the
Company 20
02
-03
20
03
-04
20
04
-05
20
05
-06
20
06
-07
20
07
-08
Mea
n
Med
ian
S.D
.
National 6.54 2.91 4.99 -2.22 15.96 5.40 5.60 5.20 5.95
New India 8.90 17.82 20.48 19.70 33.96 30.96 21.97 20.09 9.17
Oriental 9.23 22.35 21.27 13.37 21.86 15.37 17.24 18.32 5.41
United India 10.24 18.29 14.65 20.34 20.57 22.85 17.82 19.32 4.62
Mean 8.73 15.34 15.35 12.80 23.09 18.64 15.66 16.89 8.70
Median 9.06 18.05 17.56 16.53 21.21 19.11 16.89
S.D. 1.56 8.53 7.50 10.49 7.67 10.88 8.69
Royal Sundaram -4.20 5.13 2.65 3.42 6.98 0.89 2.48 3.04 3.88
Reliance 79.61 30.37 11.64 37.94 0.44 -12.18 24.64 21.01 32.69
IFFCO-Tokio 13.38 10.65 10.07 5.04 7.31 1.61 8.01 8.69 4.25
TATA AIG 10.20 3.85 9.39 7.98 7.95 5.10 7.41 7.97 2.46
Bajaj Allianz 9.46 11.10 16.06 11.71 11.26 9.58 11.53 11.18 2.40
ICICI Lombard 9.66 32.54 16.79 7.43 5.52 7.32 13.21 8.55 10.26
Cholamandalam -69.11 -12.73 -3.73 -2.54 8.66 3.28 -12.69 -3.14 28.56
HDFC CHUBB -97.09 -25.03 -5.95 3.34 1.88 -10.01 -22.14 -7.98 38.11
Mean -6.01 6.99 7.11 9.29 6.25 0.70 4.05 7.15 23.87
Median 9.56 7.89 9.73 6.235 7.145 2.445 7.145
S.D. 54.42 19.48 8.58 12.30 3.56 7.83 23.87
Source: IRDA Annual Reports from 2002-03 to 2007-08.
Test of Significance
Test Ratio Z-value Asymp. Sig. (2-
tailed)
Mann- Whitney Test Operating Ratio -3.667 0.00
169
Table 6.7 carried the data regarding operating ratio (profit before tax to
NWP) of both the public and private insurers for the period 2002-03 to 2007-
08. It is evident from the table that the average operating ratios of the public
and private sector general insurance companies for the period are 15.66 per
cent and 4.05 per cent respectively which indicates that the public sector
insurers average operating ratio is 11.61 per cent higher than that of the private
sector insurers. Among the public sector insurers, New India achieved the
highest average operating ratio of 21.97 per cent followed by United India,
Oriental and National with the respective percentages of 17.82 per cent, 17.24
per cent and 5.60 per cent. All the public insurers have earned operating profit
during all the years under study except National Insurance Company which
suffered operating loss of 2.22 per cent in the year 2005-06. Among the private
insurers, Reliance has exhibited the highest average operating ratio of 24.64 per
cent followed by ICICI Lombard, Bajaj Allianz, IFFCO-Tokio, Tata AIG and
Royal Sundaram with the respective percentages of 13.21 per cent, 11.53 per
cent, 8.01 per cent, 7.41 per cent and 2.48 per cent. The other private insurers
suffered average operating losses, whereas HDFC CHUBB showed the highest
negative average operating ratio of -22.14 per cent followed by
Cholamandalam with a percentage of -12.69 per cent. So, among the private
insurers, Reliance, ICICI Lombard and Bajaj Allianz have exhibited better
operating ratios as compared to other private insurers. Year-wise analysis
provides that the average operating ratio of the public insurers has shown an
upward trend during the period 2002-03 to 2004-05 when it increased from
8.73 per cent to 15.35 per cent, and again it came down to 12.80 per cent in the
year 2005-06, and further in 2007-08 it became 18.64 per cent. The private
insurers in the year 2002-03 showed a negative average operating ratio of -6.01
per cent. However, from the year 2003-04 onwards it registered a positive
operating ratio with no consistent trend, i.e., it showed an upward trend up to
2005-06 and again showed a downward trend from 2006-07 to 2007-08.
Overall, the public sector companies earned a higher average operating profit
as compared to their counter-parts. The Mann-Whitney test also indicates that
170

there is a significant gap between the operating ratios of the public and private
insurers.
Net Earning Ratio
The Net Earning Ratio shows how profitable the insurance business is.
This ratio reflects the summary of all activities during the period under review.
The Net Earning Ratio has been calculated by dividing profit after tax to net
written premium. Table 6.8 explains that the net earning ratios of the public
sector General Insurance Companies have improved during the period under
study.
Table 6.8
Net Earning Ratio of General Insurance Companies during the Post-
reform Period
(Percentage)
Name of the
Company
20
02
-03
20
03
-04
20
04
-05
20
05
-06
20
06
-07
20
07
-08
Mea
n
Med
ian
S.D
.
National 6.33 2.84 4.63 -3.96 14.75 5.13 4.95 4.88 6.03
New India 7.28 16.24 10.33 16.50 30.72 28.51 18.26 16.37 9.50
Oriental 3.34 15.56 14.90 11.35 17.27 0.32 10.46 13.13 7.02
United India 8.17 17.68 14.16 19.10 20.91 21.93 16.99 18.39 5.11
Mean 6.28 13.08 11.01 10.75 20.91 13.97 12.67 14.46 8.59
Median 6.80 15.90 12.24 13.92 19.08 13.52 14.45
S.D. 2.10 6.88 4.69 10.32 7.01 13.40 8.58
Royal
Sundaram -4.20 5.13 2.48 2.91 5.44 0.88 2.11 2.70 3.53
Reliance 100.31 26.06 9.41 25.86 0.32 -12.38 24.93 17.63 39.81
IFFCO-Tokio 9.08 7.18 6.27 3.06 4.67 0.97 5.21 5.47 2.93
TATA AIG -10.20 8.11 4.71 4.04 5.19 3.06 2.49 4.38 6.44
Bajaj Allianz 5.31 7.58 9.82 7.38 7.25 6.03 7.23 7.31 1.55
ICICI Lombard 7.66 24.48 15.06 6.86 4.71 5.78 10.76 7.26 7.66
Cholamandalam -69.11 -12.73 -3.73 -3.17 7.84 2.25 -13.11 -3.45 28.28
HDFC CHUBB -97.09 -25.03 -5.95 3.07 1.50 -10.14 -22.27 -8.05 38.01
Mean -7.28 5.10 4.76 6.25 4.62 -0.44 2.17 4.71 24.63
Median 0.55 7.38 5.49 3.55 4.94 1.61 4.71
S.D. 17.15 7.04 8.54 2.57 6.97 24.62
Source: IRDA Annual Reports from 2002-03 to 2007-08.
Test of Significance
Test Ratio Z-value Asymp. Sig. (2-
tailed)
Mann- Whitney Test Net Earning Ratio -3.548 0.00
171
Table 6.8 highlights the trends of net earning ratio (profit after tax to
NWP) of the public and private sector general insurance companies for the
period 2002-03 to 2007-08. The average net earning ratios of both the public
and the private insurers for the period are 12.67 per cent and 2.17 per cent
respectively which exhibits that the net earning ratio of public insurers is higher
by 10.50 per cent than that of the private insurers. Among the public sector
insurers, New India has earned the highest average net earning ratio of 18.26
per cent followed by United India, Oriental and National with the respective
percentages of 16.99 per cent, 10.46 per cent, and 4.95 per cent. All the public
insurers have shown operating profit during all the years under study except
National Insurance Company which suffered a loss of -3.96 per cent in the year
2005-06. Among the private insurers, Reliance has earned the highest average
net earning ratio of 24.93 per cent followed by ICICI Lombard, Bajaj Allianz,
IFFCO-Tokio, Tata AIG and Royal Sundaram with the respective percentages
of 10.76, 7.23, 5.21, 2.49 and 2.11. Among the other private insurers, HDFC
CHUBB suffered the highest average loss of -22.27 per cent followed by
Cholamandalam with a loss of -13.11 per cent. Year-wise analysis provides
that the public insurers have registered the highest average net earning ratios of
20.91 per cent and 13.97 per cent during the last two years, i.e., 2006-07 and
2007-08 respectively. However, no clear trend in the case of the public insurers
could be observed. In the case of private insurers, the average net earning ratio
is the highest, i.e., 6.25 per cent during the year 2005-06 followed by the ratios
both of 5.10 per cent, and 4.62 per cent during the years 2003-04 and 2006-07
respectively. The standard deviation values of both the public and private
sector insurers also indicate that there is greater consistency in the net earning
ratio of public insurers as compared to private insurers. The results of Mann-
Whitney test also indicate that there is a significant gap between the net earning
ratio of the public and private insurers.
172
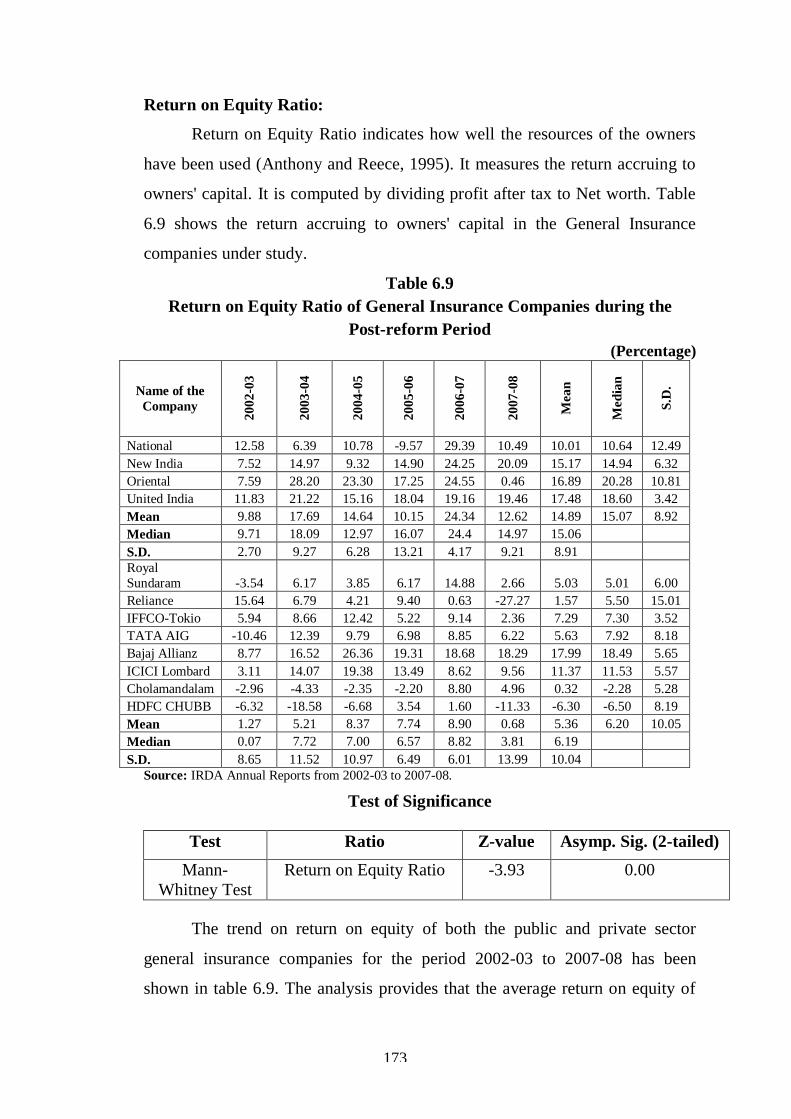
Return on Equity Ratio:
Return on Equity Ratio indicates how well the resources of the owners
have been used (Anthony and Reece, 1995). It measures the return accruing to
owners' capital. It is computed by dividing profit after tax to Net worth. Table
6.9 shows the return accruing to owners' capital in the General Insurance
companies under study.
Table 6.9
Return on Equity Ratio of General Insurance Companies during the
Post-reform Period
(Percentage)
Name of the
Company
2002
-03
2003
-04
2004
-05
2005
-06
2006
-07
20
07-0
8
Mean
Med
ian
S.D
.
National 12.58 6.39 10.78 -9.57 29.39 10.49 10.01 10.64 12.49
New India 7.52 14.97 9.32 14.90 24.25 20.09 15.17 14.94 6.32
Oriental 7.59 28.20 23.30 17.25 24.55 0.46 16.89 20.28 10.81
United India 11.83 21.22 15.16 18.04 19.16 19.46 17.48 18.60 3.42
Mean 9.88 17.69 14.64 10.15 24.34 12.62 14.89 15.07 8.92
Median 9.71 18.09 12.97 16.07 24.4 14.97 15.06
S.D. 2.70 9.27 6.28 13.21 4.17 9.21 8.91
Royal
Sundaram -3.54 6.17 3.85 6.17 14.88 2.66 5.03 5.01 6.00
Reliance 15.64 6.79 4.21 9.40 0.63 -27.27 1.57 5.50 15.01
IFFCO-Tokio 5.94 8.66 12.42 5.22 9.14 2.36 7.29 7.30 3.52
TATA AIG -10.46 12.39 9.79 6.98 8.85 6.22 5.63 7.92 8.18
Bajaj Allianz 8.77 16.52 26.36 19.31 18.68 18.29 17.99 18.49 5.65
ICICI Lombard 3.11 14.07 19.38 13.49 8.62 9.56 11.37 11.53 5.57
Cholamandalam -2.96 -4.33 -2.35 -2.20 8.80 4.96 0.32 -2.28 5.28
HDFC CHUBB -6.32 -18.58 -6.68 3.54 1.60 -11.33 -6.30 -6.50 8.19
Mean 1.27 5.21 8.37 7.74 8.90 0.68 5.36 6.20 10.05
Median 0.07 7.72 7.00 6.57 8.82 3.81 6.19
S.D. 8.65 11.52 10.97 6.49 6.01 13.99 10.04
Source: IRDA Annual Reports from 2002-03 to 2007-08.
Test of Significance
Test Ratio Z-value Asymp. Sig. (2-tailed)
Mann-
Whitney Test
Return on Equity Ratio -3.93 0.00
The trend on return on equity of both the public and private sector
general insurance companies for the period 2002-03 to 2007-08 has been
shown in table 6.9. The analysis provides that the average return on equity of
173
the public sector insurers is 14.89 per cent, and that of private sector insurers is
5.36 per cent which means the public sector insurers earn 9.53 per cent higher
average return on equity than the private insurers. Among the public sector
insurers, United India has earned the highest average return on equity of 17.48
per cent followed by Oriental, New India and National with the respective
percentage of 16.89, 15.17 and 10.01 per cent. All the public sector insurers
have shown a positive return on equity during all the years except National
Insurance Company which showed a negative return on equity in the year
2005-06 of -9.57 per cent. Among the private sector insurers, Bajaj Allianz
achieved the highest average return on equity of 17.99 per cent followed by
ICICI Lombard (11.37 per cent), IFFCO-Tokio (7.29 per cent), Tata AIG (5.63
per cent), Royal Sundaram (5.03 per cent), and Reliance (1.57 per cent). HDFC
CHUBB suffered a loss and showed a negative average return on equity of -
6.30 per cent. Year-wise analysis provides that public sector insurers' average
return on equity was the highest in the year 2006-07 which is 24.34 per cent
followed by the percentages of 17.69 per cent, 14.64 per cent and 12.62 per
cent which appeared during the years 2003-04, 2004-05 and 2007-08
respectively. In the case of the private insurers, the average return on equity is
the highest, i.e., 8.90 per cent in the year 2006-07 followed by 8.37 per cent,
7.74 per cent, 5.21 per cent which appeared during the years 2004-05, 2005-
06, and 2003-04 respectively. The Mann-Whitney test also indicates that there
is a significant gap between the return on equity of the public and private
insurers. The return on equity of the public insurers is significantly higher than
that of the private insurers. Therefore, the study rejected the hypothesis that the
profitability of the private insurers is significantly higher than that of the public
insurers.
On the basis of above analysis, it can be concluded that the private
sector General Insurance companies have shown better efficiency in terms of
claim incurred and combined ratio which resulted into lower underwriting
losses. A closer investigation of the product portfolio, through their annual
reports, reveals that it is mainly ascribed to the fact that the private companies
174
are concentrating more on the creamy business. In respect of loss making
portfolio, such as motor business, they have avoided to enter this business to
reduce their claim incurred ratio. Further investigation reveals that public
sector insurance companies do not get much of their business reinsured in
contrast to the private sector players, who get most of the business reinsured to
reduce their claim incurred ratio. But the higher investment return of the public
sector offsets their underwriting losses and resulted into their better operating,
net earning and returns on equity ratios. The main reason for higher investment
income of the public sector companies is their higher net retention which
enables these companies to use more premium in investment. So, in order to
increase the investment income and profitability, the private sector companies
need to increase their net retention. In general, the strong capital base of public
sector companies has enabled them to retain more of their portfolio, and private
insurers with lower capitalization (and hence lower capacity to retain risks)
have resorted to higher utilization of reinsurance resulted in lower net retention.
It has been found that the underwriting results and investment results are
negatively correlated. Good investment returns allow the public sector insurers
to post losses on underwriting without risking overall losses. But the prospects
for a rapid improvement in investment return are not certain. Equity markets
are currently weak, volatile and uncertain. So, due to uncertain prospects of
investment returns, the public sector general insurance companies must focus
on underwriting results to achieve greater profitability. On the other hand, the
private sector must bring more capital to improve net retention, increase risk
bearing capacity which resulted into their increase in business and investment
return.
6.4 Multivariate Profitability Analysis of the General Insurance
Companies in the Post-reform Period
Correlation analysis involves measuring the magnitude and direction of
the relationship between two or more variables. Interdependence among
variables is a common characteristic of most multivariate techniques and
correlation matrix is a table used to display correlation coefficients between
175
these variables. Matrices form the basis for computation and understanding of
the nature of relationships in multiple regressions, discriminant analysis, factor
analysis, and many other similar techniques. One sample t-test is used as a
parametric tool for testing the significance of correlation coefficient. The study
aimed at identifying the most important independent variable (s) which have
higher significant association with the dependent variable.
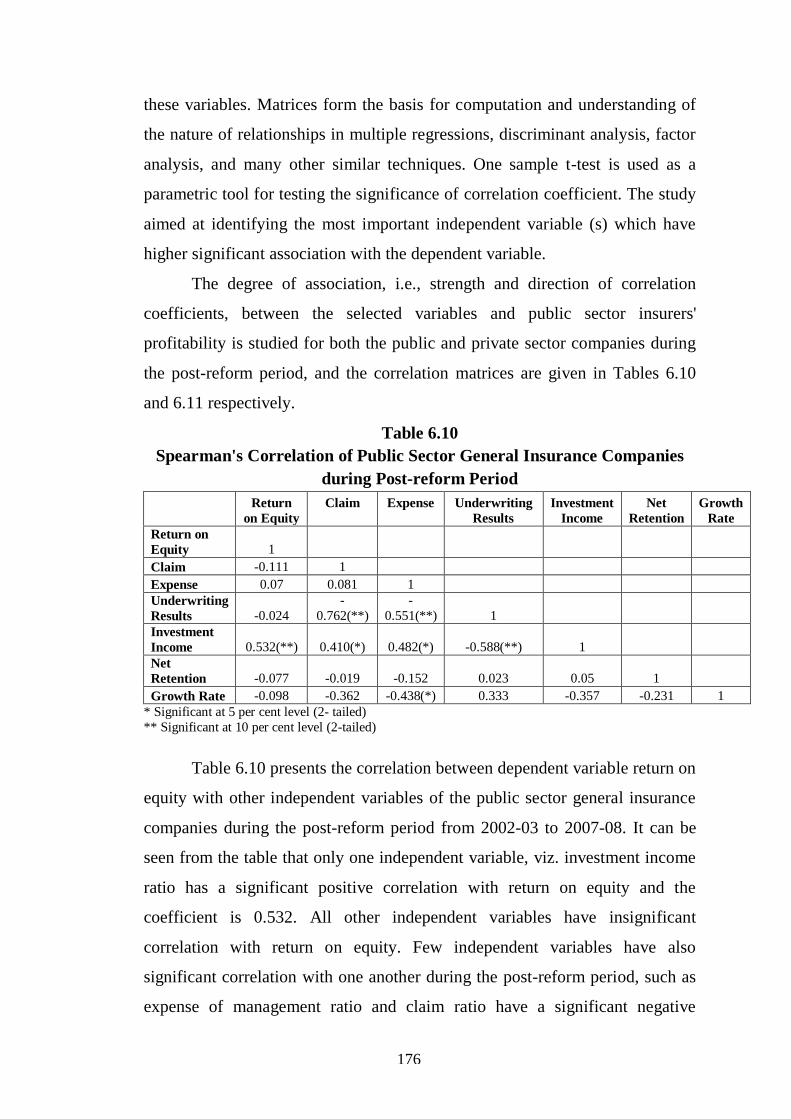
The degree of association, i.e., strength and direction of correlation
coefficients, between the selected variables and public sector insurers'
profitability is studied for both the public and private sector companies during
the post-reform period, and the correlation matrices are given in Tables 6.10
and 6.11 respectively.
Table 6.10
Spearman's Correlation of Public Sector General Insurance Companies
during Post-reform Period
Return
on Equity
Claim
Expense
Underwriting
Results
Investment
Income
Net
Retention
Growth
Rate
Return on
Equity 1
Claim -0.111 1
Expense 0.07 0.081 1
Underwriting
Results -0.024
-
0.762(**)
-
0.551(**) 1
Investment
Income 0.532(**) 0.410(*) 0.482(*) -0.588(**) 1
Net
Retention -0.077 -0.019 -0.152 0.023 0.05 1
Growth Rate -0.098 -0.362 -0.438(*) 0.333 -0.357 -0.231 1
* Significant at 5 per cent level (2- tailed)
** Significant at 10 per cent level (2-tailed)
Table 6.10 presents the correlation between dependent variable return on
equity with other independent variables of the public sector general insurance
companies during the post-reform period from 2002-03 to 2007-08. It can be
seen from the table that only one independent variable, viz. investment income
ratio has a significant positive correlation with return on equity and the
coefficient is 0.532. All other independent variables have insignificant
correlation with return on equity. Few independent variables have also
significant correlation with one another during the post-reform period, such as
expense of management ratio and claim ratio have a significant negative
176

correlation with underwriting results and their coefficients are -0.551 and -
0.762 respectively. Underwriting results have significant negative correlation
with investment income ratio due to this higher underwriting loss is offset by
higher investment income ratio of the public sector general insurance
companies resulted into higher profitability.
Table 6.11
Spearman's Correlations of Private Sector General Insurance Companies
during the Post-reform Period
Return
on
Equity Claim Expense
Underwriting
Results
Investment
Income
Net
Retention
Growt
h Rate
Return on
Equity 1
Claim 0.051 1
Expense
-
0.585(**) -0.294(*) 1
Underwriting
Results 0.793(**) -0.017 -0.497(**) 1
Investment
Income -0.101 -0.001 0.082 -0.408(**) 1
Net
Retention -0.352(*) 0.078 0.385(**) -0.168 -0.417(**) 1
Growth Rate -0.051
-
0.450(**) -0.157 -0.124 0.075 -0.134 1
* Significant at 5 per cent level (2- tailed)
** Significant at 10 per cent level (2-tailed)
Table 6.11 highlights the correlation between the dependent variable,
viz. return on equity with other independent variables of the eight private sector
general insurance companies during the post-reform period from 2002-03 to
2007-08. It can be seen from the table that two independent variables, namely,
expense of management ratio and net retention ratio have significant negative
correlation with return on equity and the coefficients are -0.585 and -0.352
respectively. Underwriting results have significant positive correlation with
return on equity and the coefficient is 0.793. Other independent variables,
namely, claim ratio, investment income ratio & growth rate have not significant
correlation with return on equity. Few independent variables have also
significant correlation with one another, such as claim ratio has significant
negative correlation with expense of management ratio and the coefficient is -
0.294. Expense of management has a significant negative correlation with
177
underwriting results; and underwriting results has a significant negative
correlation with investment income ratio and the coefficient is -0.408.
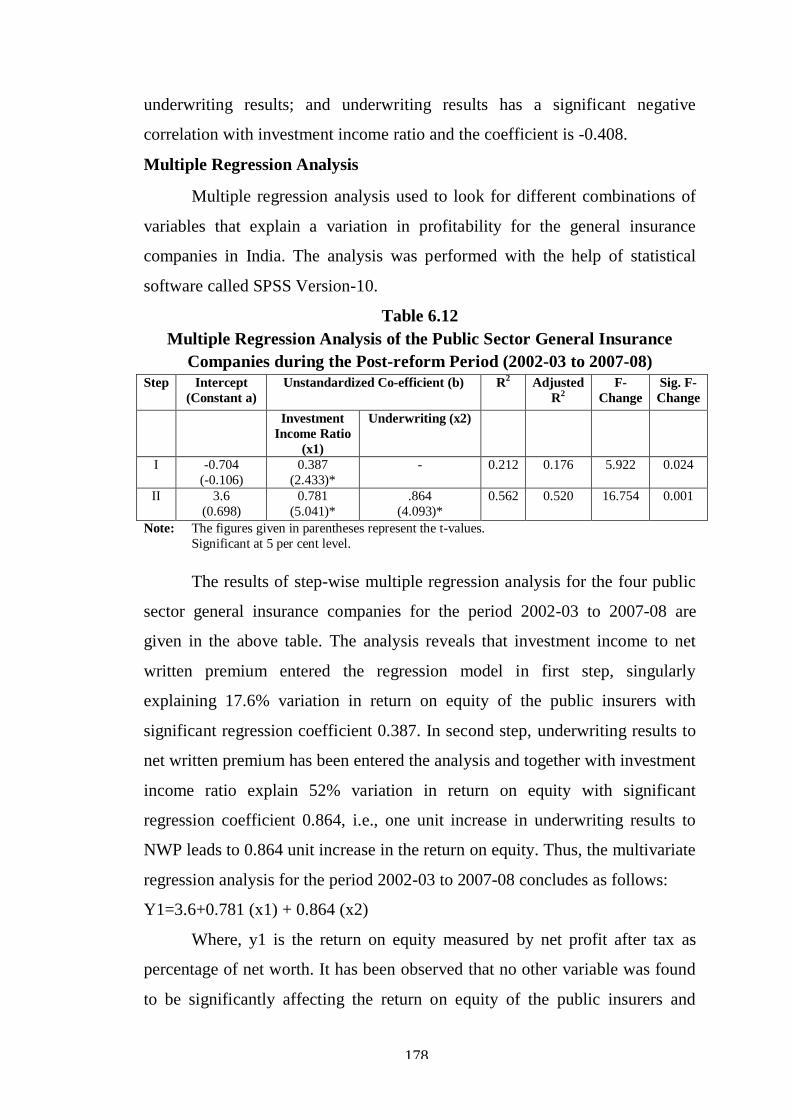
Multiple Regression Analysis
Multiple regression analysis used to look for different combinations of
variables that explain a variation in profitability for the general insurance
companies in India. The analysis was performed with the help of statistical
software called SPSS Version-10.
Table 6.12
Multiple Regression Analysis of the Public Sector General Insurance
Companies during the Post-reform Period (2002-03 to 2007-08)
Step Intercept
(Constant a)
Unstandardized Co-efficient (b) R2 Adjusted
R2
F-
Change
Sig. F-
Change
Investment
Income Ratio
(x1)
Underwriting (x2)
I -0.704
(-0.106)
0.387
(2.433)*
- 0.212 0.176 5.922 0.024
II 3.6
(0.698)
0.781
(5.041)*
.864
(4.093)*
0.562 0.520 16.754 0.001
Note: The figures given in parentheses represent the t-values.
Significant at 5 per cent level.
The results of step-wise multiple regression analysis for the four public
sector general insurance companies for the period 2002-03 to 2007-08 are
given in the above table. The analysis reveals that investment income to net
written premium entered the regression model in first step, singularly
explaining 17.6% variation in return on equity of the public insurers with
significant regression coefficient 0.387. In second step, underwriting results to
net written premium has been entered the analysis and together with investment
income ratio explain 52% variation in return on equity with significant
regression coefficient 0.864, i.e., one unit increase in underwriting results to
NWP leads to 0.864 unit increase in the return on equity. Thus, the multivariate
regression analysis for the period 2002-03 to 2007-08 concludes as follows:
Y1=3.6+0.781 (x1) + 0.864 (x2)
Where, y1 is the return on equity measured by net profit after tax as
percentage of net worth. It has been observed that no other variable was found
to be significantly affecting the return on equity of the public insurers and
178
investment income to NWP and underwriting results to NWP have been found
significantly affecting profitability of the public sector general insurance
companies during the period 2002-03 to 2007-08.
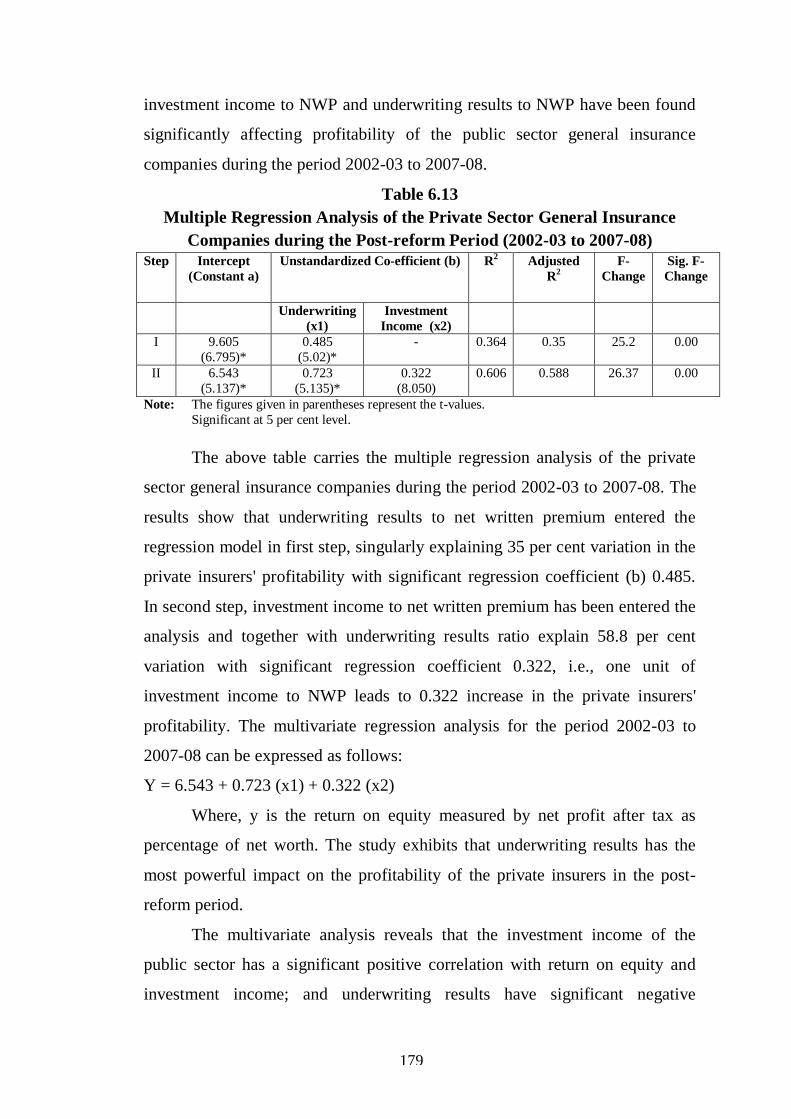
Table 6.13
Multiple Regression Analysis of the Private Sector General Insurance
Companies during the Post-reform Period (2002-03 to 2007-08)
Step Intercept
(Constant a)
Unstandardized Co-efficient (b) R2 Adjusted
R2
F-
Change
Sig. F-
Change
Underwriting
(x1)
Investment
Income (x2)
I 9.605
(6.795)*
0.485
(5.02)*
- 0.364 0.35 25.2 0.00
II 6.543
(5.137)*
0.723
(5.135)*
0.322
(8.050)
0.606 0.588 26.37 0.00
Note: The figures given in parentheses represent the t-values.
Significant at 5 per cent level.
The above table carries the multiple regression analysis of the private
sector general insurance companies during the period 2002-03 to 2007-08. The
results show that underwriting results to net written premium entered the
regression model in first step, singularly explaining 35 per cent variation in the
private insurers' profitability with significant regression coefficient (b) 0.485.
In second step, investment income to net written premium has been entered the
analysis and together with underwriting results ratio explain 58.8 per cent
variation with significant regression coefficient 0.322, i.e., one unit of
investment income to NWP leads to 0.322 increase in the private insurers'
profitability. The multivariate regression analysis for the period 2002-03 to
2007-08 can be expressed as follows:
Y = 6.543 + 0.723 (x1) + 0.322 (x2)
Where, y is the return on equity measured by net profit after tax as
percentage of net worth. The study exhibits that underwriting results has the
most powerful impact on the profitability of the private insurers in the post-
reform period.
The multivariate analysis reveals that the investment income of the
public sector has a significant positive correlation with return on equity and
investment income; and underwriting results have significant negative
179
correlation with each other. The regression results indicated that both
investment income and underwriting results have significant impact on the
profitability of public sector general insurance companies. The negative
correlation between underwriting results and investment income indicated the
trend that higher investment income resulted into lower underwriting profits
and vice-versa. The correlation analysis of the private sector indicated that
return on equity has a significant correlation with expenses of management and
net retention, and positive relation with underwriting results. The regression
analysis reported that both underwriting results and investment income have
significant impact on return on equity. As is evident from the analysis that the
significant variation in return on equity is due to both underwriting results and
investment income of both the public and private insurers. But all the insurers
have exhibited underwriting losses. So, in order to enhance their profitability,
these companies need to focus on their underwriting results.
6.5. Comparative Profitability Analysis of the Public Sector General
Insurance Companies in the Pre- and Post-reform Period
Market liberalization of insurance services involves removing
restrictions on foreign and domestic investment and allowing firms the freedom
to set rates. In the process of liberalization, the government generally sets
minimum capital requirements for insurers; introduces solvency margins; and
allows firms to engage in brokerage and perhaps reinsurance activities. The
liberalization of market may be partial, i.e., less than 100 per cent equity
ownership permitted or completely open, i.e.,100 per cent foreign equity
ownership allowed to foreign competition, although the WTO is pushing all
member countries towards complete openness over the long-term (WTO,
2004). Liberalization of insurance sector in India was initiated following the
report of R.N Malhotra Committee, which was set up in 1993 with an objective
of complementing the reforms in the Indian financial sector. The reforms are
aimed at creating more efficient and competitive financial system suitable for
the requirement of the economy. The year 1999 saw a revolution in the Indian
180
insurance sector, as major structural changes took place with the ending of
Government monopoly and the passage of the Insurance Regulatory and
Development Authority (IRDA) bill, lifting entry restrictions for private
players and allowing foreign players to enter the market with some limits on
direct foreign ownership. The insurance market has witnessed dynamic changes
due to liberalization and privatization of insurance sector, which has resulted in
increasing number of insurers. At present, in general insurance, there are six
public sector and fifteen private sector insurance companies.
The reforms in general insurance industry in India have far reaching
consequences in terms of market size, structure and operational practices. The
effect of reforms on the firm‟s performance has received bulk attention in the
national and international business research and has suggested that
liberalization has a positive long-term effect on economic growth and firm's
performance (Dollar, 1992; Sachs and Warner, 1997). The reforms brought an
overall increase in the awareness of the insuring public about the wider range
of choice of insurance products and the price offered by the competing insurers
in the market. The market share of public insurance companies has been
challenged in recent years by a variety of forces from internet disintermediation
to aggressive marketing by new entrants, financial services deregulation,
compliance pressure, competition from other investment vehicles and of course
customer empowerment (Capgemine and EFMA, 2007).
Since the onset of reforms, the public sector general insurance
companies have been compelled to review their philosophy and method of
working, in order to be ready for competition with the private sector
companies. The urgent response that is required from the existing public
insurers is clear that they must remain competitive by doing things better and
faster, and by ensuring cost effectiveness to improve profitability. Large
number of initiatives have been taken by these public sector companies to
compete with private sector companies to exist in the market. But still public
sector companies need to reassess their present status of profitability after
having modified their approach and philosophy. Now the time has come for
181

taking stock of the situation, how liberalization has affected the profitability of
public sector general insurance companies since profit is the main reason for
the continued existence of every commercial organisation. Sustainable
profitability is important for the safety and soundness of the industry and public
sector general insurance companies are no exception to this.
The study seeks to assess the comparative profitability of the public
sector general insurance companies in India in the pre-liberalization period and
the post-liberalization period with respect to the below mentioned drivers of
profitability.
Expense Ratio
The ratio of Expenses of Management as percentage of gross direct
premium reflects how much percentage of revenue is being utilised for
expenses on management. This ratio is a pointer of the cost effectiveness and
the productivity. Expenses of Management are generally operating expenses
which include employees‟ remuneration and benefits, office and administrative
expenses, etc. and a higher ratio reflects financial instability of the business
because a decrease in revenue may result in losses, whereas lower ratio is an
indicator of better operational performance. It becomes important to examine,
how far the public sector general insurance companies have been in a position
to reduce their operating cost during the post-liberalization period.
Table 6.14
Expense Ratio of Public Sector General Insurance Companies during Pre-
and Post-reform Period
(Percentage)
Pre-reform period
Year National New
India Oriental United Mean Median S.D.
1993-94 23.36 20.45 21.33 18.18 20.83 20.89 2.14
1994-95 25.62 18.70 22.19 18.69 21.30 20.44 3.31
1995-96 27.61 22.15 32.95 25.65 27.09 26.63 4.51
1996-97 31.10 29.31 27.12 25.91 28.36 28.21 2.30
1997-98 24.56 22.52 24.07 24.91 24.02 24.31 1.05
1998-99 28.75 22.42 24.58 23.36 24.78 23.97 2.79
1999-00 29.23 24.34 30.28 24.54 27.10 26.88 3.09
Mean 27.17 22.84 26.07 23.03 24.78 24.55 3.78
Median 27.61 22.42 24.58 24.54 24.55
S.D. 2.77 3.35 4.27 3.25 3.78
182

Post-reform Period
Year National New
India Oriental United Mean Median S.D.
2000-01 27.21 28.07 26.53 24.75 26.64 30.49 2.04
2001-02 30.59 27.95 32.22 31.56 30.58 33.83 2.60
2002-03 30.39 30.83 33.70 28.82 30.94 29.45 7.17
2003-04 32.08 43.05 41.70 38.77 38.90 35.62 4.70
2004-05 33.11 39.70 37.25 41.92 38.00 32.96 6.25
2005-06 38.13 38.76 38.16 46.75 40.45 35.21 3.92
2006-07 32.20 32.48 29.65 38.04 33.09 30.19 5.90
2007-08 34.55 30.08 33.17 36.42 33.56 39.98 4.59
Mean 32.28 33.87 34.05 35.88 34.02 32.79 5.34
Median 32.14 31.65 33.43 37.23 32.79
S.D. 3.21 5.81 4.86 7.17 5.34
Source: IRDA Annual Reports from 2000-01 to 2007-08.
Annual reports of National, New India, Oriental & United India from 1993-94 to 1999-00.
Test of Significance
Test Ratio Z-value Asymp. Sig. (2-
tailed)
Mann- Whitney Test Expense Ratio -5.73 0.00
Table 6.14 presents the comparative expense of management ratio of the
four public sector general insurance companies during the pre- and post-reform
period. The study shows that during the pre-reform period, the average expense
of management ratio of National, New India, Oriental and United India was
27.17 per cent, 22.84 per cent, 26.07 per cent and 23.03 per cent respectively.
Similarly, during the post-reform period, the average expense ratio of National,
New India, Oriental and United India was 32.28 per cent, 33.87 per cent, 34.05
per cent and 35.88 per cent respectively. The results indicate that the expenses
of management of all the public insurers have increased during the post-reform
period as compared to the pre-reform period. However, the increase in expense
is not the same for all the four public insurers. The highest average increase of
expense of management ratio during the post-reform period as compared to the
pre-reform period of United India was 12.85 per cent followed by New India
(11.03 per cent), Oriental (7.98 per cent), and National (5.11 per cent). During
the pre-reform period, among the public sector insurers, National Insurance
Company registered the highest average expense ratio, whereas during the
post-reform period, it registered the lowest average expense ratio. Overall, the
183
average expense ratio of all the public insurers during the pre- and post-reform
period is 24.78 per cent and 34.02 per cent respectively which shows an
increase of 9.24 per cent in average expense ratio during the post-reform
period. A glance at the year-wise results during the post-reform period provides
that the average expense ratio showed an increasing trend during the period
2000-01 to 2005-06 when it increased from 26.64 per cent to 40.45 per cent.
Later on, it decreased to 33.56 per cent in the year 2007-08. The results of
Mann-Whitney test also exhibit a significant increase in expense of
management ratio during the post-reform period which is higher than the pre-
reform period. The increase of expense ratio in the post-reform period is
mainly due to higher spending of the public insurers on advertisements,
commission and other expenses to compete with the private insurers.
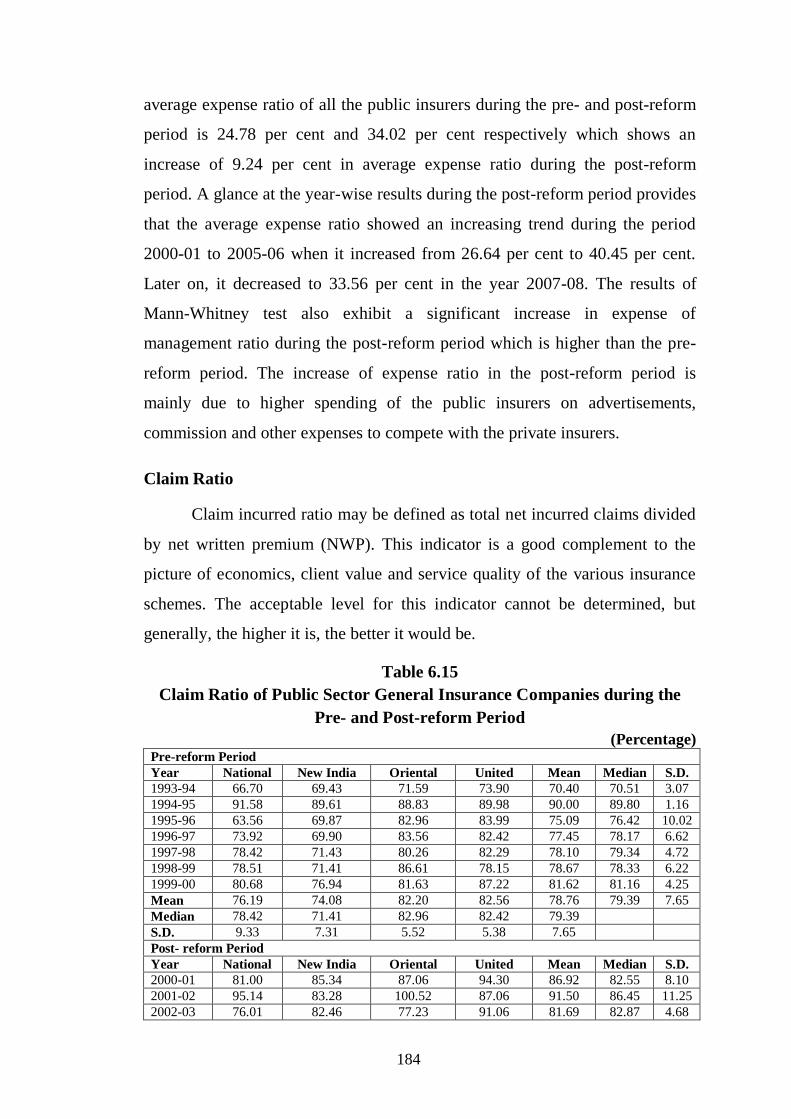
Claim Ratio
Claim incurred ratio may be defined as total net incurred claims divided
by net written premium (NWP). This indicator is a good complement to the
picture of economics, client value and service quality of the various insurance
schemes. The acceptable level for this indicator cannot be determined, but
generally, the higher it is, the better it would be.
Table 6.15
Claim Ratio of Public Sector General Insurance Companies during the
Pre- and Post-reform Period
(Percentage) Pre-reform Period
Year National New India Oriental United Mean Median S.D.
1993-94 66.70 69.43 71.59 73.90 70.40 70.51 3.07
1994-95 91.58 89.61 88.83 89.98 90.00 89.80 1.16
1995-96 63.56 69.87 82.96 83.99 75.09 76.42 10.02
1996-97 73.92 69.90 83.56 82.42 77.45 78.17 6.62
1997-98 78.42 71.43 80.26 82.29 78.10 79.34 4.72
1998-99 78.51 71.41 86.61 78.15 78.67 78.33 6.22
1999-00 80.68 76.94 81.63 87.22 81.62 81.16 4.25
Mean 76.19 74.08 82.20 82.56 78.76 79.39 7.65
Median 78.42 71.41 82.96 82.42 79.39
S.D. 9.33 7.31 5.52 5.38 7.65
Post- reform Period
Year National New India Oriental United Mean Median S.D.
2000-01 81.00 85.34 87.06 94.30 86.92 82.55 8.10
2001-02 95.14 83.28 100.52 87.06 91.50 86.45 11.25
2002-03 76.01 82.46 77.23 91.06 81.69 82.87 4.68
184
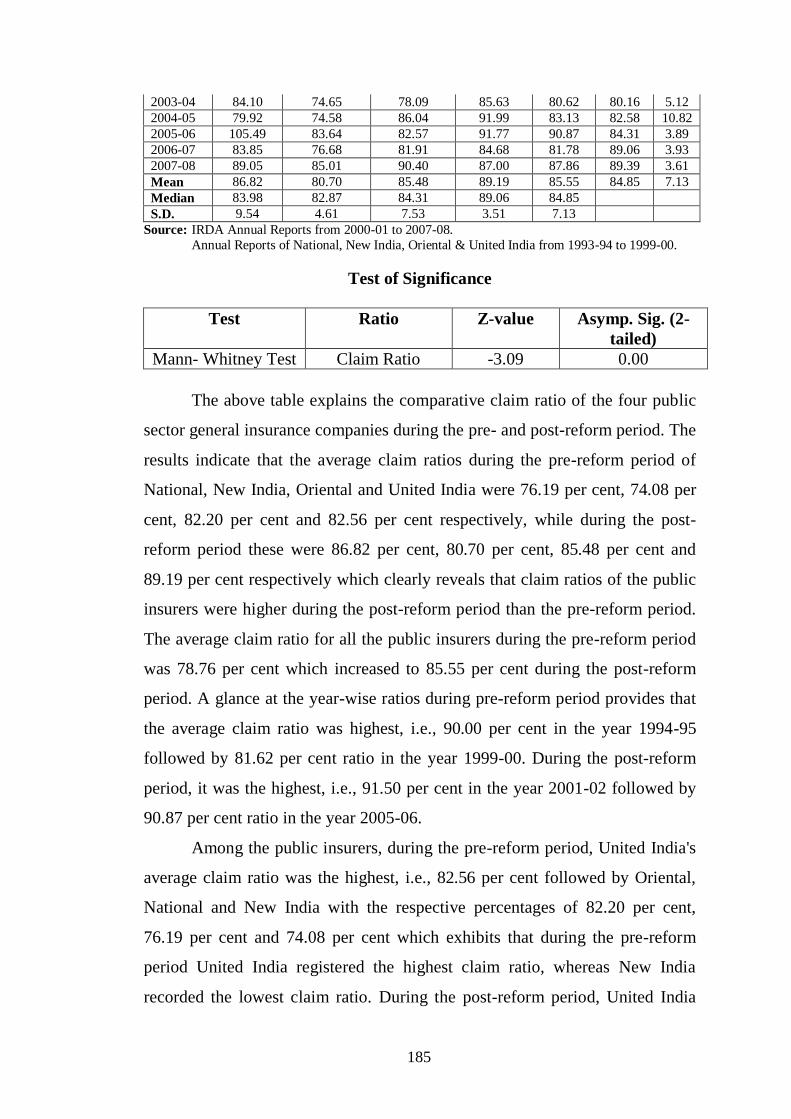
2003-04 84.10 74.65 78.09 85.63 80.62 80.16 5.12
2004-05 79.92 74.58 86.04 91.99 83.13 82.58 10.82
2005-06 105.49 83.64 82.57 91.77 90.87 84.31 3.89
2006-07 83.85 76.68 81.91 84.68 81.78 89.06 3.93
2007-08 89.05 85.01 90.40 87.00 87.86 89.39 3.61
Mean 86.82 80.70 85.48 89.19 85.55 84.85 7.13
Median 83.98 82.87 84.31 89.06 84.85
S.D. 9.54 4.61 7.53 3.51 7.13
Source: IRDA Annual Reports from 2000-01 to 2007-08.
Annual Reports of National, New India, Oriental & United India from 1993-94 to 1999-00.
Test of Significance
Test Ratio Z-value Asymp. Sig. (2-
tailed)
Mann- Whitney Test Claim Ratio -3.09 0.00
The above table explains the comparative claim ratio of the four public
sector general insurance companies during the pre- and post-reform period. The
results indicate that the average claim ratios during the pre-reform period of
National, New India, Oriental and United India were 76.19 per cent, 74.08 per
cent, 82.20 per cent and 82.56 per cent respectively, while during the post-
reform period these were 86.82 per cent, 80.70 per cent, 85.48 per cent and
89.19 per cent respectively which clearly reveals that claim ratios of the public
insurers were higher during the post-reform period than the pre-reform period.
The average claim ratio for all the public insurers during the pre-reform period
was 78.76 per cent which increased to 85.55 per cent during the post-reform
period. A glance at the year-wise ratios during pre-reform period provides that
the average claim ratio was highest, i.e., 90.00 per cent in the year 1994-95
followed by 81.62 per cent ratio in the year 1999-00. During the post-reform
period, it was the highest, i.e., 91.50 per cent in the year 2001-02 followed by
90.87 per cent ratio in the year 2005-06.
Among the public insurers, during the pre-reform period, United India's
average claim ratio was the highest, i.e., 82.56 per cent followed by Oriental,
National and New India with the respective percentages of 82.20 per cent,
76.19 per cent and 74.08 per cent which exhibits that during the pre-reform
period United India registered the highest claim ratio, whereas New India
recorded the lowest claim ratio. During the post-reform period, United India
185
showed the highest claim ratio of 89.19 per cent followed by National with
86.82 per cent. The Mann-Whitney test indicates that claim ratio of the public
insurers is significantly higher during the post-reform period than the pre-
reform period.
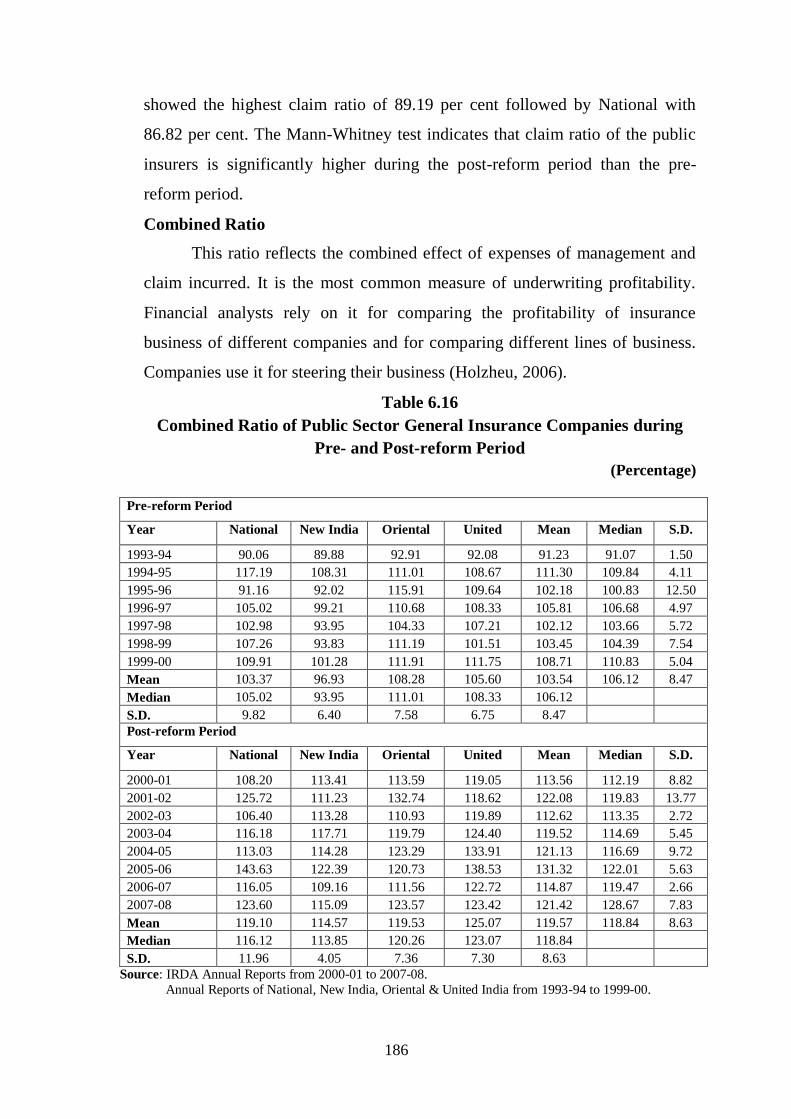
Combined Ratio
This ratio reflects the combined effect of expenses of management and
claim incurred. It is the most common measure of underwriting profitability.
Financial analysts rely on it for comparing the profitability of insurance
business of different companies and for comparing different lines of business.
Companies use it for steering their business (Holzheu, 2006).
Table 6.16
Combined Ratio of Public Sector General Insurance Companies during
Pre- and Post-reform Period
(Percentage)
Pre-reform Period
Year National New India Oriental United Mean Median S.D.
1993-94 90.06 89.88 92.91 92.08 91.23 91.07 1.50
1994-95 117.19 108.31 111.01 108.67 111.30 109.84 4.11
1995-96 91.16 92.02 115.91 109.64 102.18 100.83 12.50
1996-97 105.02 99.21 110.68 108.33 105.81 106.68 4.97
1997-98 102.98 93.95 104.33 107.21 102.12 103.66 5.72
1998-99 107.26 93.83 111.19 101.51 103.45 104.39 7.54
1999-00 109.91 101.28 111.91 111.75 108.71 110.83 5.04
Mean 103.37 96.93 108.28 105.60 103.54 106.12 8.47
Median 105.02 93.95 111.01 108.33 106.12
S.D. 9.82 6.40 7.58 6.75 8.47
Post-reform Period
Year National New India Oriental United Mean Median S.D.
2000-01 108.20 113.41 113.59 119.05 113.56 112.19 8.82
2001-02 125.72 111.23 132.74 118.62 122.08 119.83 13.77
2002-03 106.40 113.28 110.93 119.89 112.62 113.35 2.72
2003-04 116.18 117.71 119.79 124.40 119.52 114.69 5.45
2004-05 113.03 114.28 123.29 133.91 121.13 116.69 9.72
2005-06 143.63 122.39 120.73 138.53 131.32 122.01 5.63
2006-07 116.05 109.16 111.56 122.72 114.87 119.47 2.66
2007-08 123.60 115.09 123.57 123.42 121.42 128.67 7.83
Mean 119.10 114.57 119.53 125.07 119.57 118.84 8.63
Median 116.12 113.85 120.26 123.07 118.84
S.D. 11.96 4.05 7.36 7.30 8.63
Source: IRDA Annual Reports from 2000-01 to 2007-08.
Annual Reports of National, New India, Oriental & United India from 1993-94 to 1999-00.
186
Test of Significance
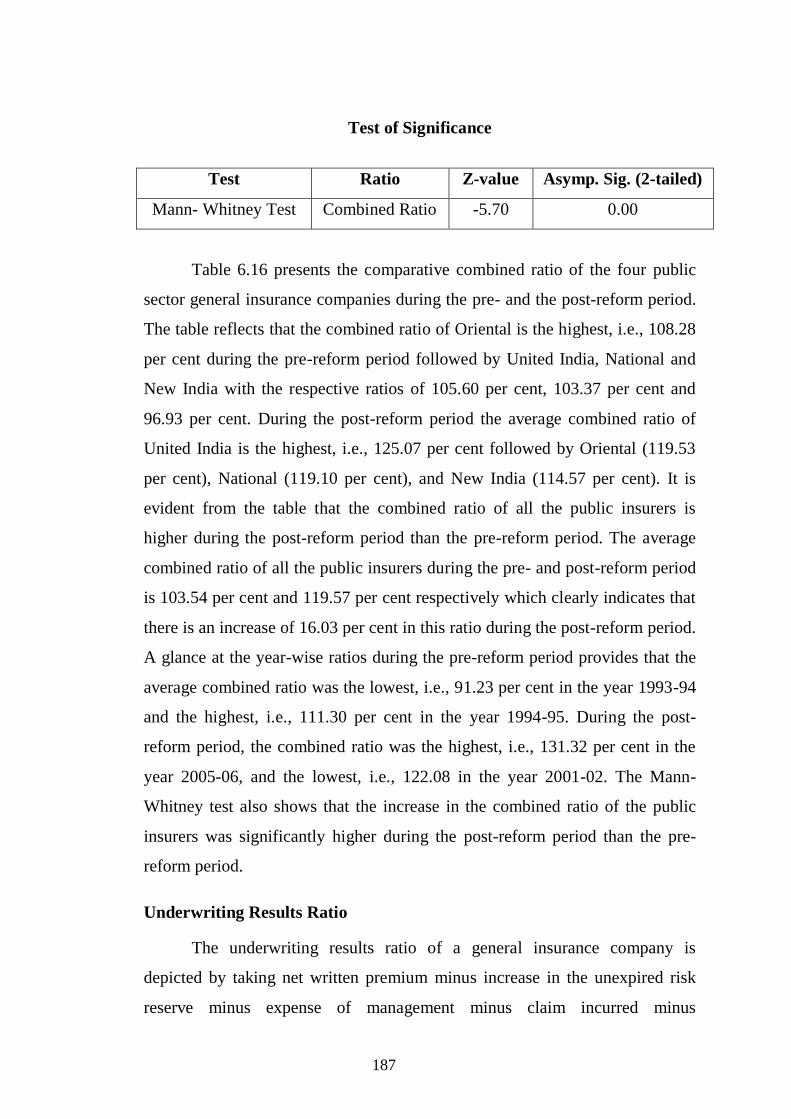
Test Ratio Z-value Asymp. Sig. (2-tailed)
Mann- Whitney Test Combined Ratio -5.70 0.00
Table 6.16 presents the comparative combined ratio of the four public
sector general insurance companies during the pre- and the post-reform period.
The table reflects that the combined ratio of Oriental is the highest, i.e., 108.28
per cent during the pre-reform period followed by United India, National and
New India with the respective ratios of 105.60 per cent, 103.37 per cent and
96.93 per cent. During the post-reform period the average combined ratio of
United India is the highest, i.e., 125.07 per cent followed by Oriental (119.53
per cent), National (119.10 per cent), and New India (114.57 per cent). It is
evident from the table that the combined ratio of all the public insurers is
higher during the post-reform period than the pre-reform period. The average
combined ratio of all the public insurers during the pre- and post-reform period
is 103.54 per cent and 119.57 per cent respectively which clearly indicates that
there is an increase of 16.03 per cent in this ratio during the post-reform period.
A glance at the year-wise ratios during the pre-reform period provides that the
average combined ratio was the lowest, i.e., 91.23 per cent in the year 1993-94
and the highest, i.e., 111.30 per cent in the year 1994-95. During the post-
reform period, the combined ratio was the highest, i.e., 131.32 per cent in the
year 2005-06, and the lowest, i.e., 122.08 in the year 2001-02. The Mann-
Whitney test also shows that the increase in the combined ratio of the public
insurers was significantly higher during the post-reform period than the pre-
reform period.
Underwriting Results Ratio
The underwriting results ratio of a general insurance company is
depicted by taking net written premium minus increase in the unexpired risk
reserve minus expense of management minus claim incurred minus
187

commission. The underwriting results indicate the performance of an insurance
company from core insurance business. The underwriting results ratio is
calculated by dividing underwriting results to net written premium.
Table 6.17
Underwriting Results Ratio of Public Sector General Insurance
Companies during the Pre- and Post-reform Period
(Percentage)
Pre-reform Period
Year National New India Oriental United Mean Median S.D.
1993-94 0.71 3.08 1.59 1.80 1.79 1.70 0.98
1994-95 -20.14 -13.31 -15.91 -11.84 -15.30 -14.61 3.64
1995-96 -3.53 -1.70 -26.55 -19.57 -12.84 -11.55 12.17
1996-97 -11.94 -4.37 -14.79 -12.90 -11.00 -12.42 4.58
1997-98 -7.35 2.94 -9.12 -12.29 -6.45 -8.24 6.59
1998-99 -14.52 0.60 -18.07 -7.92 -9.98 -11.22 8.21
1999-00 -14.36 -7.18 -1.83 -15.78 -9.79 -10.77 6.50
Mean -10.16 -2.85 -12.10 -11.21 -9.08 -10.48 8.03
Median -11.94 -1.70 -14.79 -12.29 -10.48
S.D. 7.18 5.95 9.73 6.77 8.03
Post-reform Period
Year National New India Oriental United Mean Median S.D.
2000-01 -13.74 -16.97 -16.00 -22.35 -17.26 -17.57 5.69
2001-02 -25.51 -18.05 -32.62 -22.15 -24.58 -24.03 10.27
2002-03 -14.14 -13.82 -13.21 -19.08 -15.06 -17.51 2.24
2003-04 -21.00 -18.96 -22.77 -25.09 -21.95 -17.38 5.93
2004-05 -18.96 -17.57 -27.56 -34.37 -24.62 -19.39 8.64
2005-06 -40.64 -27.50 -26.52 -39.94 -33.65 -25.09 4.23
2006-07 -19.13 -13.72 -18.12 -28.90 -19.97 -22.25 2.46
2007-08 -28.92 -17.18 -23.65 -29.62 -24.84 -32.00 5.10
Mean -22.75 -17.97 -22.56 -27.69 -22.74 -21.58 7.39
Median -20.07 -17.38 -23.21 -27.00 -21.58
S.D. 8.88 4.29 6.47 6.97 7.39
Source: IRDA Annual Reports from 2000-01 to 2007-08.
Annual Reports of National, New India, Oriental & United India from 1993-94 to 1999-00.
Test of Significance
Test Ratio Z-value Asymp. Sig. (2-tailed)
Mann- Whitney
Test
Under writing Ratio -5.32 0.00
Table 6.17 reports the trends of the underwriting results of the four
public sector general insurance companies for the pre- and post-reform period.
The table highlights underwriting losses in all the years of the pre- and post-
reform period except the year 1993-94 during the pre-reform period when the
188
four public sector insurers earned an average underwriting profit of 1.79 per
cent. During the pre-reform period, Oriental suffered the highest underwriting
loss of -12.10 per cent followed by United (-11.21 per cent), National (-10.16
per cent) and New India (-2.85 per cent), while during the post-reform period,
United recorded the highest underwriting loss of -27.69 per cent followed by
National (-22.75 per cent), Oriental (-22.56s per cent), and New India (-17.97
per cent). The average underwriting loss of the four public insurers during the
pre- and post-reform period is -9.08 per cent and -22.74 per cent respectively
which exhibits that there were more underwriting losses during the post-reform
period than the pre-reform period. A glance at the year-wise underwriting
losses during the pre-reform period provides that the year 1994-95 showed the
highest average underwriting loss of -15.30 per cent followed by -12.84 per
cent in the year 1995-96. However, during the post-reform period, the year
2005-06 registered the highest average underwriting loss of -33.65 per cent
followed by 2007-08 with a loss of -24.84 per cent. The Mann-Whitney test
also indicates significant increase in underwriting losses during the post-reform
period which is higher than that of the pre-reform period. The main reason of
higher underwriting losses of the four public insurers during the post-reform
period is mainly ascribed to their higher expenses of management and incurred
claim. So, public sector general insurance companies must reduce their staff
strength and use better technology to reduce expense of management. The
general insurance business in India has been detariffed with effect from 1st
January, 2007 and even companies are allowed to change the policy wordings
with effect from 1st April 2008. Now, it is a better time for the public sector to
revisit their loss making portfolios to improve upon their underwriting results.
Investment Income Ratio
Investment performance discloses the effectiveness and efficiency of
investment decisions. As such, investment performance becomes critical to the
financial solidity of an insurer. The investment performance is negatively
correlated to insolvency rate (Chen and Wong, 2004). It is also a function of
asset allocation and asset management as well as asset leverage. The
189

investment income ratio is determined by investment income to net written
premium.
Table 6.18
Investment Income Ratio of Public Sector General Insurance Companies
during the Pre- and Post-reform Period (Percentage)
Pre-reform Period
Year National New India Oriental United Mean Median S.D.
1993-94 19.83 23.86 19.89 20.69 21.07 20.29 1.90
1994-95 22.00 25.66 21.72 22.63 23.00 22.32 1.81
1995-96 21.39 26.78 22.69 24.86 23.93 23.78 2.38
1996-97 21.67 25.26 25.23 26.29 24.61 25.25 2.02
1997-98 22.54 29.51 25.26 26.00 25.83 25.63 2.87
1998-99 21.63 26.95 23.97 25.75 24.58 24.86 2.31
1999-00 21.33 27.68 22.52 25.35 24.22 23.94 2.86
Mean 21.48 26.53 23.04 24.51 23.89 23.92 2.51
Median 21.63 26.78 22.69 25.35 23.92
S.D. 0.84 1.82 1.94 2.08 2.51
Post-reform Period
Year National New India Oriental United Mean Median S.D.
2000-01 22.35 18.56 22.94 25.77 22.40 23.53 1.83
2001-02 24.26 28.00 24.06 30.53 26.71 36.99 6.52
2002-03 22.80 25.05 25.38 32.07 26.33 26.53 6.76
2003-04 26.42 34.85 46.39 43.95 37.90 47.60 4.70
2004-05 24.19 38.32 48.79 49.26 40.14 24.72 11.18
2005-06 37.64 47.96 44.69 62.92 48.30 42.49 4.24
2006-07 36.94 47.46 40.29 51.96 44.16 31.30 7.73
2007-08 37.04 47.74 39.71 54.75 44.81 53.36 5.91
Mean 28.95 35.99 36.53 43.90 36.35 36.99 11.59
Median 25.34 36.59 40.00 46.61 36.99
S.D. 6.94 11.38 10.71 13.20 11.59
Source: IRDA Annual Reports from 2000-01 to 2007-08.
Annual Reports of National, New India, Oriental & United India from 1993-94 to 1999-00.
Test of Significance
Test Ratio Z-value Asymp. Sig. (2-tailed)
Mann- Whitney Test Investment Income
Ratio
-4.46 0.00
Table 6.18 exhibits the results of investment income to NWP ratio of the
four public insurers for both the pre- and post-reform periods. The results
indicate that during the pre-reform period, New India showed the highest
average investment income ratio of 26.53 per cent followed by United India
(24.51 per cent), Oriental (23.04 per cent) and National (21.48 per cent).
During the post-reform period, United India exhibited the highest average
190
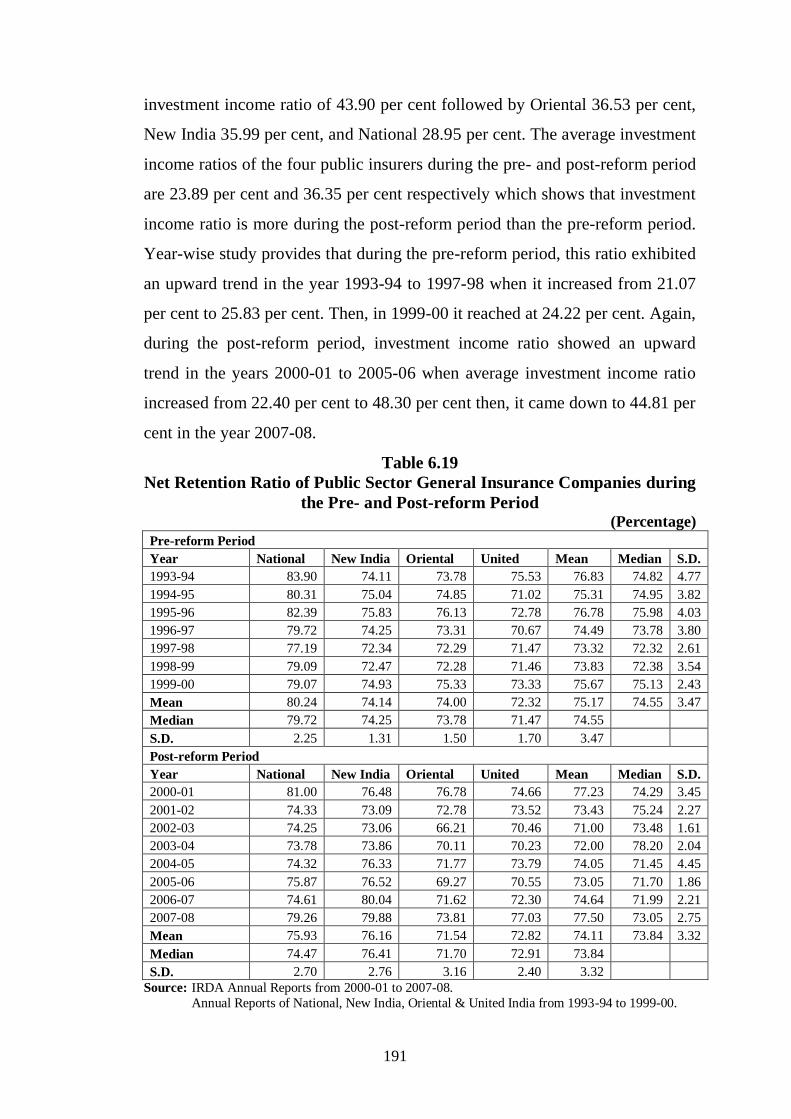
investment income ratio of 43.90 per cent followed by Oriental 36.53 per cent,
New India 35.99 per cent, and National 28.95 per cent. The average investment
income ratios of the four public insurers during the pre- and post-reform period
are 23.89 per cent and 36.35 per cent respectively which shows that investment
income ratio is more during the post-reform period than the pre-reform period.
Year-wise study provides that during the pre-reform period, this ratio exhibited
an upward trend in the year 1993-94 to 1997-98 when it increased from 21.07
per cent to 25.83 per cent. Then, in 1999-00 it reached at 24.22 per cent. Again,
during the post-reform period, investment income ratio showed an upward
trend in the years 2000-01 to 2005-06 when average investment income ratio
increased from 22.40 per cent to 48.30 per cent then, it came down to 44.81 per
cent in the year 2007-08.
Table 6.19
Net Retention Ratio of Public Sector General Insurance Companies during
the Pre- and Post-reform Period (Percentage)
Pre-reform Period
Year National New India Oriental United Mean Median S.D.
1993-94 83.90 74.11 73.78 75.53 76.83 74.82 4.77
1994-95 80.31 75.04 74.85 71.02 75.31 74.95 3.82
1995-96 82.39 75.83 76.13 72.78 76.78 75.98 4.03
1996-97 79.72 74.25 73.31 70.67 74.49 73.78 3.80
1997-98 77.19 72.34 72.29 71.47 73.32 72.32 2.61
1998-99 79.09 72.47 72.28 71.46 73.83 72.38 3.54
1999-00 79.07 74.93 75.33 73.33 75.67 75.13 2.43
Mean 80.24 74.14 74.00 72.32 75.17 74.55 3.47
Median 79.72 74.25 73.78 71.47 74.55
S.D. 2.25 1.31 1.50 1.70 3.47
Post-reform Period
Year National New India Oriental United Mean Median S.D.
2000-01 81.00 76.48 76.78 74.66 77.23 74.29 3.45
2001-02 74.33 73.09 72.78 73.52 73.43 75.24 2.27
2002-03 74.25 73.06 66.21 70.46 71.00 73.48 1.61
2003-04 73.78 73.86 70.11 70.23 72.00 78.20 2.04
2004-05 74.32 76.33 71.77 73.79 74.05 71.45 4.45
2005-06 75.87 76.52 69.27 70.55 73.05 71.70 1.86
2006-07 74.61 80.04 71.62 72.30 74.64 71.99 2.21
2007-08 79.26 79.88 73.81 77.03 77.50 73.05 2.75
Mean 75.93 76.16 71.54 72.82 74.11 73.84 3.32
Median 74.47 76.41 71.70 72.91 73.84
S.D. 2.70 2.76 3.16 2.40 3.32
Source: IRDA Annual Reports from 2000-01 to 2007-08.
Annual Reports of National, New India, Oriental & United India from 1993-94 to 1999-00.
191
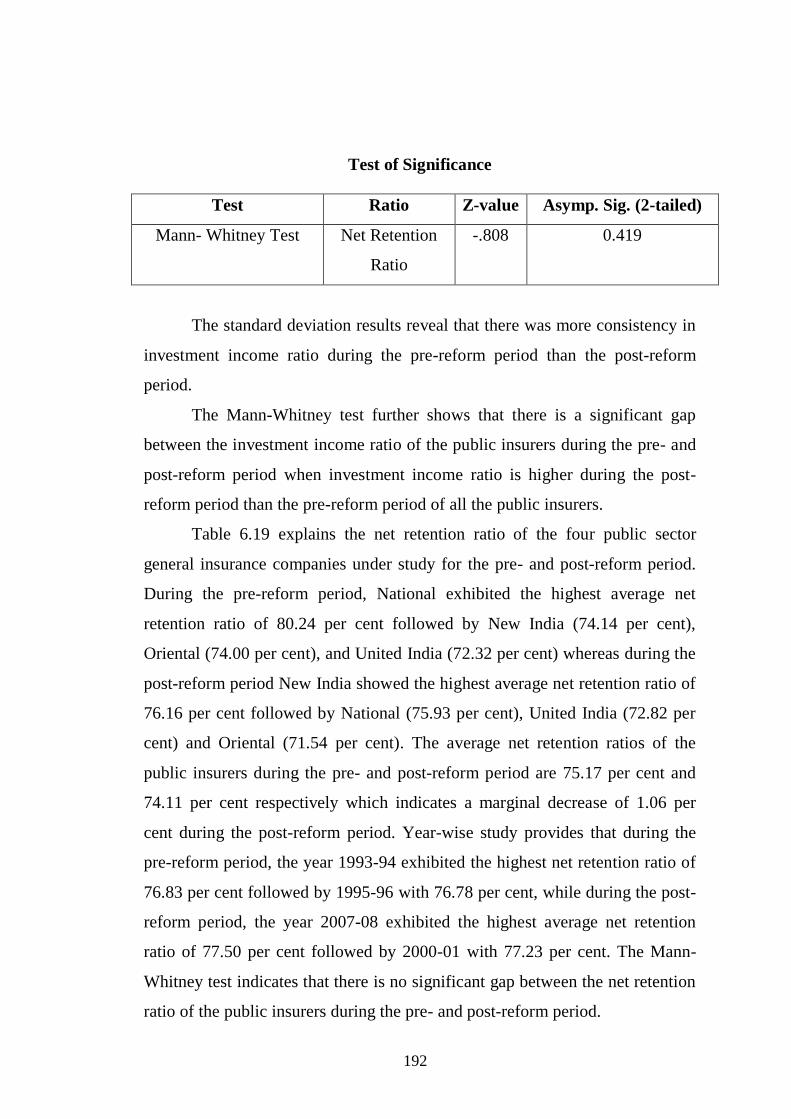
Test of Significance
Test Ratio Z-value Asymp. Sig. (2-tailed)
Mann- Whitney Test Net Retention
Ratio
-.808 0.419
The standard deviation results reveal that there was more consistency in
investment income ratio during the pre-reform period than the post-reform
period.
The Mann-Whitney test further shows that there is a significant gap
between the investment income ratio of the public insurers during the pre- and
post-reform period when investment income ratio is higher during the post-
reform period than the pre-reform period of all the public insurers.
Table 6.19 explains the net retention ratio of the four public sector
general insurance companies under study for the pre- and post-reform period.
During the pre-reform period, National exhibited the highest average net
retention ratio of 80.24 per cent followed by New India (74.14 per cent),
Oriental (74.00 per cent), and United India (72.32 per cent) whereas during the
post-reform period New India showed the highest average net retention ratio of
76.16 per cent followed by National (75.93 per cent), United India (72.82 per
cent) and Oriental (71.54 per cent). The average net retention ratios of the
public insurers during the pre- and post-reform period are 75.17 per cent and
74.11 per cent respectively which indicates a marginal decrease of 1.06 per
cent during the post-reform period. Year-wise study provides that during the
pre-reform period, the year 1993-94 exhibited the highest net retention ratio of
76.83 per cent followed by 1995-96 with 76.78 per cent, while during the post-
reform period, the year 2007-08 exhibited the highest average net retention
ratio of 77.50 per cent followed by 2000-01 with 77.23 per cent. The Mann-
Whitney test indicates that there is no significant gap between the net retention
ratio of the public insurers during the pre- and post-reform period.
192
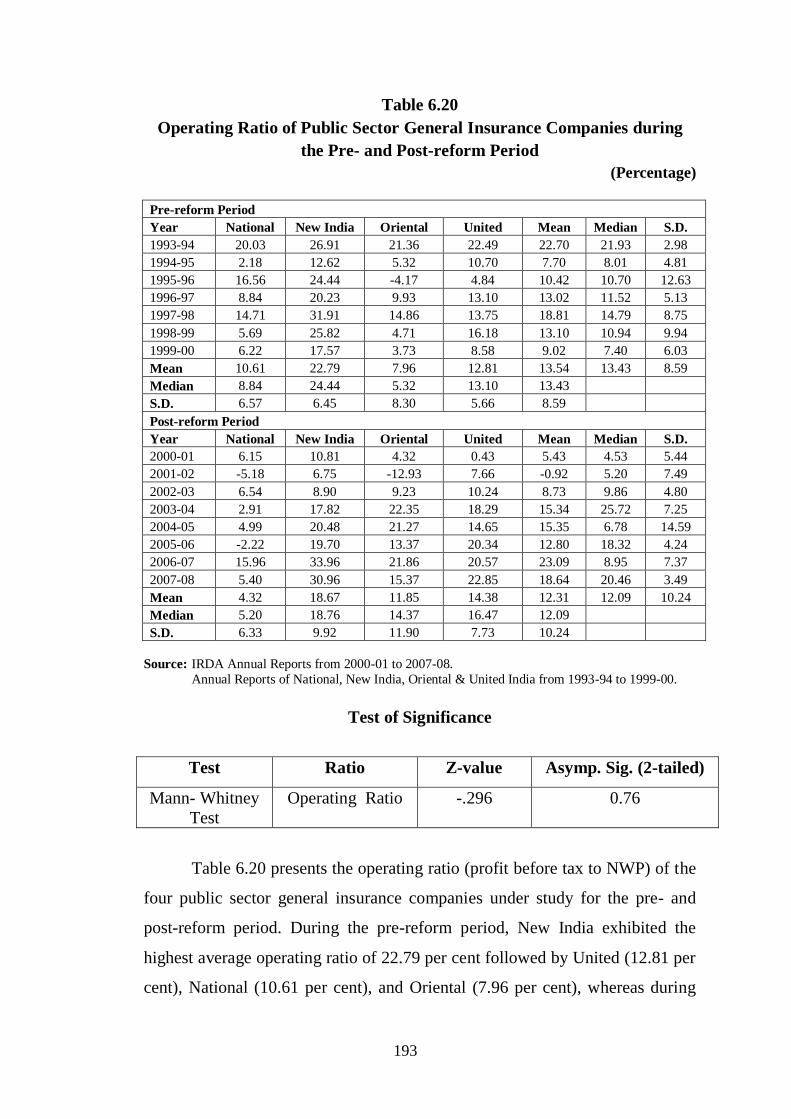
Table 6.20
Operating Ratio of Public Sector General Insurance Companies during
the Pre- and Post-reform Period
(Percentage)
Pre-reform Period
Year National New India Oriental United Mean Median S.D.
1993-94 20.03 26.91 21.36 22.49 22.70 21.93 2.98
1994-95 2.18 12.62 5.32 10.70 7.70 8.01 4.81
1995-96 16.56 24.44 -4.17 4.84 10.42 10.70 12.63
1996-97 8.84 20.23 9.93 13.10 13.02 11.52 5.13
1997-98 14.71 31.91 14.86 13.75 18.81 14.79 8.75
1998-99 5.69 25.82 4.71 16.18 13.10 10.94 9.94
1999-00 6.22 17.57 3.73 8.58 9.02 7.40 6.03
Mean 10.61 22.79 7.96 12.81 13.54 13.43 8.59
Median 8.84 24.44 5.32 13.10 13.43
S.D. 6.57 6.45 8.30 5.66 8.59
Post-reform Period
Year National New India Oriental United Mean Median S.D.
2000-01 6.15 10.81 4.32 0.43 5.43 4.53 5.44
2001-02 -5.18 6.75 -12.93 7.66 -0.92 5.20 7.49
2002-03 6.54 8.90 9.23 10.24 8.73 9.86 4.80
2003-04 2.91 17.82 22.35 18.29 15.34 25.72 7.25
2004-05 4.99 20.48 21.27 14.65 15.35 6.78 14.59
2005-06 -2.22 19.70 13.37 20.34 12.80 18.32 4.24
2006-07 15.96 33.96 21.86 20.57 23.09 8.95 7.37
2007-08 5.40 30.96 15.37 22.85 18.64 20.46 3.49
Mean 4.32 18.67 11.85 14.38 12.31 12.09 10.24
Median 5.20 18.76 14.37 16.47 12.09
S.D. 6.33 9.92 11.90 7.73 10.24
Source: IRDA Annual Reports from 2000-01 to 2007-08.
Annual Reports of National, New India, Oriental & United India from 1993-94 to 1999-00.
Test of Significance
Test Ratio Z-value Asymp. Sig. (2-tailed)
Mann- Whitney
Test
Operating Ratio -.296 0.76
Table 6.20 presents the operating ratio (profit before tax to NWP) of the
four public sector general insurance companies under study for the pre- and
post-reform period. During the pre-reform period, New India exhibited the
highest average operating ratio of 22.79 per cent followed by United (12.81 per
cent), National (10.61 per cent), and Oriental (7.96 per cent), whereas during
193
the post-reform period, New India exhibited the highest average operating ratio
of 18.67 per cent followed by United India (14.38 per cent), Oriental (11.85 per
cent), and National (4.32 per cent). New India earned the highest operating
ratio during both the periods. The average operating ratio of all the four public
sector insurers during the pre-reform period was 13.54 per cent, whereas it was
12.31 per cent during the post-reform period. It indicates that the ratio is
marginally higher by 1.23 per cent during the pre-reform period. All the public
sector insurers earned operating profit during the pre-reform period except
Oriental Insurance Co. which suffered an average operating loss of -4.17 per
cent during the year 1995-96. Year-wise analysis provides that during the pre-
reform period, the public insurers showed the highest average operating ratio of
22.70 per cent in the year 1993-94. The average operating ratio showed an
upward trend during the period 1994-95 to 1997-98 when it rose from 7.70 per
cent to 18.81 per cent. After this period, it showed a downward trend and
reached at 9.02 per cent in the year 1999-00. During the post-reform period, the
average operating ratio was the highest, i.e., 23.09 per cent in the year 2006-07.
It showed an upward trend during the period 2001-02 to 2004-05, when it rose
from -0.92 per cent to 15.35 per cent. The Mann-Whitney test indicates that
there is no significant gap between the operating ratio of the public insurers
during the pre- and post-reform period.
Net Earning Ratio
The Net Earning Ratio shows how profitable the insurance business is.
This ratio reflects the summary of all activities during the period under review.
The Net Earning Ratio has been calculated by dividing profit after tax to net
written premium. Table 6.21 explains that the net earnings of the public sector
general insurance companies have improved during the period under study.
194

Table 6.21
Net Earning Ratio of Public Sector General Insurance Companies during
the Pre- and Post-reform Period
(Percentage)
Pre-reform Period
Year National New India Oriental United Mean Median S.D.
1993-94 12.67 16.15 13.16 13.62 13.90 13.39 1.55
1994-95 1.80 8.87 3.74 8.06 5.62 5.90 3.40
1995-96 12.62 14.93 -4.56 4.14 6.78 8.38 8.87
1996-97 7.06 10.89 8.18 9.35 8.87 8.77 1.64
1997-98 11.68 24.21 12.45 10.59 14.73 12.07 6.36
1998-99 5.45 17.15 4.06 11.89 9.64 8.67 6.06
1999-00 5.98 11.60 3.38 6.94 6.97 6.46 3.43
Mean 8.18 14.83 5.78 9.23 9.50 9.97 5.63
Median 7.06 14.93 4.06 9.35 9.97
S.D. 4.21 5.11 6.12 3.18 5.63
Post-reform Period
Year National New India Oriental United Mean Median S.D.
2000-01 5.69 8.37 4.30 -0.12 4.56 4.26 5.20
2001-02 -4.99 4.59 -12.96 7.50 -1.46 4.88 7.65
2002-03 6.33 7.28 3.34 8.17 6.28 7.82 5.00
2003-04 2.84 16.24 15.56 17.68 13.08 22.50 9.73
2004-05 4.63 10.33 14.90 14.16 11.01 3.82 11.74
2005-06 -3.96 16.50 11.35 19.10 10.75 13.13 7.50
2006-07 14.75 30.72 17.27 20.91 20.91 7.84 7.29
2007-08 5.13 28.51 0.32 21.93 13.97 20.01 3.45
Mean 3.80 15.32 6.76 13.67 9.89 8.27 9.52
Median 4.88 13.28 7.83 15.92 8.27
S.D. 6.22 9.76 10.17 7.79 9.52
Source: IRDA Annual Reports from 2000-01 to 2007-08.
Annual Reports of National, New India, Oriental & United India from 1993-94 to 1999-00.
Test of Significance
Test Ratio Z-value Asymp. Sig.
(2-tailed)
Mann- Whitney Test Net Earning Ratio -0.163 0.87
Table 6.21 highlights the net earning ratio (profit after tax to NWP) of
all the four public sector insurers under study during the pre- and post-reform
period. During the pre-reform period, New India recorded the highest average
net earning ratio of 14.83 per cent followed by United India, National, and
Oriental companies with the respective ratios of 9.23 per cent, 8.18 per cent
195
and 5.78 per cent. Similarly, during the post-reform period, New India again
registered the highest average net earning ratio of 15.32 per cent followed by
United India, Oriental, and National companies with the ratios of 13.67 per
cent, 6.76 per cent and 3.80 per cent respectively. So, during the pre-reform
period, Oriental Insurance Co. exhibited the lowest average net earning ratio,
whereas during the post-reform period, National Insurance Co. exhibited the
lowest average net earning ratio. The results also revealed that average net
earning ratio of all the public sector insurers is higher during the post-reform
period than the pre-reform period except in the case of National company
where it is lower during the post-reform period than the pre-reform period. The
average net earning ratio of all these four insurers during the pre-reform period
was 9.50, whereas it was 9.89 during the post-reform period. Hence, the
increase was quite marginal during the post-reform period. A year-wise
analysis of average net earning ratio provides that there has been an upward
trend (from 5.62 per cent to 14.73 per cent) during the years 1994-95 to 1997-
98, but during the year 1999-00 the ratio reached at the level of 6.97 per cent.
During the post-reform period, the average net earning ratio of the four public
insurers was the highest in the year 2006-07 followed by the year 2007-08. The
standard deviation indicates that consistency in net earning was higher during
the post-reform period than the pre-reform period. The Mann-Whitney test also
indicates that there is insignificant gap between the net earning ratio of the
public sector insurers during the pre- and post-reform period.
Return on Equity Ratio
Return on Equity ratio indicates how well the resources of the owners
have been used (Anthony and Reece, 1995). It measures the return accruing to
owners' capital. It is computed by dividing profit after tax to Net Worth. Table
6.22 shows the return accruing to owners' capital in the general insurance
companies under study.
196
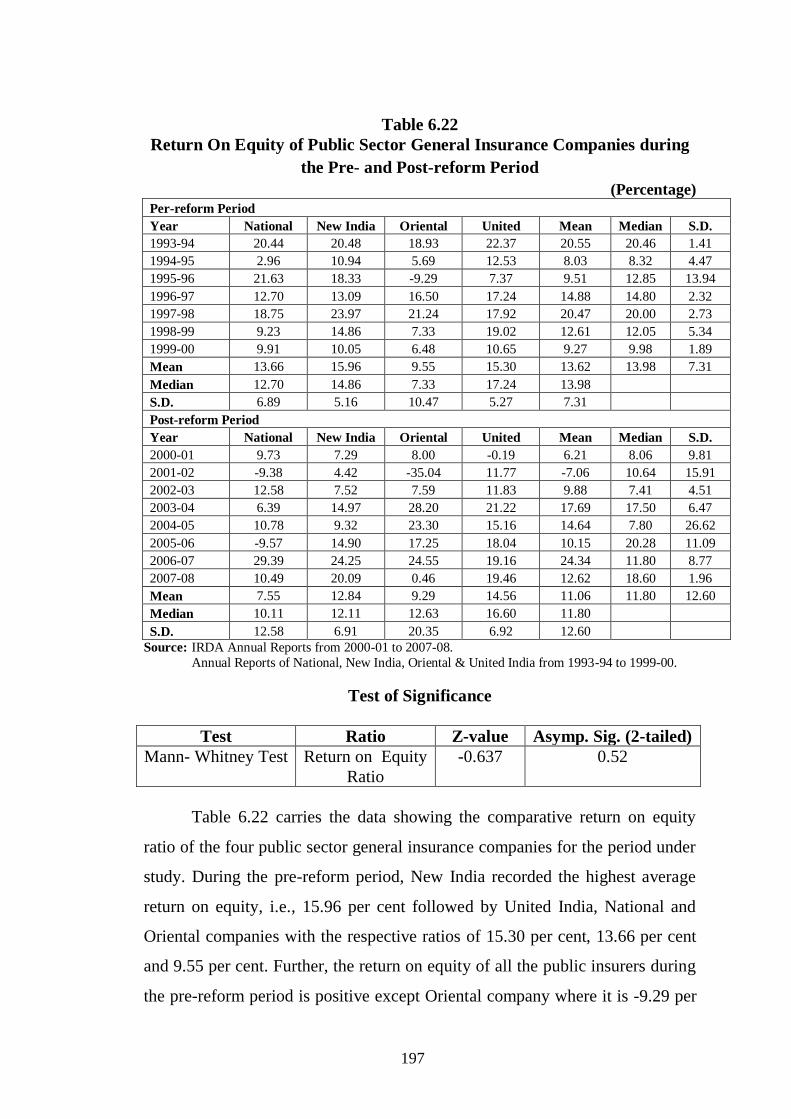
Table 6.22
Return On Equity of Public Sector General Insurance Companies during
the Pre- and Post-reform Period
(Percentage)
Per-reform Period
Year National New India Oriental United Mean Median S.D.
1993-94 20.44 20.48 18.93 22.37 20.55 20.46 1.41
1994-95 2.96 10.94 5.69 12.53 8.03 8.32 4.47
1995-96 21.63 18.33 -9.29 7.37 9.51 12.85 13.94
1996-97 12.70 13.09 16.50 17.24 14.88 14.80 2.32
1997-98 18.75 23.97 21.24 17.92 20.47 20.00 2.73
1998-99 9.23 14.86 7.33 19.02 12.61 12.05 5.34
1999-00 9.91 10.05 6.48 10.65 9.27 9.98 1.89
Mean 13.66 15.96 9.55 15.30 13.62 13.98 7.31
Median 12.70 14.86 7.33 17.24 13.98
S.D. 6.89 5.16 10.47 5.27 7.31
Post-reform Period
Year National New India Oriental United Mean Median S.D.
2000-01 9.73 7.29 8.00 -0.19 6.21 8.06 9.81
2001-02 -9.38 4.42 -35.04 11.77 -7.06 10.64 15.91
2002-03 12.58 7.52 7.59 11.83 9.88 7.41 4.51
2003-04 6.39 14.97 28.20 21.22 17.69 17.50 6.47
2004-05 10.78 9.32 23.30 15.16 14.64 7.80 26.62
2005-06 -9.57 14.90 17.25 18.04 10.15 20.28 11.09
2006-07 29.39 24.25 24.55 19.16 24.34 11.80 8.77
2007-08 10.49 20.09 0.46 19.46 12.62 18.60 1.96
Mean 7.55 12.84 9.29 14.56 11.06 11.80 12.60
Median 10.11 12.11 12.63 16.60 11.80
S.D. 12.58 6.91 20.35 6.92 12.60
Source: IRDA Annual Reports from 2000-01 to 2007-08.
Annual Reports of National, New India, Oriental & United India from 1993-94 to 1999-00.
Test of Significance
Test Ratio Z-value Asymp. Sig. (2-tailed)
Mann- Whitney Test Return on Equity
Ratio
-0.637 0.52
Table 6.22 carries the data showing the comparative return on equity
ratio of the four public sector general insurance companies for the period under
study. During the pre-reform period, New India recorded the highest average
return on equity, i.e., 15.96 per cent followed by United India, National and
Oriental companies with the respective ratios of 15.30 per cent, 13.66 per cent
and 9.55 per cent. Further, the return on equity of all the public insurers during
the pre-reform period is positive except Oriental company where it is -9.29 per
197

cent during the year 1995-96. During the post-reform period, United India
exhibited the highest average return on equity of 14.56 per cent. It was
followed by New India, Oriental, and National with the respective returns of
12.84 per cent, 9.29 per cent and 7.55 per cent. The average return on equity of
all the four public insurers during the pre-reform period is 13.62 per cent,
whereas it is 11.06 per cent during the post-reform period showing a decline of
2.56 per cent in the average return on equity during the post-reform period. A
year-wise analysis of the pre-reform period brings out that the public insurers
showed the highest average return on equity of 20.55 per cent during the year
1993-94. From 1994-95 to 1997-98 there was an upward trend in the average
return on equity when it increased from 8.03 per cent to 20.14 per cent.
However, after this period it showed a downward trend and reached to 9.27 per
cent during the year 1999-00. During the post-reform period, the public
insurers showed the highest average return on equity of 24.34 per cent in the
year 2006-07 followed by 17.69 per cent in the year 2003-04. The public
insurers also showed a negative average return on equity of -7.06 per cent in
the year 2001-02. The standard deviation results reveal that there is more
variation in the return on equity of the public insurers during the post-reform
period than the pre-reform period. The Mann-Whitney test implies that there is
no significant gap between the return on equity of the public insurers during the
pre- and post-reform period. Therefore, the study rejected the hypothesis that
the profitability of the public sector insurers is significantly higher in the post-
reform period than the pre-reform period.
The preceding discussion brings out that the public sector general
insurance companies have witnessed a sharp contrast in the operational and
financial performance during the pre- and post-liberalization period.
Liberalization has adversely affected the underwriting results of all the public
sector general insurance companies, which is mainly ascribed to their increase
in expense ratio and claim ratio as these companies have been compelled to
increase spending on advertisements and information technology in the
changed competitive environment. However, the higher investment return of
198
the public sector general insurance companies has compensated their
underwriting losses. The higher investment income of the public sector general
insurance companies is due to their aggressive investment portfolio policy and
better performance of share market in the recent past. But the prospects for a
rapid improvement in investment return bleak and uncertain. Given these
uncertain prospects of investment return, the public sector general insurance
companies must focus on sustainable profitability business model by
emphasizing on improvement in the underwriting results to achieve greater
profitability and to achieve better underwriting results. These companies must
reduce their expense of management by adopting new techniques of
information technology and ensure quality product at competitive price to
survive in the market. The study reveals that there has been no significant gap
between the operating ratio, net earning ratio and return on equity of the public
sector during the pre- and post-reform period.
6.6 Multivariate Profitability Analysis of the Public Sector General
Insurance Companies in the Pre- and Post-reform Period
Through multivariate profitability analysis an attempt has been made to
examine the impact of selected factors / variables on public sector general
insurers' profitability, and to empirically test which of the identified variables
have significantly contributed towards general insurers' profitability in either
direction. The correlation analysis and regression analysis have been used.
Correlation Analysis
Correlation analysis helps to measure the magnitude and direction of the
relationship between two or more variables. Interdependence among variables
is a common characteristic of most multivariate techniques and correlation
matrix is a table used to display correlation coefficients between these
variables. Matrices form the basis for computation and understanding of the
nature of relationships in multiple regressions, discriminant analysis, factor
analysis, and many other similar techniques. One sample t-test is used as a
parametric tool for testing the significance of correlation coefficient. The study
199

aimed at identifying the most important variable or variables which have higher
significant association with the dependent variable.
The degree of association, i.e., strength and direction of partial
correlation coefficients, between the selected variables and public general
insurers' profitability is studied for both the pre- and post-reform periods, and
the correlation matrices are given in Tables 6.23 and 6.24 respectively.
Table 6.23
Spearman's Correlation Matrix of Public Sector General Insurance
Companies during the Pre-reform Period (1993-94 to 1999-00)
Return
on
Equity
Expense Claim
Under-
writing
Results
Investment
Income
Net
Retention
Growth
Rate
Return on
Equity 1
Expense -0.435(*) 1
Claim
-
0.683(**) 0.087 1
Underwriting
Results 0.761(**)
-
0.455(*)
-
.820(**) 1
Investment
Income 0.078 -0.138 0.057 0.02 1
Net Retention -0.14 0.294 -0.277 0.028 -0.615(**) 1
Growth Rate 0.19 0.183 -0.339 0.073 -0.199 0.078 1
** The Correlation is significant at the 0.01 level (2-tailed).
* The Correlation is significant at the 0.05 level (2-tailed).
It can be seen from the table that during the pre-reform period two
variables, namely, expense of management ratio and claim ratio have
established a significant negative correlation with public sector general
insurers' return on equity and the coefficients are -0.435 and -0.683
respectively. Another variable, viz. underwriting results has a significant
positive correlation with return on equity and the coefficient is 0.761. Some of
the independent variables are also found to be significantly correlated with one
another during the pre-reform period. The variable called underwriting results
has a significant negative correlation with two other variables, namely, expense
of management ratio and claim ratio with their coefficients as -0.455 and -
0.820 respectively. Net retention has also a significant correlation with
investment income ratio. So, on the basis of correlation analysis, it can be said
that during the pre-reform period, expense of management, claim ratio and
underwriting results have affected the general insurers' profitability
200
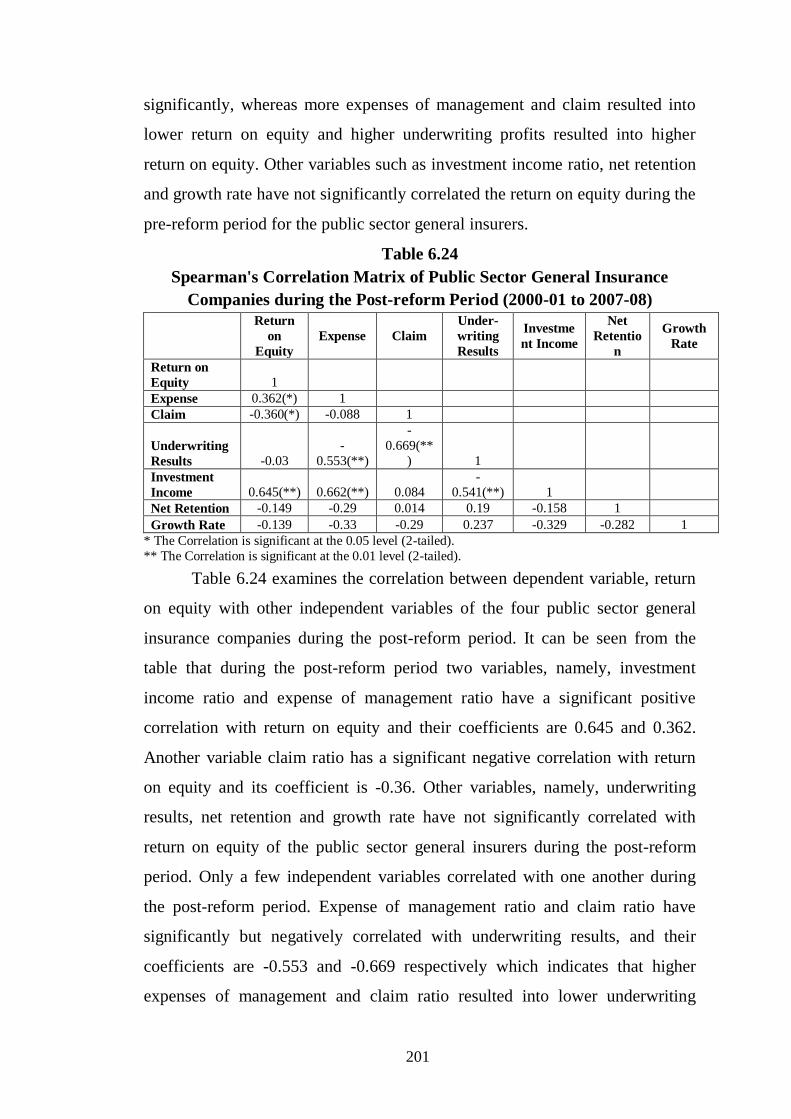
significantly, whereas more expenses of management and claim resulted into
lower return on equity and higher underwriting profits resulted into higher
return on equity. Other variables such as investment income ratio, net retention
and growth rate have not significantly correlated the return on equity during the
pre-reform period for the public sector general insurers.
Table 6.24
Spearman's Correlation Matrix of Public Sector General Insurance
Companies during the Post-reform Period (2000-01 to 2007-08)
Return
on
Equity
Expense Claim
Under-
writing
Results
Investme
nt Income
Net
Retentio
n
Growth
Rate
Return on
Equity 1
Expense 0.362(*) 1
Claim -0.360(*) -0.088 1
Underwriting
Results -0.03
-
0.553(**)
-
0.669(**
) 1
Investment
Income 0.645(**) 0.662(**) 0.084
-
0.541(**) 1
Net Retention -0.149 -0.29 0.014 0.19 -0.158 1
Growth Rate -0.139 -0.33 -0.29 0.237 -0.329 -0.282 1
* The Correlation is significant at the 0.05 level (2-tailed).
** The Correlation is significant at the 0.01 level (2-tailed).
Table 6.24 examines the correlation between dependent variable, return
on equity with other independent variables of the four public sector general
insurance companies during the post-reform period. It can be seen from the
table that during the post-reform period two variables, namely, investment
income ratio and expense of management ratio have a significant positive
correlation with return on equity and their coefficients are 0.645 and 0.362.
Another variable claim ratio has a significant negative correlation with return
on equity and its coefficient is -0.36. Other variables, namely, underwriting
results, net retention and growth rate have not significantly correlated with
return on equity of the public sector general insurers during the post-reform
period. Only a few independent variables correlated with one another during
the post-reform period. Expense of management ratio and claim ratio have
significantly but negatively correlated with underwriting results, and their
coefficients are -0.553 and -0.669 respectively which indicates that higher
expenses of management and claim ratio resulted into lower underwriting
201

profits. The results also indicated that investment income and underwriting
profits are found to be negatively but significantly correlated during the post-
reform period. Due to that reason the effect of higher underwriting losses are
offset by higher investment income during the post-reform period.
Table 6.25
Multiple Regression Analysis of Public Sector General Insurance
Companies during the Pre-reform Period (1993-94 to 1999-00)
Step Intercept
(Constant a)
Unstandardized
Co-efficients (b)
R2 Adjusted
R2
F-
Change
df1 df2 Sig. F
Change
Underwriting
Results Ratio (x1)
I 19.89
(14.227)*
0.691
(5.941)*
0.576 0.559 35.29 1 26 0.000
Note: The figures given in parentheses represent the t-values. * Refers to 5 per cent significance level.
Table 6.25 shows the multivariate regression analysis of the public
sector general insurance companies for the pre-reform period, i.e., from 1993-
94 to 1999-00. The table reveals that underwriting results to net written
premium entered the regression model singularly explaining 55.9 per cent
variation with significant unstandarized coefficient 0.691. The results explain
that no other variable has significantly affected the profitability of the public
sector general insurance companies during the pre-reform period. The results
provide the following regression equation:
Y = 19.89 + 0.691 (x1).
Table 6.26
Multiple Regression Analysis of Public Sector General Insurance
Companies during the Post-reform Period (2000-01 to 2007-08)
Step Intercept
(Constant a)
Unstandardized Co-efficients (b) R2 Adjusted
R2
F-
Change
Sig. F
Change
Claim
Ratio
(x1)
Investment
Income
Ratio (x2)
Expense
Ratio
(x3)
I 102.82 (4.67)*
-1.073 (-
4.18)*
- - 0.369 0.347 17.51 0.000
II 82.28
(5.01)*
-1.09
(-
5.86)*
0.606
(5.29)*
0.679 0.657 28.06 0.000
III 102.49
(5.74)*
-1.134
(-
6.46)*
0.855
(5.53)*
-.751
(-2.24)*
0.728 0.699 5.00 0.000
Note: The figures given in parentheses represent the t-values.
* Refers to 5 per cent significance level.
202

Table 6.26 presents the results of step-wise multivariate regression
analysis of the public sector general insurance companies for the post-reform
period from 2000-01 to 2007-08. The results reveal that in the first step claim
to net written premium entered the regression model, singularly explaining 34.7
per cent variation in the profitability of public insurers with significant
unstandarized coefficient -1.073. In the second step, investment income to net
written premium entered the regression model and together with claim ratio
explaining 65.7 per cent variation in the profitability of the public insurers.
After that in the third step, expense to net written premium entered the
regression model and together with first two variables, explained 69.9 per cent
variation in the profitability of public insurers with significant unstandarized
coefficient (b) -0.751. No other variable has significantly affected the
profitability of the public insurers during the post- reform period. The results
provide the following regression equation:
Y = 102.49 +1.134 (x1) + 0.855(x2) -0.751 (x3)
The multivariate analysis depicts that during the pre-reform period, the
claim ratio and expense of management ratio significantly but negatively
correlated with return on equity, and underwriting results has significantly and
positively correlated with return on equity. During the post-reform period,
claim ratio has significantly but negatively correlated with return on equity,
whereas expense of management and investment income ratio have shown a
significant positive correlation with return on equity. During the pre-reform
period, the underwriting results variable has shown a significant impact on
return on equity, whereas during the post-reform period, claim ratio and
expense ratio have significantly but negatively correlated with return on equity,
and investment income ratio has significantly and positively correlated with
return on equity.
203
References
Annual Reports of IRDA from 2000-01, 2001-02, 2002-03, 2003-04,2004-05,
2005-06, 2006-07, 2007-08, 2008-09.
Annual Reports of National Insurance Company Limited from 1993-94, 1994-
95, 1995-96, 1996-97, 1997-98, 1998-99, 1999-2000.
Annual Reports of New India Assurance Company Limited 1993-94, 1994-95,
1995-96, 1996-97, 1997-98, 1998-99, 1999-2000.
Annual Reports of Oriental Insurance Company Limited from 1993-94, 1994-
95, 1995-96, 1996-97, 1997-98, 1998-99, 1999-2000.
Annual Reports of United India Insurance Company Limited from 1993-94,
1994-95, 1995-96, 1996-97, 1997-98, 1998-99, and 1999-2000.
Anthony, R.N.; and Reece, J.S. (1995), "Accounting Principles" Irwin, USA,
p.300.
Capgemine and EFMA (2007), "Market Mechanics", Asia Insurance Post,
Vol.VII, Issue7, pp.25-26.
Chen, R.; and Wong, K.A. (2004), "The Determinants of Financial Health of
Asian Insurance Companies" The Journal of Risk and Insurance,
Vol.71, No.3, Sept., pp. 469-499.
Dollar, D. (1992), "Outward-oriented Developing Economies Really Grow
More Rapidly: Evidence from 95 LDCS, 1976-85", Economic
Development & Cultural Exchange, Vol.40, No.3, pp. 523-544.
Holzheu, T. (2006), "Measuring Underwriting Profitability of the Non-Life
Insurance Industry", Swiss RE Sigma, No.3, pp. 1-31.
Kaur, N.; and Kapoor, R. (2007), "Profitability Analysis of Public Sector
Banks in India", Indian Management Studies Journal, Vol. 11, pp. 167-
181.
Moody's ICRA Global (2008), "Indian General Insurance Industry Outlook:
Major Changes Expected as Deregulation Continues" April.
http://www.icra.in/Files/Articles/Insurance-ICRA Moody's -200704.pdf
Accessed on Aug.10, 2009.
204
Rudolf, E. (2001), "Profitability of the Non-Life Insurance Industry: It's Back-
to-Basics Time", Swiss RE, Sigma, No.5, pp. 1-38.
Sachs, J.; and Warner, A. (1997), "Fundamental Sources of Long Run Growth"
American Economic Review, Papers and Proceedings, Vol. 87, No.2, pp.
184-188.
WTO (2004), "Understanding the WTO: The Agreements, Services: The Rules
for Growth and Investment", Available at:
http://www.wto.org.english/thewto_e/whatis_e/tif_e/agrm6_e.htm#anne
xes Accessed on Sep.10, 2009.
205
Top Related