


Languages
Pages
Legal


Chapter Thirteen:
The Economics of the Environment

The Theory of Externalities
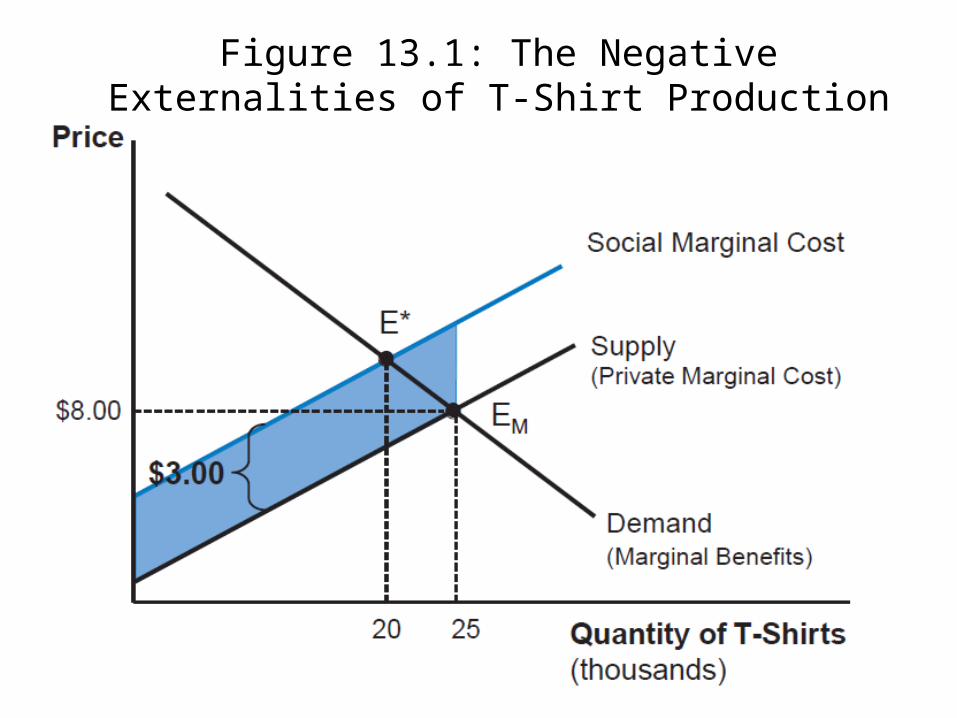
Figure 13.1: The Negative Externalities of T-Shirt Production
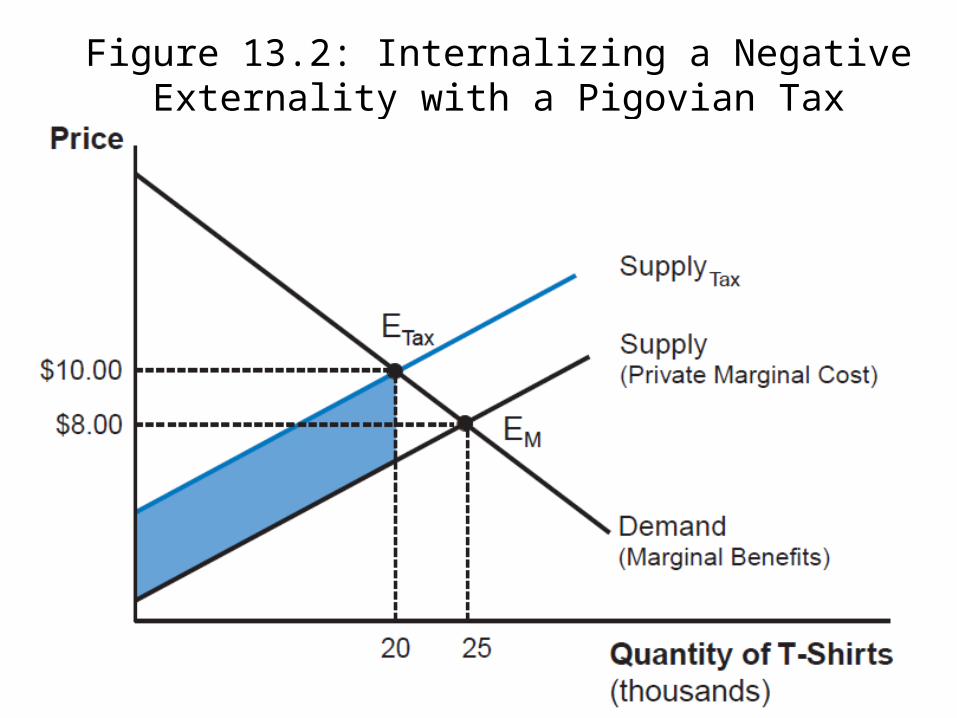
Figure 13.2: Internalizing a Negative Externality with a Pigovian Tax
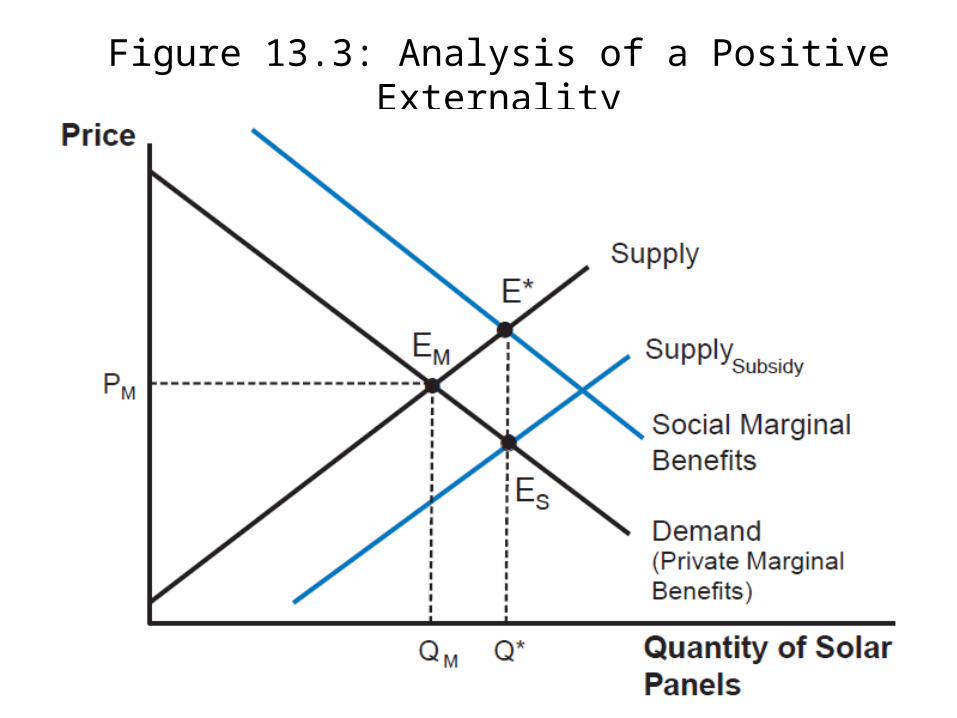
Figure 13.3: Analysis of a Positive Externality
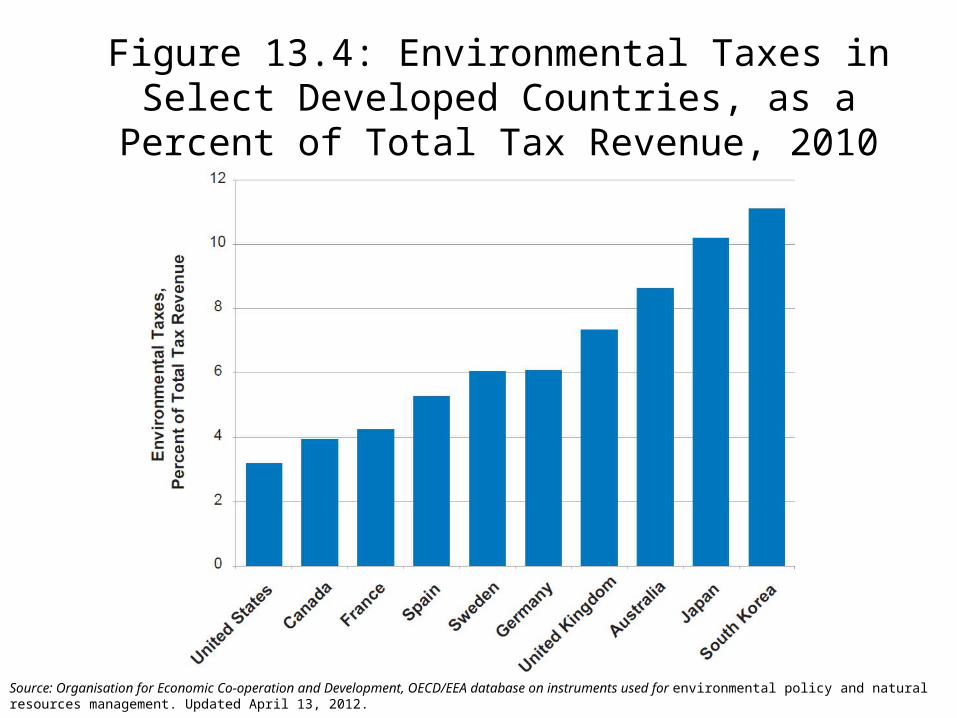
Figure 13.4: Environmental Taxes in Select Developed Countries, as a Percent of Total Tax
Revenue, 2010
Source: Organisation for Economic Co-operation and Development, OECD/EEA database on instruments used for environmental policy and natural resources management. Updated April 13, 2012.

Environmental Policies in Practice
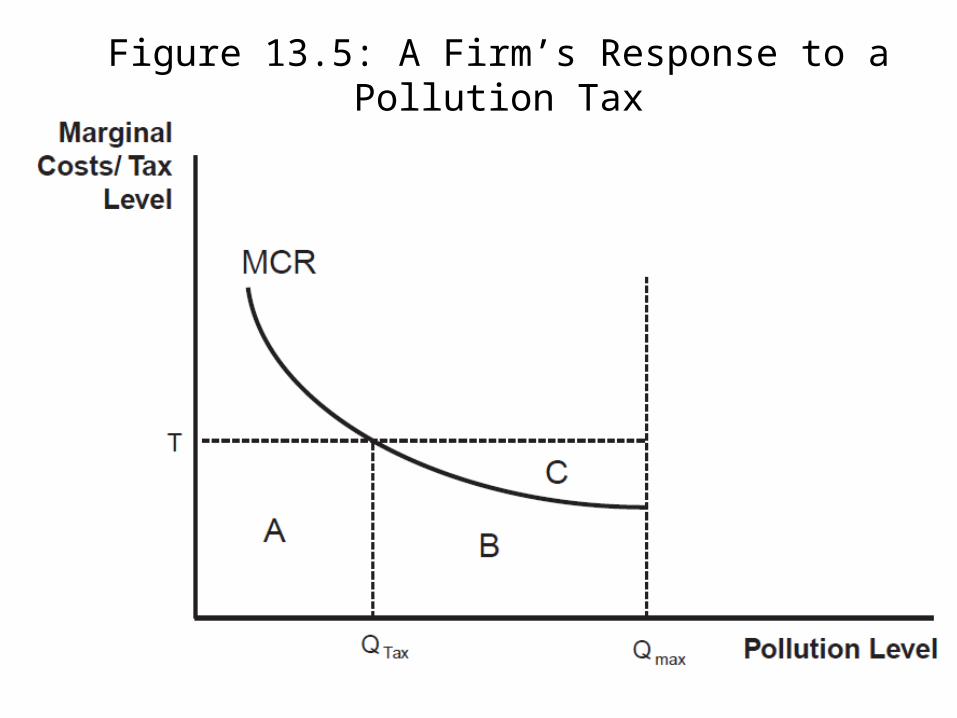
Figure 13.5: A Firm’s Response to a Pollution Tax
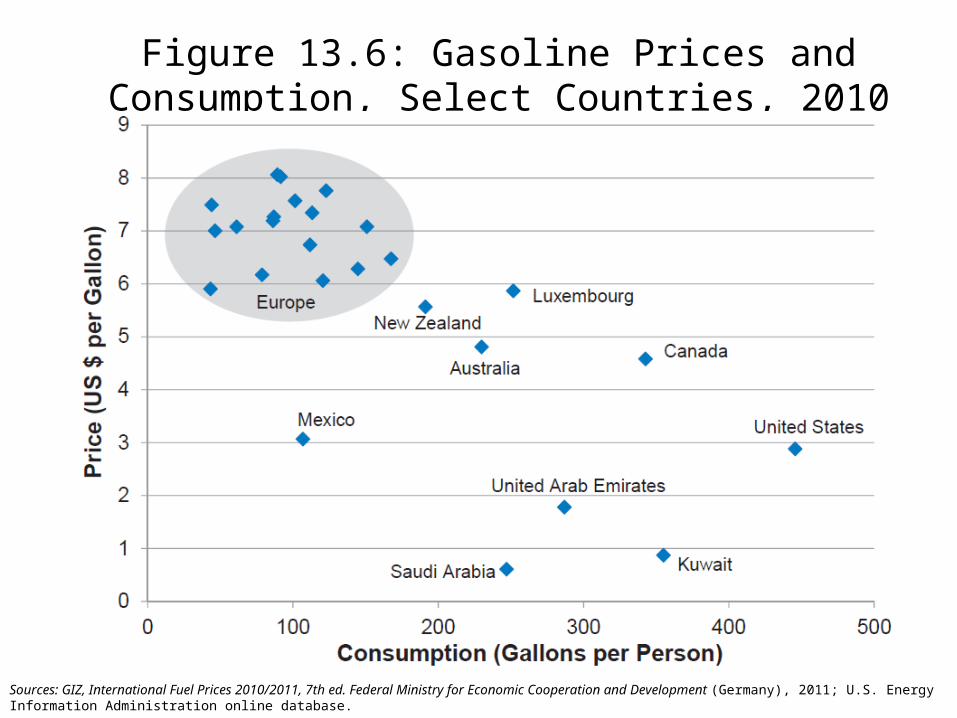
Figure 13.6: Gasoline Prices and Consumption, Select Countries, 2010
Sources: GIZ, International Fuel Prices 2010/2011, 7th ed. Federal Ministry for Economic Cooperation and Development (Germany), 2011; U.S. Energy Information Administration online database.

Appendix: Formal Analysis of Negative Externalities
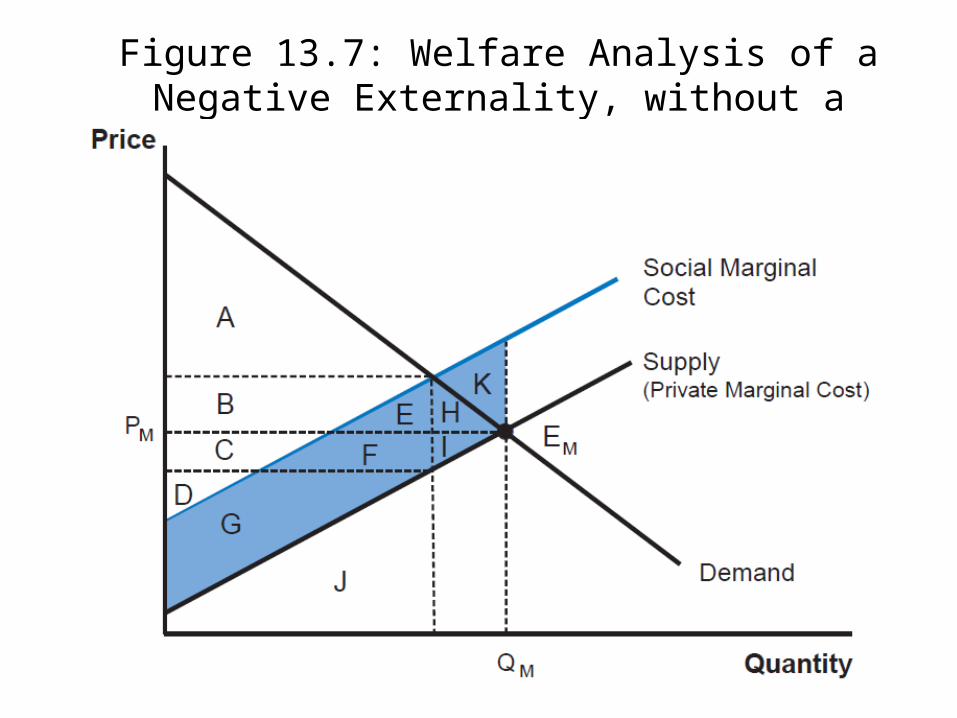
Figure 13.7: Welfare Analysis of a Negative Externality, without a Pigovian Tax
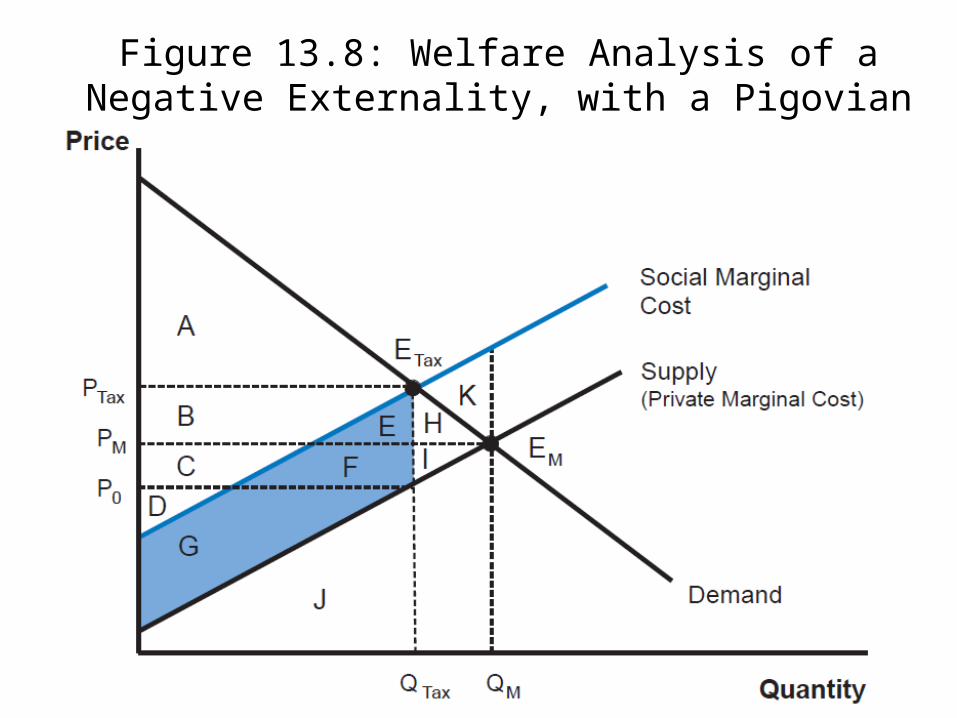
Figure 13.8: Welfare Analysis of a Negative Externality, with a Pigovian Tax
Top Related