


Languages
Pages
Legal

macroeconomics fifth edition
N. Gregory Mankiw
PowerPoint® Slides by Ron Cronovichm
acro
© 2002 Worth Publishers, all rights reserved
CHAPTER SIX
Unemployment
CHAPTER 6CHAPTER 6 Unemployment Unemployment slide 2
Chapter objectivesChapter objectives
The natural rate of unemployment:
what it means
what causes it
understanding its behavior in the real world
CHAPTER 6CHAPTER 6 Unemployment Unemployment
Natural Rate of UnemploymentNatural Rate of Unemployment
Natural rate of unemployment: the average rate of unemployment around which the economy fluctuates.
In a recession, the actual unemployment rate rises above the natural rate.
In a boom, the actual unemployment rate falls below the natural rate.
CHAPTER 6CHAPTER 6 Unemployment Unemployment slide 4
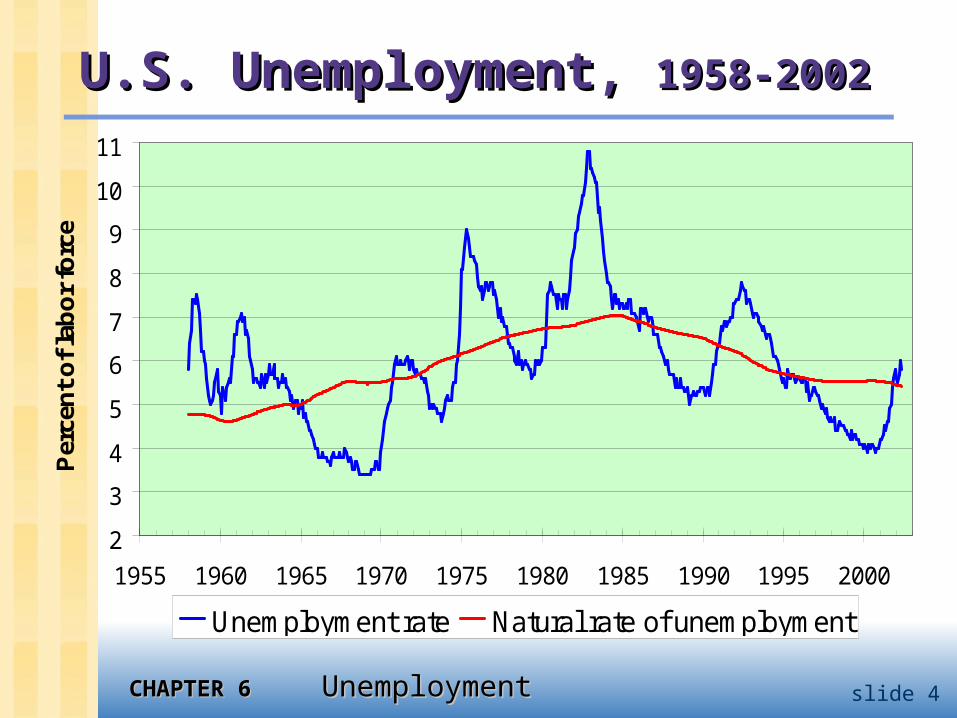
U.S. Unemployment, U.S. Unemployment, 1958-20021958-2002
2
3
4
5
6
7
8
9
10
11
1955 1960 1965 1970 1975 1980 1985 1990 1995 2000
Per
cen
t o
f la
bo
r fo
rce
Unemployment rate Natural rate of unemployment
CHAPTER 6CHAPTER 6 Unemployment Unemployment slide 5
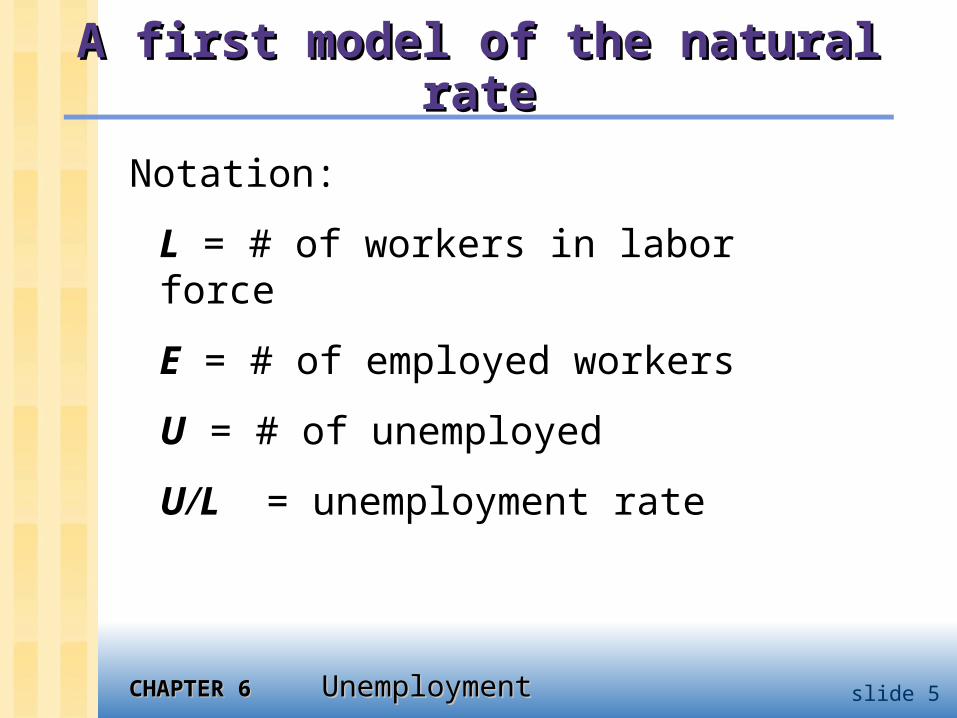
A first model of the natural rateA first model of the natural rate
Notation:
L = # of workers in labor force
E = # of employed workers
U = # of unemployed
U/L = unemployment rate
CHAPTER 6CHAPTER 6 Unemployment Unemployment slide 6
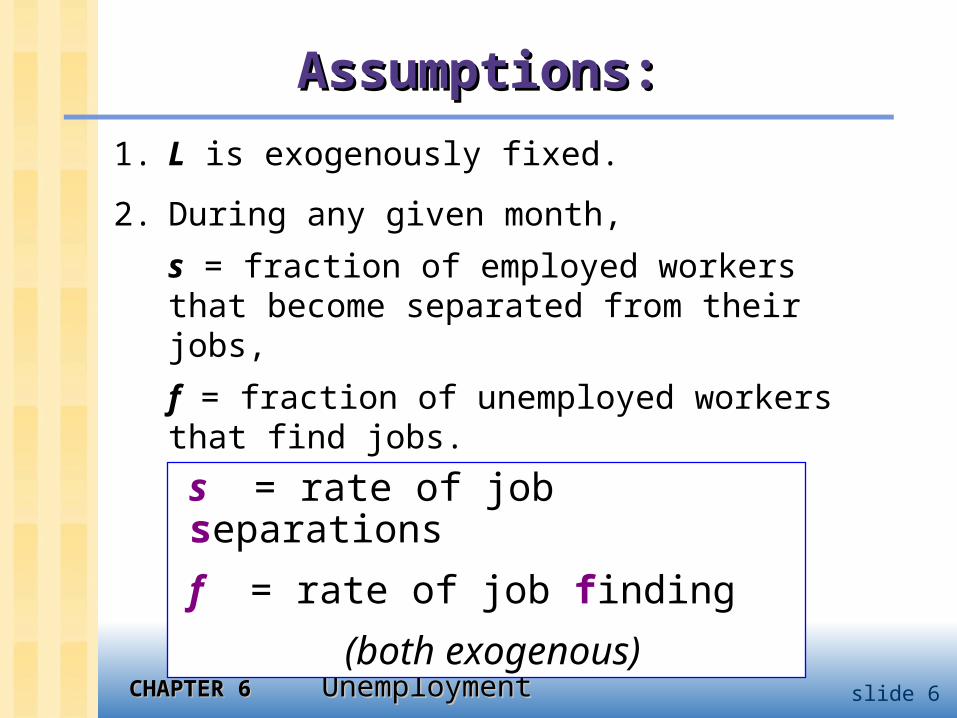
Assumptions:Assumptions:
1. L is exogenously fixed.
2. During any given month,
s = fraction of employed workers that become separated from their jobs,
f = fraction of unemployed workers that find jobs.
s = rate of job separations
f = rate of job finding
(both exogenous)
CHAPTER 6CHAPTER 6 Unemployment Unemployment slide 7
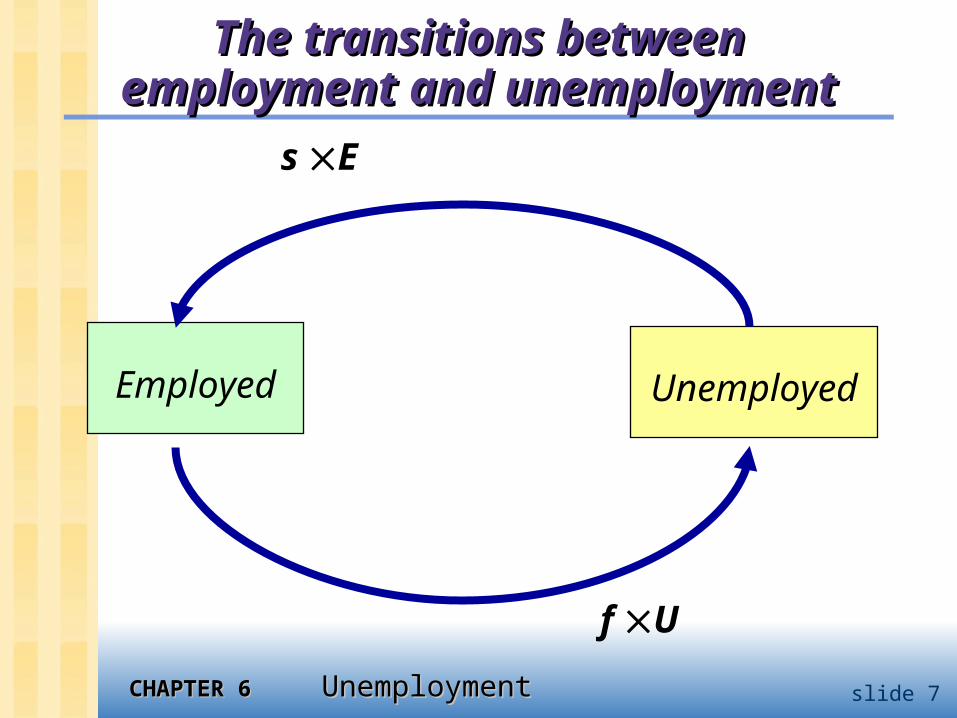
The transitions between The transitions between employment and unemploymentemployment and unemployment
Employed Unemployed
s E
f U
CHAPTER 6CHAPTER 6 Unemployment Unemployment slide 8
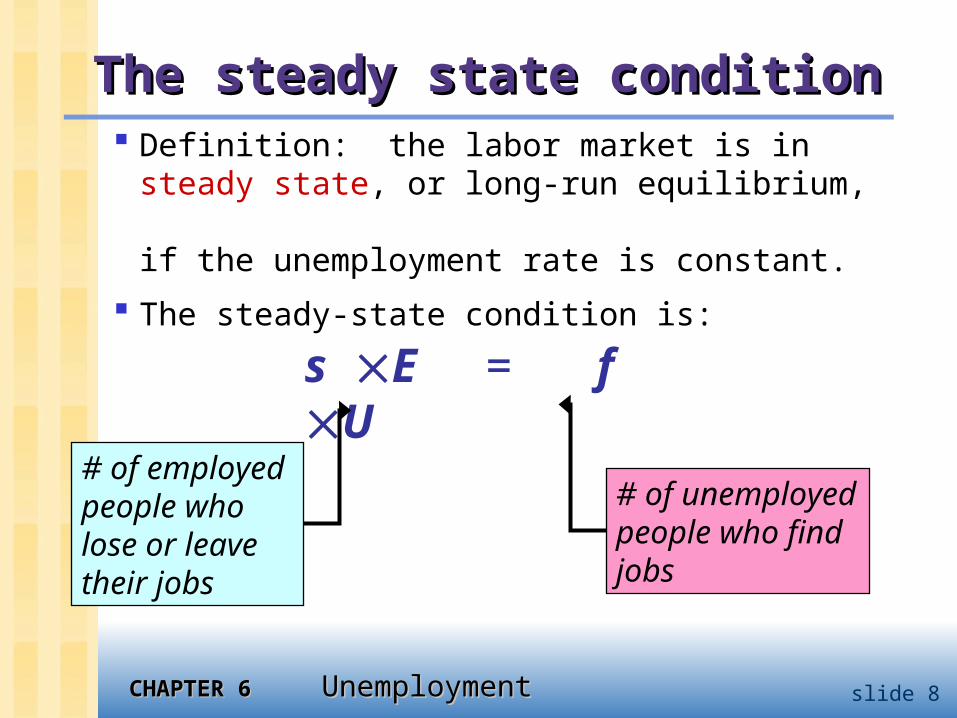
The steady state conditionThe steady state condition Definition: the labor market is in
steady state, or long-run equilibrium, if the unemployment rate is constant.
The steady-state condition is:
s E = f U
# of employed people who lose or leave their jobs
# of unemployed people who find jobs
CHAPTER 6CHAPTER 6 Unemployment Unemployment slide 9
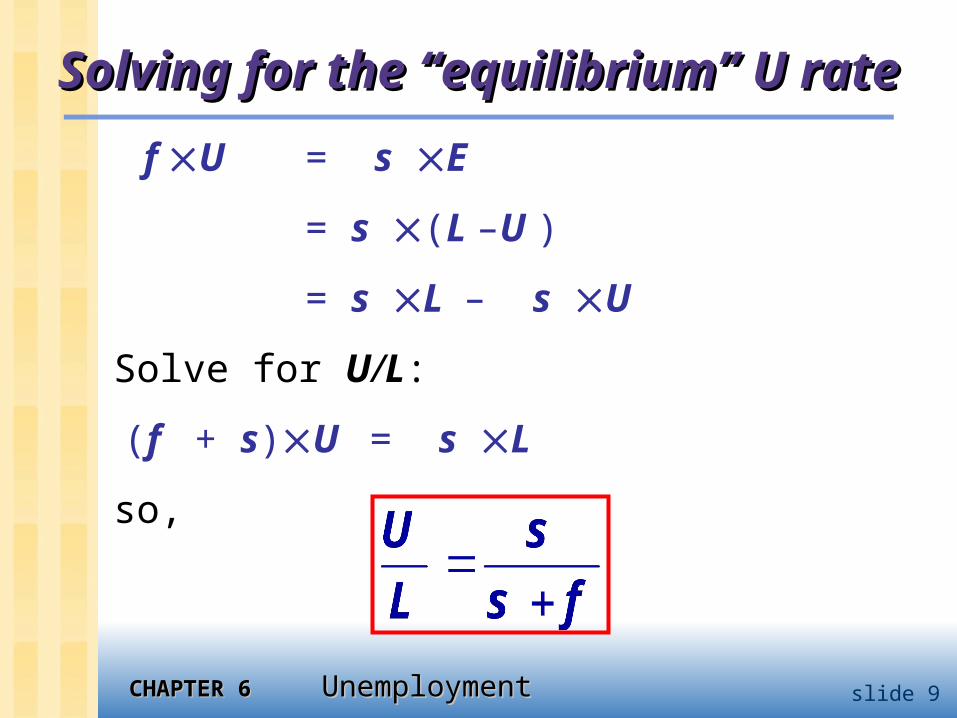
Solving for the “equilibrium” U rateSolving for the “equilibrium” U rate
f U = s E
= s (L –U )
= s L – s U
Solve for U/L:
(f + s)U = s L
so,
CHAPTER 6CHAPTER 6 Unemployment Unemployment slide 10
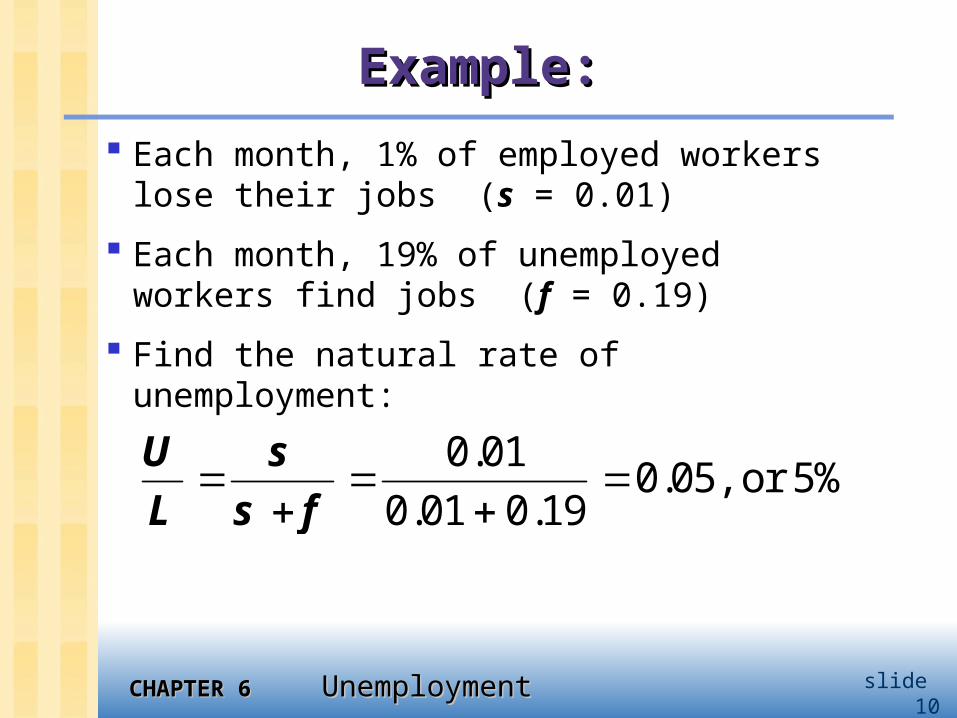
Example:Example:
Each month, 1% of employed workers lose their jobs (s = 0.01)
Each month, 19% of unemployed workers find jobs (f = 0.19)
Find the natural rate of unemployment:
0.010.05, or 5%
0.01 0.19U sL s f
CHAPTER 6CHAPTER 6 Unemployment Unemployment slide 11
policy implicationpolicy implication
A policy that aims to reduce the natural rate of unemployment will succeed only if it lowers s or increases f.
CHAPTER 6CHAPTER 6 Unemployment Unemployment slide 12
Why is there unemployment?Why is there unemployment?
If job finding were instantaneous (f = 1), then all spells of unemployment would be brief, and the natural rate would be near zero.
There are two reasons why f < 1:
1. job search
2. wage rigidity
CHAPTER 6CHAPTER 6 Unemployment Unemployment slide 13
Job Search & Frictional UnemploymentJob Search & Frictional Unemployment
frictional unemployment: caused by the time it takes workers to search for a job
occurs even when wages are flexible and there are enough jobs to go around
occurs because workers have different abilities,
preferences jobs have different skill requirements geographic mobility of workers not
instantaneous flow of information about vacancies and
job candidates is imperfect
CHAPTER 6CHAPTER 6 Unemployment Unemployment slide 14
Sectoral shiftsSectoral shifts def: changes in the composition of demand
among industries or regions
example: Technological change increases demand for computer repair persons, decreases demand for typewriter repair persons
example: A new international trade agreement causes greater demand for workers in the export sectors and less demand for workers in import-competing sectors.
It takes time for workers to change sectors, so sectoral shifts cause frictional unemployment.
CHAPTER 6CHAPTER 6 Unemployment Unemployment slide 15
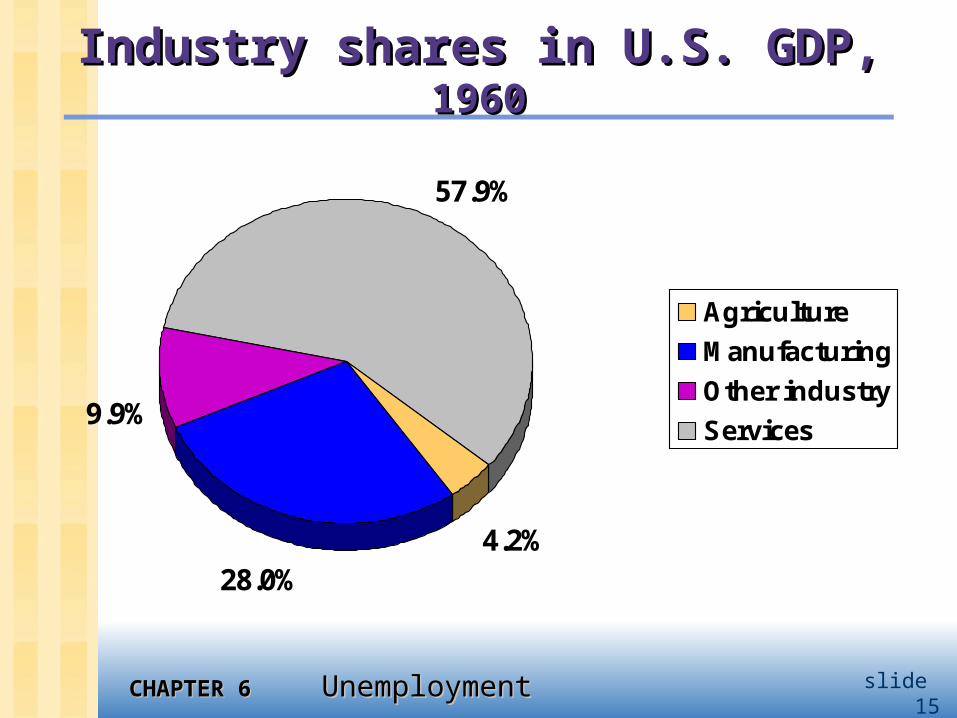
Industry shares in U.S. GDP, Industry shares in U.S. GDP, 19601960
4.2%28.0%
9.9%
57.9%
Agriculture
Manufacturing
Other industry
Services
CHAPTER 6CHAPTER 6 Unemployment Unemployment slide 16
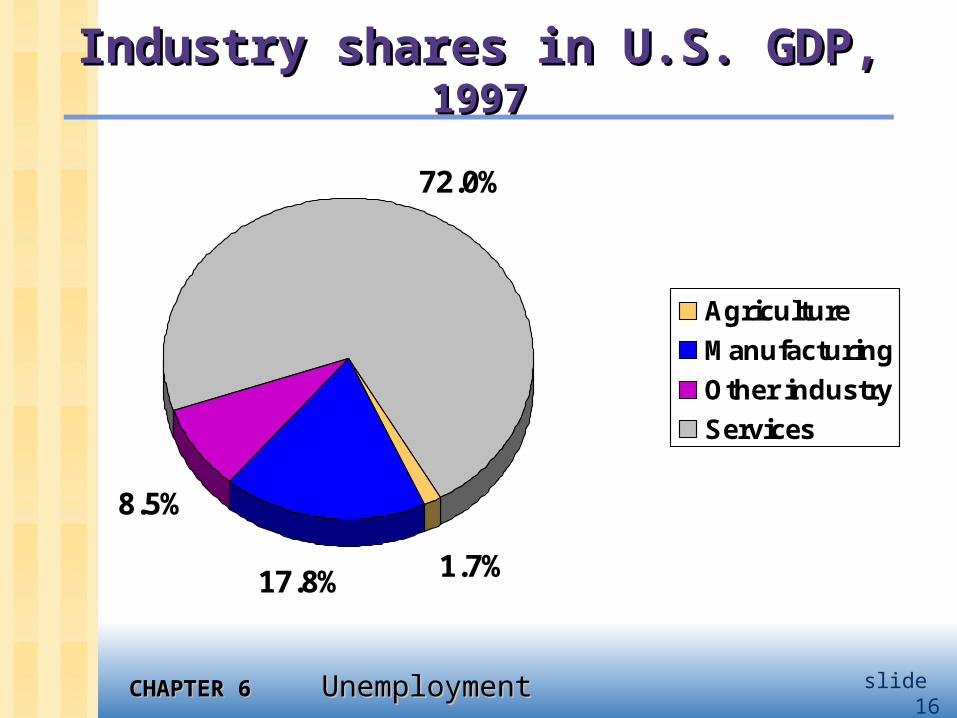
Industry shares in U.S. GDP, Industry shares in U.S. GDP, 19971997
1.7%17.8%
8.5%
72.0%
Agriculture
Manufacturing
Other industry
Services
CHAPTER 6CHAPTER 6 Unemployment Unemployment slide 17
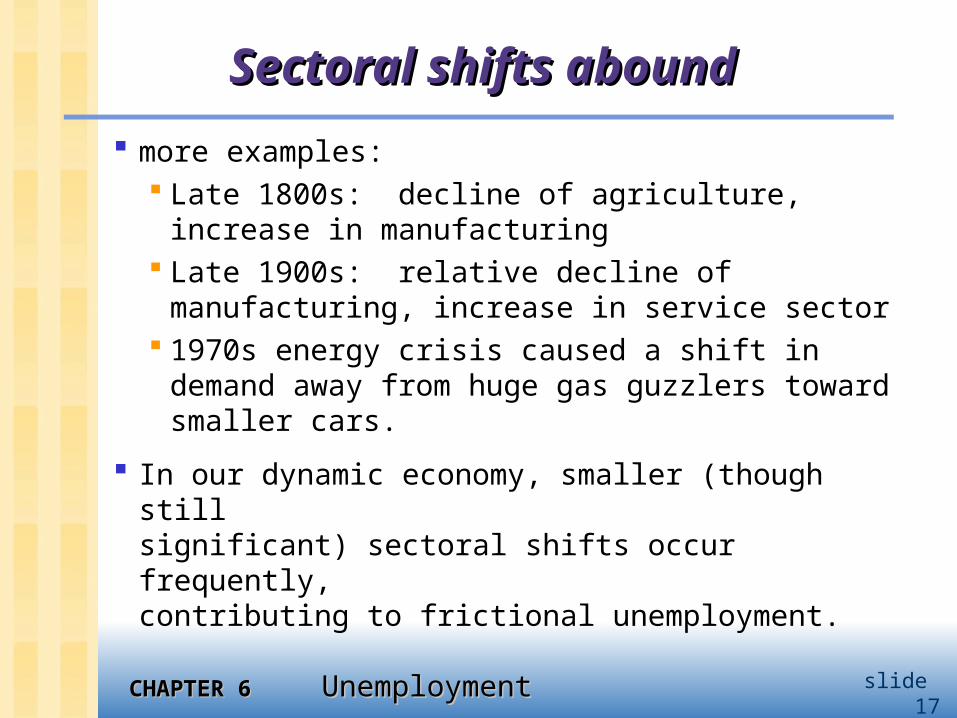
Sectoral shifts aboundSectoral shifts abound
more examples: Late 1800s: decline of agriculture,
increase in manufacturing Late 1900s: relative decline of
manufacturing, increase in service sector 1970s energy crisis caused a shift in
demand away from huge gas guzzlers toward smaller cars.
In our dynamic economy, smaller (though still significant) sectoral shifts occur frequently, contributing to frictional unemployment.
CHAPTER 6CHAPTER 6 Unemployment Unemployment
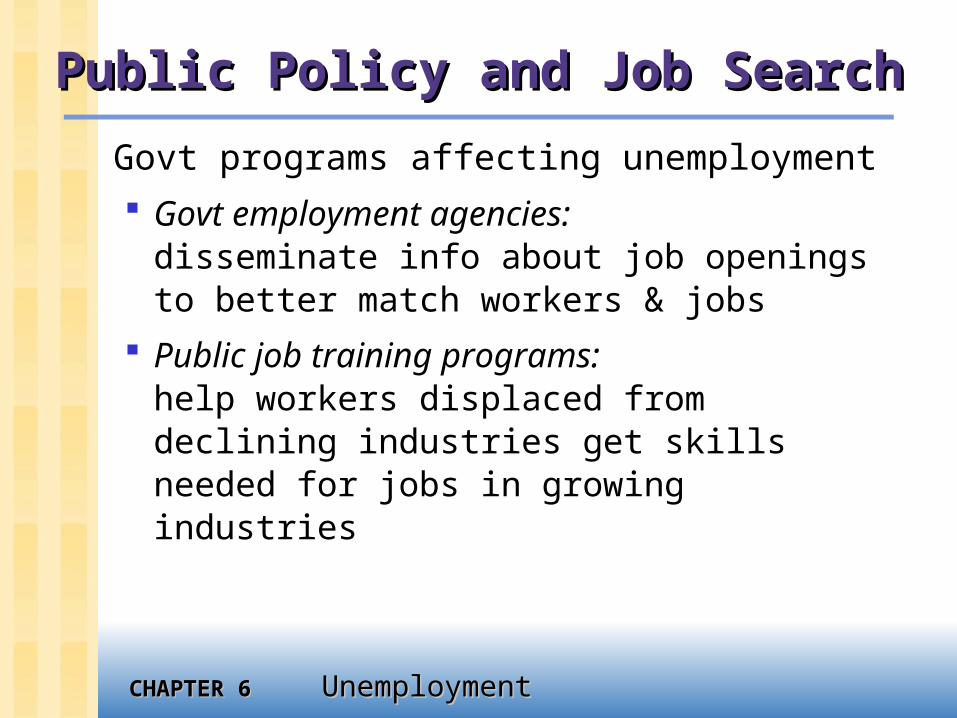
Public Policy and Job SearchPublic Policy and Job Search
Govt programs affecting unemployment Govt employment agencies:
disseminate info about job openings to better match workers & jobs
Public job training programs:help workers displaced from declining industries get skills needed for jobs in growing industries
CHAPTER 6CHAPTER 6 Unemployment Unemployment
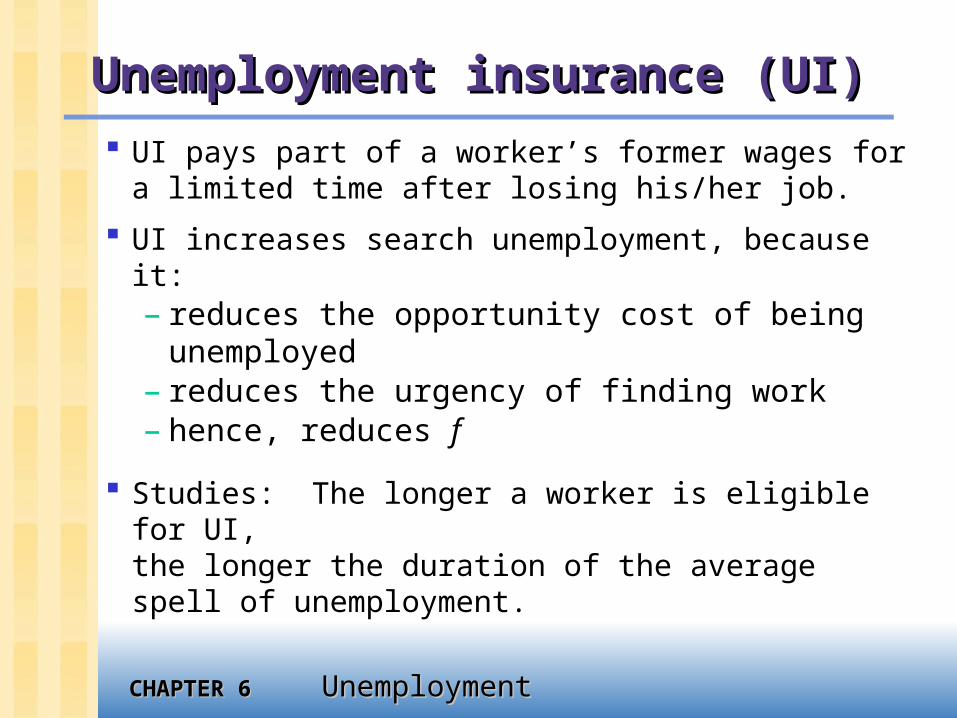
UI pays part of a worker’s former wages for a limited time after losing his/her job.
UI increases search unemployment, because it:– reduces the opportunity cost of being
unemployed– reduces the urgency of finding work– hence, reduces f
Studies: The longer a worker is eligible for UI, the longer the duration of the average spell of unemployment.
Unemployment insurance (UI)Unemployment insurance (UI)
CHAPTER 6CHAPTER 6 Unemployment Unemployment
By allowing workers more time to search,
UI may lead to better matches between jobs and workers,
which would lead to greater productivity and higher incomes.
Benefits of UIBenefits of UI
CHAPTER 6CHAPTER 6 Unemployment Unemployment slide 21
Why is there unemployment?Why is there unemployment?
There are two reasons why f < 1:
1. job search
2. wage rigidity
DONE Next
CHAPTER 6CHAPTER 6 Unemployment Unemployment slide 22
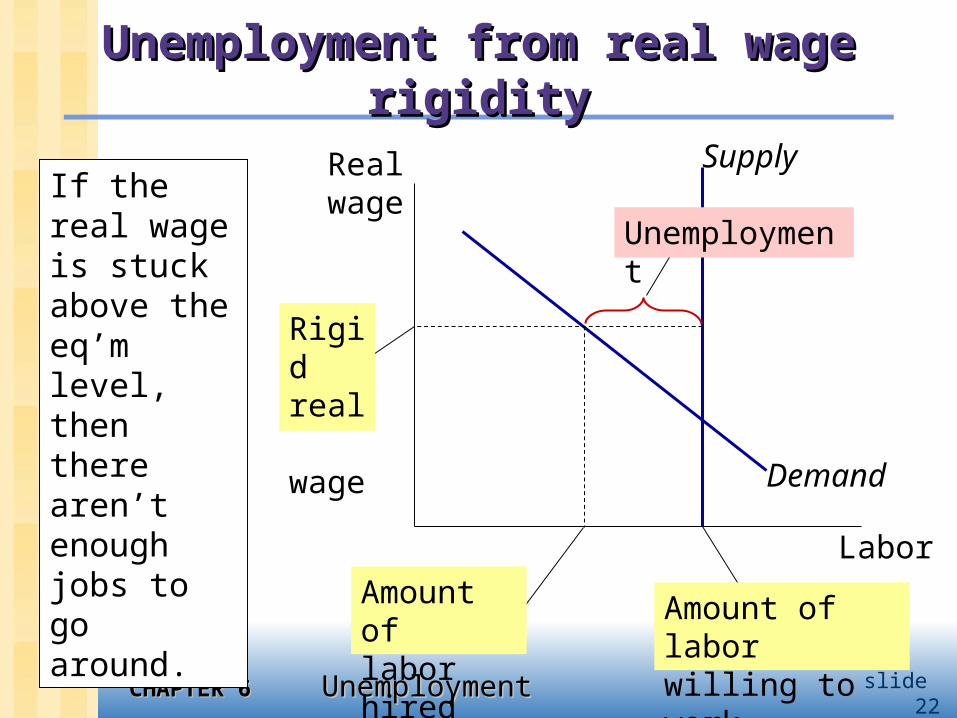
Unemployment from real wage rigidityUnemployment from real wage rigidity
Labor
Real wage
Supply
Demand
Unemployment
Rigid real wage
Amount of labor willing to work
Amount of labor hired
If the real wage is stuck above the eq’m level, then there aren’t enough jobs to go around.
CHAPTER 6CHAPTER 6 Unemployment Unemployment slide 23
Reasons for wage rigidityReasons for wage rigidity
1. Minimum wage laws
2. Labor unions
3. Efficiency wages
CHAPTER 6CHAPTER 6 Unemployment Unemployment slide 24
The minimum wageThe minimum wage
The minimum wage is well below the eq’m wage for most workers, so it cannot explain the majority of natural rate unemployment.
However, the minimum wage may exceed the eq’m wage of unskilled workers, especially teenagers.
If so, then we would expect that increases in the minimum wage would increase unemployment among these groups.
CHAPTER 6CHAPTER 6 Unemployment Unemployment slide 25
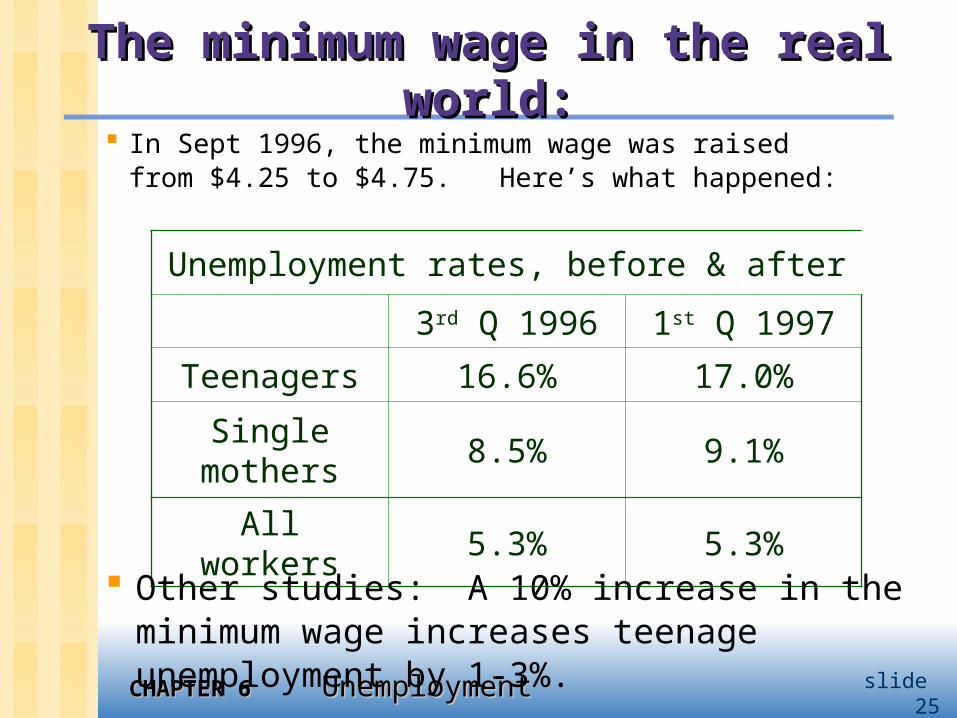
The minimum wage in the real world:The minimum wage in the real world: In Sept 1996, the minimum wage was raised
from $4.25 to $4.75. Here’s what happened:
Unemployment rates, before & after
3rd Q 1996 1st Q 1997
Teenagers 16.6% 17.0%
Single mothers
8.5% 9.1%
All workers 5.3% 5.3%
Other studies: A 10% increase in the minimum wage increases teenage unemployment by 1-3%.
CHAPTER 6CHAPTER 6 Unemployment Unemployment slide 26
Labor unionsLabor unions
Unions exercise monopoly power to secure higher wages for their members.
When the union wage exceeds the eq’m wage, unemployment results.
Employed union workers are insiders whose interest is to keep wages high.
Unemployed non-union workers are outsiders and would prefer wages to be lower (so that labor demand would be high enough for them to get jobs).
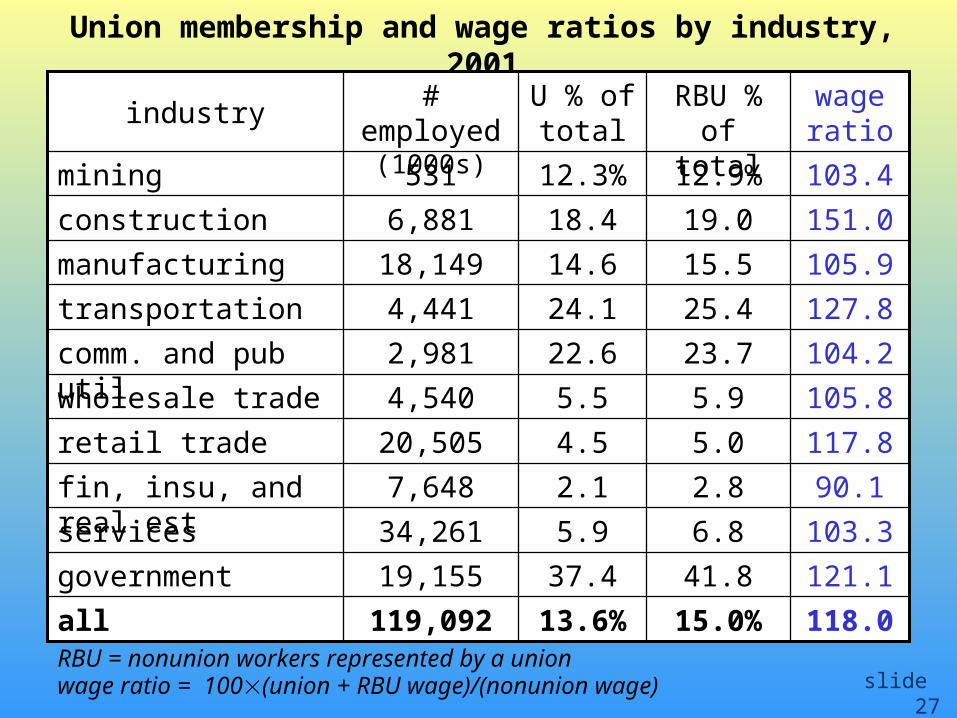
Union membership and wage ratios by industry, 2001
118.0
121.1
103.3
90.1
117.8
105.8
104.2
127.8
105.9
151.0
103.4
15.0%
41.8
6.8
2.8
5.0
5.9
23.7
25.4
15.5
19.0
12.9%
13.6%
37.4
5.9
2.1
4.5
5.5
22.6
24.1
14.6
18.4
12.3%
119,092
19,155
34,261
7,648
20,505
4,540
2,981
4,441
18,149
6,881
531
all
government
services
fin, insu, and real est
retail trade
wholesale trade
comm. and pub util
transportation
manufacturing
construction
mining
wage ratio
RBU % of total
U % of total
# employed (1000s)
industry
RBU = nonunion workers represented by a unionwage ratio = 100(union + RBU wage)/(nonunion wage) slide 27
CHAPTER 6CHAPTER 6 Unemployment Unemployment slide 28
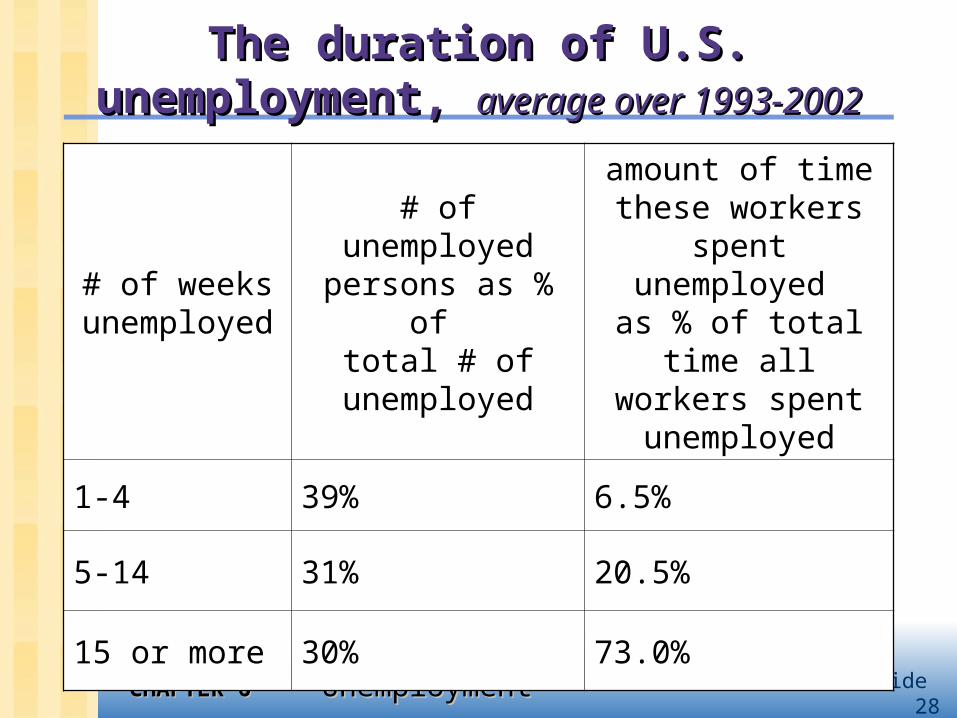
The duration of U.S. unemployment, The duration of U.S. unemployment, average over 1993-2002average over 1993-2002
# of weeks unemployed
# of unemployed
persons as % of total # of
unemployed
amount of time these workers
spent unemployed
as % of total time all workers spent
unemployed
1-4 39% 6.5%
5-14 31% 20.5%
15 or more 30% 73.0%
CHAPTER 6CHAPTER 6 Unemployment Unemployment slide 29
The duration of unemploymentThe duration of unemployment
The data: More spells of unemployment are short-
term than medium-term or long-term. Yet, most of the total time spent
unemployed is attributable to the long-term unemployed.
This long-term unemployment is probably structural and/or due to sectoral shifts among vastly different industries.
Knowing this is important because it can help us craft policies that are more likely to succeed.
CHAPTER 6CHAPTER 6 Unemployment Unemployment slide 30
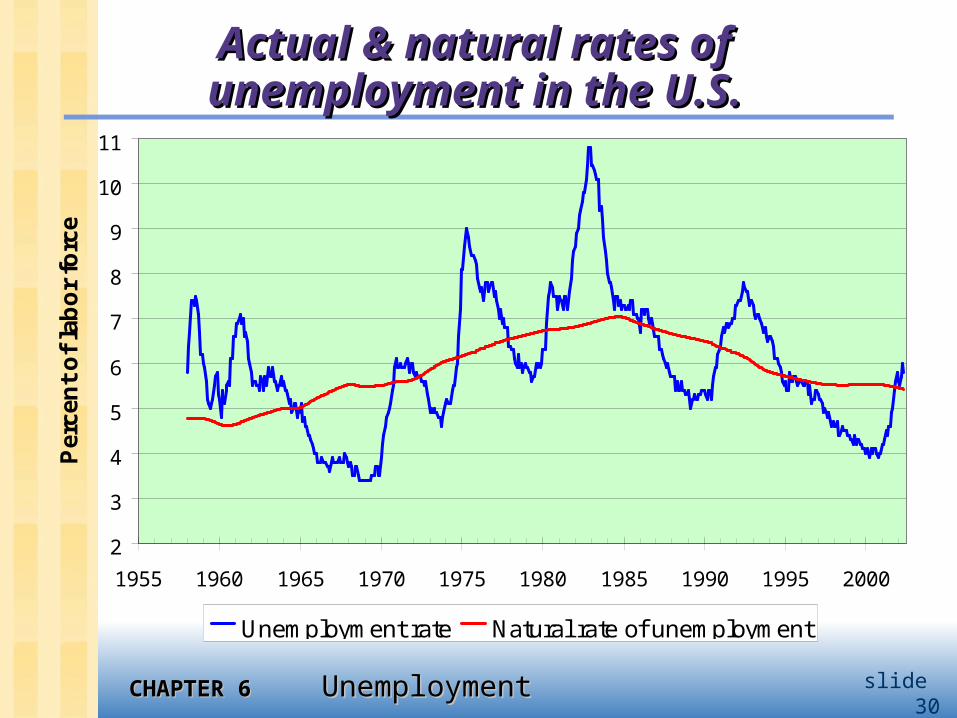
Actual & natural rates of Actual & natural rates of unemployment in the U.S.unemployment in the U.S.
2
3
4
5
6
7
8
9
10
11
1955 1960 1965 1970 1975 1980 1985 1990 1995 2000
Per
cen
t o
f la
bo
r fo
rce
Unemployment rate Natural rate of unemployment
CHAPTER 6CHAPTER 6 Unemployment Unemployment slide 31
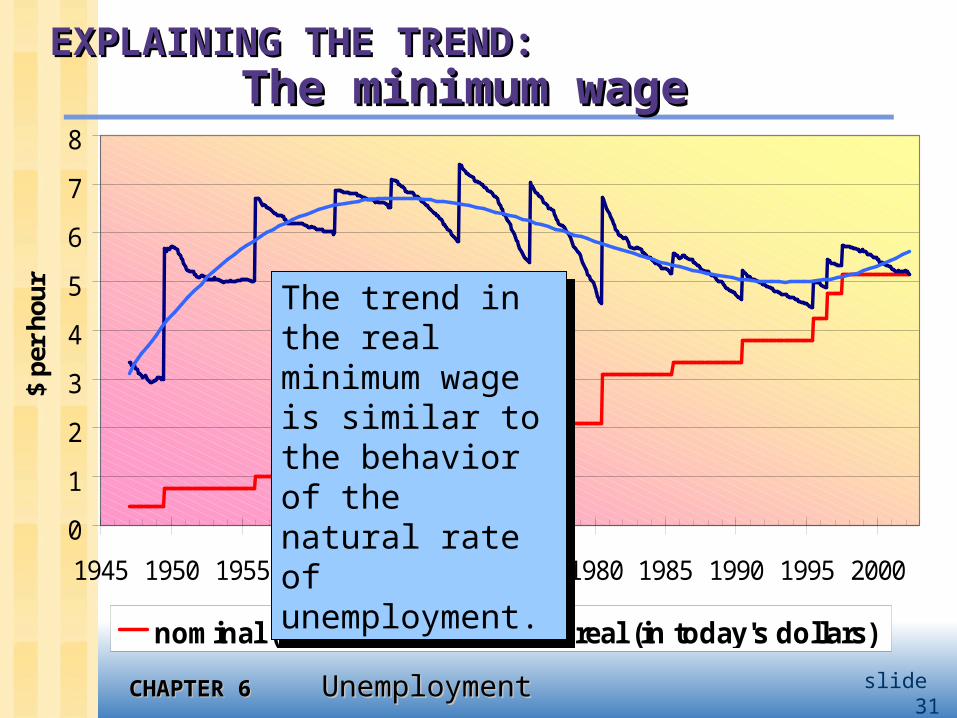
EXPLAINING THE TREND:EXPLAINING THE TREND:The minimum wageThe minimum wage
0
1
2
3
4
5
6
7
8
1945 1950 1955 1960 1965 1970 1975 1980 1985 1990 1995 2000
$ pe
r ho
ur
nominal (in current dollars) real (in today's dollars)
The trend in the real minimum wage is similar to the behavior of the natural rate of unemployment.
The trend in the real minimum wage is similar to the behavior of the natural rate of unemployment.
CHAPTER 6CHAPTER 6 Unemployment Unemployment slide 32
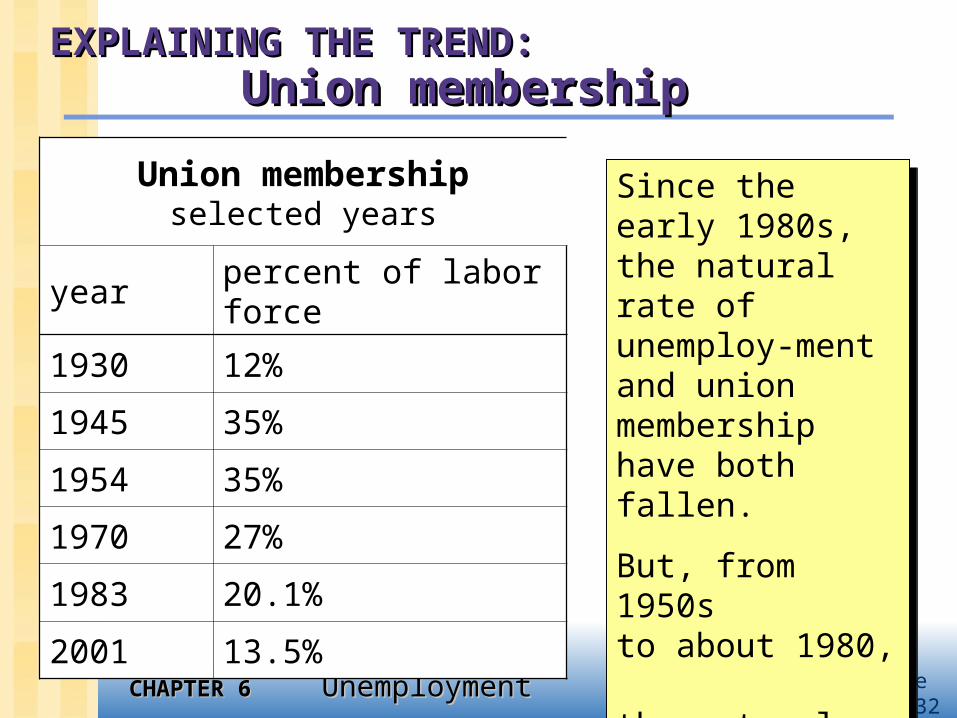
EXPLAINING THE TREND:EXPLAINING THE TREND:Union membershipUnion membership
Since the early 1980s, the natural rate of unemploy-ment and union membership have both fallen.
But, from 1950s to about 1980, the natural rate rose while union membership fell.
Since the early 1980s, the natural rate of unemploy-ment and union membership have both fallen.
But, from 1950s to about 1980, the natural rate rose while union membership fell.
Union membershipselected years
yearpercent of labor force
1930 12%
1945 35%
1954 35%
1970 27%
1983 20.1%
2001 13.5%
CHAPTER 6CHAPTER 6 Unemployment Unemployment slide 33
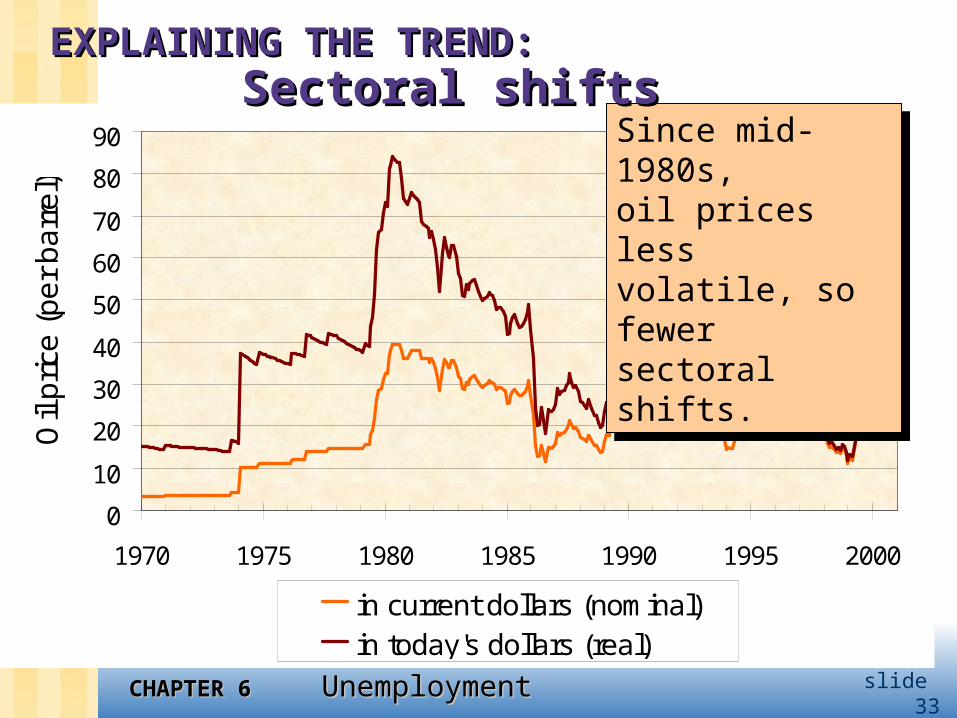
0
10
20
30
40
50
60
70
80
90
1970 1975 1980 1985 1990 1995 2000
Oil
pric
e (
pe
r b
arr
el)
in current dollars (nominal)in today's dollars (real)
Since mid-1980s, oil prices less volatile, so fewer sectoral shifts.
Since mid-1980s, oil prices less volatile, so fewer sectoral shifts.
EXPLAINING THE TREND:EXPLAINING THE TREND:Sectoral shiftsSectoral shifts
CHAPTER 6CHAPTER 6 Unemployment Unemployment slide 34
EXPLAINING THE TREND:EXPLAINING THE TREND:DemographicsDemographics
1970s: The Baby Boomers were young. Young workers change jobs more frequently (high value of s).
Late 1980s through today: Baby Boomers aged. Middle-aged workers change jobs less often (low s).
CHAPTER 6CHAPTER 6 Unemployment Unemployment slide 35
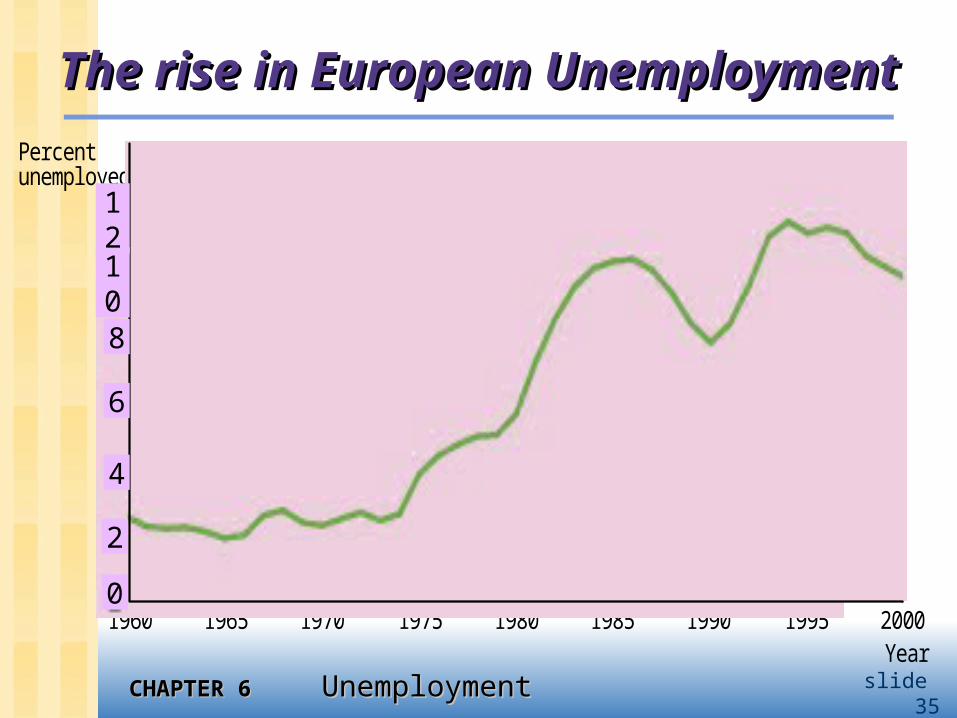
The rise in European UnemploymentThe rise in European Unemployment
Percentunemployed
1960Year
19701965 1975 1980 1985 1990 1995 20000
2
4
6
8
10
12
CHAPTER 6CHAPTER 6 Unemployment Unemployment slide 36
The rise in European UnemploymentThe rise in European Unemployment
Two explanations:
1. Most countries in Europe have generous social insurance programs.
2. Shift in demand from unskilled to skilled workers, due to technological change.
This demand shift occurred in the U.S., This demand shift occurred in the U.S., too. But wage rigidity is less of a too. But wage rigidity is less of a problem here, problem here, so the shift caused an increase in the so the shift caused an increase in the skilled-skilled-to-unskilled wage gap instead of an to-unskilled wage gap instead of an increase in unemployment. increase in unemployment.
This demand shift occurred in the U.S., This demand shift occurred in the U.S., too. But wage rigidity is less of a too. But wage rigidity is less of a problem here, problem here, so the shift caused an increase in the so the shift caused an increase in the skilled-skilled-to-unskilled wage gap instead of an to-unskilled wage gap instead of an increase in unemployment. increase in unemployment.
CHAPTER 6CHAPTER 6 Unemployment Unemployment slide 37
Chapter summaryChapter summary
1. The natural rate of unemployment the long-run average or “steady state”
rate of unemployment depends on the rates of job separation
and job finding
2. Frictional unemployment due to the time it takes to match
workers with jobs may be increased by unemployment
insurance
CHAPTER 6CHAPTER 6 Unemployment Unemployment slide 38
Chapter summaryChapter summary
3. Structural unemployment results from wage rigidity - the real
wage remains above the equilibrium level
Results from industry shifts within the economy over time
4. Duration of unemployment most spells are short term but most weeks of unemployment are
attributable to a small number of long-term unemployed persons
CHAPTER 6CHAPTER 6 Unemployment Unemployment slide 39
Chapter summaryChapter summary
5. Behavior of the natural rate in the U.S. rose from 1950s to early 1980s, then fell possible explanations:
trends in real minimum wage, union membership, prevalence of sectoral shifts, and aging of the Baby Boomers
6. European unemployment has risen sharply since 1980 probably due to generous unemployment
insurance and a technology-driven shift in demand away from unskilled workers
Top Related