


Languages
Pages
Legal

Chapter IV: Pore architecture of…..
141
CHAPTER-IV
Pore architecture of membranes

Chapter IV: Pore architecture of…..
142
Membranes based processes are an active area of interest for scientific community
engaged in developing new membranes and understanding the microscopic aspects of
their transport mechanism. Membrane processes are broadly divided on the basis of the
intrinsic pore sizes in liquid as well as gas permeation based separation schemes. For
example, reverse osmosis, pervaporation as well as gas separation schemes have pore
sizes below 0.8 nm while nanofiltration of liquid or gas separation using ceramic
membranes have pore sizes in the range of 0.8 to 1.5 nm. Ultrafiltration for liquid
permeation refers to pore sizes 2-60 nm, whereas membranes with pore sizes larger than
60 nm are used in microfiltration processes. In the dense and homogeneous polymer
membranes with pore sizes smaller than 1 nm, the mechanism is primarily known as
solution-diffusion model where the permeability is given as the product of diffusion
coefficient and solubility of liquid or gas, as the case may be, in the polymer matrix
[Baker et al., 2004].
Hydrophobic supported liquid membranes (SLMs) having pore sizes larger than
100 nm provide a nice alternative to conventional liquid-liquid extraction process such as
solvent extraction [Luque et al., 2000; Allen et al., 1999 and Baker et al., 1977]. In recent
years, SLMs have received considerable attention for the recovery of metallic ions from
waste water streams due to its characteristics such as low energy consumption, high
selectivity and rapid extraction capacity factor. SLM extraction is based on three phase
system with an organic phase sandwiched between two aqueous phases (inset Figure 4.1)
[Joensson et al., 1992, Barcelo et al., 1997 and van de Merbel et al., 1993]. The organic
phase containing the metal ion selective extractant and solvent is immobilized in a porous
hydrophobic membrane. This membrane acts as an intermediary separating the feed
phase, which contains the species to be removed, and the stripping phase in which the
species to be transferred is recovered [Reyes-Aguilera et al., 2008]. As in solvent
Chapter IV: Pore architecture of…..
143
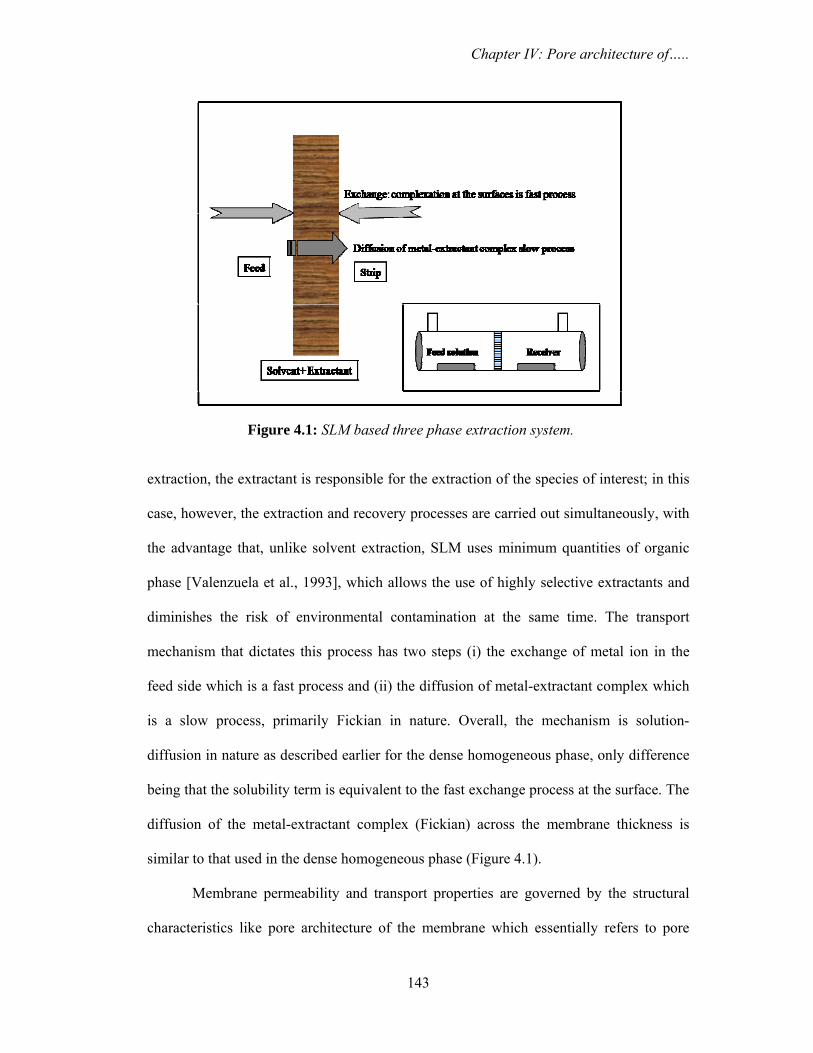
extraction, the extractant is responsible for the extraction of the species of interest; in this
case, however, the extraction and recovery processes are carried out simultaneously, with
the advantage that, unlike solvent extraction, SLM uses minimum quantities of organic
phase [Valenzuela et al., 1993], which allows the use of highly selective extractants and
diminishes the risk of environmental contamination at the same time. The transport
mechanism that dictates this process has two steps (i) the exchange of metal ion in the
feed side which is a fast process and (ii) the diffusion of metal-extractant complex which
is a slow process, primarily Fickian in nature. Overall, the mechanism is solution-
diffusion in nature as described earlier for the dense homogeneous phase, only difference
being that the solubility term is equivalent to the fast exchange process at the surface. The
diffusion of the metal-extractant complex (Fickian) across the membrane thickness is
similar to that used in the dense homogeneous phase (Figure 4.1).
Membrane permeability and transport properties are governed by the structural
characteristics like pore architecture of the membrane which essentially refers to pore
Figure 4.1: SLM based three phase extraction system.
Chapter IV: Pore architecture of…..
144
size, its distribution, pore fraction, porosity and pore interconnectivity. There are a host of
techniques such as small angle X-ray/neutron scattering (SAXS/SANS), gas absorption
techniques, ellipsometric porosimetry, electron microscopy that can characterize the size
as well as pore fraction, however, they fail to evaluate the extent of pore
interconnectivity. In this regard, positron annihilation spectroscopy (PAS) can be used as
a probe to characterize pore architecture not only in terms of pore size, pore size
distribution, pore fraction, porosity (open/closed) but also to evaluate the pore
interconnectivity through the evaluation of positron/Ps mobility in porous materials.
Essentially, the mean free path of Ps in the pores gives an idea about the length scale over
which pores may be interconnected thus providing a complete idea about the pore
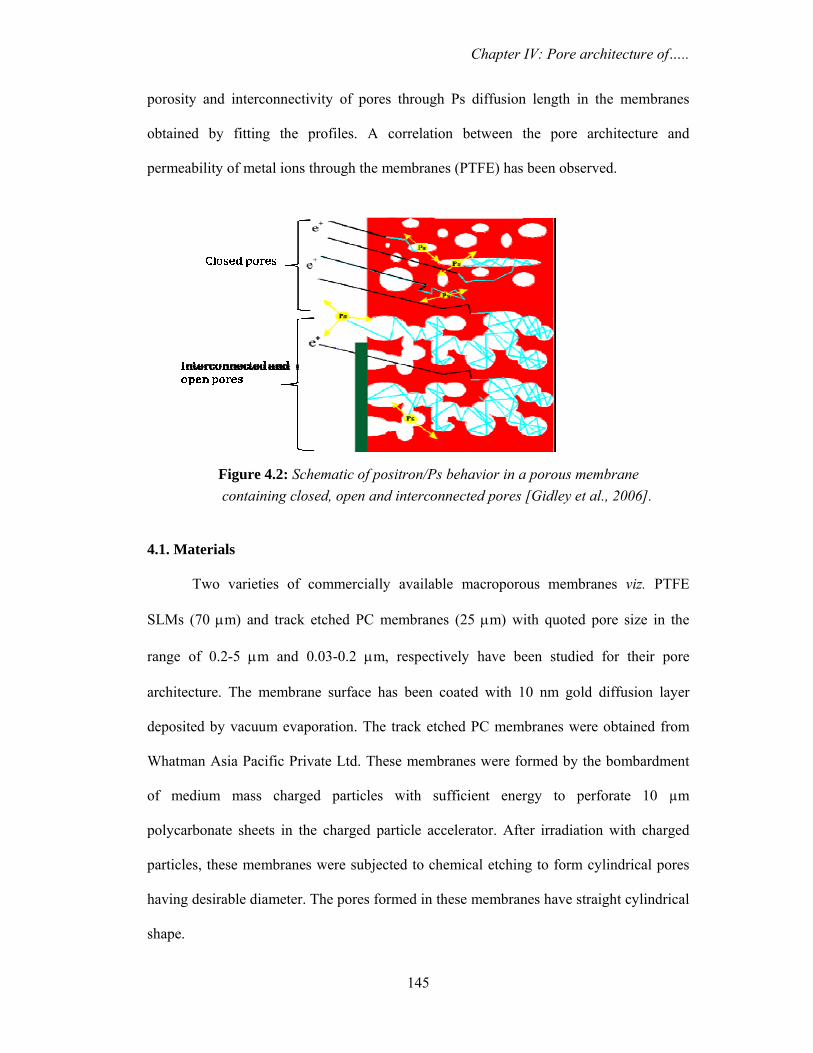
architecture. Figure 4.2 represents the positron/Ps behavior in a porous membrane
containing closed, open and interconnected pores. Positron injected into the porous
system forms Ps and then diffuses within the porous network by making collisions with
the walls of the pores. In the event of highly porous network or in vacuum, annihilation
from the intrinsic triplet state (3γ annihilation) is enhanced. Ps escaping into the vacuum
(3γ annihilation) is a telltale indicator of highly porous (open porosity) and interconnected
network. The technique involves slow positron beam depth profiling to obtain
annihilation profile in the porous membrane, which is used to evaluate Ps
diffusion/mobility within the porous network. The 3γ/2γ ratio is mainly used to
characterise porosity or Ps reemission from surfaces [Petkov et al., 2001 and 2003;
Gidley et al., 2006] through the evaluation of Ps diffusion length inside the membrane
using VEPFIT analysis.
In the present work, polytetraflouroethylene (PTFE) SLMs and track etched
polycarbonate (PC) membranes have been studied for their pore architecture using slow
positron beam depth profiling. The 3γ/2γ profile has been utilized as a measure of
Chapter IV: Pore architecture of…..
145
porosity and interconnectivity of pores through Ps diffusion length in the membranes
obtained by fitting the profiles. A correlation between the pore architecture and
permeability of metal ions through the membranes (PTFE) has been observed.
4.1. Materials
Two varieties of commercially available macroporous membranes viz. PTFE
SLMs (70 μm) and track etched PC membranes (25 μm) with quoted pore size in the
range of 0.2-5 μm and 0.03-0.2 μm, respectively have been studied for their pore
architecture. The membrane surface has been coated with 10 nm gold diffusion layer
deposited by vacuum evaporation. The track etched PC membranes were obtained from
Whatman Asia Pacific Private Ltd. These membranes were formed by the bombardment
of medium mass charged particles with sufficient energy to perforate 10 µm
polycarbonate sheets in the charged particle accelerator. After irradiation with charged
particles, these membranes were subjected to chemical etching to form cylindrical pores
having desirable diameter. The pores formed in these membranes have straight cylindrical
shape.
Figure 4.2: Schematic of positron/Ps behavior in a porous membrane containing closed, open and interconnected pores [Gidley et al., 2006].
Chapter IV: Pore architecture of…..
146
4.2. Experimental Techniques
4.2.1. Conventional characterization of the membranes
Polytetraflouroethylene Supported liquid membranes
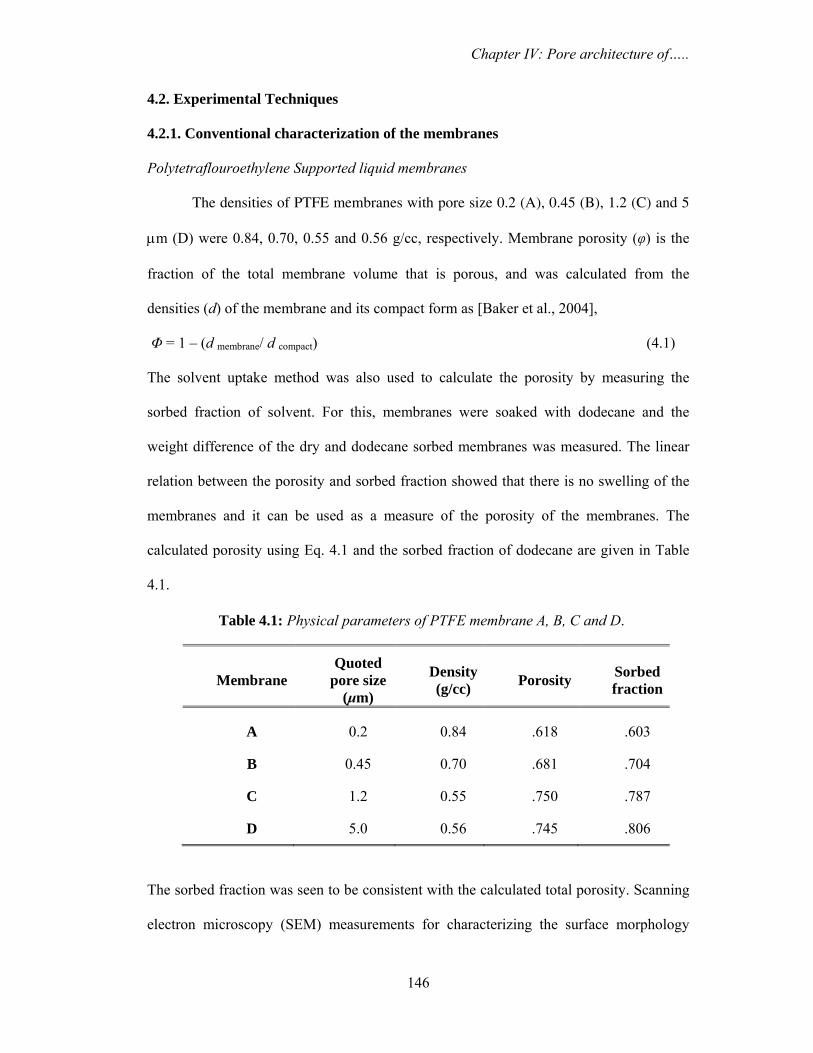
The densities of PTFE membranes with pore size 0.2 (A), 0.45 (B), 1.2 (C) and 5
μm (D) were 0.84, 0.70, 0.55 and 0.56 g/cc, respectively. Membrane porosity (φ) is the
fraction of the total membrane volume that is porous, and was calculated from the
densities (d) of the membrane and its compact form as [Baker et al., 2004],
Φ = 1 – (d membrane/ d compact) (4.1)
The solvent uptake method was also used to calculate the porosity by measuring the
sorbed fraction of solvent. For this, membranes were soaked with dodecane and the
weight difference of the dry and dodecane sorbed membranes was measured. The linear
relation between the porosity and sorbed fraction showed that there is no swelling of the
membranes and it can be used as a measure of the porosity of the membranes. The
calculated porosity using Eq. 4.1 and the sorbed fraction of dodecane are given in Table
4.1.
Membrane Quoted
pore size (μm)
Density(g/cc) Porosity Sorbed
fraction
A 0.2 0.84 .618 .603
B 0.45 0.70 .681 .704
C 1.2 0.55 .750 .787
D 5.0 0.56 .745 .806
The sorbed fraction was seen to be consistent with the calculated total porosity. Scanning
electron microscopy (SEM) measurements for characterizing the surface morphology
Table 4.1: Physical parameters of PTFE membrane A, B, C and D.

Chapter IV: Pore architecture of…..
147
were carried out in back scattering mode with 1200X magnification. The chemical nature
of the membranes (impurities if any) was examined by attenuated total reflection infra red
spectroscopy (ATR-FTIR). A PIKE MIRacle™ Attenuated total reflection (ATR)
accessory equipped with a single reflection diamond ATR crystal was used for the
analysis. The MIRacle accessory was fitted with a high pressure clamp, providing
intimate contact between the sample and ATR crystal. The samples were placed over
ATR crystal and maximum pressure was applied using the slip-clutch mechanism.
4.2.2. Small angle X-ray scattering
Polytetraflouroethylene Supported liquid membranes
SAXS is a powerful non-destructive technique to investigate structural features on
the length scale ranging from one to hundred nanometers. SAXS measurement was
carried out to investigate the presence of mesoscopic structure in the membranes. It was
done using small goniometer mounted on 12 kW Rigaku rotating anode X-ray generator
with CuKα radiation. Intensities were measured by transmission method using
scintillation counter with pulse height analyzer. Intensity (I (q)) was recorded as a
function of wave vector transfer, q (= 4πsinθ/λ), 2θ being scattering angle and λ is the
wave length of incident X-ray, (λ = 0.154 nm) in the steps of scattering angle 2θ. The
measured intensities were corrected for absorption and slit smearing effects [Schmidt et
al. 1960].
4.2.3. Positron annihilation lifetime spectroscopy
Polytetraflouroethylene Supported liquid membranes
The conventional positron annihilation lifetime (PALS) measurements were
carried out using a pair of plastic scintillation detectors with a fast-fast coincidence
system with time resolution of ~220 ps under 10-2 torr vacuum. Measurements were
Chapter IV: Pore architecture of…..
148
carried out using a 22Na source in sandwich configuration. Several pieces of the
membranes A, B, C or D as the case may be, were taken on either side to ensure that
positrons annihilate in the sample. The life-time spectra were fitted using routine
PATFIT-88 program [Kirkegaard and Eldrup, 1989].
4.2.4. Doppler broadening and 3γ/2γ annihilation radiation measurements
Polytetraflouroethylene Supported liquid membranes and polycarbonate membranes
Beam based Doppler broadening and 3γ/2γ annihilation radiation measurements
were carried out as a function of positron incident energy (200 eV- 20 keV) in pristine
and gold coated membranes, as the case may be. A 30% relative efficiency High purity
germanium (HPGe) detector with a resolution of 2 keV at 1332 keV of 60Co was used for
Doppler broadening and 3γ/2γ annihilation measurements. Spectra with 5x10⁵ counts
were acquired at each energy. The detector placement was perpendicular to the beam and
~ 3 cm away from the sample. For Doppler broadening measurements, the ratio of
integral counts within a ~1.8 keV energy window, centered at 511 keV and the total
photopeak area was used to measure the S-parameter. The energy spectra were used to
calculate 3γ/2γ ratio which measures the self annihilation of Ps from its triplet state (o-
Ps). Counts in the energy region 383 keV to 475 keV and 497 keV to 522 keV in full
energy spectra were taken as 3γ and 2γ annihilation contributions, respectively. The
obtained 3γ/2γ profiles were fitted using VEPFIT to determine the diffusion length of Ps
in the membranes.
4.2.5. Transport properties (permeability of metal ions)
Transport properties of PTFE SLMs were studied in terms of permeability of
metal ions viz. Am+3 and Pu+3 through these membranes. The membrane containing the
extractant N,N,N’,N’-tetraoctyl diglycolamide (TODGA) in dodecan solvent separates

Chapter IV: Pore architecture of…..
149
the two compartments viz. the feed chamber containing the metal ions (in 0.1 M HNO3)
and the receiver chamber (0.1 M HNO3). Both the chambers were stirred continuously
using a magnetic stirrer and known concentration of tracer (Am+3 and Pu+3) was added to
the feed compartment. The concentration of these tracers were monitored (using liquid
scintillation counting) in the receiver compartments as a function of time. The
permeability coefficients (Pt) were calculated using the expression [Bansal et al., 2005],
ln(Cf,t/Cf,o) = -(Q/Vf) Pt (4.2)
where, Cf,t and Cf,o are the concentration of the metal ion in the feed phase at time ‘t’ and
at the starting of the experiment, respectively, Vf is the feed volume and Q is the effective
membrane area. Q is expressed as the product of the geometrical surface area (A) and the
porosity (φ).
4.3. Results and discussion
4.3.1. Polytetraflouroethylene Supported liquid membranes
Figure 4.3: SEM images of PTFE SLMs with pore sizes as; A (0.2 μm), B (0.45 μm), C (1.2 μm) and D (5.0 μm). Yellow line indicates 50 μm length scale.
A B
C D

Chapter IV: Pore architecture of…..
150
4.3.1a. Surface morphology and chemical nature
Surface morphology of the membranes as characterized by SEM is shown in
Figure 4.3. SEM images show that these membranes have different surface morphology
and can be categorized into two classes. Membranes A and B show granular structure
with small pores, whereas membranes C and D show fibre like structure with large open
pores. The porosity data (Table 4.1) for the membranes is seen to be consistent with the
morphology. Figure 4.4 shows the ATR-FTIR spectra for all the membranes. The
presence of only two peaks at 1275 cm-1 and 1205 cm-1 characteristics of PTFE
corresponding to C-C and C-F bonds ensures that there are no other chemical impurities
that might influence the Ps formation probabilities.
4.3.1b. Small angle X-ray scattering
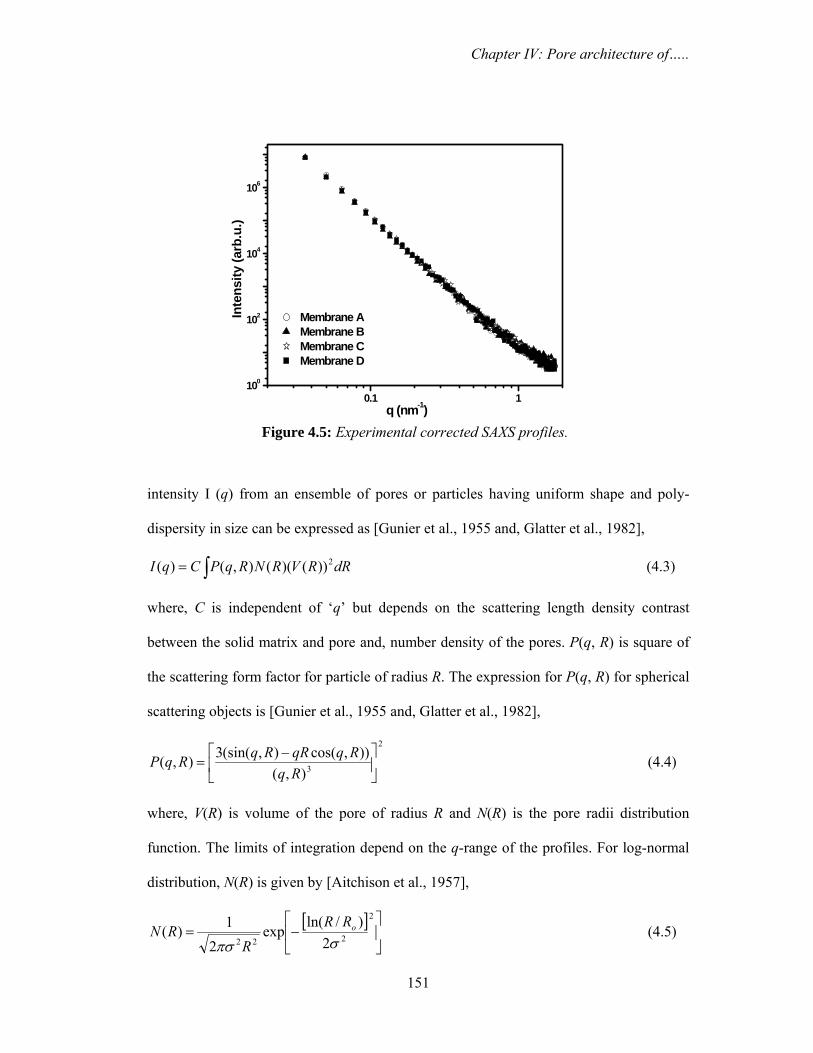
Experimental corrected SAXS profiles are shown in Figure 4.5. The profiles for
all the membranes are seen to be similar and vary as q-4 in the high-q region suggesting
smooth surface for the scattering objects (pores in the present samples). The SAXS
Figure 4.4: ATR-FTIR spectra of PTFE SLMs.
0.0
0.4
0.8
2500 2000 1500 1000 500
0.0
0.4
0.8
0.0
0.4
0.8
0.0
0.4
0.8
Wavenumber (cm-1)
Membrane-A
Abs
orba
nce
Membrane-B
Membrane-D
Membrane-C
Chapter IV: Pore architecture of…..
151
intensity I (q) from an ensemble of pores or particles having uniform shape and poly-
dispersity in size can be expressed as [Gunier et al., 1955 and, Glatter et al., 1982],
dRRVRNRqPCqI ∫= 2))()((),()( (4.3)
where, C is independent of ‘q’ but depends on the scattering length density contrast
between the solid matrix and pore and, number density of the pores. P(q, R) is square of
the scattering form factor for particle of radius R. The expression for P(q, R) for spherical
scattering objects is [Gunier et al., 1955 and, Glatter et al., 1982],
2
3),()),cos(),(sin(3),( ⎥⎦
⎤⎢⎣
⎡ −=
RqRqqRRqRqP (4.4)
where, V(R) is volume of the pore of radius R and N(R) is the pore radii distribution
function. The limits of integration depend on the q-range of the profiles. For log-normal
distribution, N(R) is given by [Aitchison et al., 1957],
[ ]⎥⎦
⎤⎢⎣
⎡−=
2
222 2)/ln(exp
21)(
σπσoRR
RRN (4.5)
0.1 1100
102
104
106
Inte
nsity
(arb
.u.)
q (nm-1)
Membrane AMembrane BMembrane CMembrane D
Figure 4.5: Experimental corrected SAXS profiles.
Chapter IV: Pore architecture of…..
152
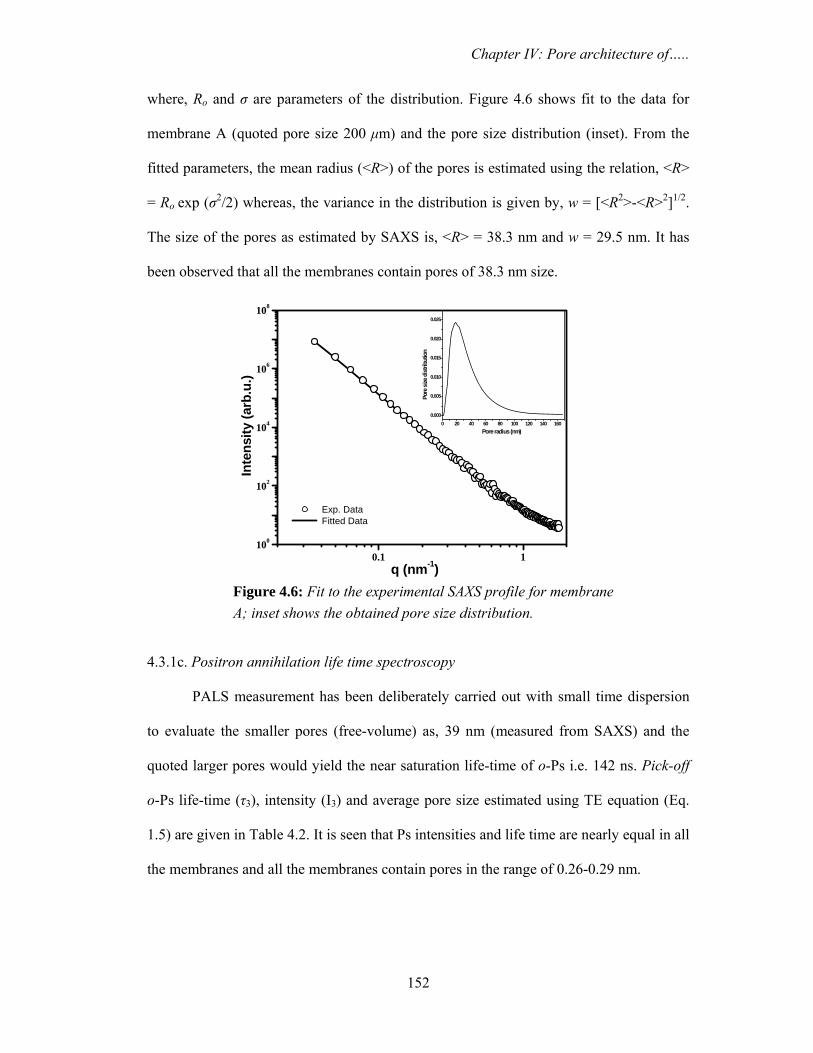
where, Ro and σ are parameters of the distribution. Figure 4.6 shows fit to the data for
membrane A (quoted pore size 200 μm) and the pore size distribution (inset). From the
fitted parameters, the mean radius (<R>) of the pores is estimated using the relation, <R>
= Ro exp (σ2/2) whereas, the variance in the distribution is given by, w = [<R2>-<R>2]1/2.
The size of the pores as estimated by SAXS is, <R> = 38.3 nm and w = 29.5 nm. It has
been observed that all the membranes contain pores of 38.3 nm size.
4.3.1c. Positron annihilation life time spectroscopy
PALS measurement has been deliberately carried out with small time dispersion
to evaluate the smaller pores (free-volume) as, 39 nm (measured from SAXS) and the
quoted larger pores would yield the near saturation life-time of o-Ps i.e. 142 ns. Pick-off
o-Ps life-time (τ3), intensity (I3) and average pore size estimated using TE equation (Eq.
1.5) are given in Table 4.2. It is seen that Ps intensities and life time are nearly equal in all
the membranes and all the membranes contain pores in the range of 0.26-0.29 nm.
0.1 1100
102
104
106
108
0 20 40 60 80 100 120 140 1600.000
0.005
0.010
0.015
0.020
0.025
Pore
size
dist
ribut
ion
Pore radius (nm)
Inte
nsity
(arb
.u.)
q (nm-1)
Exp. Data Fitted Data
Figure 4.6: Fit to the experimental SAXS profile for membrane A; inset shows the obtained pore size distribution.

Chapter IV: Pore architecture of…..
153
Table 4.2: o-Ps life life-time, Intensity and calculated pore size (PALS measurement)
Membranes o-Ps pick-off lifetime, τ3 (ns)
Intensity, I3 (%)
Radius
(nm)
A 1.92 5.99 0.28
B 1.76 6.22 0.26
C 1.98 7.03 0.29
D 1.82 5.59 0.27
4.3.1d. Doppler broadening and 3γ/2γ annihilation spectroscopy
The S-parameter and 3γ/2γ ratio as a function of positron energy (depth) for all the
membranes (as received/pristine) are shown in Figure 4.7 and 4.8, respectively. The S-
parameter profiles are seen to be flat and no significant difference has been observed for
membranes A, B, C and D. This is similar to the behavior of S-parameter in nonporous
PTFE. Flatness of the profiles in the present case may also be due to the highly porous
nature of the membranes. It is, therefore, not useful in elucidating any information on Ps
0 2 4 6 8 100.54
0.55
0.56
0.57
0.58
0.59
0.60Membrane AMembrane BMembrane CMembrane D
S- p
aram
eter
Positron energy (keV)
Figure 4.7: The S-parameter profile for pristine PTFE SLMs. Error on the data is indicated on one of the data points in the figure.
Chapter IV: Pore architecture of…..
154
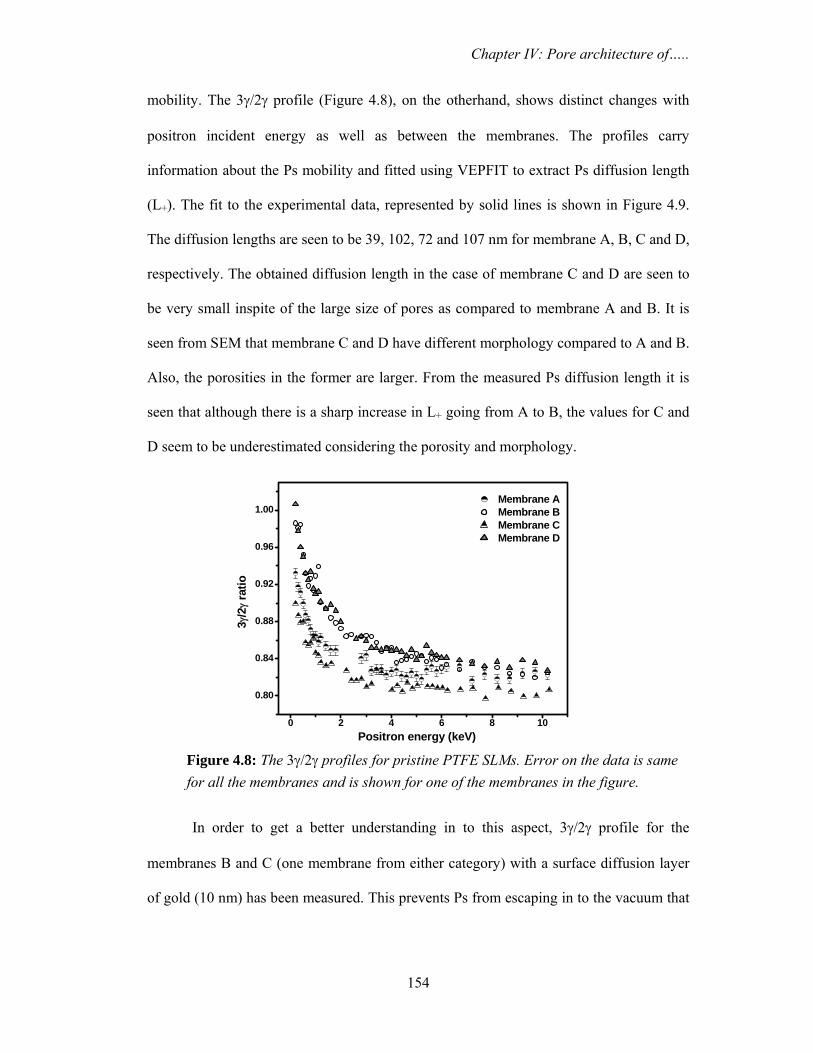
mobility. The 3γ/2γ profile (Figure 4.8), on the otherhand, shows distinct changes with
positron incident energy as well as between the membranes. The profiles carry
information about the Ps mobility and fitted using VEPFIT to extract Ps diffusion length
(L+). The fit to the experimental data, represented by solid lines is shown in Figure 4.9.
The diffusion lengths are seen to be 39, 102, 72 and 107 nm for membrane A, B, C and D,
respectively. The obtained diffusion length in the case of membrane C and D are seen to
be very small inspite of the large size of pores as compared to membrane A and B. It is
seen from SEM that membrane C and D have different morphology compared to A and B.
Also, the porosities in the former are larger. From the measured Ps diffusion length it is
seen that although there is a sharp increase in L+ going from A to B, the values for C and
D seem to be underestimated considering the porosity and morphology.
In order to get a better understanding in to this aspect, 3γ/2γ profile for the
membranes B and C (one membrane from either category) with a surface diffusion layer
of gold (10 nm) has been measured. This prevents Ps from escaping in to the vacuum that
0 2 4 6 8 10
0.80
0.84
0.88
0.92
0.96
1.00
3γ
/2γ r
atio
Membrane AMembrane BMembrane CMembrane D
Positron energy (keV)
Figure 4.8: The 3γ/2γ profiles for pristine PTFE SLMs. Error on the data is same for all the membranes and is shown for one of the membranes in the figure.

Chapter IV: Pore architecture of…..
155
might modify 3γ/2γ profile. The 3γ/2γ profile for goldcoated and the pristine membranes
(B and C) are compared in Figure 4.10.
Figure 4.9: VEPFIT analysis of 3γ/2γ ratio for PTFE SLMs. Solid lines represent fit to the experimental data.
0 2 4 6 8 100.80
0.84
0.88
0.92
0.96
1.00
1.04
1.08
3γ/2γ r
atio
Positron energy (keV)
0.80
0.84
0.88
0.92
0.96
1.00
1.04
1.08
Membrane B
Membrane C
Figure 4.10: 3γ/2γ profiles for Pristine and goldcoated PTFE (soild symbols) membranes B and C.

Chapter IV: Pore architecture of…..
156
At thermal velocity, Ps can travel a substantial distance away from the surface
prior to annihilation. Considering the experimental arrangement (detector perpedicular to
sample), Ps escape from the membrane surface due to open surface porosity has resulted
in the decrease in 3γ detection leading to decrese in 3γ/2γ ratio in the surface region. In
the case of membrane C, the open porosity on the surface seems to be much higher than
the membrane B as reflected from the large difference in 3γ/2γ ratio (surface region) in
the former. The fitting of 3γ/2γ profiles obtained in the case of goldcoated membranes
show much higher L+ viz. 400 and 3000 nm for B and C, respectively as compared to 102
and 72 in the corresponding pristine membranes. By preventing Ps to escape from the
surface and make them coral within the membrane reveals the true picture of the pore
architecture of the membranes. The L+ is related to the mean free path of Ps and hence,
measure of pore interonnectivity. The obtained L+ indicate that pore interconnectivity is
much higher in the case of fibrous membranes (C and D) as compared to membrane A
and B having granular structure.
4.3.1.e. Permeability of metal ions and transport properties
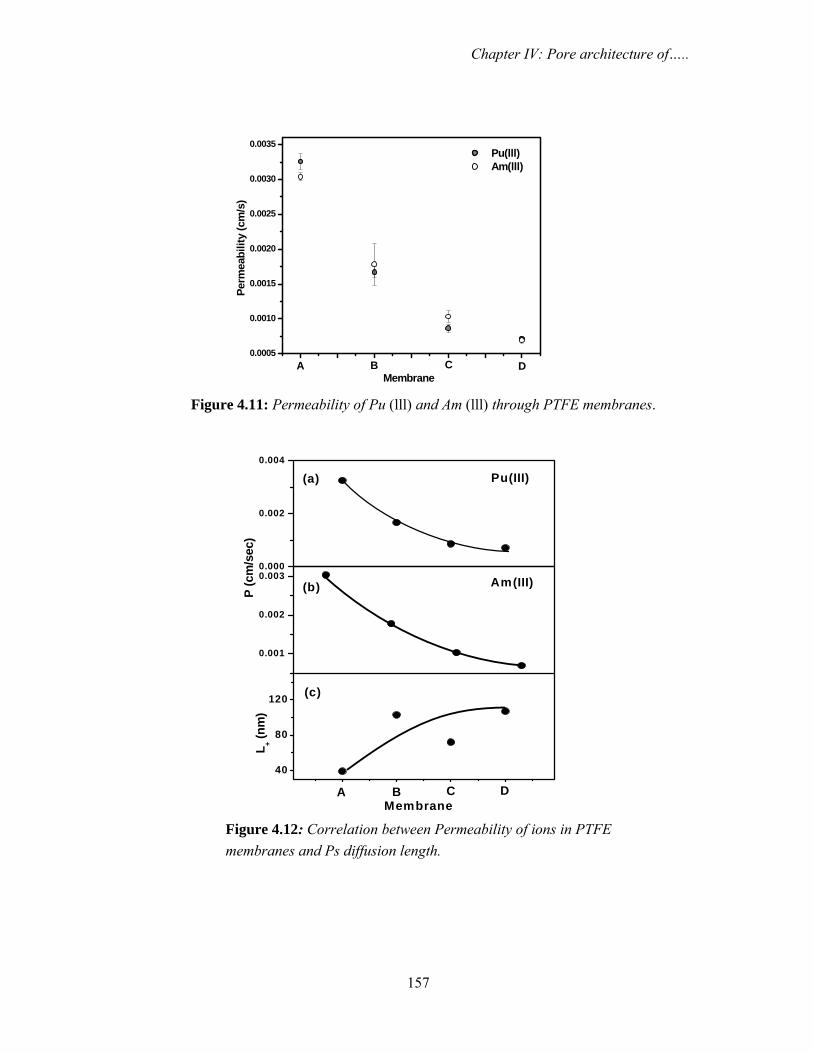
Figure 4.11 shows the permeabilty of Pu+3 and Am+3 for all the four membranes
(A, B, C and D) with TODGA as extractant, n-dodecan as solvent and nitric acid in feed
as well as receiver cells. A systematic decrease in permeability is seen from A to D ( i.e.
increase in pore size) under identical condition. Similar trend has also been seen in earlier
studies on the permeation of UO22+ through identical PTFE SLMs [Mohapatra et al., 2006
and Lakshmi et al., 2004]. It is known that permeability is proportional to φR2 (R being
radius of pore) and inversely proportional to the thickness of the membrane [Baker,
2004]. The latter being identical in all the membranes, the permeability should have been
highest in the case of membrane D contrary to what is observed in the present study.
Chapter IV: Pore architecture of…..
157
0.001
0.002
0.003
B DCA
P (c
m/s
ec)
Membrane
L + (nm
)
40
80
120 (c)
(b)
(a)
0.000
0.002
0.004
Am(III)
Pu(III)
Figure 4.12: Correlation between Permeability of ions in PTFE membranes and Ps diffusion length.
0.0005
0.0010
0.0015
0.0020
0.0025
0.0030
0.0035
DCBA
Perm
eabi
lity
(cm
/s)
Membrane
Pu(lll) Am(lll)
Figure 4.11: Permeability of Pu (lll) and Am (lll) through PTFE membranes.
Chapter IV: Pore architecture of…..
158
An inverse correlation between the permeability and L+ has been observed for
PTFE SLMs (Figure 4.12) i.e. higher the L+, lower is the permeability. A systematic
increase in L+ can be ascribed to increase in pore interconnectivity or pore overlap,
resulting in enhancement in the mean free path of the Ps atom. Such interconnection of
pores provides alternative path to the diffusing metal ion complex which could be longer
than the thickness of the membrane it has to travel to reach the receiver compartment.
Overall this would result in increase in the time taken by the metal ions to permeate
through the membrane resulting in decrease in permeability. In the parlance of membrane
science this is referred to as tortuosity. Permeability scales inversely with tortuosity i.e.
higher the tortuosity lower is the permeability [Baker et al., 2004]. Pore interconnectivity
is the main microscopic reason for the increase in the tortuosity in a membrane as evident
from the measured L+. The large pore interconnectivity is seen to have deleterious effect
on the permeability (inverse relation between the two) of metal ions through the
membrane.
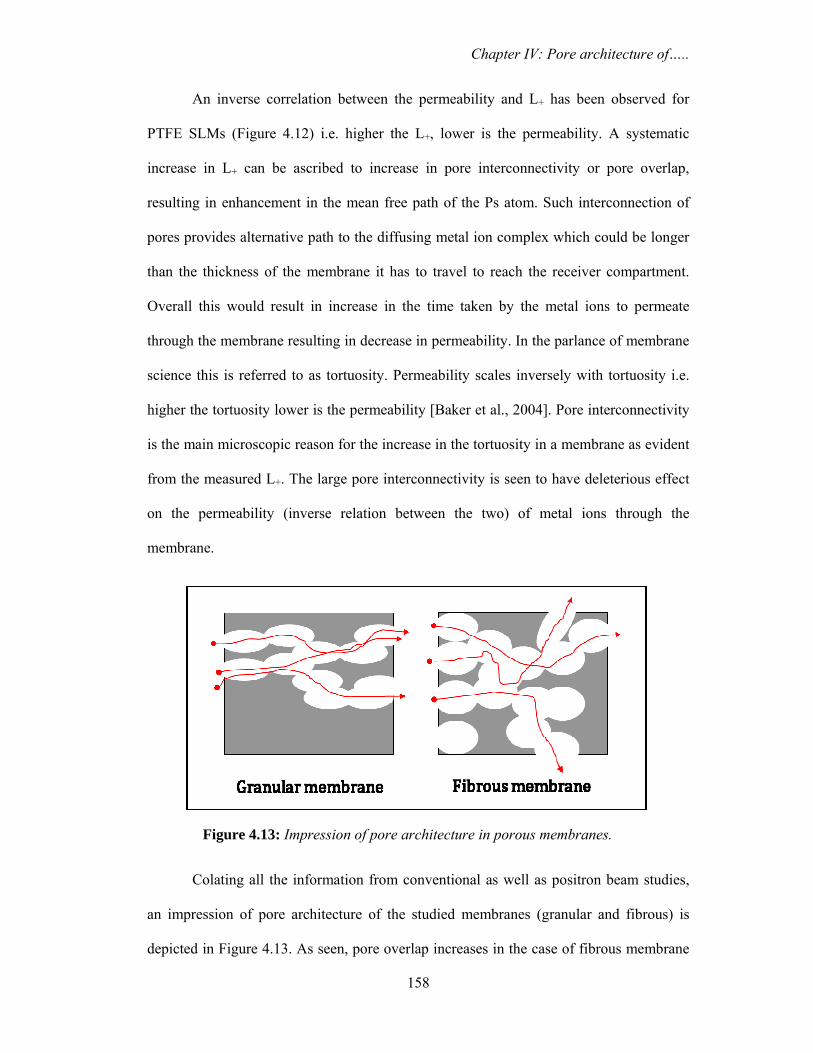
Colating all the information from conventional as well as positron beam studies,
an impression of pore architecture of the studied membranes (granular and fibrous) is
depicted in Figure 4.13. As seen, pore overlap increases in the case of fibrous membrane
Figure 4.13: Impression of pore architecture in porous membranes.
Chapter IV: Pore architecture of…..
159
having large size pores, resulting in large interconnectivity between the pores. Also,
fibrous membrane have high open porosity. The solid lines represent the path taken by the
metal ion complex across the membrane. Pore overlap (interconnection) is seen to
provide alternative tortuous path to metal ions resulting in lowering of permeability.
4.3.2. Track etched polycarbonate membranes
4.3.2a. Surface morphology
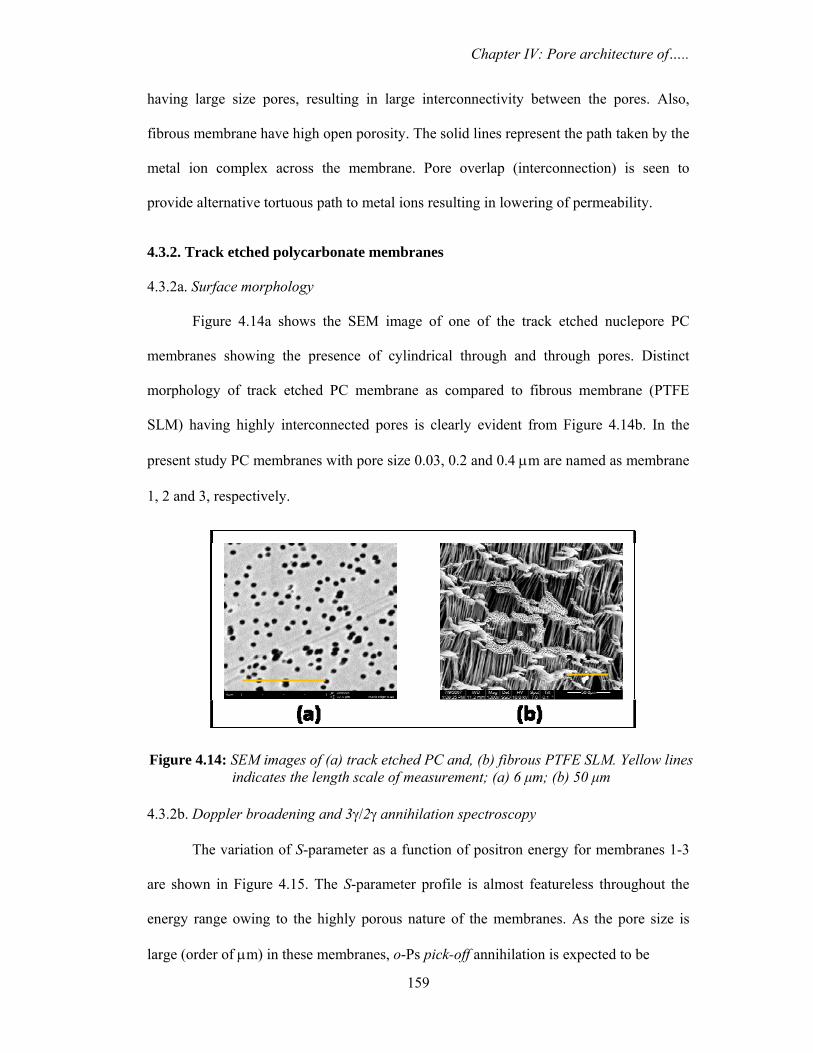
Figure 4.14a shows the SEM image of one of the track etched nuclepore PC
membranes showing the presence of cylindrical through and through pores. Distinct
morphology of track etched PC membrane as compared to fibrous membrane (PTFE
SLM) having highly interconnected pores is clearly evident from Figure 4.14b. In the
present study PC membranes with pore size 0.03, 0.2 and 0.4 μm are named as membrane
1, 2 and 3, respectively.
4.3.2b. Doppler broadening and 3γ/2γ annihilation spectroscopy
The variation of S-parameter as a function of positron energy for membranes 1-3
are shown in Figure 4.15. The S-parameter profile is almost featureless throughout the
energy range owing to the highly porous nature of the membranes. As the pore size is
large (order of μm) in these membranes, o-Ps pick-off annihilation is expected to be
Figure 4.14: SEM images of (a) track etched PC and, (b) fibrous PTFE SLM. Yellow lines indicates the length scale of measurement; (a) 6 μm; (b) 50 μm

Chapter IV: Pore architecture of…..
160
insensitive to the pore sizes and most of the o-Ps annihilate by 3γ annihilation. The
energy spectroscopy (3γ/2γ), which directly senses the formation and complete history of
long-lived 3γ decay of o-Ps, is seen to be a more sensitive technique for the investigation
of pore architecture in these membranes. In addition, similar to earlier observation in
PTFE SLMs, open porosity due to large pore size may modify the 3γ/2γ profiles and
hence, corresponding goldcoated membranes are also studied in order to get true picture
of pore architecture in these membranes. The 3γ/2γ profiles for PC membranes are shown
in Figure 4.16 indicating distinct variation between the membranes. The quantitative
analysis for the observed variations is carried out by evaluating L+ using VEPFIT. The L+
obtained by fitting the 3γ/2γ profiles are 55, 30 and 76 nm for membrane 1, 2 and 3,
respectively. No systematic trend in L+ is seen with the increase in the pore size. Based
on our earlier observations (PTFE SLMs), for large size pores (micron range) and highly
porous membranes, the escape of Ps from the surface modifies the profiles resulting in
underestimation of L+. In such cases, true pore architecture can be obtained by capping
the membrane surface with gold layer to prevent Ps escape from the surface. The S-
0 4 8 12 16 200.52
0.53
0.54
0.55
0.56
0.57
0.58
0.59
0.60 Membrane 1 Membrane 2 Membrane 3
S-pa
ram
eter
Positron energy (keV)
Figure 4.15: The S-parameter profile for pristine track etched PC membranes; Membrane 1 (0.03 μm), Membrane 2 (0.2 μm) and Membrane 3 (0.4 μm).

Chapter IV: Pore architecture of…..
161
Figure 4.16: 3γ/2γ profiles for pristine track etched PC membranes.
0 4 8 12 16 20
0.76
0.80
0.84
0.88
0.92
3γ/2γ r
atio
Positron energy (keV)
Membrane 1 Membrane 2 Membrane 3
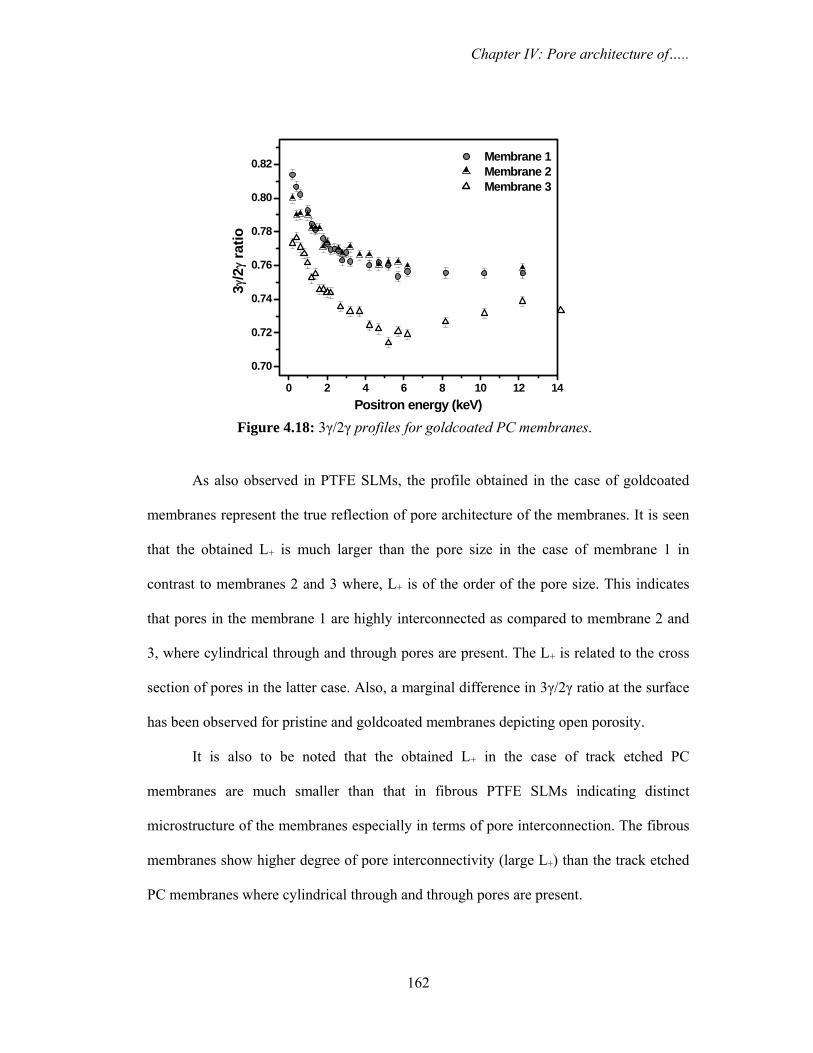
parameter and 3γ/2γ profile for goldcoated PC membranes are shown in Figures 4.17 and
4.18, respectively. No significant variation is S-parameter with depth has been observed
owing to the porous nature of the membranes and hence, it cannot be used to elucidate
any information about the pore architecture. However, it indicates that Ps yield in all the
membranes is same. On the otherhand, 3γ/2γ profiles for goldcoated membranes show
distinct behavior as compared to their pristine forms. The measured L+ for goldcoated
membrane 1, 2 and 3 are 375, 255 and 330 nm, respectively.
0 2 4 6 8 10 12
0.58
0.59
0.60
0.61
0.62
0.63 Membrane 1 Membrane 2 Membrane 3
S-pa
ram
eter
Positron energy (keV)
Figure 4.17: The S-parameter profile for goldcoated PC membranes.
Chapter IV: Pore architecture of…..
162
As also observed in PTFE SLMs, the profile obtained in the case of goldcoated
membranes represent the true reflection of pore architecture of the membranes. It is seen
that the obtained L+ is much larger than the pore size in the case of membrane 1 in
contrast to membranes 2 and 3 where, L+ is of the order of the pore size. This indicates
that pores in the membrane 1 are highly interconnected as compared to membrane 2 and
3, where cylindrical through and through pores are present. The L+ is related to the cross
section of pores in the latter case. Also, a marginal difference in 3γ/2γ ratio at the surface
has been observed for pristine and goldcoated membranes depicting open porosity.
It is also to be noted that the obtained L+ in the case of track etched PC
membranes are much smaller than that in fibrous PTFE SLMs indicating distinct
microstructure of the membranes especially in terms of pore interconnection. The fibrous
membranes show higher degree of pore interconnectivity (large L+) than the track etched
PC membranes where cylindrical through and through pores are present.
Figure 4.18: 3γ/2γ profiles for goldcoated PC membranes.
0 2 4 6 8 10 12 14
0.70
0.72
0.74
0.76
0.78
0.80
0.82 Membrane 1 Membrane 2 Membrane 3
3γ/2γ r
atio
Positron energy (keV)

Chapter IV: Pore architecture of…..
163
4.4. Conclusions
The pore architecture of supported liquid PTFE and track etched PC membranes
having micron size pores have been studied using PAS. Slow positron beam depth
profiling has been utilized to evaluate Ps mobility (diffusion length) in these membranes
defined by the mean free path of Ps in the system. This has been utilized to evaluate pore
architecture in terms of pore interconnectivity in these membranes. Ps diffusion length, a
measure of length of interconnection of the pores is evaluated from the 3γ/2γ profiles
using VEPFIT analysis. The high open porosity at the surface has been seen to modify
3γ/2γ profiles due to the escape of Ps from the surface and do not represent the true pore
architecture. Capping the surface of the membrane with thin gold layer prevents the
escape of Ps from the surface and hence, gives a true reflection of the pore architecture of
the membranes. In the case of PTFE SLMs, high interconnectivity has been observed for
the fibrous class of the membrane (C and D) as compared to the granular (A and B). An
inverse correlation between the pore interconnectivity and the permeability of metal ions
through SLMs has been observed. High interconnectivity results in decrease in
permeability. The increase in tortousity due to large interconnectivity is responsible for
the decrease in permeability. On the otherhand, in the case of track etched PC membranes
having through-and-through cylindrical pores, the interconnectivity between the pores is
seen to be less than the PTFE SLMs. It is also observed that, in the case of less
interconnected but large size pores, Ps diffusion length is a measure of cross section
rather than length of the pores. PAS is one of the best probes to measure pore sizes in the
range of 0.1-1 nm. However, for polymeric systems having large size and interconnected
pores, slow positron beam depth profiling provide an approach to measure pore
architecture of the membrane especially in terms of open porosity and length of
interconnection between the pores. The pore architecture of the membrane is the

Chapter IV: Pore architecture of…..
164
microscopic origin of the transport properties of the membranes. The study demonstrates
the advantages of positron beam characterization of pore interconnectivity in the
design/development of membranes with tailored transport properties.
Top Related