


Languages
Pages
Legal

9/22/2009
1
A glance at our Global VillageIf we could shrink the Earth’s population to a village of
precisely 100 people…with all existing human ratios remaining the same, it would look like this:
1. There would be 57 Asians, 21 Europeans, 14 from the Western Hemisphere (North and South) and 8 Africans.
2. 51 would be female; 49 would be male; 90 % are heterosexual.3. 70 would be non-Christian; 30 Christian4. 70 would be non-white; 30 white5. 50% of the entire world’s wealth would be in the hands of only
6 people, and all 6 would be citizens of the United States.6. 80 would live in substandard housing.7. 70 would be unable to read.8. 50 would suffer from malnutrition.9. 1 would be near death, 1 would be near birth.10. Only 1 would have a college education, and one would own a
computer.
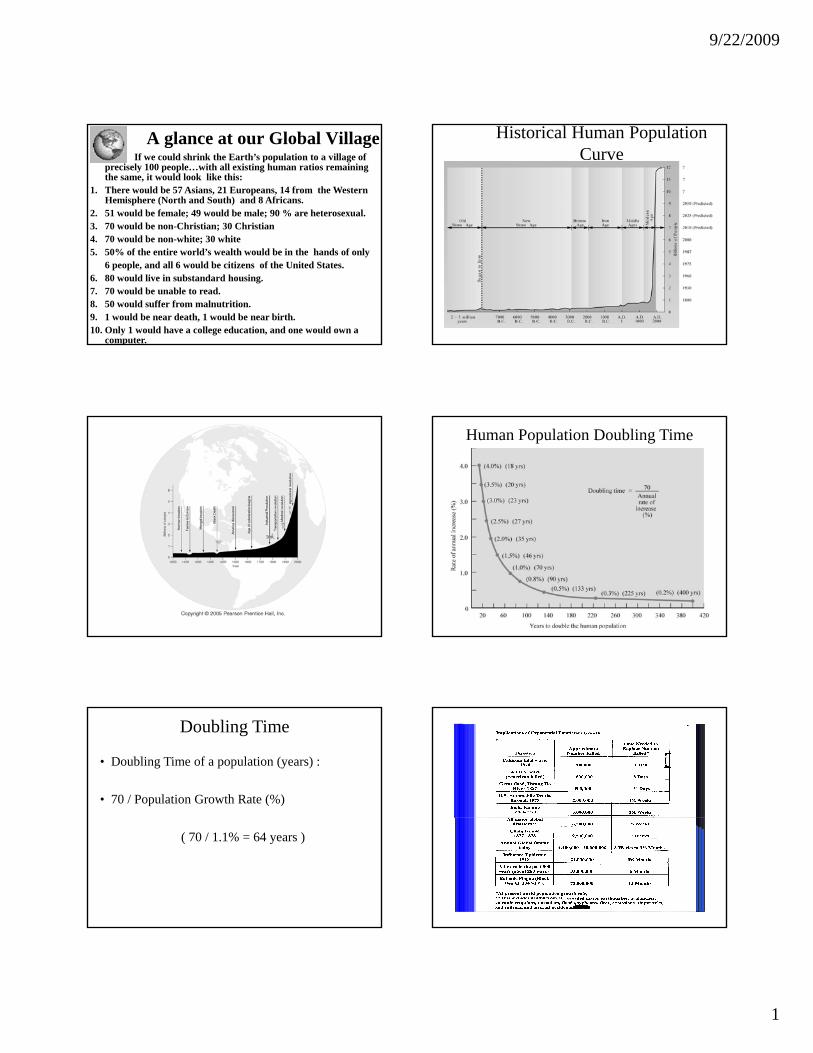
Historical Human Population Curve
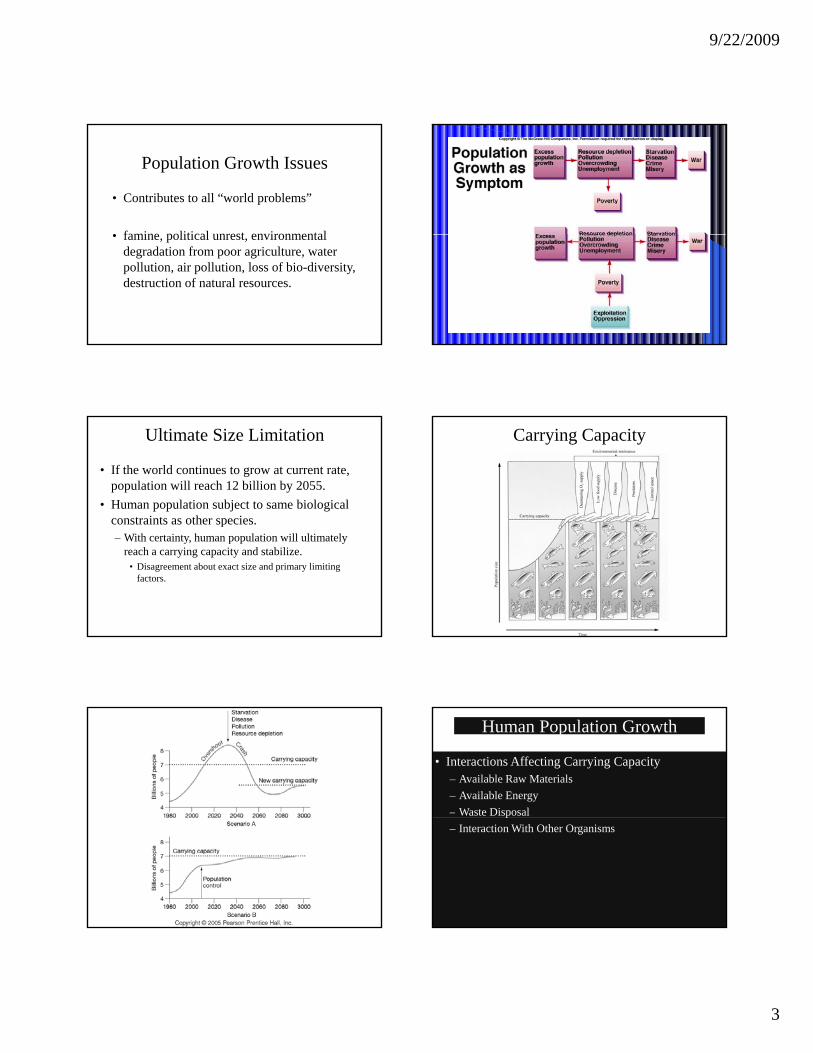
Human Population Doubling Time
Doubling Time
• Doubling Time of a population (years) :
• 70 / Population Growth Rate (%)
( 70 / 1.1% = 64 years )

9/22/2009
2
Chapter 4The Human Population Challenge
• Population Trends - Projected to have 7 billion people by the year 2010.
• Most of the increase will be in Africa, Asia, and Latin America.
• Already have 82% of the worlds population, the lowest GNP, and the lowest “standard of living”
Growth in LDCs vs MDCs
9/22/2009
3
Population Growth Issues
• Contributes to all “world problems”
• famine political unrest environmental• famine, political unrest, environmental degradation from poor agriculture, water pollution, air pollution, loss of bio-diversity, destruction of natural resources.
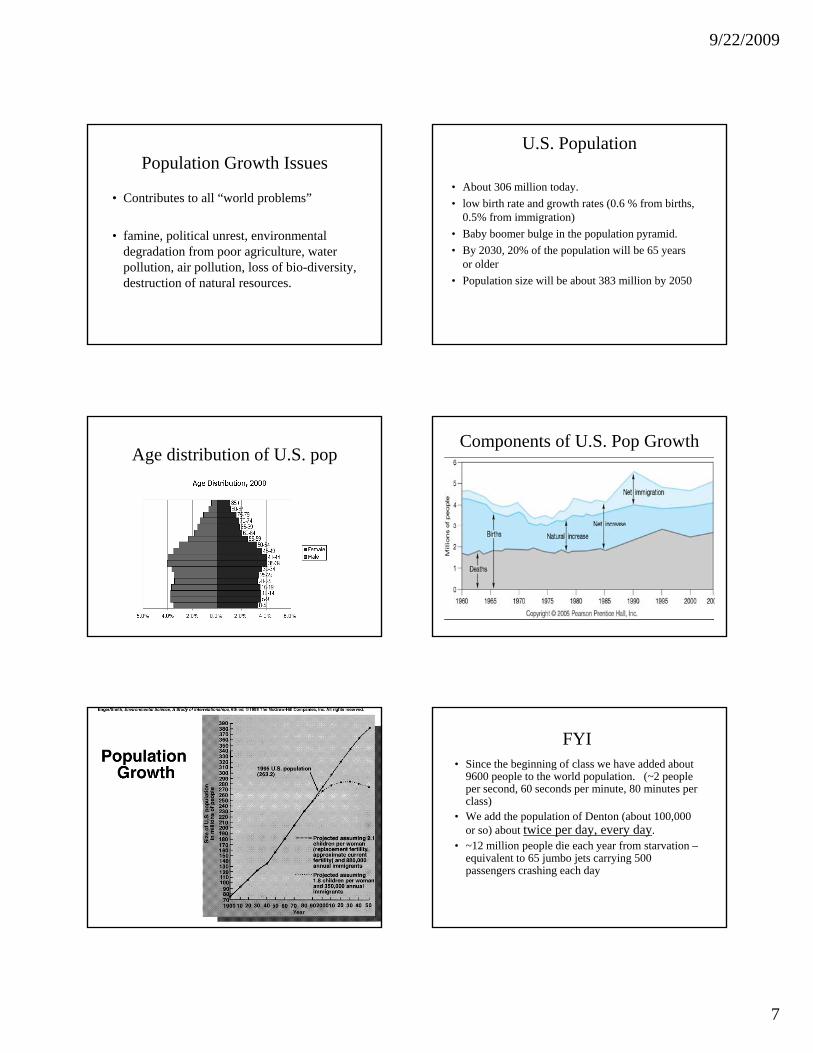
Ultimate Size Limitation
• If the world continues to grow at current rate, population will reach 12 billion by 2055.
• Human population subject to same biological constraints as other species.p– With certainty, human population will ultimately
reach a carrying capacity and stabilize.• Disagreement about exact size and primary limiting
factors.
Carrying Capacity
Human Population Growth
• Interactions Affecting Carrying Capacity– Available Raw Materials– Available Energy– Waste Disposalp– Interaction With Other Organisms

9/22/2009
4
Causes of Growth
• Birth rates and death rates• Growth rate should be controllable - Is
reducing the birth rate “better” thanreducing the birth rate better than increasing the death rate?
• Doesn’t work so easily - look at the demographics … most growth in least developed nations
Factors to consider
• Number of women having children• Number of children born to each woman• If total fertility rate (number of children• If total fertility rate (number of children
born in a woman’s life) is 2.1, the human population will stabilize and reach “zero population growth”
Factors to consider
• Stabilization will not happen immediately.• Death rate will decrease as people live
longerlonger• Initially, many young families will start
having children• May take from 20 to 100 years to stabilize.
Age Structure Profiles

9/22/2009
5
Demands are different among populations
• Developed countries demands are much higher than developing
• Developed countries demands are spread• Developed countries demands are spread around the world
• Developing countries export resources to developed countries
• Impacts = population size / area X degree of technological development
Social Factors Influence Human Population
• Humans are social animals who have freedom of choice.– People make decisions based on history, social
situations, ethical and religious beliefs, and personal desires.
– Biggest obstacle to controlling human population are province of philosophers, theologians, politicians, and sociologists.
Social Reasons
• Desired family size is determined by religion, tradition, social, and economic factors.
• Male-dominated cultures places high values on women having and raising children (usually when quite young) and little value on educating women.
Social Reasons
• Birth control only helps if people want to limit the size of their family
• Why want a large family?? y g yInfant mortality may be highHave children to support you in your old age (form of social security). More family members to earn income (especially in farming communities).
Political Factors
• Some countries have population goals or laws and may offer incentives (tax breaks, free birth control).)
• China has used more political control techniques than any other country and their population is still not stable.
Demographic Transition• High standard of living occurs in areas
where population growth is small.• Likewise, low standard of living occurs in
areas where population growth is high.p p g g• concept is that countries naturally go
through stages (based on European and North American experience)

9/22/2009
6
Demographic Transition• Stable population with high birth and death
rates• Improved conditions bring about rapid
growth as death rate falls• As development occurs economic and social
factors cause a decrease in birth rates• Eventually, birth and death rates become
equal
Demographic Transition• High standard of living occurs in areas
where population growth is small.• Likewise, low standard of living occurs in
areas where population growth is high.p p g g• Concept is that countries naturally go
through stages (based on European and North American experience)
Can all countries go through Demographic Transition??
• Those that already have did so experienced it when energy, natural resources, and land were abundant because the world population was low - safety valve
• Technological development is unlikely to keep up with the large population growth currently occurring
9/22/2009
7
Population Growth Issues
• Contributes to all “world problems”
• famine political unrest environmental• famine, political unrest, environmental degradation from poor agriculture, water pollution, air pollution, loss of bio-diversity, destruction of natural resources.
U.S. Population
• About 306 million today.• low birth rate and growth rates (0.6 % from births,
0.5% from immigration)• Baby boomer bulge in the population pyramid• Baby boomer bulge in the population pyramid.• By 2030, 20% of the population will be 65 years
or older• Population size will be about 383 million by 2050
Age distribution of U.S. popComponents of U.S. Pop Growth
FYI • Since the beginning of class we have added about
9600 people to the world population. (~2 people per second, 60 seconds per minute, 80 minutes per class)
• We add the population of Denton (about 100 000We add the population of Denton (about 100,000 or so) about twice per day, every day.
• ~12 million people die each year from starvation –equivalent to 65 jumbo jets carrying 500 passengers crashing each day

9/22/2009
8
World Hunger – Chapter 5
• 12 million people die each year from starvation –½ are children
• Equivalent to 65 jumbo jets with 500 passengers crashing each day – 33,000/day
• One in five people (~1.2 billion) consume less food than needed to stay health
• 10% of households in U.S. are hungry, on edge of hunger. Hunger affects 1 in 5 American children
Food Issues
• Under nutrition – One in seven people world wide regularly consume less food than they need to stay healthy ~ 1.2 billion –y y yAfrica, Asia, Latin America
• In U.S. 10% of households go hungry. - 1 in 5 American children are affected by hunger
Malnutrition
• Malnutrition results from a lack of protein and/or calories in diet
• Results in diseases like marasmus andResults in diseases like marasmus and kwashiokor that affect young children
• Result in brain damage and often death

9/22/2009
9
Three challenges
• How to end current suffering from food shortages
• How to meet demands from futureHow to meet demands from future population growth
• How to do these things without destroying our natural capital – sustainable agriculture ??????????????????????????????????????
Six Historical Strategies For Addressing World Hunger Sustainabily
1. Protecting existing soils from erosion and conversion– 24 billion metric tons of top soil lost per year
In a decade this = equivalent to ½ of all topsoil on all– In a decade this = equivalent to ½ of all topsoil on all the farms in U.S
– In the last 25 years 370 million acres of farm land was lost world wide by conversion to non- farm use = all the farm land in U.S
– Texas leads the nation in loss of productive farmlands and rangelands to development
Urban Sprawl
9/22/2009
10
Stategies
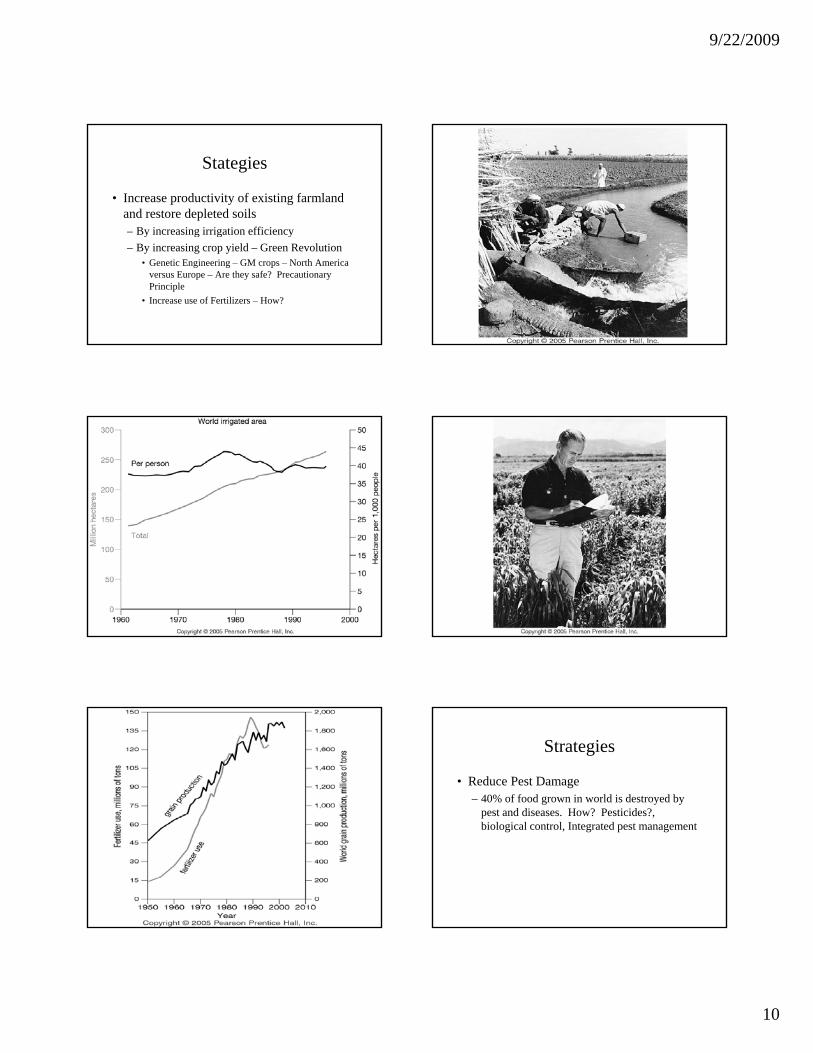
• Increase productivity of existing farmland and restore depleted soils– By increasing irrigation efficiencyBy increasing irrigation efficiency – By increasing crop yield – Green Revolution
• Genetic Engineering – GM crops – North America versus Europe – Are they safe? Precautionary Principle
• Increase use of Fertilizers – How?
Strategies
• Reduce Pest Damage– 40% of food grown in world is destroyed by
pest and diseases. How? Pesticides?, p ,biological control, Integrated pest management
9/22/2009
11
Strategies
• Improving food storage and distribution
• Developing new food sources– Improvement in livestock – Algae, Native Grazers-African Wildlife
• Expanding the land under cultivation– Bring marginal lands into production ?– Convert tropical forest, arid land and wetlands into
farmlands – Is this wise?
Sustainable Strategies to Eliminate Hunger
• Raise standard of living in LDC – How– Develop sustainable businesses
• Micro-business loans
• Stop conflicts and wars – How ?• Address Problems in LDCs caused by Free Trade
– Free trade has made it difficult for poor farmers in LDCs to compete with the farm industry in MDCs
– Experts advise for local production and local consumption – sustainable agriculture- self sufficiency
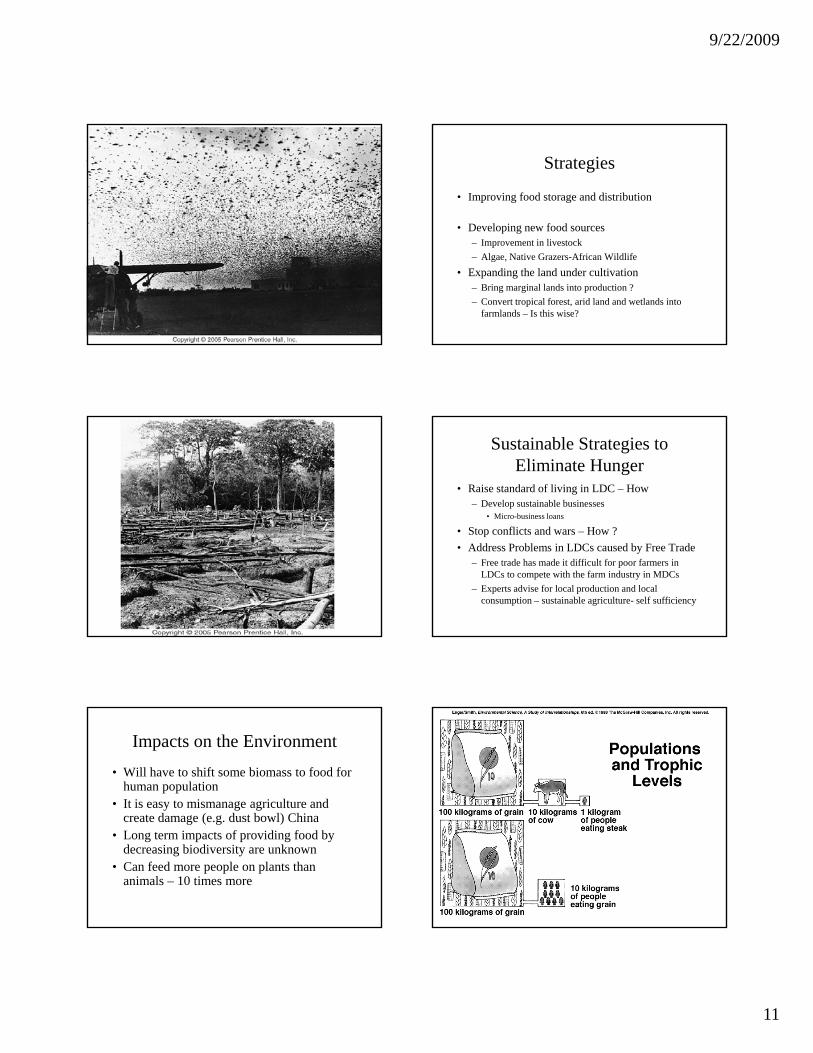
Impacts on the Environment• Will have to shift some biomass to food for
human population• It is easy to mismanage agriculture and
create damage (e g dust bowl) Chinacreate damage (e.g. dust bowl) China• Long term impacts of providing food by
decreasing biodiversity are unknown• Can feed more people on plants than
animals – 10 times more

9/22/2009
12
Top Related