


Languages
Pages
Legal

0
CEOs and the Product Market: When are Powerful CEOs Beneficial?
Minwen Li, Yao Lu and Gordon Phillips*
April 12, 2018
Abstract
We examine whether industry product market conditions are important in assessing the benefits
and costs of CEO power. We find that firms are more likely to have powerful CEOs in high
demand product markets where firms are facing entry threats. In these markets, investors react
more favorably to the announcements of granting more power to CEOs and CEO power is
associated with higher market value, sales growth, investment and advertising, and the
introduction of more new products. Our results remain significant when addressing the
endogeneity of CEO power by instrumenting CEO power with past non-CEO executive and
director sudden deaths.
* Comments are welcome. Minwen Li and Yao Lu are from Tsinghua University and can be contacted [email protected] and [email protected], respectively. Gordon Phillips is from the TuckSchool of Business at Dartmouth College and the NBER and can be contacted [email protected]. We have benefited from helpful comments and suggestions from ReneeAdams, Alex Edmans, Xavier Giroud, E. Han Kim, John Matsusaka, Holger Mueller, Oguzhan Ozbas, Jun Yang,seminar participants at the University of Iowa, University of Michigan, Hong Kong University, Renmin University,University of Delaware, University of Exeter, University of International Business and Economics, PekingUniversity, University of Pittsburg, Southwestern University of Finance and Economics, and conference participantsat the American Finance Association Meetings and China International Conference in Finance. Yao Luacknowledges support from Project 71722001 of National Science Foundation of China and Project2015THZWYY09 of Tsinghua University Humanities and Social Science Research Project Promotion Fund.Minwen Li acknowledges support from Project 71402078 of National Science Foundation of China and Project2013WKZD004 of Social Science Foundation of Tsinghua University. All errors and omissions are the authors’responsibility.
forthcoming: Journal of Financial and Quantitative Analysis

1
1. Introduction
CEOs exert a large influence over firms, as they have both explicit legal authority within the
firm and “soft” influence to direct corporate behavior. Recent empirical studies document that
powerful CEOs reduce managerial compensation efficiency, increase corporate fraud, and are
associated with lower firm profitability and shareholder value.1 With all these negative effects of
CEO power, why do firms grant power to CEOs? In an ideal world, the board would grant an
optimal level of power to the CEO, weighing costs and benefits specific to the firm
characteristics and the business conditions in which it operates as the model of Hermalin and
Weisbach (1998) suggests. Thus, despite the various costs of CEO power documented in the
literature, it is important to understand when and under what conditions CEO power becomes
more beneficial to firms.
In this paper, we explore how the potential benefits and costs of CEO power vary with
product market conditions. We first present an illustrative model to motivate our empirical tests
and results, where our main contributions are. The model illustrates how potentially valuable
investment opportunities with possible entrants into a firm’s product market may make it optimal
to delegate decision-making ability to the CEO giving her more power. The model is a
reduced-form version of a real option model based on the intuition of the strategic real option
model of Grenadier (2002). In Grenadier’s model, delay can be costly if the firm faces
competition for new projects. We apply this intuition to a CEO making a large project selection
decision such as a large-scale investment or an acquisition. The project has potential value and 1 See Bebchuk and Fried (2004), Faulkender and Yang (2010), Bebchuck, Cremers and Peyer (2011), Morse, Nanda, and Seru (2011), Landier, Sauvagnat, Sraer, and Thesmar (2013) and Khanna, Kim, and Lu (2015). Section 2 contains a full discussion of the related literature.
2
the firm faces potential competition. However, there is uncertainty about the potential benefits to
the firm as there are also private benefits to the investment that accrue to the CEO as is common
in many agency models. The granting of CEO power thus involves trading off the benefits of
exercising a good project earlier versus the cost of exercising a low quality project with private
benefits for the CEO. Costly delay may occur from competitors entering the market if the CEO
does not have sufficient power to exercise the project without gathering new data to justify the
project more formally. Thus, the benefit of CEO power is that the CEO can move more quickly and
take proactive investments to increase market value without consulting the board.
The model predicts that CEO power can become more beneficial for a firm operating in
product markets where there are positive investment opportunities and the firm faces high
potential entry threats. This prediction is consistent with the strategy advice given by Boston
Consulting Group on time-based competition where a quick response to new opportunities
enables firms to gain and retain market shares.2 Granting the CEO sufficient power to efficiently
lead the management team thus becomes important for staying abreast, or getting ahead, of the
changes and threats from rivals in product markets. In contrast, when a firm operates in a stable
product market with highly predictable cash flows, such benefits of CEO power through
managerial autonomy may be lower and dominated by the potential agency costs of exercising
low quality projects.
Empirically, we consider two key variables to measure the degree of entry threats and of
positive investment opportunities in product markets. The first variable, product market fluidity
2 See Lesser, Reeves, and Goulet (2013).
3
from Hoberg, Phillips, and Prabhala (2014), captures competitive threats from new entrants into
a firm’s existing product markets. By analyzing the texts of product descriptions from corporate
10-K filings and the relation to competitors entering the firm’s product markets, fluidity captures
to what degree the changes in rival and new firms’ product offerings are similar to a given firm.
It thus captures competitors entering into a firm’s product market.3 The second variable, vertical
demand shocks, is a measure of the changes to demand in a firm’s product market. We use the
change in product shipments for a firm’s downstream industries to capture exogenous demand
shocks for the firm.
Our measures of CEO power have both explicit and “soft” components that capture the
CEO’s ability to influence and direct corporate policies. We measure explicit influence by
whether the CEO chairs the board or is a founder. We capture “soft” influence by the CEO’s
internal connections to other executives and directors in the firm. Following previous studies, we
use the fraction of top four non-CEO executives and directors appointed during the current
CEO’s tenure. We construct indices of CEO power using both these measures.
We begin our empirical analysis with an event study on the announcement of the current
CEO being appointed as the chair of the board—thus expanding the explicit source of power for
the current CEO but holding CEO capability constant. We find the announcement returns are
significantly higher when a firm operates in a product market with higher demand and more
entry threats, suggesting this specific form of CEO power is valued more when there are more
3 Compared with the traditional competition measure (for example, the Herfindahl-Hirschman index), fluidity captures the dynamics of competition (time-based competition) as it is time-varying based on annual 10-K reports. Further, it focuses on products sold by firms that arise from underlying consumer preferences and demand.

4
investment opportunities and also more potential entrant competitors in the product market.
After presenting event study evidence, we examine the determinants of CEO power.
Consistent with the prediction of the model, we find CEOs have more power in product markets
where competitors are entering a firm’s product market and there are positive demand shocks.
We explore the determinants of CEO power granted through the dual role as the chair of the
board and also power from CEO explicit influence or “soft” power.
We then examine how CEO power influences firm outcomes, including the number of board
meetings, firm investment, advertising, new product introductions, sales growth, and firm value.
When examining the outcomes associated with high CEO power, we address endogeneity issues
of CEO power using an instrument based on past sudden director and non-CEO executive deaths
during CEO tenure. We use sudden deaths because they are outside of the CEO’s or board’s
control. Sudden death of a board member or executive allows the CEO to appoint a new
director/executive—thus increasing her appointment-based “soft” power, which may also lead to
an increase in her explicit influence.
The use of this instrument assumes that at any particular point of time, the CEO power
situation may not be optimal as there is a cost of firing an existing and hiring a new CEO. Thus,
the sudden death has the potential of allowing the firm to move back towards an optimum in
situations where the product market is changing rapidly and more CEO power is beneficial.
While it is not possible to directly test for the exclusion restriction, we postulate that the direct
channel of sudden deaths impacts firm value and outcomes through CEO power. Most
importantly, our results do not rely on this instrument as both the instrumented and OLS results
5
show that CEO power is negatively related to the number of board meetings after considering
differences in firm performance, board dependence, and other CEO characteristics. This result
suggests CEOs with high power are capable of expediting corporate decisions by reducing
communication and coordination costs among corporate leaders within the firm.
Our results also show that the influence of CEO power on firm growth and firm value
depends on product market conditions. The interactions between CEO power variables and our
key measures of product market conditions are significantly positively related to firms’
three-year sales growth and Tobin’s q, after controlling for firm fixed effects. The economic
magnitude is large. Tobin’s q increases 26.86% when moving from the lowest to the highest
measure of instrumented CEO power in markets with the highest demand and entry threats.
When examining potential channels for the higher firm value, we find firms with powerful CEOs
introduce more new products, invest and advertise more in product markets when their firms face
higher demand and more entry threats.
Our focus is on the actual proactive actions (such as invest, advertise, and introduce new
products) that CEOs may take versus providing incentives for CEOs not to engage in getting
private benefits of control (such as excessive compensation or perquisite consumption). There
can still be a cost of CEO power in monopolistic industries, where the CEO can take perquisites
or engage in other activities that may decrease shareholder value. Product market competition
has been documented as an important external governance mechanism to help mitigate these
problems. 4 Given this literature, we also examine how CEO power affects compensation
4 See Giroud and Mueller (2010) and Guadalupe and Wulf (2010).
6
efficiency measured by CEO pay-for-performance sensitivity as an additional mechanism that
powerful CEOs may influence.5 We find, similar to the literature, that the impact of CEO power
on pay-for-performance sensitivity is negative, consistent with powerful CEOs having agency
problems and reducing their compensation sensitivity to shareholder wealth.
On the benefits side, we also find a significant positive interaction effect for CEO power
and product market fluidity on CEO pay-for-shareholder wealth sensitivity. This suggests that the
negative impact of CEO power on CEO pay-for-performance sensitivity is offset in product
markets with high fluidity and thus higher future competition. This result combined with our
earlier results on the positive impact of CEO power on firm value in high fluidity / high demand
markets, and the results on proactive actions (investment, advertising and new product
introductions) by the firm in these markets, provide comprehensive evidence on where the bright
side for CEO power may be found.
We are cognizant of the possibility that powerful CEOs could be more capable, and have
more relevant experience, and may be more aligned with shareholder value through ownership.
These CEOs, regardless of their power, may better react to the challenges from product markets,
resulting in higher firm values. Our results are robust to controlling for a comprehensive list of
variables for CEO capability, industry experience and equity ownership, suggesting these CEO
characteristics, while important, do not explain our findings. Our results are robust to alternative
measures of product market conditions and CEO power. We also examine a firm’s industry life
cycle and find CEO power is more beneficial in industries with higher long-term growth.
5 Bebchuk and Fried (2004) and Morse, Nanda, and Seru (2011) show that powerful CEOs are more likely to rig their incentive contracts and reduce their pay form performance sensitivity.
7
Overall, we thus contribute to literature on CEO power by providing a more balanced view
of their power. Unlike previous studies that focus on the agency costs arising from CEO power,
we show how and when CEO power may have a “bright” side. Adams and Ferreira (2007) and
Duchin, Matsusaka, and Ozbas (2010) suggest that when outsiders’ cost of acquiring firm
information is high, granting CEOs more autonomy promotes better information sharing between
the board and CEO, which may lead to higher firm performance. We offer another important
reason for why CEO power can be beneficial: investment opportunities with entry threats in
product markets. When the product entry threats are greater and there is positive demand, CEO
power allows more timely and efficient reactions or proactive responses to changes in market
conditions. Our empirical analyses show that product market conditions are an important factor
influencing the tradeoffs of the benefits and costs of CEO power.
2. Related literature and theoretical framework
In this section, we provide a discussion of the related literature and develop a simple model
to illustrate how changes in the industry environment and new competition may make it optimal
to delegate decision-making ability to the CEO.
2.1 Related literature
Recent empirical studies show that powerful CEOs are subject to various agency problems.
As a result, they may be bad news for shareholders. For example, Bebchuk and Fried (2004),
Faulkender and Yang (2010), Bebchuck, Cremers and Peyer (2011), and Morse, Nanda, and Seru
(2011) show that powerful CEOs reduce managerial compensation efficiency. Khanna, Kim, and
Lu (2015) show that CEO power arising from appointment decisions increases the likelihood of

8
corporate fraud and reduces the detection of fraud. Grinstein and Hribar (2003) find that CEOs
with more power tend to engage in larger deals relative to the size of their own firms, and the
market responds more negatively to their acquisition announcements. Additionally, Bebchuck,
Cremers and Peyer (2011) and Landier, Sauvagnat, Sraer, and Thesmar (2013) show that firms
with powerful CEOs are associated with lower profitability and firm value.
Different than the well-documented negative effects of CEO power, Adams, Almeida, and
Ferreira (2005) find evidence potentially consistent with the costs and benefits approach of CEO
power as they document that powerful CEOs are associated with the best and the worst
performing firms.6
Existing theoretical literature has focused on trading off information acquisition costs and
monitoring the CEO in determining CEO power. This is particularly true when the CEO has the
incentive to strategically release private information to the board.7 Adams and Ferrierra (2007)
show that there are benefits in allowing the CEO more power by relaxing monitoring to induce
the CEO to share information with the board and make board advising more valuable. In their
model, the CEO faces a trade-off in disclosing information to the board: If she reveals her private
information, she receives better advice; however, an informed board will also monitor her more
intensively. Under such circumstances, having a less controlling board (in other word, a CEO
with more autonomy) becomes a way of partially committing to how information will be used,
and thereby helps information transmission between the board and CEO. Duchin, Matsusaka and
6 Sah and Stigliz (1986, 1991) also show that managerial power may be associated with both beneficial and deleterious effects. 7Adams and Ferreira (2007); Duchin, Matsusaka, and Ozbas (2010), Harris and Raviv (2008), and Song and Thakor (2006).

9
Ozbas (2010) also theoretically and empirically show that the effectiveness of outside directors
depends on the cost of acquiring information.
2.2 The model
We extend the cost and benefit analysis of directors ceding power to the CEO by examining
how the benefits of CEO power depend on industry conditions and the amount of new entrant
competition the firm faces. Our simple model is useful to illustrate a new strategic benefit of
delegating power to the CEO: The strategic competitive benefit arises from more powerful CEOs
being able to respond more quickly to product market opportunities and competitive threats. We
focus on the potential delay in project execution that may arise if the CEO has to consult with the
board and the board has to also gather information about the project. This delay may lead to a
strategic cost of allowing competitors to exploit new opportunities. Boards thus will trade off the
benefit of more powerful CEOs being able to respond more quickly to new opportunities versus
the costs of increased CEO power that may arise from selecting projects with potentially high
private benefits to the CEO and negative net present value to shareholders.8
We consider a CEO who has the opportunity to invest in a new project, such as a large scale
investment or merger, which will has the potential to increase firm value but also faces potential
competition. The new project can either be of high quality (I = H with probability πH) or low quality
(I = L with probability πL). Only high quality projects have a positive value to the firm such that
Vt(I|I=H) > 0 > Vt(I|I=L), where Vt is the value to shareholders. Low quality projects have a negative
8 These costs can include the tendency of CEOs to investing the firm’s assets in projects that maximize their own human capital and building empires that maximize their utility rather than firm value as in Jensen and Mackling (1976).

10
value to shareholders but can have positive value to the CEO given private benefits. We thus
assume Um,t(I|I=H) > Um,t(I|I=L)> 0, where Um,t is the value of the project to the manager including
its net impact on the value of CEO shareholdings and options, as well as other private benefits. We
assume the project has positive expected value, EV(I) > 0, without any additional information.
We consider a simple 3-date model to illustrate the strategic trade-off.
Date 0: The board decides how much power to delegate to the CEO. Let Pwr = a variable
which indicates whether decision-making power is delegated to the CEO. Pwr equals either 0 or 1,
with Pwr = 1 indicating the CEO has the ability to make a project investment decision without
board approval, and Pwr = 0 indicating the CEO has to get board approval and convince the board
through gathering data that the project is of high quality.
Date 1: Prior to potential project exercise, the CEO receives an early private signal Sm, about
the project’s value. The signal indicates with more precision whether the project is of high quality,
Sm = H, such that P(Sm=H|I=H) = a, or low quality, Sm = L, such that P(Sm=L|I=L) = a, with 1 ≥ a ≥ 1/2.
We assume the CEO’s private benefits are such that she will exercise the project even if the signal
is low when the CEO has power (Pwr = 1). We also assume that the private benefits are significant
enough that no incentive contract can be written with the CEO to mitigate this problem. Neither the
board nor outsiders can observe this signal. Thus, no contract can be written contingent on this
signal. If Pwr = 1, the CEO can implement the project and invest without the board’s approval at
date 1. If Pwr = 0, the CEO has to gather data about the project and the project exercise date is
delayed to date 2. Note that the CEO’s signal is not perfectly informative so that the information
that the board gathers after date 1 will also be used in making the investment decision if the

11
investment decision is delayed.9
Date 2: If Pwr = 0, the project will not yet have been exercised. In this case, the CEO will
make a presentation to the board and present data on the project. The board of directors also
provides information on the project value based on its advisory role. We let IC be equal to the cost
of gathering the information by both the CEO and the board. For simplicity, we assume this
information in aggregate, which would incorporate the signal, indicates with certainty whether or
not the project is high value.10 We can also let the date 2 probability of the high/low project not be
known with certainty. If the information and signal are less informative (smaller a), the more likely
the board will be to grant power to the CEO. We have solved for this case but exclude it for
expositional ease.
At date 2, the board has the veto power over projects such that only projects with high value
are accepted. At this time, competitors can also enter. We assume that there are potential entrants
that will enter at this time and take ∆ share of the profits, versus if the incumbent firm exercised the
investment at date 1.11 The ∆ share of profits to competitors captures the lost profits that the firm
would have had given a first mover advantage. The possibility of potential entrants varies by
industry and is captured by fi, the industry competitive fluidity in industry i.
9 In this case, πH’ and πL’ will be the ex post probabilities after the signal is incorporated and the board information is used. The ex post probabilities will be given by Bayes Rule. 10 With more precise signals, a, that will be subsequently used, and more valuable information gathered by the board, the less willing the board will be to delegate power to the CEO. In our simple solution, we have a = 1, thus the board will be less willing to delegate all else equal. In reality, the information cost will probably increase with the more precision so there will be an intermediate solution with lower information cost and less precise signals, if the board does not delegate. 11 We assume competitors only enter at this point for simplicity. The impact on profits can be thought of as the impact from additional entrants and thus the net loss of profits to competitors.
12
The delay in project exercise has a cost on two dimensions: A strategic cost and an
information gathering cost (IC). Our focus is on the strategic cost which arises as competitors may
exercise this project next period causing the project’s value to decrease as the project’s rents will
be shared with potential entrants next period. This cost corresponds to the strategic loss in real
options that causes firms to exercise projects early in the face of competition as has been modeled
by Grenadier (2002). The idea is that a monopolist will wait to exercise a real option given
continued uncertainty, while a firm in a competitive industry will exercise the option much earlier
given that competitors may exercise and capture part of the value. We assume that other firms can
only exercise the new project with a delay after one period, as they are potential entrants to the
product market of the focal incumbent firm.
The investment opportunity, I, thus can be summarized as follows:
EVt(I) > 0 (1)
Vt(I|Sm=H) > 0 > Vt (I|Sm=L) (2)
Um,t(I|Sm=H)>Um,t(I|Sm=L) > 0 (3)
Vt+1 (I| Sm=H) = Vt(I| Sm=H) - fi*∆ ; fi*∆ > 0 (4)
All of these values of the project are net of any costs of private benefits of control consumed by the
CEO. Equation 1 indicates the idea that the new project has a positive expected value to the firm,
even after the costs of private benefits of control consumed by the CEO are taken into account.
Equation 2 captures the idea that the new project has positive value to the firm only if the signal
indicates that it is high quality. Equation 3 states the utility of the CEO for the project is positive
even if the CEO receives a low signal. It captures the idea that the CEO will exercise the project,
given she enjoys private benefits, even if the signal is that the project is of low quality. Equation 4
captures the idea that there is a loss of value from waiting to exercise the project. We assume the

13
project still has a positive value if it is high quality but the loss from waiting is fi*∆ >0, where fi is
the industry competitive fluidity facing firm i and ∆ is the share of the profits from the project that
the other firms that also undertake the investment will gain. The loss to competitors will be
increasing in fluidity and also will be increasing with demand, as new opportunities will mean
more firms may enter the market.
From the prior equations, the expected value from exercising the project at date 1 if the signal
is low quality is (1- πH)*Vt (I|I=L) which is the expected loss to the shareholders as given private
benefits, the CEO will still exercise the project if the signal is low. The gain from giving the CEO
the power to exercise the project is avoiding the cost of delay, fi*∆, of exercising the project if it is
high quality plus the information cost, IC, of gathering the information by the CEO and the board.
The project delay cost will only occur if the high-quality project is exercised later, while the
information cost will be occurred even if not exercised.12 We thus have the probability the project
is high quality, πH, on the left hand side and (1- πH) on the right hand side.
Thus, the overall decision facing the board in granting power to the CEO can be expressed as:
Set Pwr = 1 if the expected cost of delay of the high quality project + the information cost (IC)
is greater than expected loss to shareholders from the low quality project. In an equation:
Set Pwr = 1 if πH*(fi*∆) + IC > -1*(πL)* Vt (I|Sm=L), otherwise set Pwr = 0. (5)
This framework can be extended to taking into account differences in the cost of gathering
information for the board, differing number of current competitors, different numbers of entrants,
the extent of value lost due to competitors entering and also to varying the degree of CEO power.
12 As before, we assume all low quality projects can be avoided at date 2. If some low quality projects are still probabilistically accepted at date 2, this will increase the incentives for the board to grant more power to the CEO.

14
We leave these extensions to future work to keep the model simple, as we view our main
contribution is to empirically identify whether the additional “real option” cost of competitors
entering the firm’s product market, fi*∆, is significant.
Note that the “real option” cost of competitors entering the firm’s product market depends on
two necessary product market conditions: entry threats proxied by competitive fluidity and
positive investment opportunities proxied by positive demand shocks, which differentiates our
study from previous literature that focuses on how product market competition affects agency
costs.
The benefit of this final condition of our framework is that empirically we can measure and
test the key components of equation 5. We measure the cost of delay, fi*∆, using a firm’s
competitive fluidity from Hoberg, Phillips, and Prabhala (2014), for fi, which measures the extent
competitors are entering into the firm’s product market. We use demand shocks to capture the
extent that there are positive investment opportunities (πH) and the attractiveness of the market.
Our key empirical predictions are the following:
Prediction 1: Firms will have CEOs that are more powerful in markets with positive
investment opportunities and entry threats.
Prediction 2: Powerful CEOs will be associated with higher firm growth and value in markets
with positive investment opportunities and entry threats.
We thus focus both on the granting of CEO power and also consider the subsequent
implications of having a more powerful CEO under different industry conditions. Given the model
explicitly shows that CEO power is endogenous, when we examine subsequent implications of

15
outcomes associated with having a powerful CEO, we instrument CEO power with past sudden
non-CEO executive and director deaths as described later in Section 6. The use of this instrument
assumes that at any particular point of time, the CEO power situation may not be optimal as there
is a cost of firing and hiring a new director in normal times. Thus, the sudden death has the
potential of moving the firm back towards an optimum in situations where the product market
has high investment opportunities and potential entrant threats and more CEO power is
beneficial.
3. Data and descriptive statistics
3.1 The sample
Our sample consists of S&P1500 firms in ExecuComp over the time period of 1999 to
2010.13 We exclude banks and regulated utilities from out sample. We match several databases
to construct the key variables used in our study. We construct CEO power and CEO
characteristics variables using ExecuComp, Riskmetrics, and BoardEx. Our product market
variables, fluidity, vertical demand shock, and industry life cycle, are based on the
Hoberg-Phillips Data Library14 and information from the Bureau of Economic Analysis (BEA)
website. Financial and accounting data are from Compustat. Stock return data are from CRSP.
We read news articles in the Factiva and Capital IQ database to construct variables on the
announcement returns of a CEO’s dual appointment as the chair of the board and director and
executive deaths. Detailed descriptions of our variables are provided in Appendix 1. The sample
begins in 1999 because the product shipment data based on the NAICS industry classifications
13 The number of firms covered in the sample is more than 1500 firms due to firm entry and exit. 14 The Hoberg-Phillips industry data web page is at: http://hobergphillips.usc.edu.
16
are available from the BEA from 1999.
3.2 CEO power variables
CEO power is defined as the capacity to influence and make corporate decisions. This
influence is likely to be strengthened by the CEO’s official positions in the firm or her internal
connections to other corporate leaders. Thus, we measure CEO power from both perspectives.
The first measure, CEO_Hard_Power, follows previous studies (Adams, Almeida, and Ferreira,
2005; Morse, Nanda, and Seru, 2011; Fracassi and Tate, 2012) and captures the explicit sources
of CEO power that arise from a CEO’s official positions. It is defined as the logged value of one
plus the sum of two components: whether the CEO chairs the board (CEO_Chair) or is a founder
(CEO_Founder). Following Bebchuk, Cremers, and Peyer (2011), CEO_Founder is an indicator
equal to one if a CEO was the CEO five years prior to the IPO date reported by Compustat or
five years prior to the first date when the firm appears in CRSP, and zero otherwise.
The second variable, CEO_Soft_Power, is constructed closely following the approach used
in Khanna, Kim, and Lu (2015). It measures the CEO’s internal connections to other top executives
and directors through appointment decisions. It is defined as the average of the fraction of top
four non-CEO executives (FTA) and directors (FDA) appointed during the current CEO’s tenure.
The general idea is that new directors will be more likely to agree with those that appointed them
or will have been selected for candidacy based on their likelihood of agreeing with the CEO’s
proposed direction that she is taking the company. Connectedness built through appointment
decisions increases what social psychologists refer to as social influence. It relies on norms of
reciprocity, liking, and social consensus to shape group decision-making processes (Cialdini,

17
1984) and, hence, facilitate the acquiescence or coordination required to engage in corporate
decisions. CEOs are heavily involved in recruiting, nominating, and appointing top executives
and also in deciding their compensation and relative positions. Thus, top executives are more
likely to share similar beliefs and visions with, and may be beholden to, the CEO who hired or
promoted them (Landier, Sauvagnat, Sraer, and Thesmar, 2013). CEOs also tend to be involved
in appointing board members either directly or indirectly through consultation with the
nominating committee (Shivdasani and Yermack, 1999; Fracassi and Tate, 2012); thus, directors
appointed during a CEO’s tenure may similarly be beholden to the CEO (Morse, Nanda, and
Seru, 2011; Coles, Daniel, and Naveen, 2014).15
The overall CEO power index, CEO_All_Power, is defined as the logged value of one plus
the sum of CEO_Chair, CEO_Founder, H_FTA, and H_FDA, where H_FTA (H_FDA) is equal
to one if FTA (FDA) is greater than 0.5 (0.5) (sample median), and zero otherwise. 16
CEO_All_Power can capture the CEO’s overall influence in the firm through both her explicit
positions and “soft” influence. Note that we do not include CEO ownership as part of CEO
power as CEO ownership also reflects incentives received by the CEO. Our results are robust to
controlling for CEO ownership and its interaction with product market index.
3.3 The product market environment variables
15 We do not consider connections built through prior network ties because such connections may have a less impact on a CEO’s internal power than those through appointment decisions. When an individual is appointed to a top executive position or recommended to the board by the CEO, she may feel a greater sense of loyalty to the CEO. Such a loyalty factor is likely to be weaker when the connection is through prior network ties. One may even argue sharing similar education or work experiences can breed a sense of competition that may not fit as comfortably with loyalty (Khanna, Kim, and Lu, 2015). 16 As a robustness check, we also construct the index using a principle component analysis approach.
18
We use two primary measures to capture a firm’s product market conditions. First, we use a
text-based measure of product market fluidity from Hoberg, Phillips, and Prabhala (2014),
Fluidity. It measures the change in a firm's product space due to moves made by competitors.
This measure is constructed using words in a firm’s product description section in its 10-K and
how they are similar to the change in rival firms’ product words from rival firms’ 10-Ks.
Specifically, fluidity is the “cosine” similarity between a firm’s own word usage vector and the
aggregate rival firms’ word change vector. Fluidity thus focuses on product space dynamics and
changes in products of rival firms and how these changes relate to a firm’s current product
offerings. Apple Inc. is a company that illustrates the benefits of the text-based method. After
Apple introduced the iPad, words including “tablet” appear in its 10-K. As rivals followed and
introduced tablet computers themselves, the usage of “tablet” by rival firms would increase,
resulting in a higher fluidity score for Apple.
Second, we use a measure of the changes to demand that a firm faces in its external product
market, Vdshock. Specifically, Vdshock measures the change in product shipments for a firm’s
downstream industries from the BEA website.17 We identify the downstream industries using the
BEA input-output matrix. These downstream changes in industry shipments are thus used to
capture demand shocks for the upstream industry that are exogenous to the firm. Higher Vdshock
thus means greater positive demand shocks facing the firm’s industry.
We construct two indicator variables, H_Fluidity and H_Vdshock, each equal to one if
fluidity or vertical demand shock is above the sample median. The composite index of a firm’s
17 The BEA industry shipments data are available from their website at: https://www.bea.gov/industry/gdpbyind_data.htm

19
product market condition, Prod_Mkt_Dynamics, is thus defined as the sum of the above
indicators. The idea for using positive shocks is that positive shocks imply more investment
opportunities and greater profits from investment and with these shocks the CEO has to take
actions that involve spending money, which may have to be raised externally but also generally,
as in the case of mergers and large investments involve board approval. Cutting spending or
decreasing capital expenditures does not involve board approval.
3.4 Summary statistics
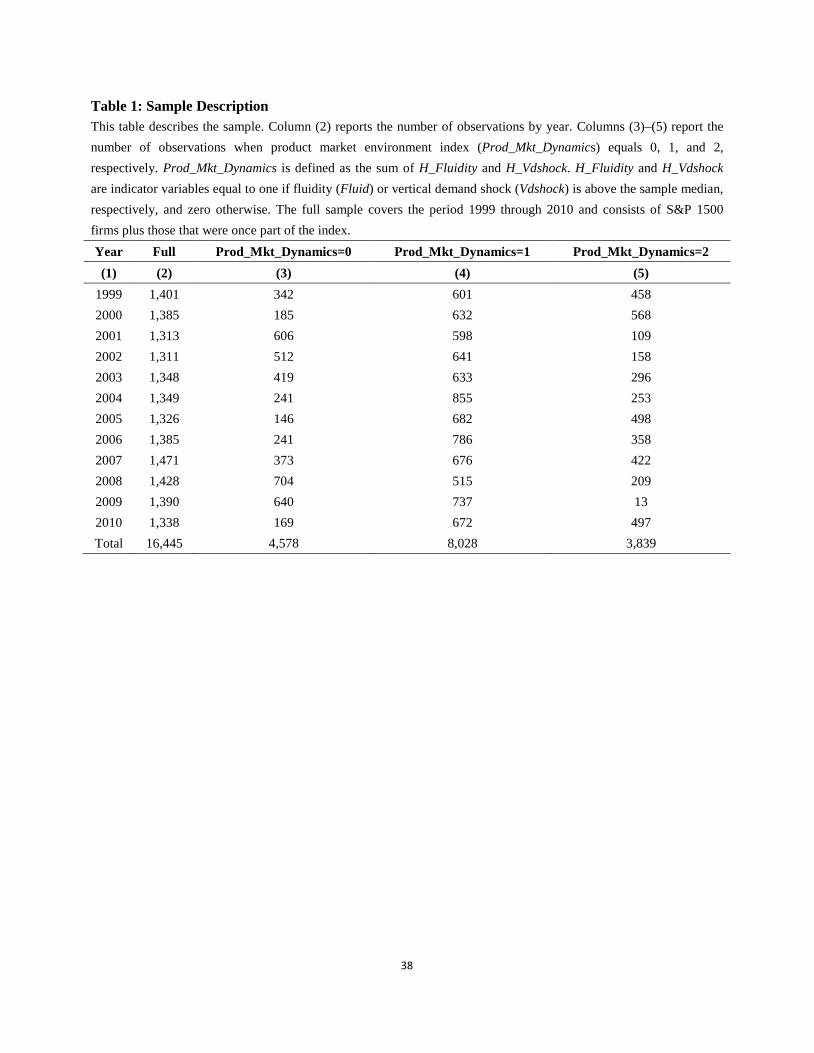
Table 1 presents the sample distribution by year for different levels of the product market
environment. After dropping the observations with missing values for all CEO power variables
or product market variables, our sample covers 16,445 firm-year observations. Column (2)
reports the number of observations in each year. Columns (3)–(5) report the number of
observations with Prod_Mkt_Dynamics equal to zero, one, or two, in each year, respectively.18
One can see from the table that the number of firms at the extremes (i.e. the groups with the
highest and lowest product market index) is smaller relative to the group in the middle.
Insert Table 1 here
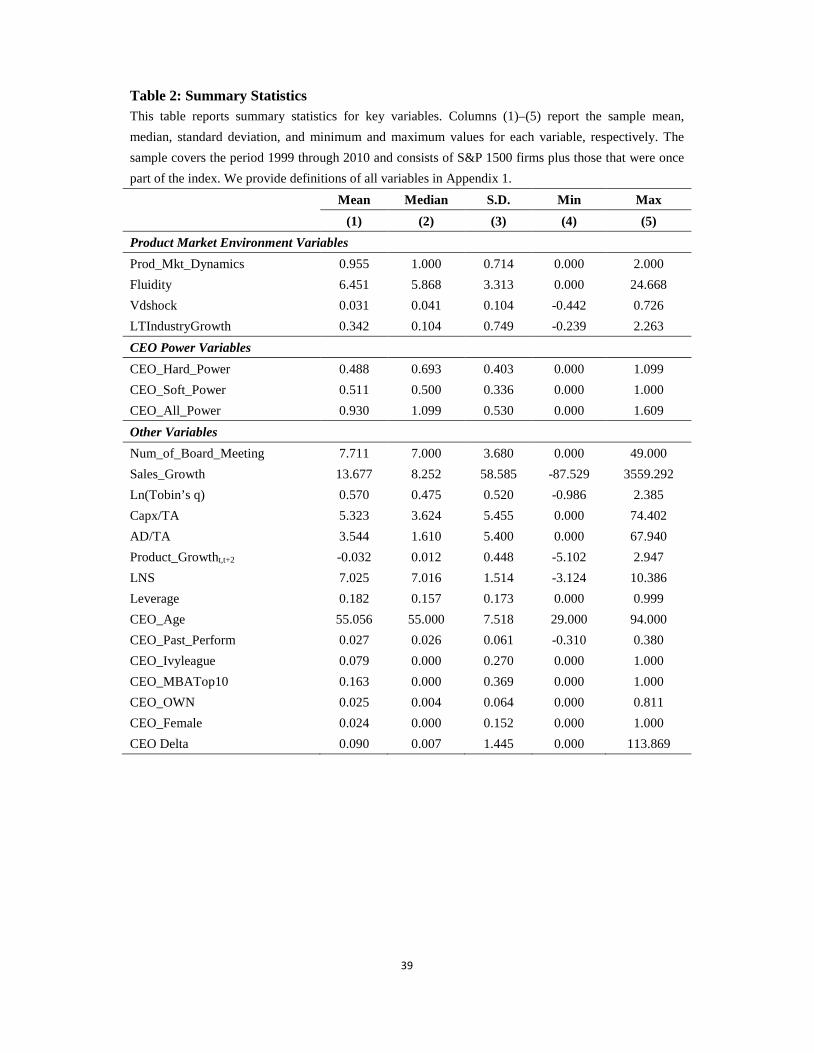
Table 2 reports summary statistics for the variables used in the main body of the paper. The
median of Prod_Mkt_Dynamics is one, suggesting that for the median firm in the sample, at least
one of the two product market environment measures has a value larger than the sample median.
The median of CEO_Hard_Power is 0.693, suggesting that the median value of the sum of
18 The sample with Prod_Mkt_Dynamics equal to two in 2009 has only 13 observations. This low number is a result of negative demand shocks from the financial crisis in 2008–2009.

20
CEO_Founder and CEO_Chair is one.19 Thus, the median CEO in our sample is either the
founder or chairs the board. The median of both measures of CEO “soft” power (i.e., FTA and
FDA) is 0.5, suggesting that 50% of non-CEO top four executives and board of directors are
appointed during the CEO tenure.
Insert Table 2 here
4. Announcement returns on the appointment of CEOs as the chair of the board
We begin our analyses by examining how changes in CEO power affect shareholder wealth
under different product market conditions. We estimate the abnormal returns on the
announcement date of appointing the current CEO to the dual role of chair of the board. We
focus on these announcements because they contain information on expanding the power scope
of the CEO while keeping all other CEO characteristics constant (since the CEO is the same
person before and after changing the scope of her/his power).20
To identify the events, we search for changes in the existing CEO title in the ExecuComp
dataset. 21 Then we extract the announcement dates by reading relevant news articles and
company public announcements from the Factiva and Capital IQ database. We exclude
19 CEO_Hard_Power is defined as the logged value of one plus the sum of two components: whether the CEO also chairs the board (CEO_Chair) or is a founder (CEO_Founder). Since ln(2) = 0.693, it suggests that the median value of the sum of CEO_Founder and CEO_Chair is one. 20 These announcements might also convey information about the board’s perception of the CEO’s ability. This is particularly true during the succession process when the new CEO pass the “probationary” period and is thereby “promoted” to the chairperson. We address this concern by controlling for a variety of CEO and firm characteristics (e.g., CEO education and past performance as proxies for CEO capability and firm size as a proxy for information asymmetry) in later regression analysis. 21 There are a significant amount of data errors regarding the description of executive titles in the ExecuComp database. We verify such information by reading related news articles and public announcements in Factiva and Capital IQ.
21
announcements that also contain information on appointing other executives or directors,
corporate earnings, or mergers and acquisitions, and cases in which an earnings report is released
during the same month. Our final sample is composed of 260 appointment announcements with
non-missing product market environment information. 22 The announcement-day abnormal
returns are estimated using the market model with the equal- or value-weighted market index
(Brown and Warner, 1985). The estimation window for the market beta covers (-256, -6) trading
days relative to the announcement date.
Insert Table 3 here
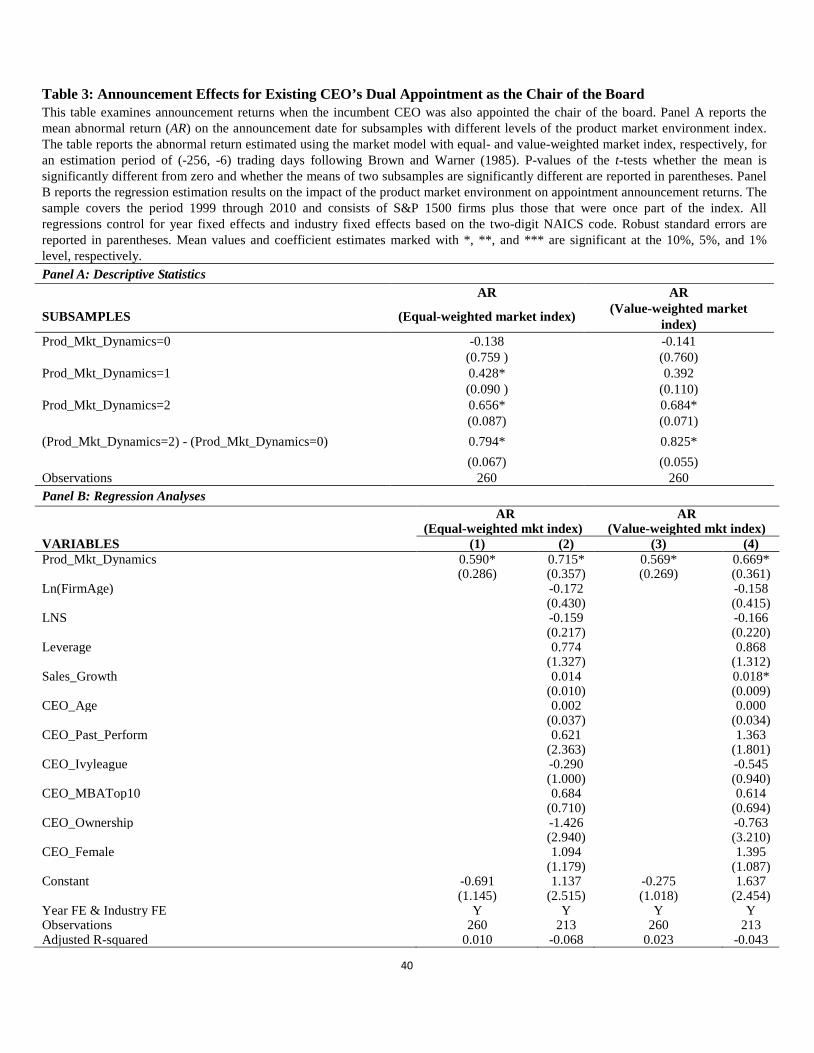
Panel A of Table 3 reports the mean abnormal returns for subsamples with different levels of
the product market index. First, the mean abnormal returns monotonically increase with the
product market index regardless of whether the abnormal returns are estimated based on the
equal- or value-weighed stock market index. In addition, the differences in the magnitude of
announcement returns between the high and low product market environment sample are striking.
The mean announcement-day abnormal return estimated using the equal-weighted
(value-weighted) market index is 0.66 (0.68) for firms with the highest product market
environment index and -0.14 (-0.14) for firms with the lowest product market environment
index.
Since firms under different product markets may be associated with different characteristics,
22 The final sample is relatively small mainly because Factiva and Capital IQ do not provide complete information on CEO dual appointments. In particular, CEO appointment announcements of smaller companies are less likely to be published in the news. Our event study results, therefore, apply mostly to larger listed companies. Since these companies are less subject to information asymmetry, it helps alleviate the concern that significant positive announcement returns associated with CEO dual appointments in dynamic, competitive product markets are driven by new information on CEO “perceived” ability.

22
in Panel B we control for various firm characteristics (firm size, age, leverage, and sales growth
prior to the announcement date), CEO characteristics (CEO age, gender, past performance,
education, and ownership), and industry and year fixed effects in regression analyses.23 Our
results are robust to these controls. Taken together, the event study results suggest that granting
the existing CEO more power through dual appointments as the chair of the board are associated
with greater shareholder value only when the firm operates in a product market with high
positive demand shocks and more entry threats.
5. Determinants of CEO power
In this section, we examine the determinants of granting CEO power inside the firm. We
specifically test whether firms allocate more power to CEOs in higher demand product markets
where firms face more entry threats (Prediction 1 of our model). Table 4 presents the results. All
firm-level independent variables are lagged one year to alleviate reverse causality. We include
both firm and year fixed effects in remaining analyses to control for time-invariant firm and year
factors. To address the concern on within-firm auto-correlation, we cluster the standard errors at
the firm level.
Insert Table 4 here
The results in Table 4 confirm our first empirical prediction. The result in Column (1) shows
that firms in general allocate more power to CEOs in product markets with more entry threats
and increasing demand. We then separate the CEO power index into “soft” power and hard
power, and examine the determinants of each component. The results in Columns (2) and (3)
23 We control for these firm and CEO characteristics throughout the paper in remaining regression analyses.
23
confirm the finding in Column (1), showing significant impacts of product market variables on
the decision of giving CEO both more “soft” and hard power.
Given our previous finding that granting the existing CEO the dual role of chair of the board
increases shareholder wealth in rapidly changing product markets, we examine the impact of
product market condition on such appointment decisions. The results reported in Column (4)
show that firms are more likely to appoint the current CEO as the chair of the board in product
markets with more entry threats and increasing demand.
We find that firms with higher past sales growth are likely to grant the CEO more power
in influencing the appointment decisions of directors and top executives, consistent with the
Hermalin and Weisbach (1998) model that CEOs with better performance possess a higher
bargaining power when negotiating with the board. Older firms have a tendency of allocating
less power to the CEO, as they have more mature (sophisticated) organization structures and
predictable cash flows, thereby demanding less managerial discretion. Older CEOs are
associated with higher level of power, which could be explained either by the fact that they are
more experienced or by their higher tendency of managerial entrenchment. CEOs with higher
equity incentives tend to have higher measures of hard and “soft” CEO power, which could be
explained by the fact that their interests are more aligned with shareholders, making the board
more comfortable with granting more power to the CEO, or simply by the fact that greater voting
power provides more control rights.
24
6. CEO power and subsequent outcomes
In this section, we examine the association between CEO power, board meetings and
subsequent firm sales growth rate, firm value and economic actions. We present both OLS
results and instrumental variable results, where our instruments are past sudden executive and
director deaths.
Given the model and empirical results discussed before explicitly show that CEO power is
endogenous, we instrument CEO power with past sudden executive and director deaths, when we
examine subsequent implications of outcomes associated with having a powerful CEO. The
instrumental variables are Past_Dir_Death and Past_Exe_Death. Past_Dir_Death
(Past_Exe_Death) is the number of non-CEO directors (top four non-CEO executives) who left
their positions due to sudden deaths during the current CEO’s tenure up to the previous year (i.e.,
year t-1).
Sudden executive or director deaths can directly increase CEO “soft” power since the CEO
can influence the appointment decisions of the incoming executive or director. In addition,
higher “soft” power can also help the CEO obtain more explicit influence. We use sudden deaths
as these death events are outside of the CEO’s or board’s control. To further increase the
possibility that these events are exogenous, we exclude suicides or deaths that may be related to
pressures from firm performance by searching media articles from Factiva on the cause of the
deaths. Besides, we focus on deaths in the previous years during the CEO tenure, since such
events are less likely to have a longer term impact on firm value other than through the channel
25
of CEO power.24 The use of this instrument assumes that at any particular point of time, the
CEO power situation may not be optimal as there is a cost of firing and hiring a new executive or
director in normal times or an appointment in normal times (not after executive or director death)
may be related to CEO ability. Thus, the sudden death has the potential of moving the firm back
towards an optimum in situations where the product market is changing rapidly and more CEO
power is beneficial.
We incorporate the full sample of firm-year panel data rather than focusing on CEOs taking
the dual role of the chair of the board in Section 4.
6.1 CEO power and board meetings
An implication of our idea is that CEOs are subject to frictions from board oversight that
may slow down the decision-making process, but that powerful CEOs are less subject to these
frictions. Thus, CEO power can enhance efficiency by reducing these constraints. In particular,
differing opinions among directors may delay decisions. To test this hypothesis, we examine the
impact of CEO power on the number of board meetings.25
Insert Table 5 here
Column (1) of Table 5 reports the OLS results, and Columns (2)-(3) report instrumental
24 We exclude sudden executive or director deaths that happen in the concurrent year to ensure that the information asymmetry and search costs for the new candidate have already been resolved. Nguyen and Nielsen (2010) find an average four-day (-1,+2 day) accumulated abnormal return of 0.85% surrounding the unexpected death of an independent director. They attribute this effect to the information asymmetry and searching costs regarding the new candidate. We note that different than Nguyen and Nielsen (2010), our hypothesis is based on the long-term impact of sudden director deaths on firm value, which can be mitigated due to position replacement. 25 Information on the number of board meetings is available in ExecuComp only through 2005 with missing observations in 2006, as S&P stopped collecting the data in 2007. We hand-collect the number of board meetings data after 2005 from proxy statements.26 Please see Chapter 6, page 623–5 in Wooldridge (2002).
26
variable regression estimation results. Column (2) reports the first stage regression results.
Specifically we include past sudden executive or director deaths during the CEO’s tenure as the
instrumental variables predicting CEO power. The results show that CEO overall power is
positively related to past sudden deaths of executives or directors. The F-statistics of the joint
test of these lagged sudden deaths is well above 10, suggesting that these variables are valid
instruments for CEO power. Column (3) reports the second stage regression results.
Both results show CEO power is significantly negatively related to the number of board
meetings. The OLS results are subject to the alternative explanations that a weak or disinterested
board, rather than powerful CEOs, leads to fewer board meetings. However, the IV result
reported suggests that CEO power can lead corporate decision-making less influenced by the
board.
Other control variables show that underperforming firms and firms with high leverage tend
to have more board meetings, which is consistent with the notion that board plays important roles
in dealing with firms’ financial troubles (Jensen, 1993; Vefeas, 1999). For example, financially
distressed firms are likely to call for more special board meetings. Firms with better educated
CEOs also tend to have more board meetings. Overall, the negative relation we find between
CEO power and board meetings is not driven by past firm performance, or CEO capability.
6.2 CEO power, product market conditions and firm performance
In this section, we test our second empirical prediction on firm performance by estimating
the interaction effect of CEO power and the product market environment index. Firm
performance is measured by sales growth and Tobin’s q. Tobin’s q is proxied by the market value
27
of common equity plus the book value of total liabilities divided by the book value of total assets.
Given two endogenous variables (CEO_All_Power and CEO_All_Power*Prod_Mkt_Dynamics)
in this analysis, following Wooldridge (2002), 26 we obtain a second instrument for the
endogenous interaction variable using the predicted value of CEO_All_Power interacted with the
exogenous variable Prod_Mkt_Dynamics. Table 6 presents the results.
Insert Table 6 here
Inspection of Table 6 shows that the interaction between CEO power and the product
market environment index has a positive association with both firm growth and firm value
regardless of using the OLS or the IV estimation. In Table 7, we compute the economic effects of
the product market interaction for both sales growth and Tobin’s q for different product market
environments using the estimated coefficients of the IV regression results of Table 6.
Insert Table 7 here
We find that the predicted Tobin’s q increases 21.14% as we move from the least demand
and entry threat product market environment, (Prod_Mkt_Dynamics = 0), to the highest demand
and entry threat product market environment, (Prod_Mkt_Dynamics = 2), with instrumented
CEO overall power at the highest level and all other variables at their sample medians.
Analogously, when we consider high demand and entry threat product markets, moving from the
lowest overall CEO power to the highest overall CEO power, the predicted Tobin’s q increases
26.86%.
6.3 CEO power, product market conditions and performance-related activities
26 Please see Chapter 6, page 623–5 in Wooldridge (2002).
28
Given that CEO power is more beneficial in product markets with high demand and entry
threats, we ask what are the potential channels though which powerful CEOs can stimulate
growth and hence create value in these markets. We answer this question by examining CEO
power and product market environment interaction variables on investment, marketing and new
product introductions. These three activities are closely interrelated, reflecting the aggressiveness
of a firm’s pursuit of performance improvement. We measure corporate investment by capital
expenditures divided by total assets. Marketing activity is measured by advertising expenditures
divided by total assets. We measure new product introductions by following Hoberg and Phillips
(2010) and use the logarithmic growth in the number of words in the product description section
of a firm’s 10-K in subsequent years to capture future new product introductions,
Product_Growth. Given it takes time to introduce new products, we construct this variable over a
two-year horizon (during year t to t+2). Table 8 reports the results.
Insert Table 8 here
Both the OLS results and the second stage of instrumented regression results using the first
stage results reported in Column (3) of Table 6 show that all three measures of
performance-related activities are significantly higher when firms operating in product markets
with more positive demand shocks and entry threats have more powerful CEOs. It appears firms
pursue more proactive actions in the face of high demand and entry threats when the CEO has
more power.
6.4 Industry life cycle
Our product market environment index and its two components are all measured year by

29
year. Thus, they only capture a firm’s short-term product market environment. A firm’s long-term
product market environment, which critically depends on its industry life cycle, may also affect
the tradeoff between the benefits and costs of CEO power. In particular, firms operating in a
growing industry are likely to face more investment opportunities and higher entry threats than
those operating in a declining industry. We thus examine how CEO power and a firm’s industry
life cycle jointly affect firm value.
Our industry life cycle measure, LTIndustryGrowth, is based on the long-run growth of
industry product shipments during the period 1999–2010. Product shipment data taken from
BEA are expressed in 2011 dollars using industry price deflators. We calculate the change in
product shipments in real dollars. Since the industry life cycle measure is time invariant, we
estimate CEO-firm pair between regressions, in which we obtain one observation for each
CEO-firm pair by averaging the variables across the times-series to examine the cross-sectional
effects of CEO power.
Insert Table 9 here
The results in Table 9 show that the interaction between CEO power and industry life cycle
has a positive relation to Tobin’s q, after accounting for the endogeneity of CEO power. This
result supports the previous findings that having powerful CEOs in product markets with higher
investment opportunities and entry threats can enhance firm value. Thus, we provide evidence
that the results continue to hold when we examine long-term product market environment.
7. Product market conditions and agency costs of CEO power
Our focus of the channel through which product markets with more investment opportunities
30
and entry threat can enhance the benefits of CEO power is on the actual proactive actions (such as
invest, advertise, and introduce new products) that CEOs may take versus providing incentives for
CEOs not to engage in consuming private benefits of control (such as excessive compensation or
perquisite consumption). There can still be a cost of CEO power in monopolistic industries, where
the CEO can take perquisites or engage in other activities that may decrease shareholder value.
Product market competition has also been documented as an important external governance
mechanism to help mitigate these problems. 27 Given this literature, we also examine CEO
compensation efficiency measured by CEO pay-for-performance sensitivity as an additional
mechanism that powerful CEOs may influence.28 We focus just on fluidity as our measure of
competitive threats for this test, as the demand shock does not capture competition. We thus
examine the impact of CEO power and its interaction with industry fluidity and CEO
pay-for-performance (CEO Delta). We measure CEO Delta as the dollar change in wealth for a
percentage change in firm value scaled by compensation as suggested by Edmans, Gabaix, and
Landier (2009).29
Insert Table 10 here
Table 10 presents the results. Similar to the prior literature, we find that the impact of CEO
power on CEO delta is negative. Thus, powerful CEOs are associated with future reductions in the
27 See Giroud and Mueller (2010) and Guadalupe and Wulf (2010). 28 Bebchuk and Fried (2004) and Morse, Nanda, and Seru (2011) show that powerful CEOs are more likely to rig their incentive contracts and reduce their compensation efficiency. 29 Previous studies suggest two other ways to measure the pay-for-performance sensitivity: dollar change in wealth for a dollar change in firm value (Jensen and Murphy, 1990) or dollar change in wealth for a percentage change in firm value (Hall and Liebman, 1998). We use Edmans et al. (2009)’s compensation scaled wealth-performance sensitivity measure because, as they point out, it is independent of firm size, and thus comparable across firms and over time. It is downloaded from Edman’s website (http://faculty.london.edu/aedmans/data.html).
31
sensitivity to shareholder value, a result consistent with agency problems generated by CEO
power; namely powerful CEOs may capture their compensation committees. We also include an
interaction term between CEO power and product market fluidity. We find that this interaction term
has a significant positive coefficient in Column (2) thus offsetting the negative overall effect. This
result indicates that in product markets with high levels of fluidity and thus future competition, CEO
pay is more sensitive to shareholder wealth, suggesting CEO compensation is less captured by the
CEO. This finding implies that product markets with high level of fluidity can reduce the agency
costs associated with CEO power consistent with also giving CEOs incentives to take proactive
actions on investment, advertising and new product introductions as we document earlier.
These results combined with our earlier results on the positive impact of CEO power on firm
value in high fluidity / high demand markets, and the results on proactive actions (investment,
advertising and new product introductions) by the firm in these markets, provide comprehensive
evidence on the costs and benefits of CEO power.
8. Robustness tests
We conduct multiple robustness tests that we describe in this section. All results are
contained in tables in Appendix 2.
Alternative measures of CEO power. To address the concern that each component of our
CEO power variable may be correlated or may not equally affect the CEO’s overall influence in
the firm, we construct an alternative CEO power index based on the principal component
analysis. Second, since all components of our CEO power measure are correlated with CEO
32
tenure,30 to partial out CEO tenure effects, we regress the overall CEO power index on CEO
tenure and use the residuals as the measure of CEO power. We present these results in Columns
(1)-(4) of Table A.2.1 in Appendix 2. The results are robust to all these alternative measures of
CEO power variables.
Different than the other sources of CEO power (i.e., founder status or connections to other
leaders through appointment decisions) that accumulate over time, being appointed to the dual
role of chair of the board involves a discrete change in CEO power that allows us to compare
firm performance before and after such an appointment. Thus, we examine the separate impact of
CEO_Chair on firm performance. We use the same IVs, since past executive and director deaths
can automatically increase CEO “soft” power, which may also make the CEO more likely to be
appointed as the chair of the board (hard power). Our results show that appointing the current
CEO also as the chair of the board leads to an increase in firm value in product markets with
high demand and entry threat.
Alternative measure of product market entry threats. An alternative way of measuring
product market entry threat is the Herfindahl-Hirschman index (HHI). We replace the current
product market fluidity measure by Low_HHI, where Low_HHI is defined as an indicator if the
HHI is below the median of the sample, suggesting a more competitive product market, which
will have more potential entrants. HHI is defined as the sum of the squared market shares of
firms in each industry based on three-digit SIC codes or based on Hoberg-Phillips text based
HHI (Hoberg and Phillips, 2016). We present these results in Appendix 2, Table A.2.2. The
30 Additionally, Graham, Harvey and Puri (2015) show that CEOs with longer tenure tend to hold more power and delegate less financial decisions to others.
33
results are robust to these alternative measures of product market conditions.
9. Conclusions
We examine under what conditions powerful CEOs may be beneficial to the firm. We show
that the external product market influences the tradeoff between the benefits and costs of CEO
power. Using a simple model, we illustrate how having more powerful CEOs may be valuable to
the firm when it needs to respond quickly to investment opportunities and also faces entry
threats.
Empirically, we find that the announcement of granting more power to the current CEO by
appointing her to the additional position of the chair of the board is associated with significantly
higher abnormal returns when a firm operates in markets with increased demand and entry
threats. Firms operating in these markets also have a higher sales growth and Tobin’s q when the
CEO has more power. We investigate why powerful CEOs may increase sales growth and add
value and find that new product introductions, investment, and advertising all increase with CEO
power in high demand markets where the firm is facing entry threats. We also find that CEO
power is negatively related to the number of board meetings, suggesting that powerful CEOs
make corporate decisions with lower communication and coordination costs. Our results also
show that CEO pay is more sensitive to shareholder wealth in markets with high fluidity and
potential competitors. Our results throughout remain significant when addressing the
endogeneity of CEO power by instrumenting CEO power with past non-CEO executive and
director sudden deaths.
Overall, our findings suggest CEO power is beneficial in markets with increased demand

34
and entry threats by enabling CEOs to react promptly to changing product markets. We show that
the positive effects of CEO power are not limited to explicit sources of CEO power such as
whether the CEO chairs the board or is a founder, but also extend to “soft” sources arising from
the CEO’s connections to key officers and board members through appointment decisions.
Overall, our findings imply that the product market environment plays an important role in
influencing whether CEO power is beneficial for the firm.
35
References
Adams, R. B., H. Almeida, and D. Ferreira. 2005. Powerful CEOs and their impact on corporate
performance. Review of Financial Studies 18: 1403–32.
Adams, R. B., and D. Ferreira. 2007. A theory of friendly boards. Journal of Finance 62: 217–50.
Bebchuk, L. A., and J. M. Fried. 2004. Pay without Performance: The Unfulfilled Promise of Executive
Compensation (Harvard University Press, Cambridge, MA).
Bebchuk, L. A., M. Cremers, and U. Peyer. 2011. The CEO pay slice. Journal of Financial Economics 102:
199–221.
Brown, S. J., and J. B. Warner. 1985. Using daily stock returns: The case of event studies. Journal of
Financial Economics 14: 3–31.
Chhaochharia, Vidhi, Yaniv Grinstein, Gustavo Grullon and Roni Michaely. 2017. Product Market
Competition and Internal Governance: Evidence from the Sarbanes–Oxley Act. Management Science
Forthcoming.
Cialdini, R. B., 1984. Principles of automatic influence, in J. Jacoby & S. Craig, eds.: Personal Influence:
Theory, research, and practice (Lexington, MA: Heath).
Coles, J. L., N. D. Daniel, and L. Naveen. 2014. Co-opted boards. Review of Financial Studies 27:
1751–96.
Duchin, Ran, John G. Matsusaka, and Oguzhan Ozbas. 2010. When are outside directors effective? Journal
of Financial Economics 96:195–214.
Edmans, Alex, Xavier Gabaix, and Augustin Landier. 2009. A multiplicative model of optimal CEO
incentives in market equilibrium. Review of Financial Studies 22: 4881-4917.
Faulkender, Michael, and Jun Yang. 2010. Inside the black box: The role and composition of
compensation peer groups. Journal of Financial Economics 96: 257–70.
Fracassi, C., and G. Tate. 2012. External networking and internal firm governance. Journal of Finance 67:
153–94.
Giroud, X., and H. M. Mueller. 2010. Does corporate governance matter in competitive industries? Journal
of Financial Economics 95: 312–31.
36
Giroud, X., and H. M. Mueller. 2011. Corporate governance, product market competition, and equity prices.
Journal of Finance 66: 563–600.
Graham, John R., Campbell R. Harvey, and Manju Puri. 2015. Capital allocation and delegation of
decision-making authority. Journal of Financial Economics 115: 449–70.
Grenadier, Steven R. 2002. Option exercise games: An application to the equilibrium investment strategy of
firms. Review of Financial Studies 15: 691–721.
Grinstein, Yaniv and Paul Hribar. 2003. CEO compensation and incentives: Evidence from M&A bonuses.
Journal of Financial Economics 73: 119–43.
Guadalupe, M., and J. Wulf. 2010. The flattening firm and product market competition: The effect of trade
liberalization. American Economic Journal: Applied Economics 2: 105–27.
Hall, Brian, and Jeffrey B. Liebman. 1998. Are CEOs really paid like bureaucrats? Quarterly Journal of
Economics 113: 653–91.
Harris, Milton, and Artur Raviv. 2008. A theory of board control and size. Review of Financial Studies 21:
1797–832.
Hermalin, B. E., and M. S. Weisbach. 1998. Endogenously chosen boards of directors and their
monitoring of the CEO. American Economic Review 88: 96–118.
Hoberg, G., and G. Phillips. 2010. Product market synergies in mergers and acquisitions: A text based
analysis. Review of Financial Studies 23: 3773–811.
————. 2016. Text-Based network industries and endogenous product differentiation. Journal of
Political Economy 124: 1423–65
Hoberg, G., G. Phillips, and N. Prabhala. 2014. Product market threats, payouts, and financial flexibility.
Journal of Finance 69: 293–324.
Jensen, Michael C. 1993. The modern industrial revolution, exit, and the failure of internal control systems.
Journal of Finance 48: 831–80.
Jensen, Michael C., and William H. Meckling. 1976. Theory of the firm: Managerial behavior, agency
costs and ownership structure. Journal of Financial Economics 3:305–60.
Jensen, Michael C. and Kevin J. Murphy. 1990. Performance pay and top-management incentives.
Journal of Political Economy 98: 225–64.
37
Khanna, V., E. Han Kim, and Y. Lu. 2015. CEO connectedness and corporate frauds. Journal of Finance
70: 1203–52.
Kim, E. H., and Y. Lu. 2017. Executive suite independence: Is it related to board independence?
Management Science Forthcoming.
Kim, E. H., and Y. Lu. 2011. CEO ownership, external governance, and risk-taking. Journal of Financial
Economics 102: 272–92.
Landier, A., J. Sauvagnat, D. Sraer, and D. Thesmar. 2013. Bottom-up corporate governance. Review of
Finance 17: 161–201.
Lesser, Rich, Martin Reeves, and Kaelin Goulet. 2013. BCG classics revisited: Time-based competition.
Boston Consulting Group Publications.
Morse, A., V. Nanda, and A. Seru. 2011. Are incentive contracts rigged by powerful CEOs? Journal of
Finance 66: 1779–821.
Nguyen, Bang Dang, and Kasper Meisner Nielsen. 2010. The value of independent directors: Evidence from
sudden deaths. Journal of Financial Economics 98: 550–67.
Sah, R. K., and J. E. Stiglitz. 1986. The architecture of economic systems: Hierarchies and polyarchies.
American Economic Review 76: 716–27.
————. 1991. The quality of managers in centralized versus decentralized organizations. The
Quarterly Journal of Economics 106: 289–95.
Shivdasani, A., and D., Yermack. 1999. CEO involvement in the selection of new board members: An
empirical analysis. Journal of Finance 54: 1829–53.
Song, Fenghua, and Anjan V. Thakor. 2006. Information control, career concerns, and corporate
governance. Journal of Finance 61: 1845–96.
Vefeas, Nikos. 1999. Board meeting frequency and firm performance. Journal of Financial Economics 53:
113–42.
Wooldridge, J. 2002. Econometric Analysis of Cross Section and Panel Data (MIT Press, Cambridge,
MA).
38
Table 1: Sample Description This table describes the sample. Column (2) reports the number of observations by year. Columns (3)–(5) report the number of observations when product market environment index (Prod_Mkt_Dynamics) equals 0, 1, and 2, respectively. Prod_Mkt_Dynamics is defined as the sum of H_Fluidity and H_Vdshock. H_Fluidity and H_Vdshock are indicator variables equal to one if fluidity (Fluid) or vertical demand shock (Vdshock) is above the sample median, respectively, and zero otherwise. The full sample covers the period 1999 through 2010 and consists of S&P 1500 firms plus those that were once part of the index. Year Full Prod_Mkt_Dynamics=0 Prod_Mkt_Dynamics=1 Prod_Mkt_Dynamics=2 (1) (2) (3) (4) (5)
1999 1,401 342 601 458 2000 1,385 185 632 568 2001 1,313 606 598 109 2002 1,311 512 641 158 2003 1,348 419 633 296 2004 1,349 241 855 253 2005 1,326 146 682 498 2006 1,385 241 786 358 2007 1,471 373 676 422 2008 1,428 704 515 209 2009 1,390 640 737 13 2010 1,338 169 672 497 Total 16,445 4,578 8,028 3,839
39
Table 2: Summary Statistics This table reports summary statistics for key variables. Columns (1)–(5) report the sample mean, median, standard deviation, and minimum and maximum values for each variable, respectively. The sample covers the period 1999 through 2010 and consists of S&P 1500 firms plus those that were once part of the index. We provide definitions of all variables in Appendix 1.
Mean Median S.D. Min Max
(1) (2) (3) (4) (5) Product Market Environment Variables Prod_Mkt_Dynamics 0.955 1.000 0.714 0.000 2.000 Fluidity 6.451 5.868 3.313 0.000 24.668 Vdshock 0.031 0.041 0.104 -0.442 0.726 LTIndustryGrowth 0.342 0.104 0.749 -0.239 2.263 CEO Power Variables CEO_Hard_Power 0.488 0.693 0.403 0.000 1.099 CEO_Soft_Power 0.511 0.500 0.336 0.000 1.000 CEO_All_Power 0.930 1.099 0.530 0.000 1.609 Other Variables Num_of_Board_Meeting 7.711 7.000 3.680 0.000 49.000 Sales_Growth 13.677 8.252 58.585 -87.529 3559.292 Ln(Tobin’s q) 0.570 0.475 0.520 -0.986 2.385 Capx/TA 5.323 3.624 5.455 0.000 74.402 AD/TA 3.544 1.610 5.400 0.000 67.940 Product_Growtht,t+2 -0.032 0.012 0.448 -5.102 2.947 LNS 7.025 7.016 1.514 -3.124 10.386 Leverage 0.182 0.157 0.173 0.000 0.999 CEO_Age 55.056 55.000 7.518 29.000 94.000 CEO_Past_Perform 0.027 0.026 0.061 -0.310 0.380 CEO_Ivyleague 0.079 0.000 0.270 0.000 1.000 CEO_MBATop10 0.163 0.000 0.369 0.000 1.000 CEO_OWN 0.025 0.004 0.064 0.000 0.811 CEO_Female 0.024 0.000 0.152 0.000 1.000 CEO Delta 0.090 0.007 1.445 0.000 113.869
40
Table 3: Announcement Effects for Existing CEO’s Dual Appointment as the Chair of the Board This table examines announcement returns when the incumbent CEO was also appointed the chair of the board. Panel A reports the mean abnormal return (AR) on the announcement date for subsamples with different levels of the product market environment index. The table reports the abnormal return estimated using the market model with equal- and value-weighted market index, respectively, for an estimation period of (-256, -6) trading days following Brown and Warner (1985). P-values of the t-tests whether the mean is significantly different from zero and whether the means of two subsamples are significantly different are reported in parentheses. Panel B reports the regression estimation results on the impact of the product market environment on appointment announcement returns. The sample covers the period 1999 through 2010 and consists of S&P 1500 firms plus those that were once part of the index. All regressions control for year fixed effects and industry fixed effects based on the two-digit NAICS code. Robust standard errors are reported in parentheses. Mean values and coefficient estimates marked with *, **, and *** are significant at the 10%, 5%, and 1% level, respectively. Panel A: Descriptive Statistics
AR AR
SUBSAMPLES (Equal-weighted market index) (Value-weighted market index)
Prod_Mkt_Dynamics=0 -0.138 -0.141
(0.759 ) (0.760) Prod_Mkt_Dynamics=1 0.428* 0.392
(0.090 ) (0.110) Prod_Mkt_Dynamics=2 0.656* 0.684*
(0.087) (0.071) (Prod_Mkt_Dynamics=2) - (Prod_Mkt_Dynamics=0) 0.794* 0.825*
(0.067) (0.055) Observations 260 260 Panel B: Regression Analyses
AR AR
(Equal-weighted mkt index) (Value-weighted mkt index)
VARIABLES (1) (2) (3) (4) Prod_Mkt_Dynamics 0.590* 0.715* 0.569* 0.669*
(0.286) (0.357) (0.269) (0.361)
Ln(FirmAge)
-0.172
-0.158
(0.430)
(0.415)
LNS
-0.159
-0.166
(0.217)
(0.220)
Leverage
0.774
0.868
(1.327)
(1.312)
Sales_Growth
0.014
0.018*
(0.010)
(0.009)
CEO_Age
0.002
0.000
(0.037)
(0.034)
CEO_Past_Perform
0.621
1.363
(2.363)
(1.801)
CEO_Ivyleague
-0.290
-0.545
(1.000)
(0.940)
CEO_MBATop10
0.684
0.614
(0.710)
(0.694)
CEO_Ownership
-1.426
-0.763
(2.940)
(3.210)
CEO_Female
1.094
1.395
(1.179)
(1.087)
Constant -0.691 1.137 -0.275 1.637
(1.145) (2.515) (1.018) (2.454)
Year FE & Industry FE Y Y Y Y Observations 260 213 260 213 Adjusted R-squared 0.010 -0.068 0.023 -0.043
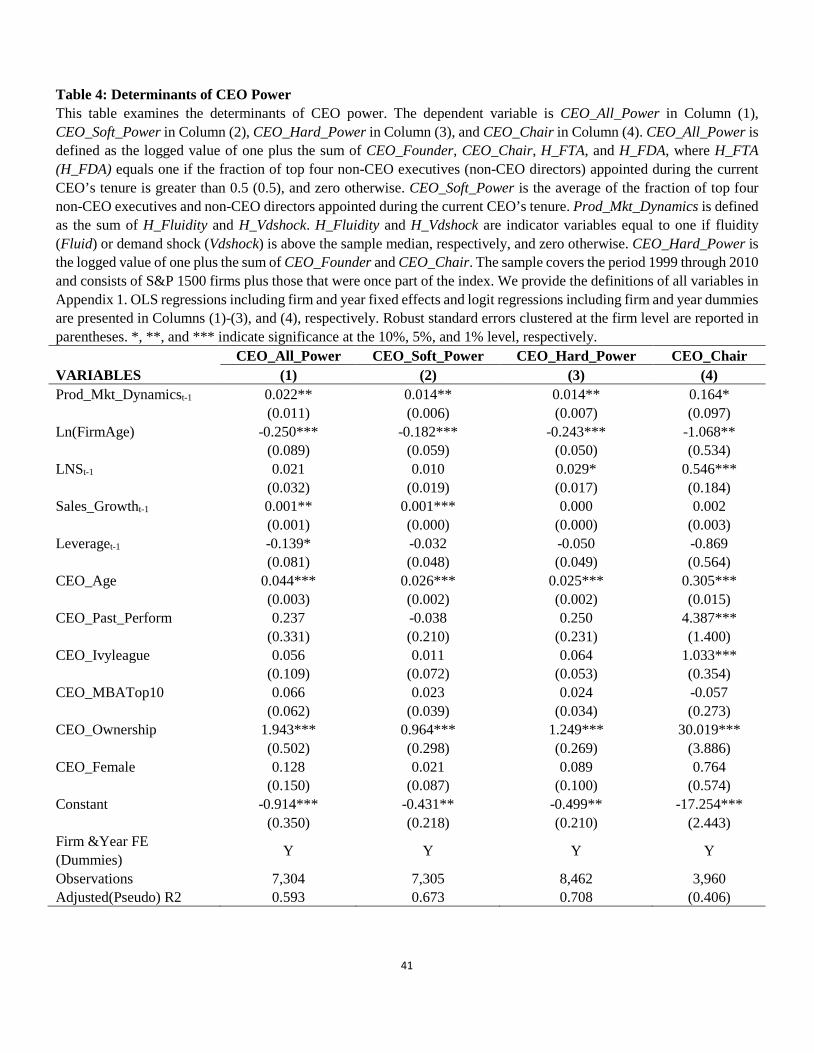
41
Table 4: Determinants of CEO Power This table examines the determinants of CEO power. The dependent variable is CEO_All_Power in Column (1), CEO_Soft_Power in Column (2), CEO_Hard_Power in Column (3), and CEO_Chair in Column (4). CEO_All_Power is defined as the logged value of one plus the sum of CEO_Founder, CEO_Chair, H_FTA, and H_FDA, where H_FTA (H_FDA) equals one if the fraction of top four non-CEO executives (non-CEO directors) appointed during the current CEO’s tenure is greater than 0.5 (0.5), and zero otherwise. CEO_Soft_Power is the average of the fraction of top four non-CEO executives and non-CEO directors appointed during the current CEO’s tenure. Prod_Mkt_Dynamics is defined as the sum of H_Fluidity and H_Vdshock. H_Fluidity and H_Vdshock are indicator variables equal to one if fluidity (Fluid) or demand shock (Vdshock) is above the sample median, respectively, and zero otherwise. CEO_Hard_Power is the logged value of one plus the sum of CEO_Founder and CEO_Chair. The sample covers the period 1999 through 2010 and consists of S&P 1500 firms plus those that were once part of the index. We provide the definitions of all variables in Appendix 1. OLS regressions including firm and year fixed effects and logit regressions including firm and year dummies are presented in Columns (1)-(3), and (4), respectively. Robust standard errors clustered at the firm level are reported in parentheses. *, **, and *** indicate significance at the 10%, 5%, and 1% level, respectively.
CEO_All_Power CEO_Soft_Power CEO_Hard_Power CEO_Chair
VARIABLES (1) (2) (3) (4) Prod_Mkt_Dynamicst-1 0.022** 0.014** 0.014** 0.164*
(0.011) (0.006) (0.007) (0.097)
Ln(FirmAge) -0.250*** -0.182*** -0.243*** -1.068**
(0.089) (0.059) (0.050) (0.534)
LNSt-1 0.021 0.010 0.029* 0.546***
(0.032) (0.019) (0.017) (0.184)
Sales_Growtht-1 0.001** 0.001*** 0.000 0.002
(0.001) (0.000) (0.000) (0.003)
Leveraget-1 -0.139* -0.032 -0.050 -0.869
(0.081) (0.048) (0.049) (0.564)
CEO_Age 0.044*** 0.026*** 0.025*** 0.305***
(0.003) (0.002) (0.002) (0.015)
CEO_Past_Perform 0.237 -0.038 0.250 4.387***
(0.331) (0.210) (0.231) (1.400)
CEO_Ivyleague 0.056 0.011 0.064 1.033***
(0.109) (0.072) (0.053) (0.354)
CEO_MBATop10 0.066 0.023 0.024 -0.057
(0.062) (0.039) (0.034) (0.273)
CEO_Ownership 1.943*** 0.964*** 1.249*** 30.019***
(0.502) (0.298) (0.269) (3.886)
CEO_Female 0.128 0.021 0.089 0.764
(0.150) (0.087) (0.100) (0.574)
Constant -0.914*** -0.431** -0.499** -17.254***
(0.350) (0.218) (0.210) (2.443)
Firm &Year FE (Dummies) Y Y Y Y
Observations 7,304 7,305 8,462 3,960 Adjusted(Pseudo) R2 0.593 0.673 0.708 (0.406)
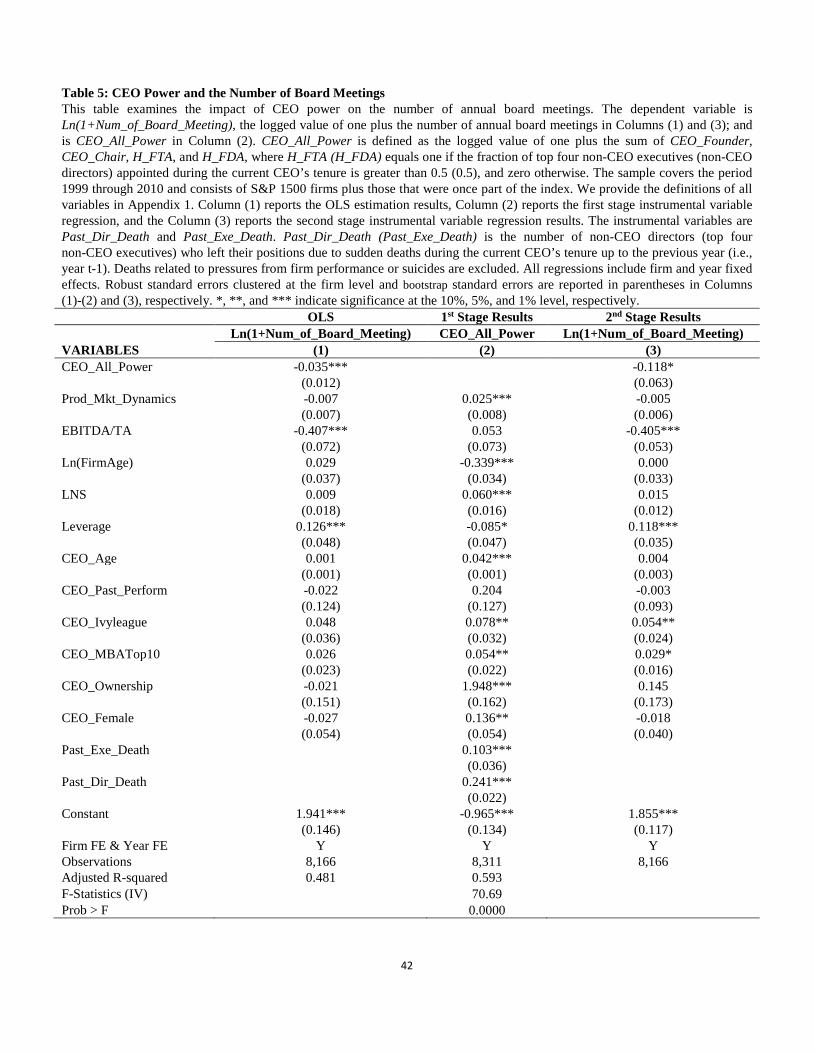
42
Table 5: CEO Power and the Number of Board Meetings This table examines the impact of CEO power on the number of annual board meetings. The dependent variable is Ln(1+Num_of_Board_Meeting), the logged value of one plus the number of annual board meetings in Columns (1) and (3); and is CEO_All_Power in Column (2). CEO_All_Power is defined as the logged value of one plus the sum of CEO_Founder, CEO_Chair, H_FTA, and H_FDA, where H_FTA (H_FDA) equals one if the fraction of top four non-CEO executives (non-CEO directors) appointed during the current CEO’s tenure is greater than 0.5 (0.5), and zero otherwise. The sample covers the period 1999 through 2010 and consists of S&P 1500 firms plus those that were once part of the index. We provide the definitions of all variables in Appendix 1. Column (1) reports the OLS estimation results, Column (2) reports the first stage instrumental variable regression, and the Column (3) reports the second stage instrumental variable regression results. The instrumental variables are Past_Dir_Death and Past_Exe_Death. Past_Dir_Death (Past_Exe_Death) is the number of non-CEO directors (top four non-CEO executives) who left their positions due to sudden deaths during the current CEO’s tenure up to the previous year (i.e., year t-1). Deaths related to pressures from firm performance or suicides are excluded. All regressions include firm and year fixed effects. Robust standard errors clustered at the firm level and bootstrap standard errors are reported in parentheses in Columns (1)-(2) and (3), respectively. *, **, and *** indicate significance at the 10%, 5%, and 1% level, respectively.
OLS 1st Stage Results 2nd Stage Results
Ln(1+Num_of_Board_Meeting) CEO_All_Power Ln(1+Num_of_Board_Meeting) VARIABLES (1) (2) (3) CEO_All_Power -0.035***
-0.118*
(0.012)
(0.063)
Prod_Mkt_Dynamics -0.007 0.025*** -0.005
(0.007) (0.008) (0.006)
EBITDA/TA -0.407*** 0.053 -0.405***
(0.072) (0.073) (0.053)
Ln(FirmAge) 0.029 -0.339*** 0.000
(0.037) (0.034) (0.033)
LNS 0.009 0.060*** 0.015
(0.018) (0.016) (0.012)
Leverage 0.126*** -0.085* 0.118***
(0.048) (0.047) (0.035)
CEO_Age 0.001 0.042*** 0.004
(0.001) (0.001) (0.003)
CEO_Past_Perform -0.022 0.204 -0.003
(0.124) (0.127) (0.093)
CEO_Ivyleague 0.048 0.078** 0.054**
(0.036) (0.032) (0.024)
CEO_MBATop10 0.026 0.054** 0.029*
(0.023) (0.022) (0.016)
CEO_Ownership -0.021 1.948*** 0.145
(0.151) (0.162) (0.173)
CEO_Female -0.027 0.136** -0.018
(0.054) (0.054) (0.040)
Past_Exe_Death
0.103***
(0.036)
Past_Dir_Death
0.241***
(0.022)
Constant 1.941*** -0.965*** 1.855***
(0.146) (0.134) (0.117)
Firm FE & Year FE Y Y Y Observations 8,166 8,311 8,166 Adjusted R-squared 0.481 0.593
F-Statistics (IV)
70.69 Prob > F 0.0000
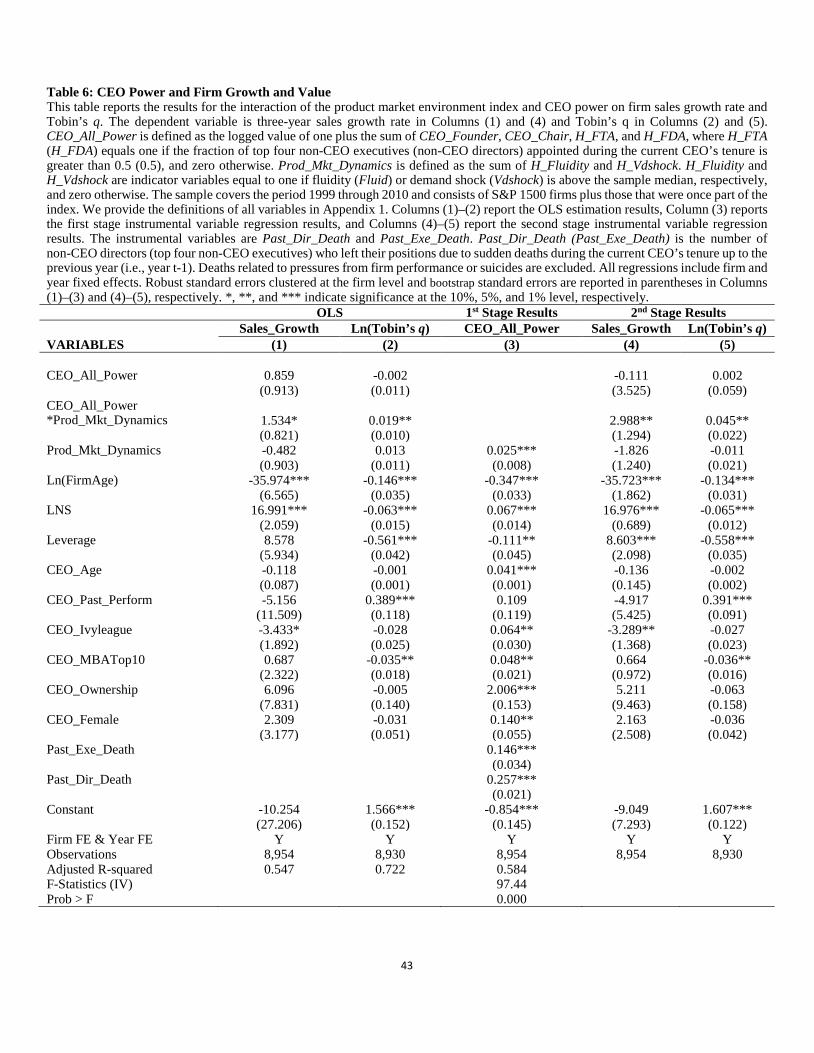
43
Table 6: CEO Power and Firm Growth and Value This table reports the results for the interaction of the product market environment index and CEO power on firm sales growth rate and Tobin’s q. The dependent variable is three-year sales growth rate in Columns (1) and (4) and Tobin’s q in Columns (2) and (5). CEO_All_Power is defined as the logged value of one plus the sum of CEO_Founder, CEO_Chair, H_FTA, and H_FDA, where H_FTA (H_FDA) equals one if the fraction of top four non-CEO executives (non-CEO directors) appointed during the current CEO’s tenure is greater than 0.5 (0.5), and zero otherwise. Prod_Mkt_Dynamics is defined as the sum of H_Fluidity and H_Vdshock. H_Fluidity and H_Vdshock are indicator variables equal to one if fluidity (Fluid) or demand shock (Vdshock) is above the sample median, respectively, and zero otherwise. The sample covers the period 1999 through 2010 and consists of S&P 1500 firms plus those that were once part of the index. We provide the definitions of all variables in Appendix 1. Columns (1)–(2) report the OLS estimation results, Column (3) reports the first stage instrumental variable regression results, and Columns (4)–(5) report the second stage instrumental variable regression results. The instrumental variables are Past_Dir_Death and Past_Exe_Death. Past_Dir_Death (Past_Exe_Death) is the number of non-CEO directors (top four non-CEO executives) who left their positions due to sudden deaths during the current CEO’s tenure up to the previous year (i.e., year t-1). Deaths related to pressures from firm performance or suicides are excluded. All regressions include firm and year fixed effects. Robust standard errors clustered at the firm level and bootstrap standard errors are reported in parentheses in Columns (1)–(3) and (4)–(5), respectively. *, **, and *** indicate significance at the 10%, 5%, and 1% level, respectively.
OLS 1st Stage Results 2nd Stage Results
Sales_Growth Ln(Tobin’s q) CEO_All_Power Sales_Growth Ln(Tobin’s q) VARIABLES (1) (2) (3) (4) (5) CEO_All_Power 0.859 -0.002
-0.111 0.002
(0.913) (0.011)
(3.525) (0.059)
CEO_All_Power *Prod_Mkt_Dynamics 1.534* 0.019**
2.988** 0.045**
(0.821) (0.010)
(1.294) (0.022)
Prod_Mkt_Dynamics -0.482 0.013 0.025*** -1.826 -0.011
(0.903) (0.011) (0.008) (1.240) (0.021)
Ln(FirmAge) -35.974*** -0.146*** -0.347*** -35.723*** -0.134***
(6.565) (0.035) (0.033) (1.862) (0.031)
LNS 16.991*** -0.063*** 0.067*** 16.976*** -0.065***
(2.059) (0.015) (0.014) (0.689) (0.012)
Leverage 8.578 -0.561*** -0.111** 8.603*** -0.558***
(5.934) (0.042) (0.045) (2.098) (0.035)
CEO_Age -0.118 -0.001 0.041*** -0.136 -0.002
(0.087) (0.001) (0.001) (0.145) (0.002)
CEO_Past_Perform -5.156 0.389*** 0.109 -4.917 0.391***
(11.509) (0.118) (0.119) (5.425) (0.091)
CEO_Ivyleague -3.433* -0.028 0.064** -3.289** -0.027
(1.892) (0.025) (0.030) (1.368) (0.023)
CEO_MBATop10 0.687 -0.035** 0.048** 0.664 -0.036**
(2.322) (0.018) (0.021) (0.972) (0.016)
CEO_Ownership 6.096 -0.005 2.006*** 5.211 -0.063
(7.831) (0.140) (0.153) (9.463) (0.158)
CEO_Female 2.309 -0.031 0.140** 2.163 -0.036
(3.177) (0.051) (0.055) (2.508) (0.042)
Past_Exe_Death
0.146***
(0.034)
Past_Dir_Death
0.257***
(0.021)
Constant -10.254 1.566*** -0.854*** -9.049 1.607***
(27.206) (0.152) (0.145) (7.293) (0.122)
Firm FE & Year FE Y Y Y Y Y Observations 8,954 8,930 8,954 8,954 8,930 Adjusted R-squared 0.547 0.722 0.584
F-Statistics (IV)
97.44 Prob > F 0.000
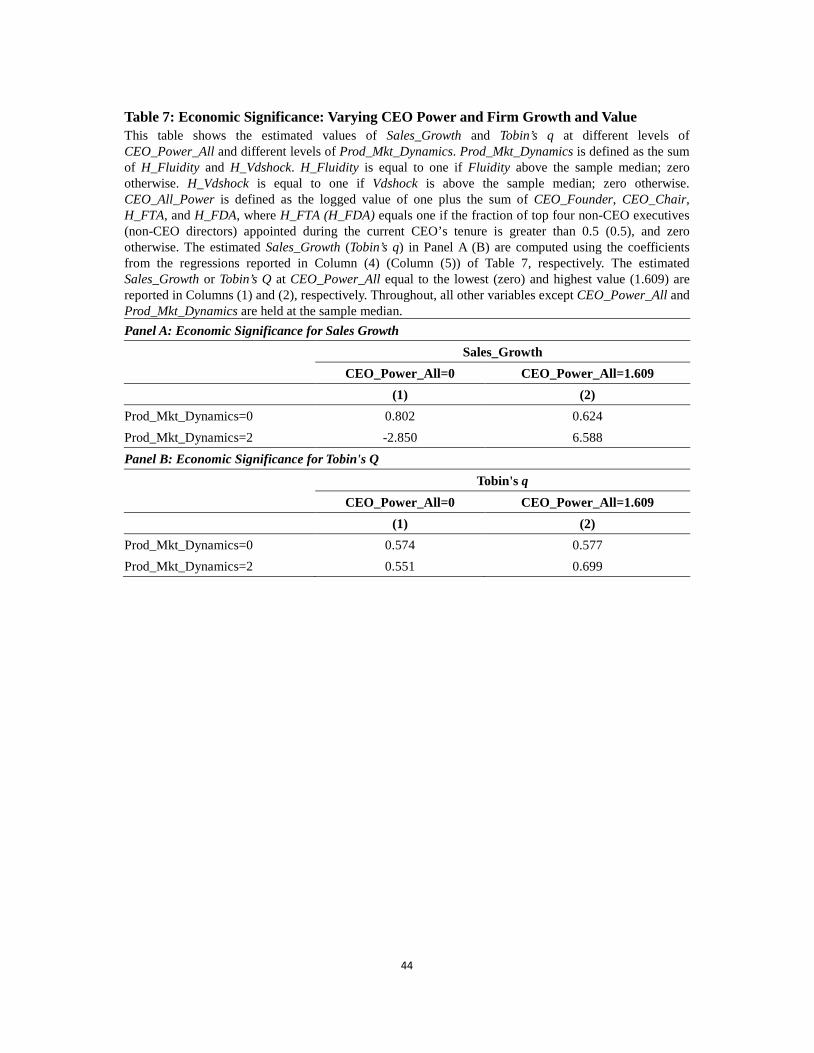
44
Table 7: Economic Significance: Varying CEO Power and Firm Growth and Value This table shows the estimated values of Sales_Growth and Tobin’s q at different levels of CEO_Power_All and different levels of Prod_Mkt_Dynamics. Prod_Mkt_Dynamics is defined as the sum of H_Fluidity and H_Vdshock. H_Fluidity is equal to one if Fluidity above the sample median; zero otherwise. H_Vdshock is equal to one if Vdshock is above the sample median; zero otherwise. CEO_All_Power is defined as the logged value of one plus the sum of CEO_Founder, CEO_Chair, H_FTA, and H_FDA, where H_FTA (H_FDA) equals one if the fraction of top four non-CEO executives (non-CEO directors) appointed during the current CEO’s tenure is greater than 0.5 (0.5), and zero otherwise. The estimated Sales_Growth (Tobin’s q) in Panel A (B) are computed using the coefficients from the regressions reported in Column (4) (Column (5)) of Table 7, respectively. The estimated Sales_Growth or Tobin’s Q at CEO_Power_All equal to the lowest (zero) and highest value (1.609) are reported in Columns (1) and (2), respectively. Throughout, all other variables except CEO_Power_All and Prod_Mkt_Dynamics are held at the sample median. Panel A: Economic Significance for Sales Growth
Sales_Growth
CEO_Power_All=0 CEO_Power_All=1.609 (1) (2) Prod_Mkt_Dynamics=0 0.802 0.624 Prod_Mkt_Dynamics=2 -2.850 6.588 Panel B: Economic Significance for Tobin's Q
Tobin's q
CEO_Power_All=0 CEO_Power_All=1.609 (1) (2) Prod_Mkt_Dynamics=0 0.574 0.577 Prod_Mkt_Dynamics=2 0.551 0.699
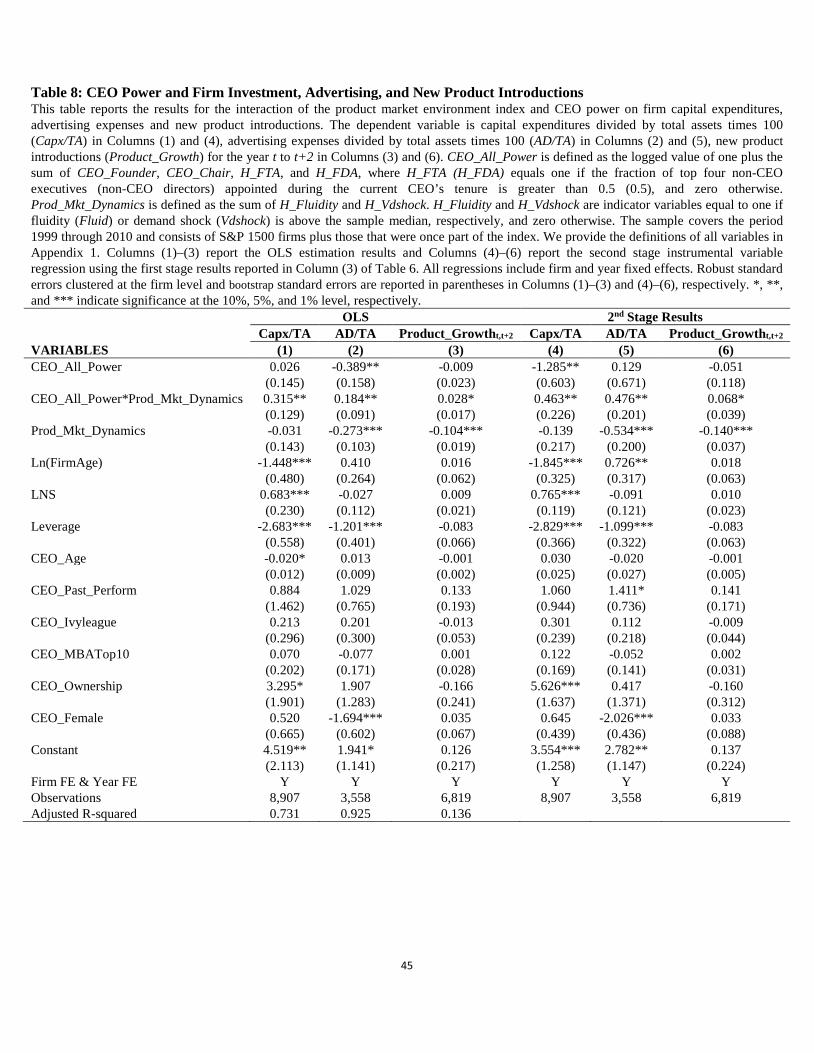
45
Table 8: CEO Power and Firm Investment, Advertising, and New Product Introductions This table reports the results for the interaction of the product market environment index and CEO power on firm capital expenditures, advertising expenses and new product introductions. The dependent variable is capital expenditures divided by total assets times 100 (Capx/TA) in Columns (1) and (4), advertising expenses divided by total assets times 100 (AD/TA) in Columns (2) and (5), new product introductions (Product_Growth) for the year t to t+2 in Columns (3) and (6). CEO_All_Power is defined as the logged value of one plus the sum of CEO_Founder, CEO_Chair, H_FTA, and H_FDA, where H_FTA (H_FDA) equals one if the fraction of top four non-CEO executives (non-CEO directors) appointed during the current CEO’s tenure is greater than 0.5 (0.5), and zero otherwise. Prod_Mkt_Dynamics is defined as the sum of H_Fluidity and H_Vdshock. H_Fluidity and H_Vdshock are indicator variables equal to one if fluidity (Fluid) or demand shock (Vdshock) is above the sample median, respectively, and zero otherwise. The sample covers the period 1999 through 2010 and consists of S&P 1500 firms plus those that were once part of the index. We provide the definitions of all variables in Appendix 1. Columns (1)–(3) report the OLS estimation results and Columns (4)–(6) report the second stage instrumental variable regression using the first stage results reported in Column (3) of Table 6. All regressions include firm and year fixed effects. Robust standard errors clustered at the firm level and bootstrap standard errors are reported in parentheses in Columns (1)–(3) and (4)–(6), respectively. *, **, and *** indicate significance at the 10%, 5%, and 1% level, respectively.
OLS 2nd Stage Results
Capx/TA AD/TA Product_Growtht,t+2 Capx/TA AD/TA Product_Growtht,t+2
VARIABLES (1) (2) (3) (4) (5) (6) CEO_All_Power 0.026 -0.389** -0.009 -1.285** 0.129 -0.051
(0.145) (0.158) (0.023) (0.603) (0.671) (0.118)
CEO_All_Power*Prod_Mkt_Dynamics 0.315** 0.184** 0.028* 0.463** 0.476** 0.068*
(0.129) (0.091) (0.017) (0.226) (0.201) (0.039)
Prod_Mkt_Dynamics -0.031 -0.273*** -0.104*** -0.139 -0.534*** -0.140***
(0.143) (0.103) (0.019) (0.217) (0.200) (0.037)
Ln(FirmAge) -1.448*** 0.410 0.016 -1.845*** 0.726** 0.018
(0.480) (0.264) (0.062) (0.325) (0.317) (0.063)
LNS 0.683*** -0.027 0.009 0.765*** -0.091 0.010
(0.230) (0.112) (0.021) (0.119) (0.121) (0.023)
Leverage -2.683*** -1.201*** -0.083 -2.829*** -1.099*** -0.083
(0.558) (0.401) (0.066) (0.366) (0.322) (0.063)
CEO_Age -0.020* 0.013 -0.001 0.030 -0.020 -0.001
(0.012) (0.009) (0.002) (0.025) (0.027) (0.005)
CEO_Past_Perform 0.884 1.029 0.133 1.060 1.411* 0.141
(1.462) (0.765) (0.193) (0.944) (0.736) (0.171)
CEO_Ivyleague 0.213 0.201 -0.013 0.301 0.112 -0.009
(0.296) (0.300) (0.053) (0.239) (0.218) (0.044)
CEO_MBATop10 0.070 -0.077 0.001 0.122 -0.052 0.002
(0.202) (0.171) (0.028) (0.169) (0.141) (0.031)
CEO_Ownership 3.295* 1.907 -0.166 5.626*** 0.417 -0.160
(1.901) (1.283) (0.241) (1.637) (1.371) (0.312)
CEO_Female 0.520 -1.694*** 0.035 0.645 -2.026*** 0.033
(0.665) (0.602) (0.067) (0.439) (0.436) (0.088)
Constant 4.519** 1.941* 0.126 3.554*** 2.782** 0.137
(2.113) (1.141) (0.217) (1.258) (1.147) (0.224)
Firm FE & Year FE Y Y Y Y Y Y Observations 8,907 3,558 6,819 8,907 3,558 6,819 Adjusted R-squared 0.731 0.925 0.136
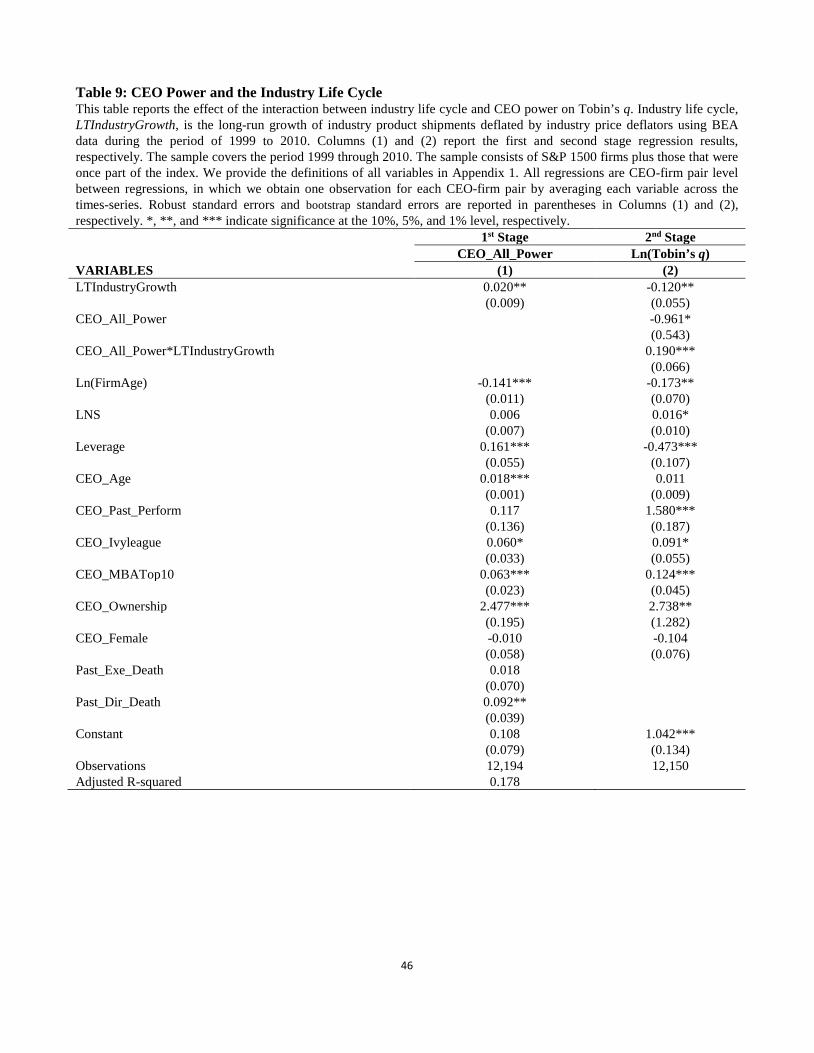
46
Table 9: CEO Power and the Industry Life Cycle This table reports the effect of the interaction between industry life cycle and CEO power on Tobin’s q. Industry life cycle, LTIndustryGrowth, is the long-run growth of industry product shipments deflated by industry price deflators using BEA data during the period of 1999 to 2010. Columns (1) and (2) report the first and second stage regression results, respectively. The sample covers the period 1999 through 2010. The sample consists of S&P 1500 firms plus those that were once part of the index. We provide the definitions of all variables in Appendix 1. All regressions are CEO-firm pair level between regressions, in which we obtain one observation for each CEO-firm pair by averaging each variable across the times-series. Robust standard errors and bootstrap standard errors are reported in parentheses in Columns (1) and (2), respectively. *, **, and *** indicate significance at the 10%, 5%, and 1% level, respectively.
1st Stage 2nd Stage
CEO_All_Power Ln(Tobin’s q)
VARIABLES (1) (2) LTIndustryGrowth 0.020** -0.120**
(0.009) (0.055)
CEO_All_Power
-0.961*
(0.543)
CEO_All_Power*LTIndustryGrowth
0.190***
(0.066)
Ln(FirmAge) -0.141*** -0.173**
(0.011) (0.070)
LNS 0.006 0.016*
(0.007) (0.010)
Leverage 0.161*** -0.473***
(0.055) (0.107)
CEO_Age 0.018*** 0.011
(0.001) (0.009)
CEO_Past_Perform 0.117 1.580***
(0.136) (0.187)
CEO_Ivyleague 0.060* 0.091*
(0.033) (0.055)
CEO_MBATop10 0.063*** 0.124***
(0.023) (0.045)
CEO_Ownership 2.477*** 2.738**
(0.195) (1.282)
CEO_Female -0.010 -0.104
(0.058) (0.076)
Past_Exe_Death 0.018
(0.070)
Past_Dir_Death 0.092**
(0.039)
Constant 0.108 1.042***
(0.079) (0.134)
Observations 12,194 12,150 Adjusted R-squared 0.178
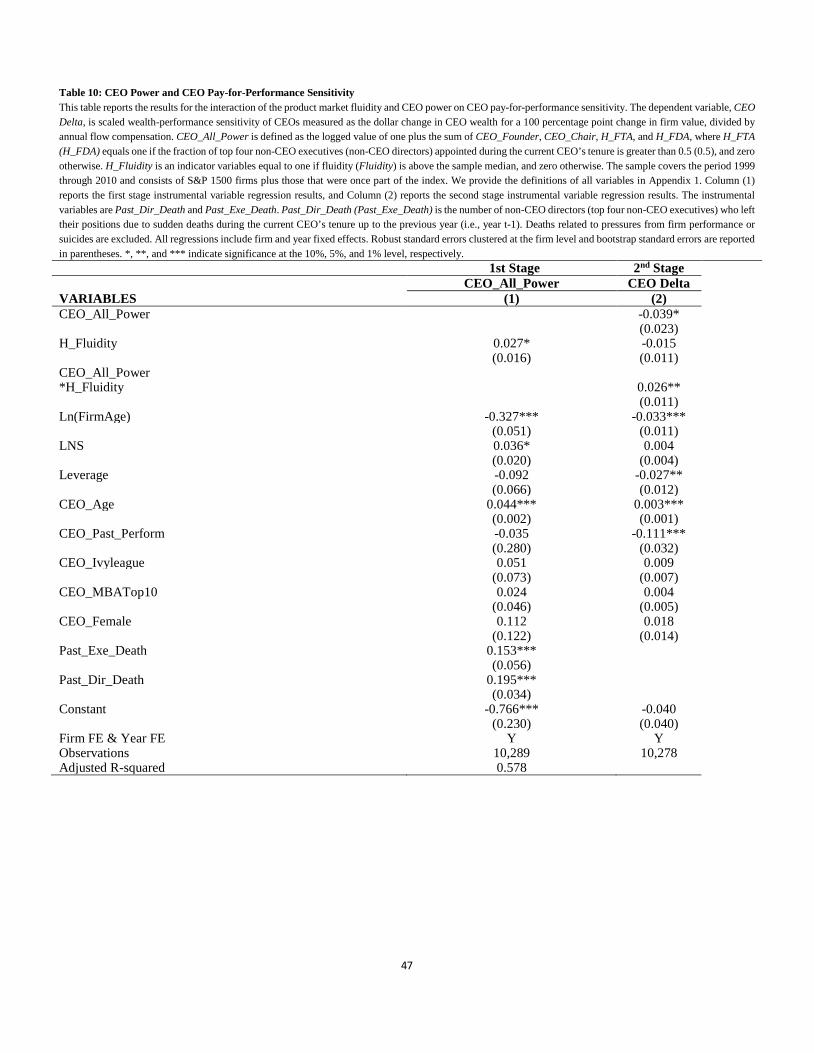
47
Table 10: CEO Power and CEO Pay-for-Performance Sensitivity This table reports the results for the interaction of the product market fluidity and CEO power on CEO pay-for-performance sensitivity. The dependent variable, CEO Delta, is scaled wealth-performance sensitivity of CEOs measured as the dollar change in CEO wealth for a 100 percentage point change in firm value, divided by annual flow compensation. CEO_All_Power is defined as the logged value of one plus the sum of CEO_Founder, CEO_Chair, H_FTA, and H_FDA, where H_FTA (H_FDA) equals one if the fraction of top four non-CEO executives (non-CEO directors) appointed during the current CEO’s tenure is greater than 0.5 (0.5), and zero otherwise. H_Fluidity is an indicator variables equal to one if fluidity (Fluidity) is above the sample median, and zero otherwise. The sample covers the period 1999 through 2010 and consists of S&P 1500 firms plus those that were once part of the index. We provide the definitions of all variables in Appendix 1. Column (1) reports the first stage instrumental variable regression results, and Column (2) reports the second stage instrumental variable regression results. The instrumental variables are Past_Dir_Death and Past_Exe_Death. Past_Dir_Death (Past_Exe_Death) is the number of non-CEO directors (top four non-CEO executives) who left their positions due to sudden deaths during the current CEO’s tenure up to the previous year (i.e., year t-1). Deaths related to pressures from firm performance or suicides are excluded. All regressions include firm and year fixed effects. Robust standard errors clustered at the firm level and bootstrap standard errors are reported in parentheses. *, **, and *** indicate significance at the 10%, 5%, and 1% level, respectively.
1st Stage 2nd Stage
CEO_All_Power CEO Delta VARIABLES (1) (2) CEO_All_Power
-0.039*
(0.023)
H_Fluidity 0.027* -0.015
(0.016) (0.011)
CEO_All_Power *H_Fluidity
0.026**
(0.011)
Ln(FirmAge) -0.327*** -0.033***
(0.051) (0.011)
LNS 0.036* 0.004
(0.020) (0.004)
Leverage -0.092 -0.027**
(0.066) (0.012)
CEO_Age 0.044*** 0.003***
(0.002) (0.001)
CEO_Past_Perform -0.035 -0.111***
(0.280) (0.032)
CEO_Ivyleague 0.051 0.009
(0.073) (0.007)
CEO_MBATop10 0.024 0.004
(0.046) (0.005)
CEO_Female 0.112 0.018
(0.122) (0.014)
Past_Exe_Death 0.153***
(0.056)
Past_Dir_Death 0.195***
(0.034)
Constant -0.766*** -0.040
(0.230) (0.040)
Firm FE & Year FE Y Y Observations 10,289 10,278 Adjusted R-squared 0.578
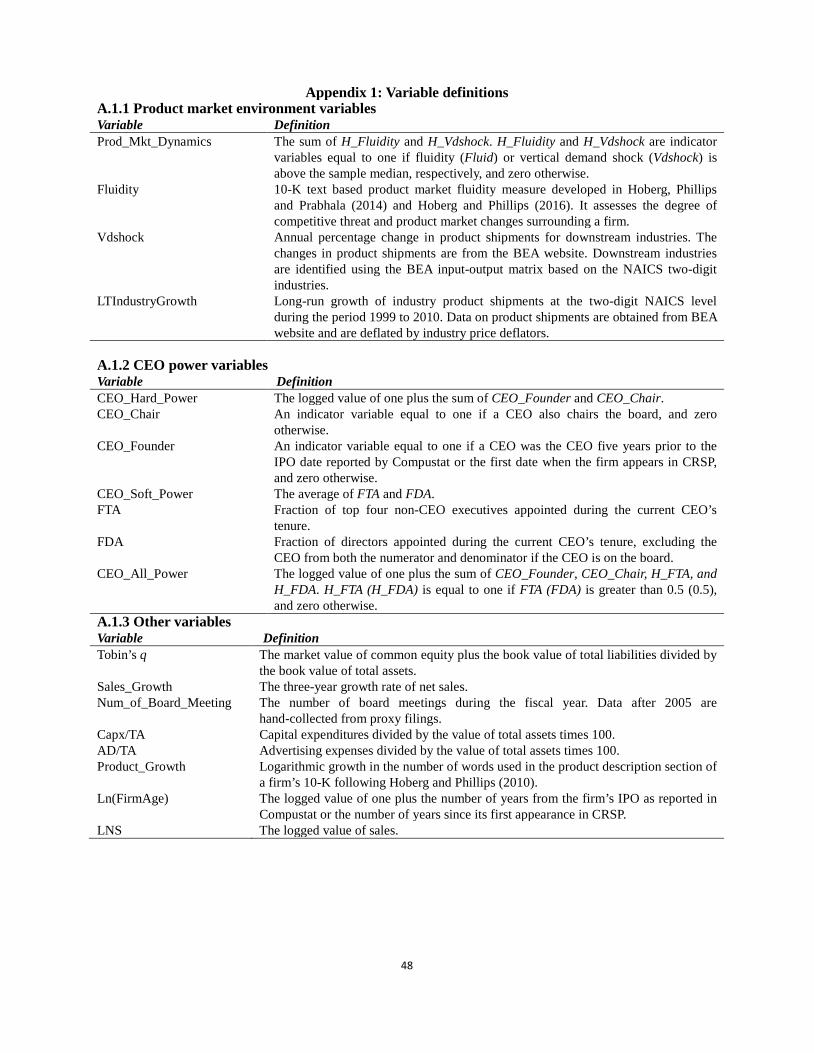
48
Appendix 1: Variable definitions
A.1.1 Product market environment variables Variable Definition Prod_Mkt_Dynamics The sum of H_Fluidity and H_Vdshock. H_Fluidity and H_Vdshock are indicator
variables equal to one if fluidity (Fluid) or vertical demand shock (Vdshock) is above the sample median, respectively, and zero otherwise.
Fluidity 10-K text based product market fluidity measure developed in Hoberg, Phillips and Prabhala (2014) and Hoberg and Phillips (2016). It assesses the degree of competitive threat and product market changes surrounding a firm.
Vdshock Annual percentage change in product shipments for downstream industries. The changes in product shipments are from the BEA website. Downstream industries are identified using the BEA input-output matrix based on the NAICS two-digit industries.
LTIndustryGrowth Long-run growth of industry product shipments at the two-digit NAICS level during the period 1999 to 2010. Data on product shipments are obtained from BEA website and are deflated by industry price deflators.
A.1.2 CEO power variables Variable Definition CEO_Hard_Power The logged value of one plus the sum of CEO_Founder and CEO_Chair. CEO_Chair An indicator variable equal to one if a CEO also chairs the board, and zero
otherwise. CEO_Founder An indicator variable equal to one if a CEO was the CEO five years prior to the
IPO date reported by Compustat or the first date when the firm appears in CRSP, and zero otherwise.
CEO_Soft_Power The average of FTA and FDA. FTA Fraction of top four non-CEO executives appointed during the current CEO’s
tenure. FDA Fraction of directors appointed during the current CEO’s tenure, excluding the
CEO from both the numerator and denominator if the CEO is on the board. CEO_All_Power The logged value of one plus the sum of CEO_Founder, CEO_Chair, H_FTA, and
H_FDA. H_FTA (H_FDA) is equal to one if FTA (FDA) is greater than 0.5 (0.5), and zero otherwise.
A.1.3 Other variables Variable Definition Tobin’s q The market value of common equity plus the book value of total liabilities divided by
the book value of total assets. Sales_Growth The three-year growth rate of net sales. Num_of_Board_Meeting The number of board meetings during the fiscal year. Data after 2005 are
hand-collected from proxy filings. Capx/TA Capital expenditures divided by the value of total assets times 100. AD/TA Advertising expenses divided by the value of total assets times 100. Product_Growth
Logarithmic growth in the number of words used in the product description section of a firm’s 10-K following Hoberg and Phillips (2010).
Ln(FirmAge) The logged value of one plus the number of years from the firm’s IPO as reported in Compustat or the number of years since its first appearance in CRSP.
LNS The logged value of sales.
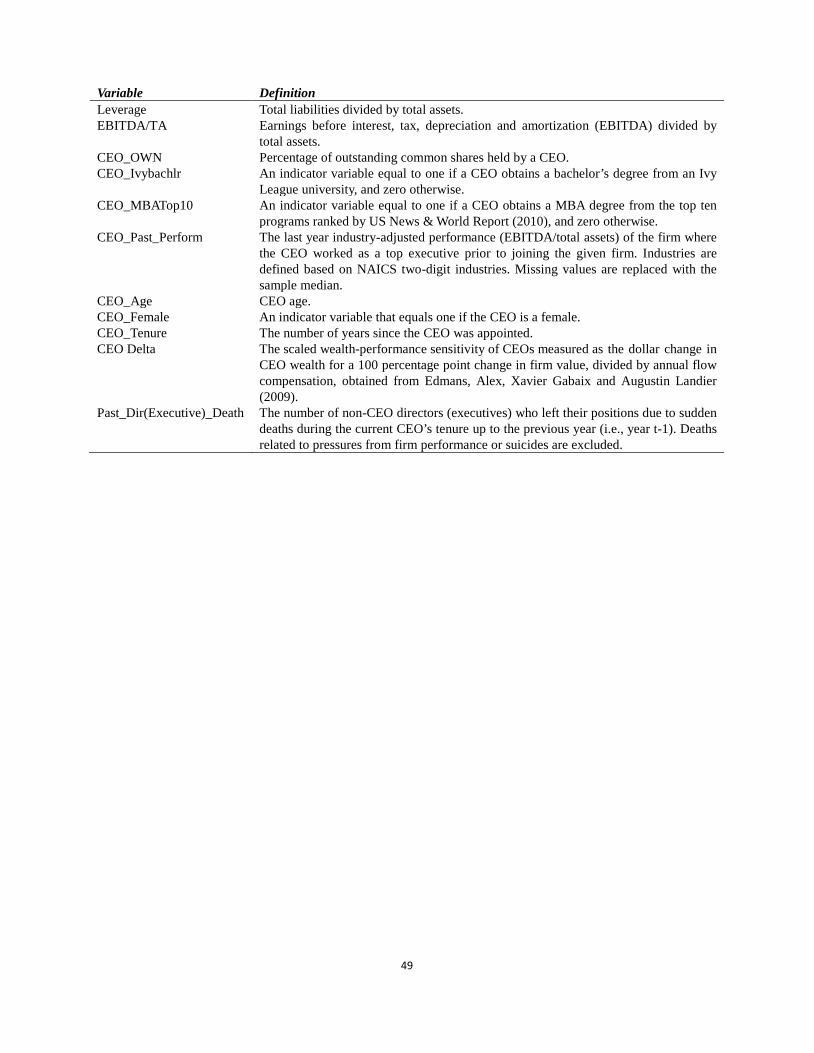
49
Variable Definition Leverage Total liabilities divided by total assets. EBITDA/TA Earnings before interest, tax, depreciation and amortization (EBITDA) divided by
total assets. CEO_OWN Percentage of outstanding common shares held by a CEO. CEO_Ivybachlr An indicator variable equal to one if a CEO obtains a bachelor’s degree from an Ivy
League university, and zero otherwise. CEO_MBATop10 An indicator variable equal to one if a CEO obtains a MBA degree from the top ten
programs ranked by US News & World Report (2010), and zero otherwise. CEO_Past_Perform The last year industry-adjusted performance (EBITDA/total assets) of the firm where
the CEO worked as a top executive prior to joining the given firm. Industries are defined based on NAICS two-digit industries. Missing values are replaced with the sample median.
CEO_Age CEO age. CEO_Female An indicator variable that equals one if the CEO is a female. CEO_Tenure The number of years since the CEO was appointed. CEO Delta The scaled wealth-performance sensitivity of CEOs measured as the dollar change in
CEO wealth for a 100 percentage point change in firm value, divided by annual flow compensation, obtained from Edmans, Alex, Xavier Gabaix and Augustin Landier (2009).
Past_Dir(Executive)_Death The number of non-CEO directors (executives) who left their positions due to sudden deaths during the current CEO’s tenure up to the previous year (i.e., year t-1). Deaths related to pressures from firm performance or suicides are excluded.
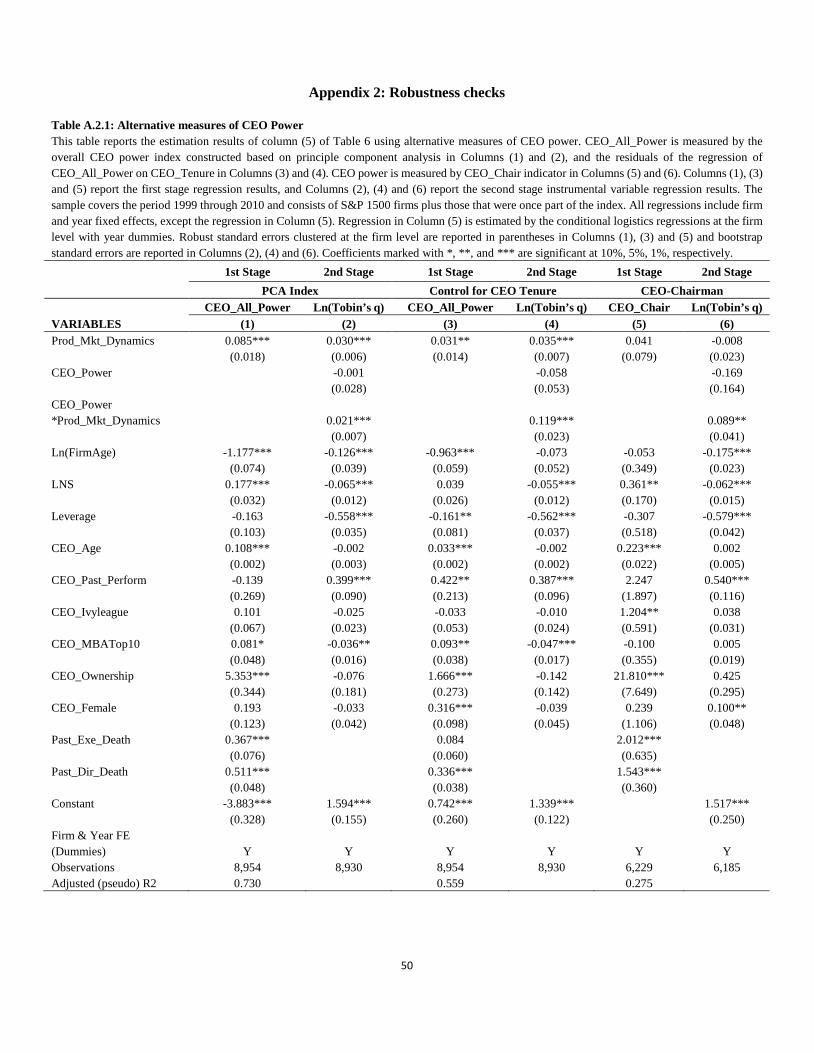
50
Appendix 2: Robustness checks
Table A.2.1: Alternative measures of CEO Power This table reports the estimation results of column (5) of Table 6 using alternative measures of CEO power. CEO_All_Power is measured by the overall CEO power index constructed based on principle component analysis in Columns (1) and (2), and the residuals of the regression of CEO_All_Power on CEO_Tenure in Columns (3) and (4). CEO power is measured by CEO_Chair indicator in Columns (5) and (6). Columns (1), (3) and (5) report the first stage regression results, and Columns (2), (4) and (6) report the second stage instrumental variable regression results. The sample covers the period 1999 through 2010 and consists of S&P 1500 firms plus those that were once part of the index. All regressions include firm and year fixed effects, except the regression in Column (5). Regression in Column (5) is estimated by the conditional logistics regressions at the firm level with year dummies. Robust standard errors clustered at the firm level are reported in parentheses in Columns (1), (3) and (5) and bootstrap standard errors are reported in Columns (2), (4) and (6). Coefficients marked with *, **, and *** are significant at 10%, 5%, 1%, respectively.
1st Stage 2nd Stage 1st Stage 2nd Stage 1st Stage 2nd Stage
PCA Index Control for CEO Tenure CEO-Chairman
CEO_All_Power Ln(Tobin’s q) CEO_All_Power Ln(Tobin’s q) CEO_Chair Ln(Tobin’s q) VARIABLES (1) (2) (3) (4) (5) (6) Prod_Mkt_Dynamics 0.085*** 0.030*** 0.031** 0.035*** 0.041 -0.008
(0.018) (0.006) (0.014) (0.007) (0.079) (0.023)
CEO_Power
-0.001
-0.058
-0.169
(0.028)
(0.053)
(0.164)
CEO_Power *Prod_Mkt_Dynamics
0.021***
0.119***
0.089**
(0.007)
(0.023)
(0.041)
Ln(FirmAge) -1.177*** -0.126*** -0.963*** -0.073 -0.053 -0.175***
(0.074) (0.039) (0.059) (0.052) (0.349) (0.023)
LNS 0.177*** -0.065*** 0.039 -0.055*** 0.361** -0.062***
(0.032) (0.012) (0.026) (0.012) (0.170) (0.015)
Leverage -0.163 -0.558*** -0.161** -0.562*** -0.307 -0.579***
(0.103) (0.035) (0.081) (0.037) (0.518) (0.042)
CEO_Age 0.108*** -0.002 0.033*** -0.002 0.223*** 0.002
(0.002) (0.003) (0.002) (0.002) (0.022) (0.005)
CEO_Past_Perform -0.139 0.399*** 0.422** 0.387*** 2.247 0.540***
(0.269) (0.090) (0.213) (0.096) (1.897) (0.116)
CEO_Ivyleague 0.101 -0.025 -0.033 -0.010 1.204** 0.038
(0.067) (0.023) (0.053) (0.024) (0.591) (0.031)
CEO_MBATop10 0.081* -0.036** 0.093** -0.047*** -0.100 0.005
(0.048) (0.016) (0.038) (0.017) (0.355) (0.019)
CEO_Ownership 5.353*** -0.076 1.666*** -0.142 21.810*** 0.425
(0.344) (0.181) (0.273) (0.142) (7.649) (0.295)
CEO_Female 0.193 -0.033 0.316*** -0.039 0.239 0.100**
(0.123) (0.042) (0.098) (0.045) (1.106) (0.048)
Past_Exe_Death 0.367***
0.084
2.012***
(0.076)
(0.060)
(0.635)
Past_Dir_Death 0.511***
0.336***
1.543***
(0.048)
(0.038)
(0.360)
Constant -3.883*** 1.594*** 0.742*** 1.339***
1.517***
(0.328) (0.155) (0.260) (0.122)
(0.250)
Firm & Year FE (Dummies) Y Y Y Y Y Y Observations 8,954 8,930 8,954 8,930 6,229 6,185 Adjusted (pseudo) R2 0.730 0.559 0.275
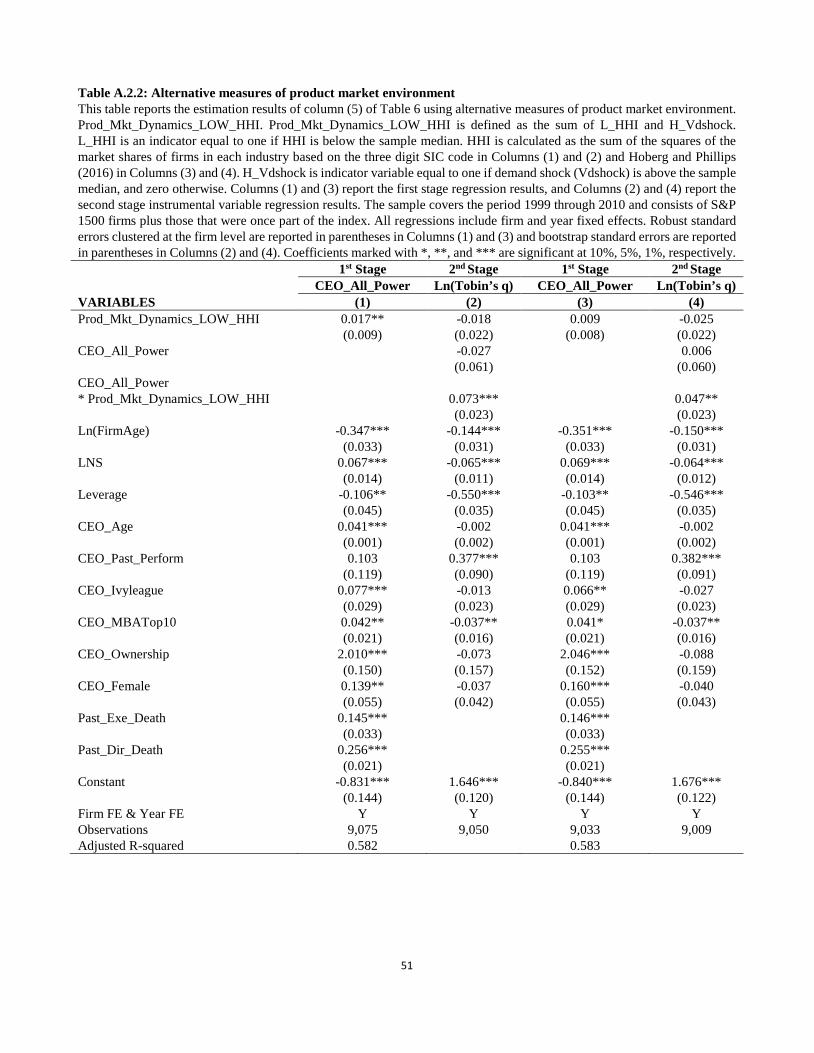
51
Table A.2.2: Alternative measures of product market environment This table reports the estimation results of column (5) of Table 6 using alternative measures of product market environment. Prod_Mkt_Dynamics_LOW_HHI. Prod_Mkt_Dynamics_LOW_HHI is defined as the sum of L_HHI and H_Vdshock. L_HHI is an indicator equal to one if HHI is below the sample median. HHI is calculated as the sum of the squares of the market shares of firms in each industry based on the three digit SIC code in Columns (1) and (2) and Hoberg and Phillips (2016) in Columns (3) and (4). H_Vdshock is indicator variable equal to one if demand shock (Vdshock) is above the sample median, and zero otherwise. Columns (1) and (3) report the first stage regression results, and Columns (2) and (4) report the second stage instrumental variable regression results. The sample covers the period 1999 through 2010 and consists of S&P 1500 firms plus those that were once part of the index. All regressions include firm and year fixed effects. Robust standard errors clustered at the firm level are reported in parentheses in Columns (1) and (3) and bootstrap standard errors are reported in parentheses in Columns (2) and (4). Coefficients marked with *, **, and *** are significant at 10%, 5%, 1%, respectively.
1st Stage 2nd Stage 1st Stage 2nd Stage CEO_All_Power Ln(Tobin’s q) CEO_All_Power Ln(Tobin’s q)
VARIABLES (1) (2) (3) (4)Prod_Mkt_Dynamics_LOW_HHI 0.017** -0.018 0.009 -0.025
(0.009) (0.022) (0.008) (0.022)CEO_All_Power -0.027 0.006
(0.061) (0.060)CEO_All_Power * Prod_Mkt_Dynamics_LOW_HHI 0.073*** 0.047**
(0.023)
(0.023) Ln(FirmAge) -0.347*** -0.144*** -0.351*** -0.150***
(0.033) (0.031) (0.033) (0.031)LNS 0.067*** -0.065*** 0.069*** -0.064***
(0.014) (0.011) (0.014) (0.012)Leverage -0.106** -0.550*** -0.103** -0.546***
(0.045) (0.035) (0.045) (0.035)CEO_Age 0.041*** -0.002 0.041*** -0.002
(0.001) (0.002) (0.001) (0.002)CEO_Past_Perform 0.103 0.377*** 0.103 0.382***
(0.119) (0.090) (0.119) (0.091)CEO_Ivyleague 0.077*** -0.013 0.066** -0.027
(0.029) (0.023) (0.029) (0.023)CEO_MBATop10 0.042** -0.037** 0.041* -0.037**
(0.021) (0.016) (0.021) (0.016)CEO_Ownership 2.010*** -0.073 2.046*** -0.088
(0.150) (0.157) (0.152) (0.159)CEO_Female 0.139** -0.037 0.160*** -0.040
(0.055) (0.042) (0.055) (0.043)Past_Exe_Death 0.145*** 0.146***
(0.033) (0.033) Past_Dir_Death 0.256*** 0.255***
(0.021)
(0.021) Constant -0.831*** 1.646*** -0.840*** 1.676***
(0.144) (0.120) (0.144) (0.122) Firm FE & Year FE Y Y Y Y Observations 9,075 9,050 9,033 9,009 Adjusted R-squared 0.582 0.583
Top Related