


![[AIESEC HCMC][iGIP] Intern Guidebook](https://static.fdocuments.in/doc/165x107/541da31f7bef0a5e528b684b/aiesec-hcmcigip-intern-guidebook.jpg)


Languages
Pages
Legal


CBRE VIETNAM, HCMC MARKET OVERVIEW Q1/2014
PRESENTED BY: GREG OHAN, DIRECTOR, VIETNAM
MARCH 11TH 2014
CONTENTS
2
1. Understand The Market Overview - Vietnam Office Market
2. How to “Beat The Cycle?” Tenant Profiling Planning & Strategies - Key Considerations
3. Outlook & Predictions – 2014+ Outlook CBRE Predictions
4. MB Sunny Tower Overview - MB Sunny Tower
HOW TO MAKE THE RIGHT DECISION ?
3
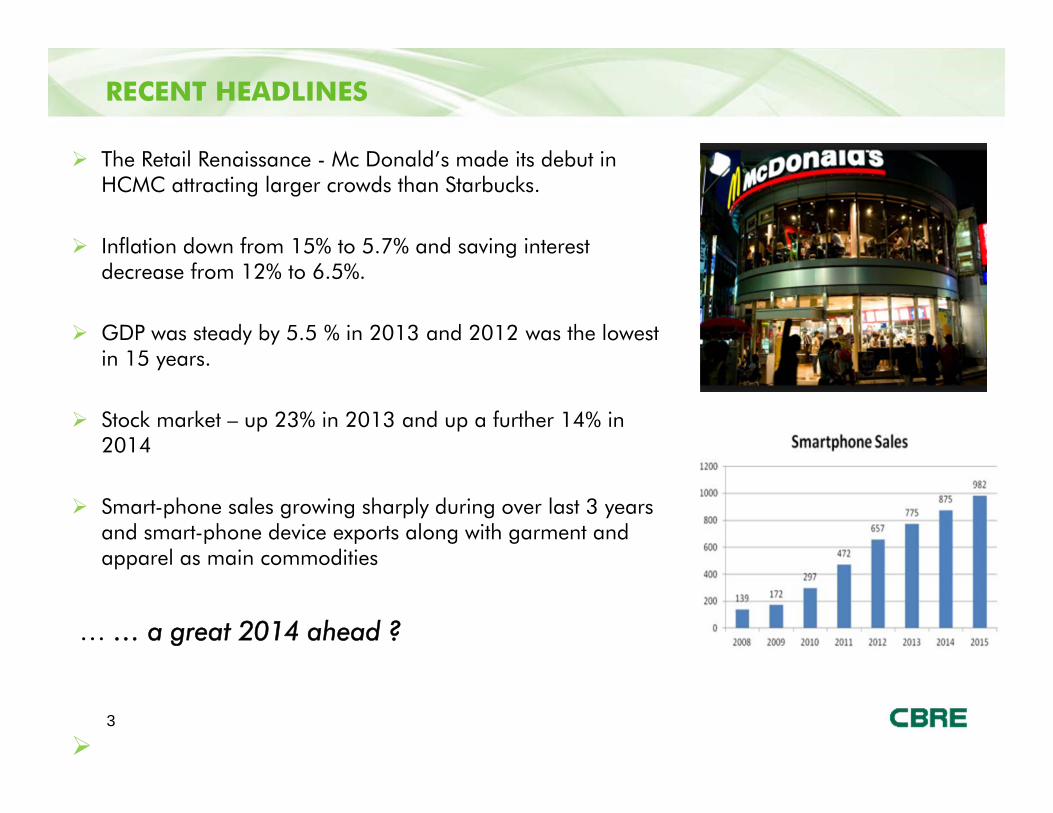
The Retail Renaissance - Mc Donald’s made its debut in HCMC attracting larger crowds than Starbucks.
Inflation down from 15% to 5.7% and saving interest decrease from 12% to 6.5%.
GDP was steady by 5.5 % in 2013 and 2012 was the lowest in 15 years.
Stock market – up 23% in 2013 and up a further 14% in 2014
Smart-phone sales growing sharply during over last 3 years and smart-phone device exports along with garment and apparel as main commodities
… … a great 2014 ahead ?
RECENT HEADLINES

UNDERSTAND THE MARKET
5
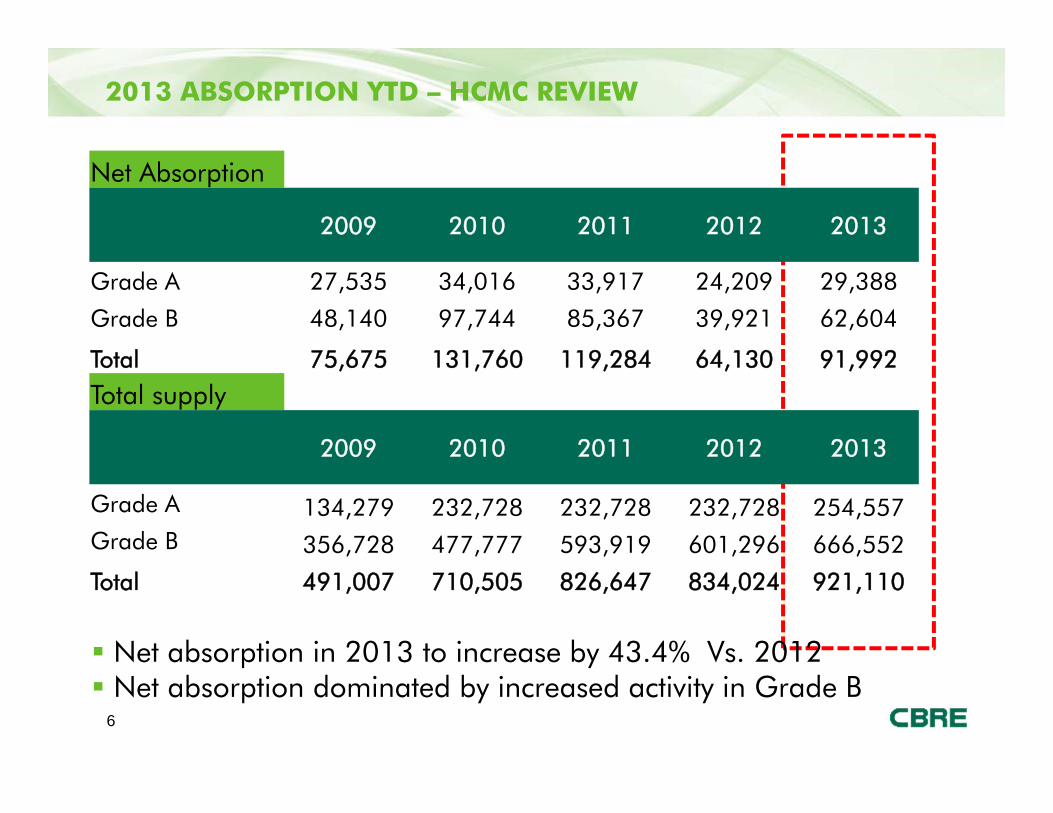
2013 ABSORPTION YTD – HCMC REVIEW
6
Net Absorption
2009 2010 2011 2012 2013
Grade A 27,535 34,016 33,917 24,209 29,388
Grade B 48,140 97,744 85,367 39,921 62,604
Total 75,675 131,760 119,284 64,130 91,992
Total supply
2009 2010 2011 2012 2013
Grade A 134,279 232,728 232,728 232,728 254,557Grade B 356,728 477,777 593,919 601,296 666,552
Total 491,007 710,505 826,647 834,024 921,110
Net absorption in 2013 to increase by 43.4% Vs. 2012 Net absorption dominated by increased activity in Grade B
7
MARKET OVERVIEW - HCMC
RISING NEW SUPPLY AND DECREASING OCCUPANCY RATES
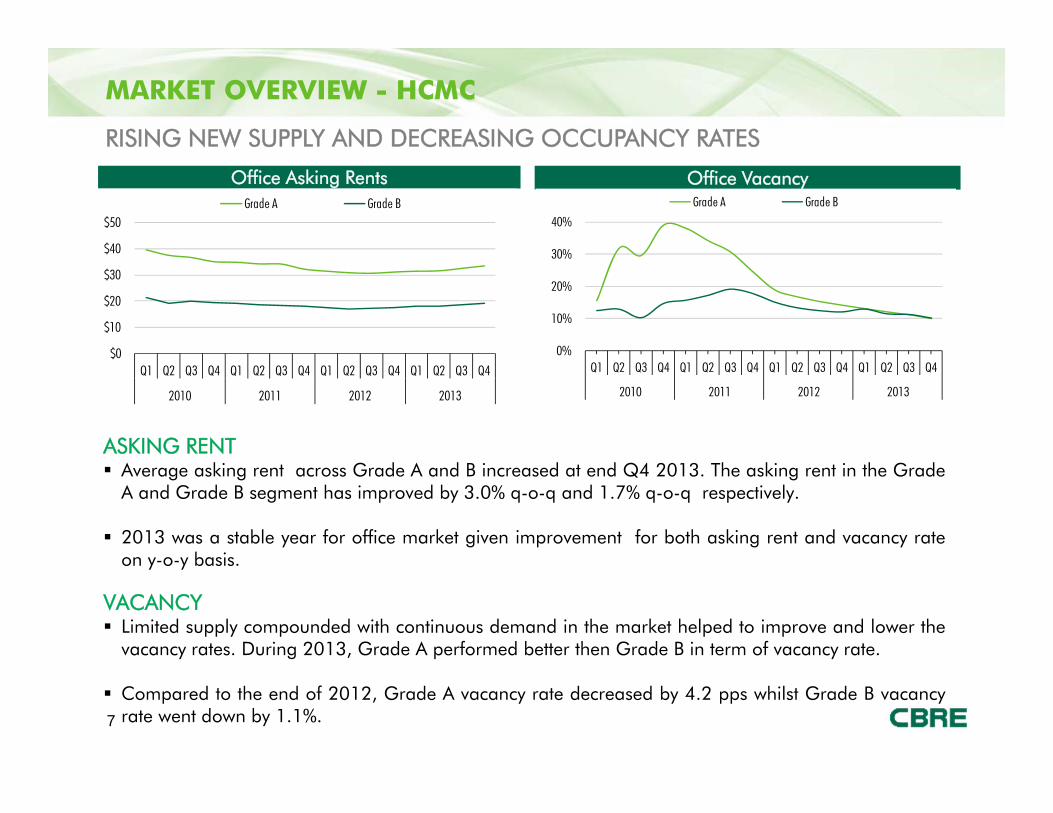
ASKING RENT Average asking rent across Grade A and B increased at end Q4 2013. The asking rent in the Grade
A and Grade B segment has improved by 3.0% q-o-q and 1.7% q-o-q respectively.
2013 was a stable year for office market given improvement for both asking rent and vacancy rateon y-o-y basis.
VACANCY Limited supply compounded with continuous demand in the market helped to improve and lower the
vacancy rates. During 2013, Grade A performed better then Grade B in term of vacancy rate.
Compared to the end of 2012, Grade A vacancy rate decreased by 4.2 pps whilst Grade B vacancyrate went down by 1.1%.
Office Asking Rents Office Vacancy
$0
$10
$20
$30
$40
$50
Q1 Q2 Q3 Q4 Q1 Q2 Q3 Q4 Q1 Q2 Q3 Q4 Q1 Q2 Q3 Q4
2010 2011 2012 2013
Grade A Grade B
0%
10%
20%
30%
40%
Q1 Q2 Q3 Q4 Q1 Q2 Q3 Q4 Q1 Q2 Q3 Q4 Q1 Q2 Q3 Q4
2010 2011 2012 2013
Grade A Grade B
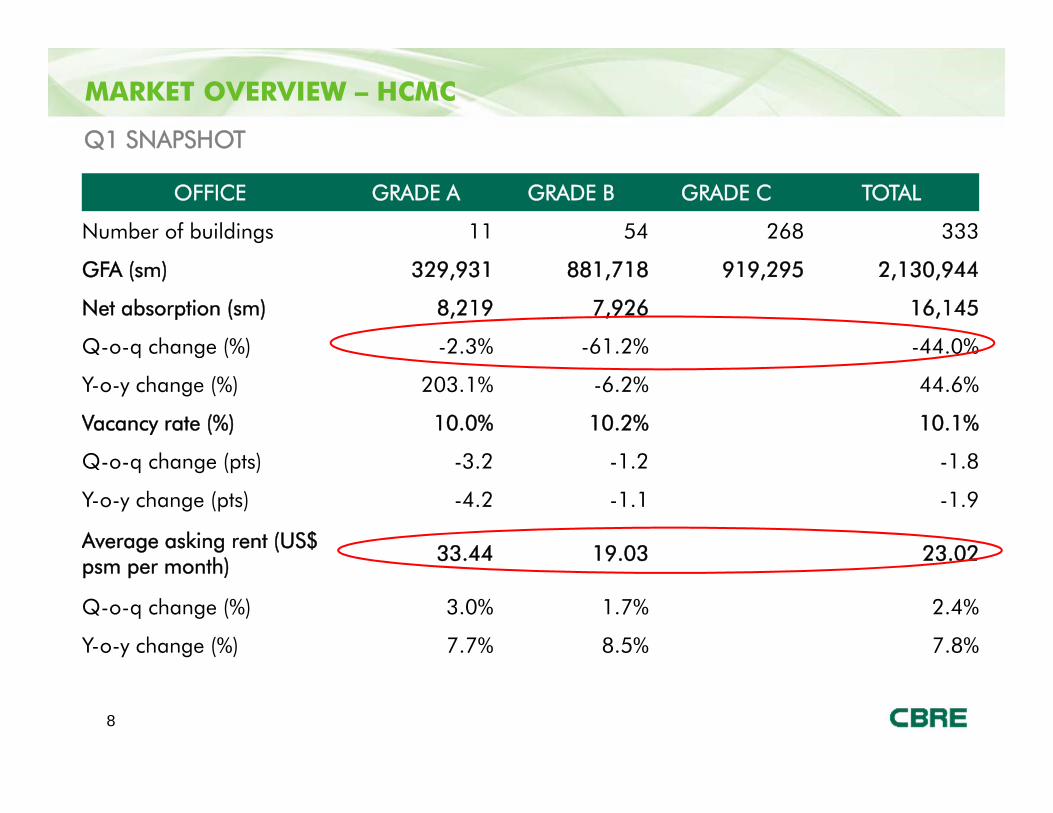
OFFICE GRADE A GRADE B GRADE C TOTAL
Number of buildings 11 54 268 333
GFA (sm) 329,931 881,718 919,295 2,130,944
Net absorption (sm) 8,219 7,926 16,145
Q-o-q change (%) -2.3% -61.2% -44.0%
Y-o-y change (%) 203.1% -6.2% 44.6%
Vacancy rate (%) 10.0% 10.2% 10.1%
Q-o-q change (pts) -3.2 -1.2 -1.8
Y-o-y change (pts) -4.2 -1.1 -1.9
Average asking rent (US$ psm per month) 33.44 19.03 23.02
Q-o-q change (%) 3.0% 1.7% 2.4%
Y-o-y change (%) 7.7% 8.5% 7.8%
MARKET OVERVIEW – HCMC
8
Q1 SNAPSHOT
9
GRADE A RENT & VACANCY
MARKET OVERVIEW – HCMC
$0
$20
$40
$60
$80
$100
0
20,000
40,000
60,000
80,000
100,000
Q1 Q2 Q3 Q4 Q1 Q2 Q3 Q4 Q1 Q2 Q3 Q4
2011 2012 2013
Aver
age
Askin
g Re
nt (U
S$ p
sm p
er m
onth
)
Vaca
nt S
pace
(sm
)
Vacant Space Asking Rent
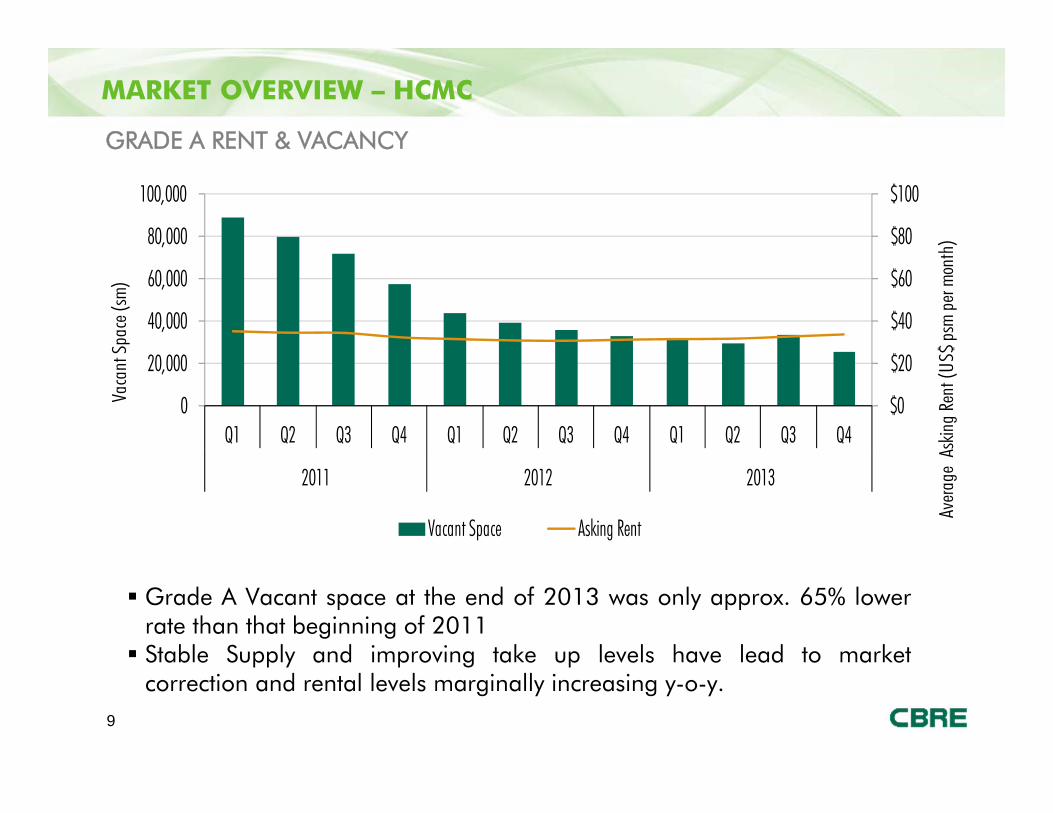
Grade A Vacant space at the end of 2013 was only approx. 65% lowerrate than that beginning of 2011 Stable Supply and improving take up levels have lead to market
correction and rental levels marginally increasing y-o-y.

10
GRADE B RENT & VACANCY
MARKET OVERVIEW – HCMC
$0
$20
$40
$60
$80
$100
0
20,000
40,000
60,000
80,000
100,000
120,000
Q1 Q2 Q3 Q4 Q1 Q2 Q3 Q4 Q1 Q2 Q3 Q4
2011 2012 2013 Aver
age
Askin
g Re
nt (U
S$ p
sm p
er m
onth
)
Vaca
nt S
pace
(sm
)
Vacant Space Asking Rent
Grade B Vacant space at the end of 2013 was approx. 10% lower thanthat at the beginning of 2011 Stable Supply and improving take up levels have lead to stabilization and
rental levels remaining flat
11
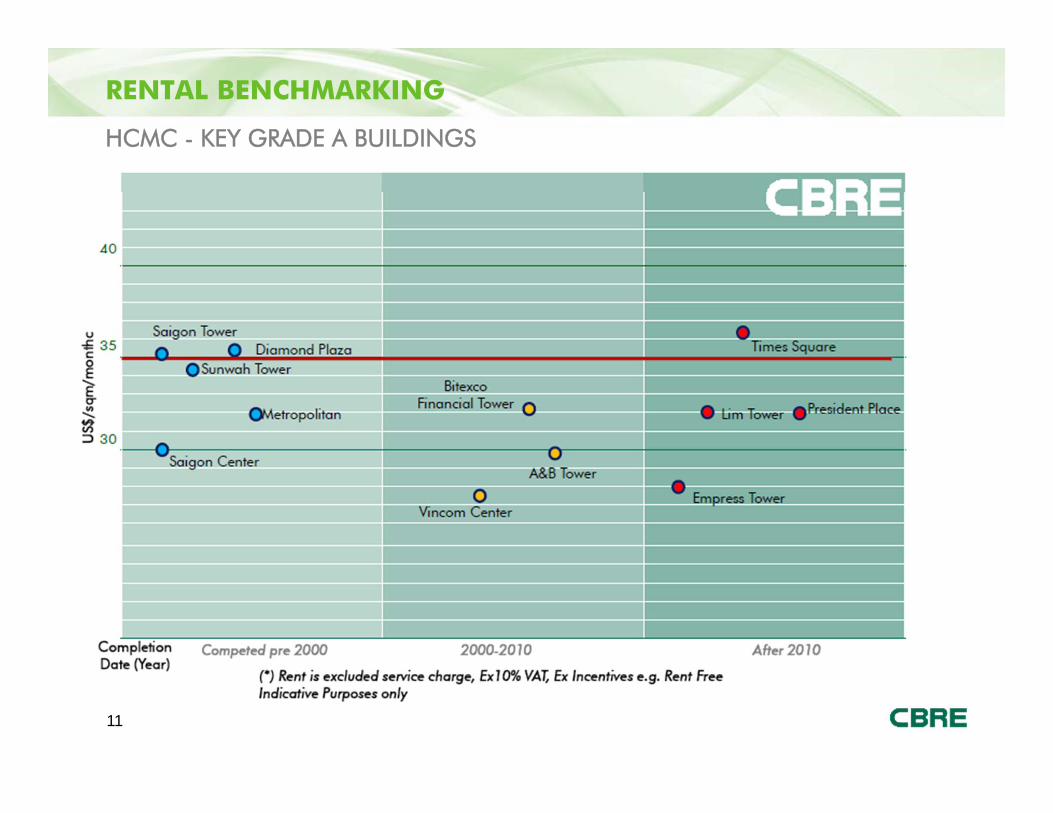
RENTAL BENCHMARKING
HCMC - KEY GRADE A BUILDINGS
12
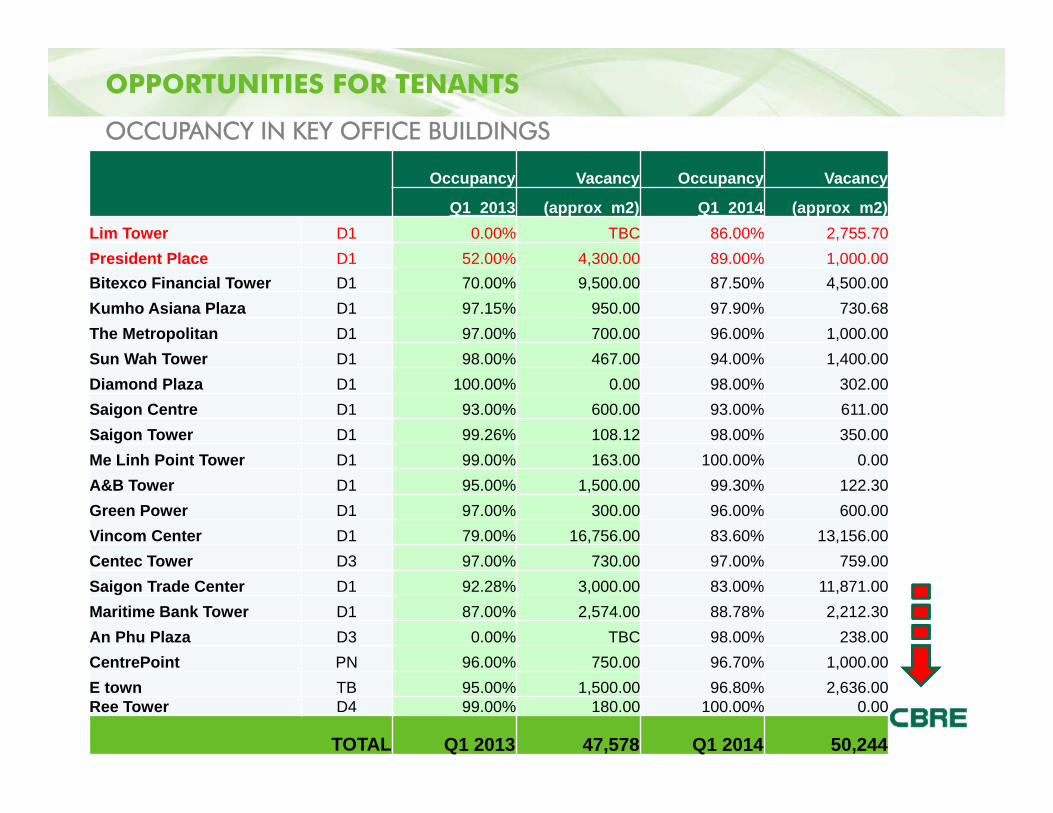
Occupancy Vacancy Occupancy Vacancy
Q1 2013 (approx m2) Q1 2014 (approx m2)Lim Tower D1 0.00% TBC 86.00% 2,755.70 President Place D1 52.00% 4,300.00 89.00% 1,000.00 Bitexco Financial Tower D1 70.00% 9,500.00 87.50% 4,500.00 Kumho Asiana Plaza D1 97.15% 950.00 97.90% 730.68 The Metropolitan D1 97.00% 700.00 96.00% 1,000.00 Sun Wah Tower D1 98.00% 467.00 94.00% 1,400.00 Diamond Plaza D1 100.00% 0.00 98.00% 302.00 Saigon Centre D1 93.00% 600.00 93.00% 611.00 Saigon Tower D1 99.26% 108.12 98.00% 350.00 Me Linh Point Tower D1 99.00% 163.00 100.00% 0.00 A&B Tower D1 95.00% 1,500.00 99.30% 122.30 Green Power D1 97.00% 300.00 96.00% 600.00 Vincom Center D1 79.00% 16,756.00 83.60% 13,156.00 Centec Tower D3 97.00% 730.00 97.00% 759.00 Saigon Trade Center D1 92.28% 3,000.00 83.00% 11,871.00 Maritime Bank Tower D1 87.00% 2,574.00 88.78% 2,212.30 An Phu Plaza D3 0.00% TBC 98.00% 238.00 CentrePoint PN 96.00% 750.00 96.70% 1,000.00 E town TB 95.00% 1,500.00 96.80% 2,636.00 Ree Tower D4 99.00% 180.00 100.00% 0.00
TOTAL Q1 2013 47,578 Q1 2014 50,244
OPPORTUNITIES FOR TENANTS
OCCUPANCY IN KEY OFFICE BUILDINGS

13
OPPORTUNITIES FOR TENANTSOCCUPANCY IN KEY OFFICE BUILDINGS
Occupancy%Q1 2013 vs Q1 2014
0.00%
20.00%
40.00%
60.00%
80.00%
100.00%
Q1 2013
Q1 2014
14
MARKET OVERVIEW - HANOI
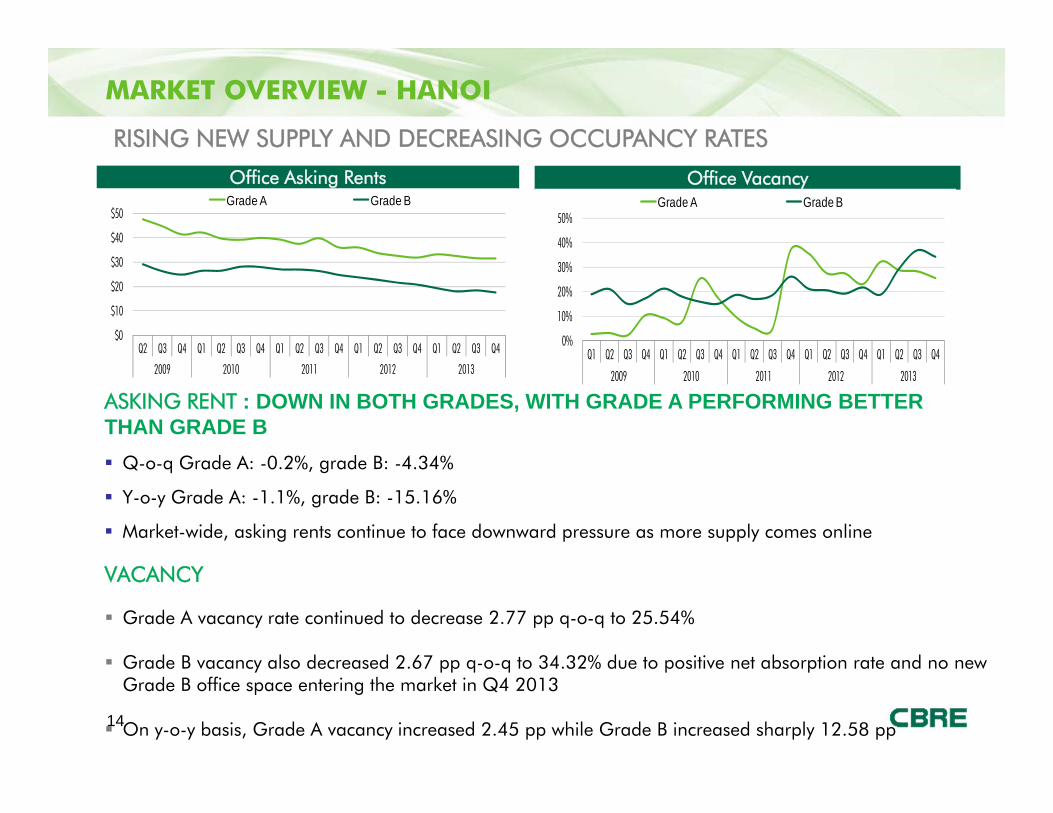
RISING NEW SUPPLY AND DECREASING OCCUPANCY RATES
ASKING RENT : DOWN IN BOTH GRADES, WITH GRADE A PERFORMING BETTER THAN GRADE B Q-o-q Grade A: -0.2%, grade B: -4.34%
Y-o-y Grade A: -1.1%, grade B: -15.16%
Market-wide, asking rents continue to face downward pressure as more supply comes online
VACANCY
Grade A vacancy rate continued to decrease 2.77 pp q-o-q to 25.54%
Grade B vacancy also decreased 2.67 pp q-o-q to 34.32% due to positive net absorption rate and no newGrade B office space entering the market in Q4 2013
On y-o-y basis, Grade A vacancy increased 2.45 pp while Grade B increased sharply 12.58 pp
Office Asking Rents Office Vacancy
$0
$10
$20
$30
$40
$50
Q2 Q3 Q4 Q1 Q2 Q3 Q4 Q1 Q2 Q3 Q4 Q1 Q2 Q3 Q4 Q1 Q2 Q3 Q4
2009 2010 2011 2012 2013
Grade A Grade B
0%
10%
20%
30%
40%
50%
Q1 Q2 Q3 Q4 Q1 Q2 Q3 Q4 Q1 Q2 Q3 Q4 Q1 Q2 Q3 Q4 Q1 Q2 Q3 Q4
2009 2010 2011 2012 2013
Grade A Grade B

HOW TO “BEAT THE CYCLE?”

16
17
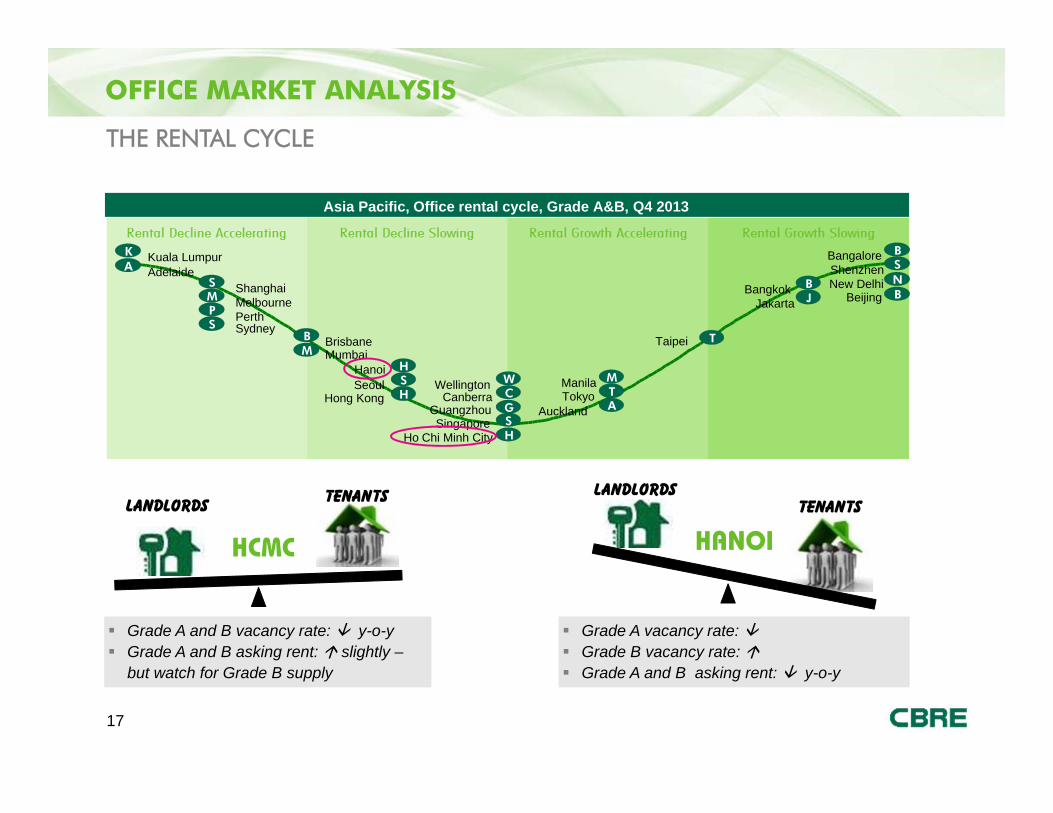
Asia Pacific, Office rental cycle, Grade A&B, Q4 2013
Shanghai New DelhiAdelaide
Guangzhou
Hanoi
Shenzhen
Tokyo
Melbourne
Singapore
Manila
Taipei
Auckland
Kuala Lumpur
Brisbane
Beijing
Seoul
Ho Chi Minh City
Jakarta
Hong Kong
Bangkok
Canberra
PerthSydney
Wellington
BangaloreAK
MS
HSGCW
ATM
T
JB
B
SN
PS
HS
B
H
M
B
Mumbai
HCMCLandlords TENANTs
Grade A and B vacancy rate: y-o-y Grade A and B asking rent: slightly –
but watch for Grade B supply
HANOITENANTs
Landlords
Grade A vacancy rate: Grade B vacancy rate: Grade A and B asking rent: y-o-y
OFFICE MARKET ANALYSIS
THE RENTAL CYCLE
18
OFFICE MARKET ANALYSIS
2013 IN REVIEW
5%
95%
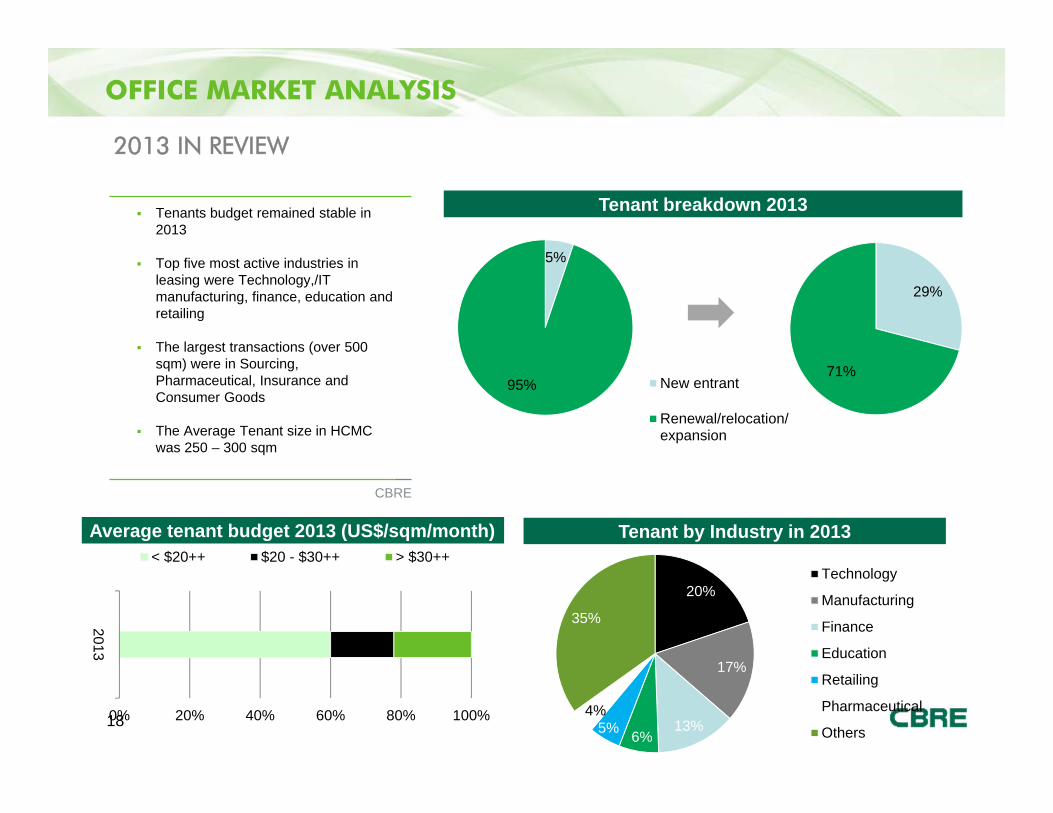
Tenant breakdown 2013
Average tenant budget 2013 (US$/sqm/month) Tenant by Industry in 2013
29%
71%New entrant
Renewal/relocation/expansion
Tenants budget remained stable in 2013
Top five most active industries in leasing were Technology,/IT manufacturing, finance, education and retailing
The largest transactions (over 500 sqm) were in Sourcing, Pharmaceutical, Insurance and Consumer Goods
The Average Tenant size in HCMC was 250 – 300 sqm
CBRE
0% 20% 40% 60% 80% 100%
2013
< $20++ $20 - $30++ > $30++
20%
17%
13%6%5%
4%
35%
Technology
Manufacturing
Finance
Education
Retailing
Pharmaceutical
Others
TENANT PROFILING – HCMC
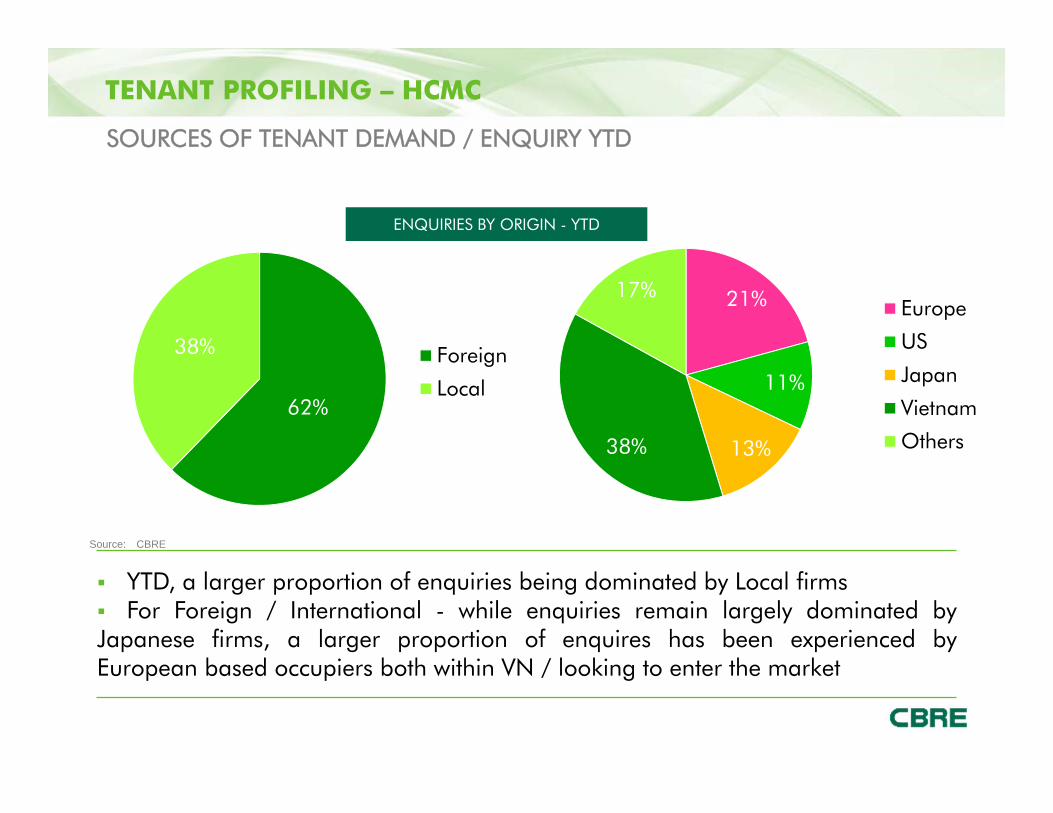
YTD, a larger proportion of enquiries being dominated by Local firms For Foreign / International - while enquiries remain largely dominated byJapanese firms, a larger proportion of enquires has been experienced byEuropean based occupiers both within VN / looking to enter the market
ENQUIRIES BY ORIGIN - YTD
Source: CBRE
62%
38% Foreign
Local
21%
11%
13%38%
17%Europe
US
Japan
Vietnam
Others
SOURCES OF TENANT DEMAND / ENQUIRY YTD

20
BUDGET & LOCATION TRENDS YTD
51.2%$1k-2k
BUDGET
LOCATION
TENANT PROFILING – HCMC
< $20 ++ • 77%
< $20 - $30 ++ • 23%
CBD • 73%
Source: CBRE
77%
23%
<$20
$20 - < $30
NON CBD • 27%73%
27%CBD
Non CBDNON CBD • 27%
21
51.2%$1k-2k
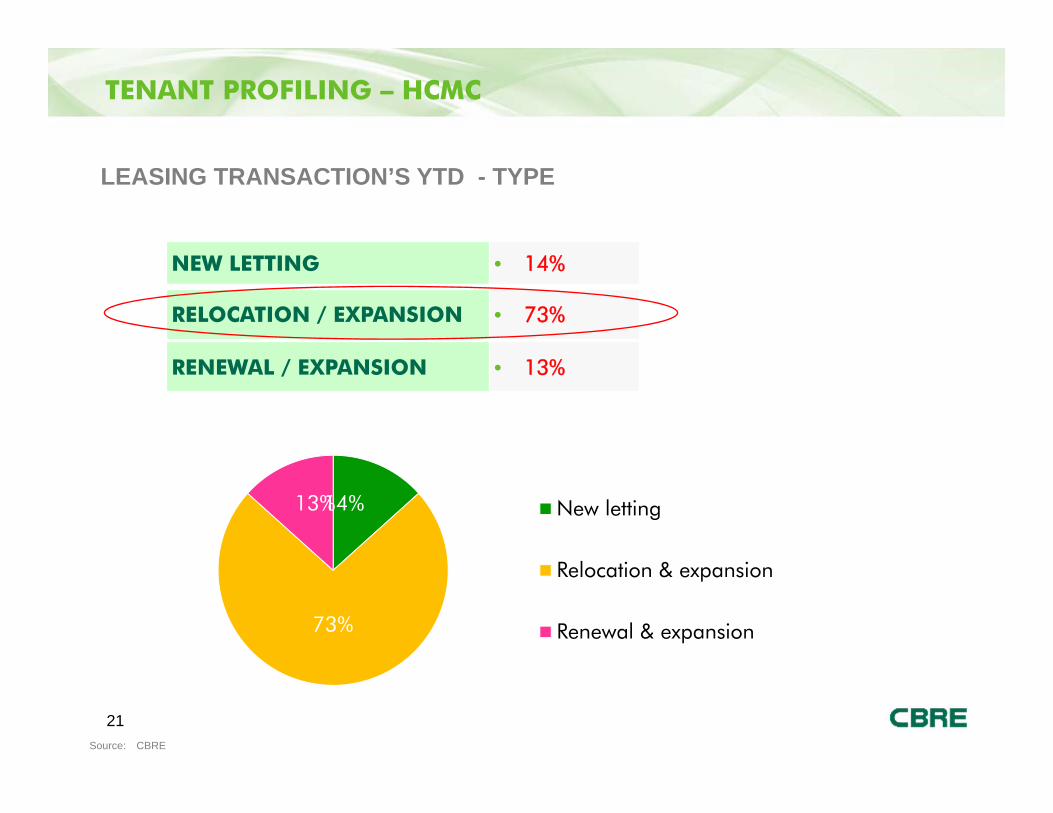
LEASING TRANSACTION’S YTD - TYPE
NEW LETTING • 14%
RELOCATION / EXPANSION • 73%
RENEWAL / EXPANSION • 13%
TENANT PROFILING – HCMC
Source: CBRE
14%
73%
13% New letting
Relocation & expansion
Renewal & expansion

22
STANDARD INCENTIVES REQUIRED TO ENCOURAGE TENANTS TO LEASE
1. Rent free period2. Parking 3. Fit out period4. Rental Cap and Collar 5. Reinstatement Provisions 6. Cleaning services – Discounted / offering of internal unit cleaning as part
of Service Charge7. Out of out-of-hours air-conditioning8. Upfront Rental Payment
ADDITIONAL INCENTIVES & EXPECTATIONS FROM TENANTS TO “SEAL THE DEAL”
1. Option to Renew 2. Early termination right 3. Bank guarantees Vs deposit 4. First Right of Refusal
POTENTIAL TENANT INCENTIVES – OTHER THAN RENT

TENANT PROFILING
23
1. TYPE OF BUSINESS • Industry type can define location• E.g. Banking / Finance D1. Call centre non CBD
2. LENGTH OF TENANCY • Current lease term length
3. REASON FOR MOVING • Expansion? Consolidation? Cost
4. CURRENT REQUIREMENTS• Understanding current needs and whether
existing size / accommodation suitable.• Current location, space, head count, expiry etc
5. FUTURE REQUIREMENTS• Headcount, location, space sqm, building grade
desired, operational date, operational hours, IT provider etc
6. PARKING • No. of car and motorbike
7. BUDGET • Monthly / p/sqm
8. OTHER OPERATIONAL FACTORS • Security, Back Up Power, IT. Fire & Safety, Signage
KEY FACTORS TO UNDERSTAND BEFORE MOVING
TENANT PROFILING
24
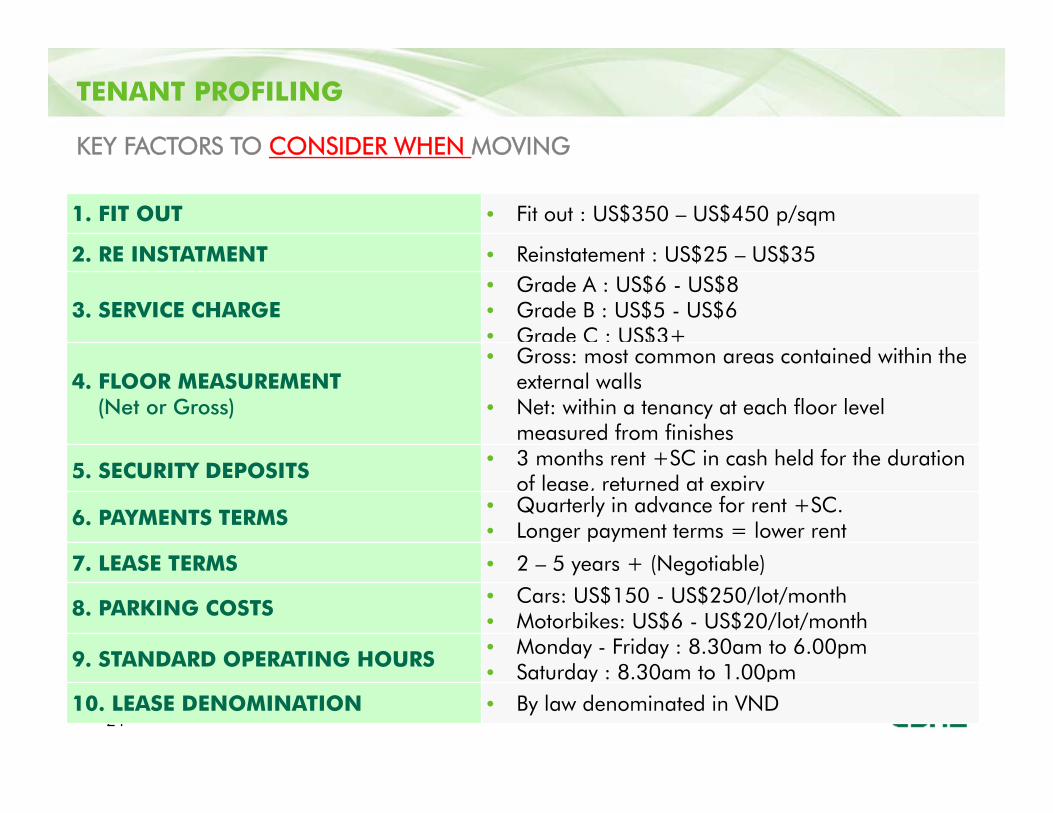
1. FIT OUT • Fit out : US$350 – US$450 p/sqm
KEY FACTORS TO CONSIDER WHEN MOVING
2. RE INSTATMENT • Reinstatement : US$25 – US$35
3. SERVICE CHARGE• Grade A : US$6 - US$8• Grade B : US$5 - US$6• Grade C : US$3+
4. FLOOR MEASUREMENT(Net or Gross)
• Gross: most common areas contained within the external walls
• Net: within a tenancy at each floor level measured from finishes
5. SECURITY DEPOSITS • 3 months rent +SC in cash held for the duration of lease, returned at expiry
6. PAYMENTS TERMS • Quarterly in advance for rent +SC. • Longer payment terms = lower rent
7. LEASE TERMS • 2 – 5 years + (Negotiable)
8. PARKING COSTS • Cars: US$150 - US$250/lot/month• Motorbikes: US$6 - US$20/lot/month
9. STANDARD OPERATING HOURS • Monday - Friday : 8.30am to 6.00pm• Saturday : 8.30am to 1.00pm
10. LEASE DENOMINATION • By law denominated in VND
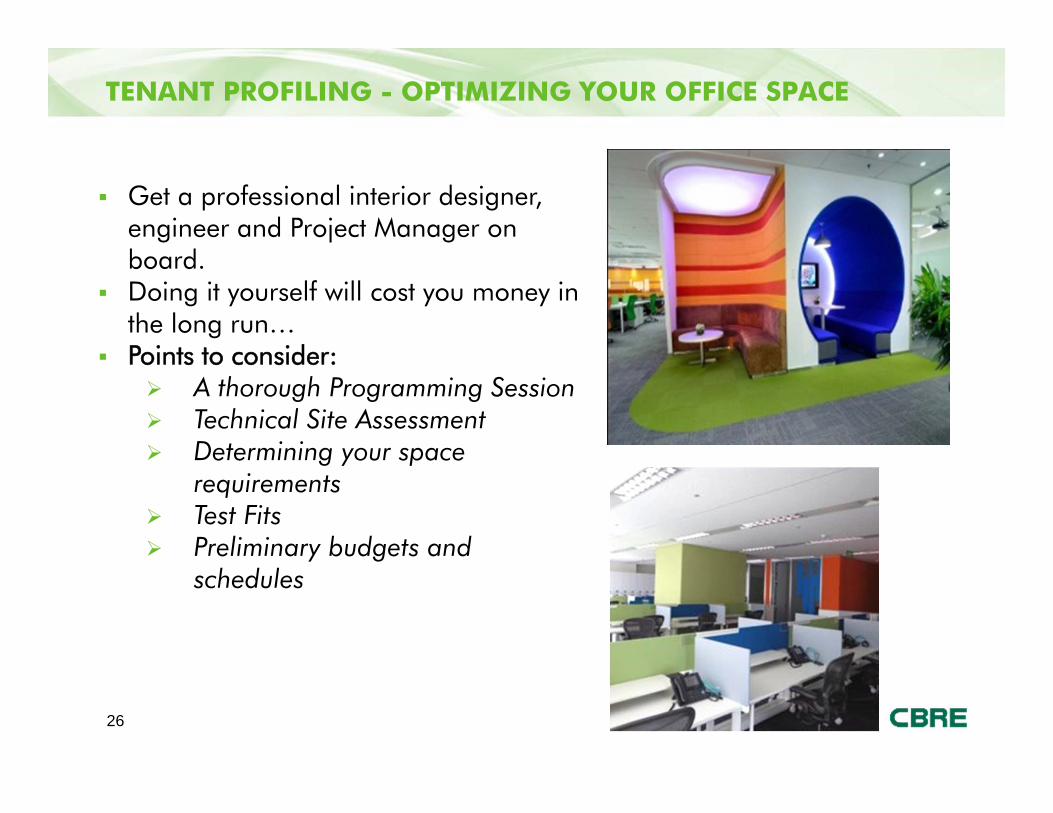
TENANT PROFILING - OPTIMIZING YOUR OFFICE SPACE
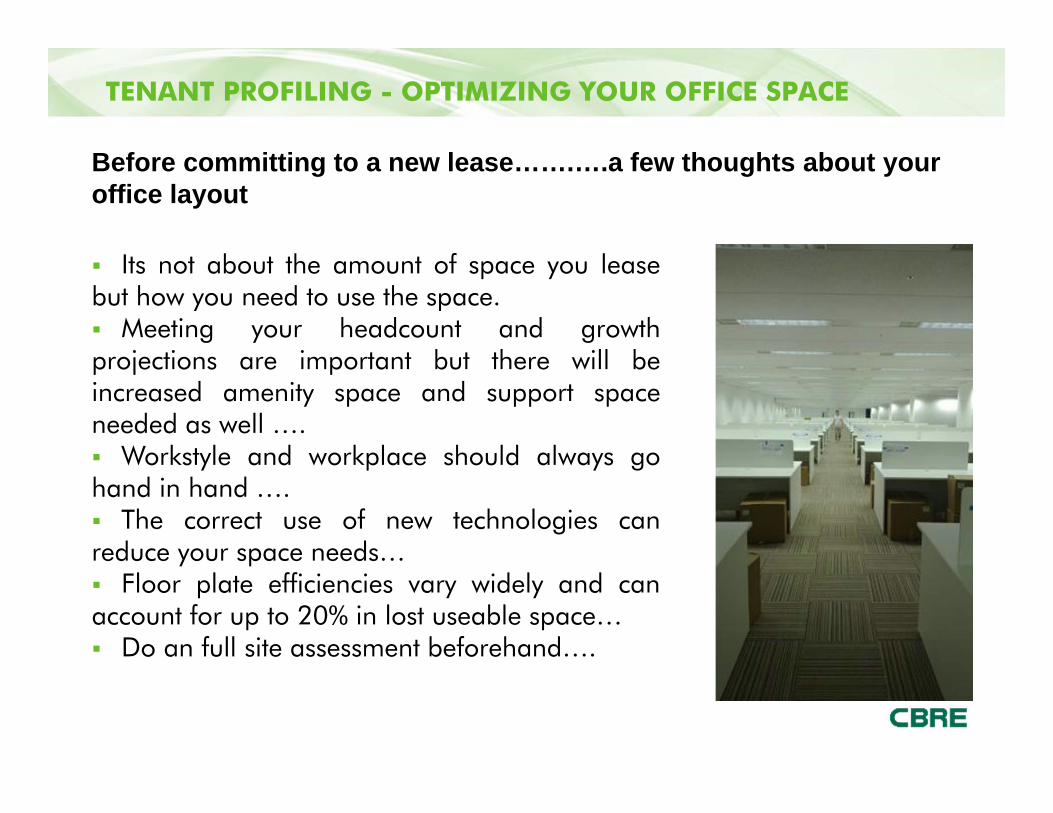
Its not about the amount of space you leasebut how you need to use the space. Meeting your headcount and growthprojections are important but there will beincreased amenity space and support spaceneeded as well …. Workstyle and workplace should always gohand in hand …. The correct use of new technologies canreduce your space needs… Floor plate efficiencies vary widely and canaccount for up to 20% in lost useable space… Do an full site assessment beforehand….
Before committing to a new lease…….….a few thoughts about your office layout
26
Get a professional interior designer, engineer and Project Manager on board.
Doing it yourself will cost you money in the long run…
Points to consider: A thorough Programming Session Technical Site Assessment Determining your space
requirements Test Fits Preliminary budgets and
schedules
TENANT PROFILING - OPTIMIZING YOUR OFFICE SPACE

OUTLOOK & PREDICTIONS2014 +

28
29
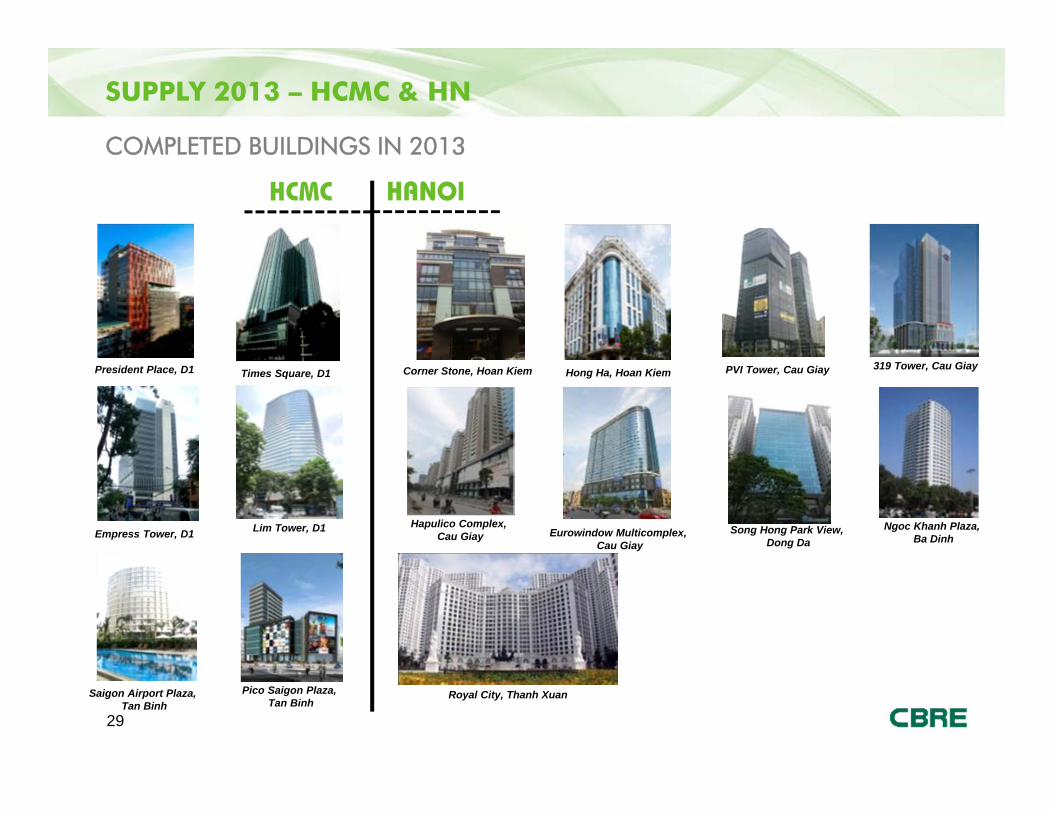
SUPPLY 2013 – HCMC & HN
COMPLETED BUILDINGS IN 2013
President Place, D1
HCMC HANOI
Lim Tower, D1
Saigon Airport Plaza, Tan Binh
Corner Stone, Hoan Kiem PVI Tower, Cau Giay
Eurowindow Multicomplex, Cau Giay
Empress Tower, D1
Times Square, D1
Pico Saigon Plaza, Tan Binh
Song Hong Park View, Dong Da
Hong Ha, Hoan Kiem 319 Tower, Cau Giay
Hapulico Complex, Cau Giay
Ngoc Khanh Plaza, Ba Dinh
Royal City, Thanh Xuan
30
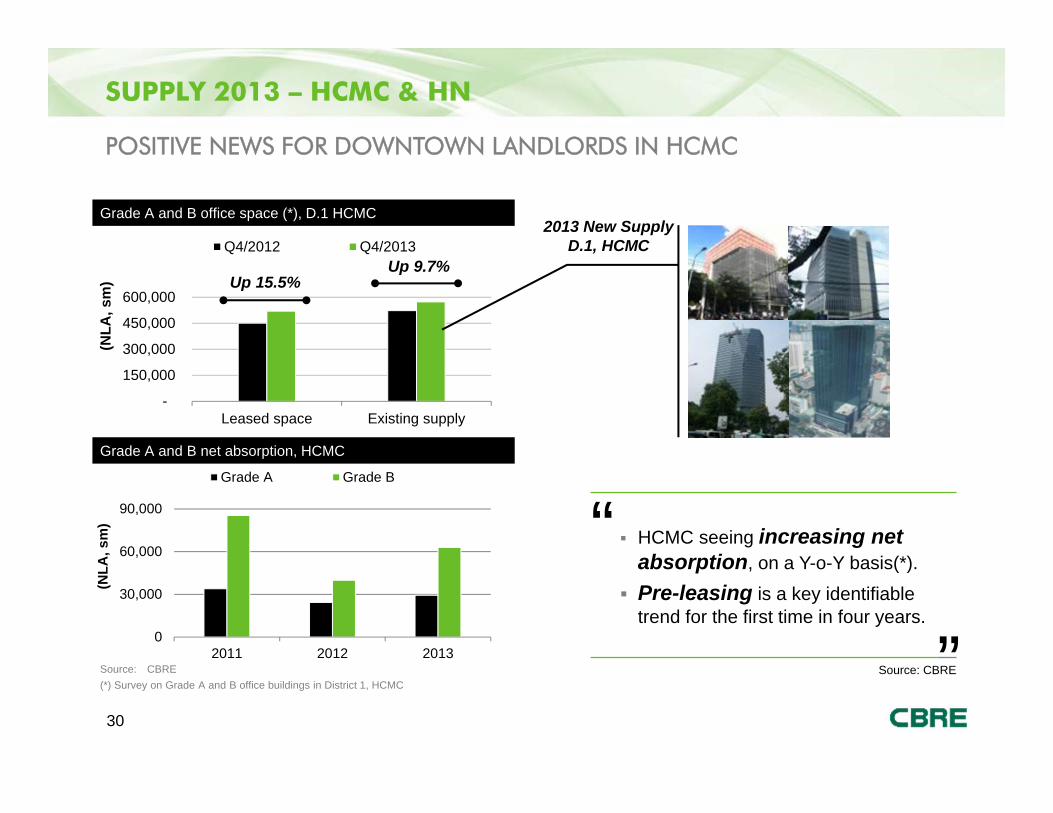
SUPPLY 2013 – HCMC & HN
POSITIVE NEWS FOR DOWNTOWN LANDLORDS IN HCMC
Source: CBRE
Grade A and B office space (*), D.1 HCMC
(*) Survey on Grade A and B office buildings in District 1, HCMC
-
150,000
300,000
450,000
600,000
Leased space Existing supply
(NLA
, sm
)
Q4/2012 Q4/2013Up 9.7%
Up 15.5%
2013 New Supply D.1, HCMC
Grade A and B net absorption, HCMC
0
30,000
60,000
90,000
2011 2012 2013
(NLA
, sm
)
Grade A Grade B
“ HCMC seeing increasing net absorption, on a Y-o-Y basis(*).
Pre-leasing is a key identifiable trend for the first time in four years.
”Source: CBRE

31
SUPPLY YTD – HCMC 2014 PIPELINE
CURRENT & FUTURE SUPPLY
0
100,000
200,000
300,000
400,000
500,000
Q1 Q2 Q3 Q4 Q1 Q2 Q3 Q4 Q1 Q2 Q3 Q4 Q1 Q2 Q3 Q4 Q1 Q2 Q3 Q4
2010 2011 2012 2013 2014
Gross Flo
or Area
(sm)
Exisitng supply Future supply Total GFA
0
200,000
400,000
600,000
800,000
1,000,000
Q1 Q2 Q3 Q4 Q1 Q2 Q3 Q4 Q1 Q2 Q3 Q4 Q1 Q2 Q3 Q4 Q1 Q2 Q3 Q4
2010 2011 2012 2013 2014
Gross F
loor Are
a (sm)
Exisitng supply New supply Total GFA
GRADE A
GRADE B
32
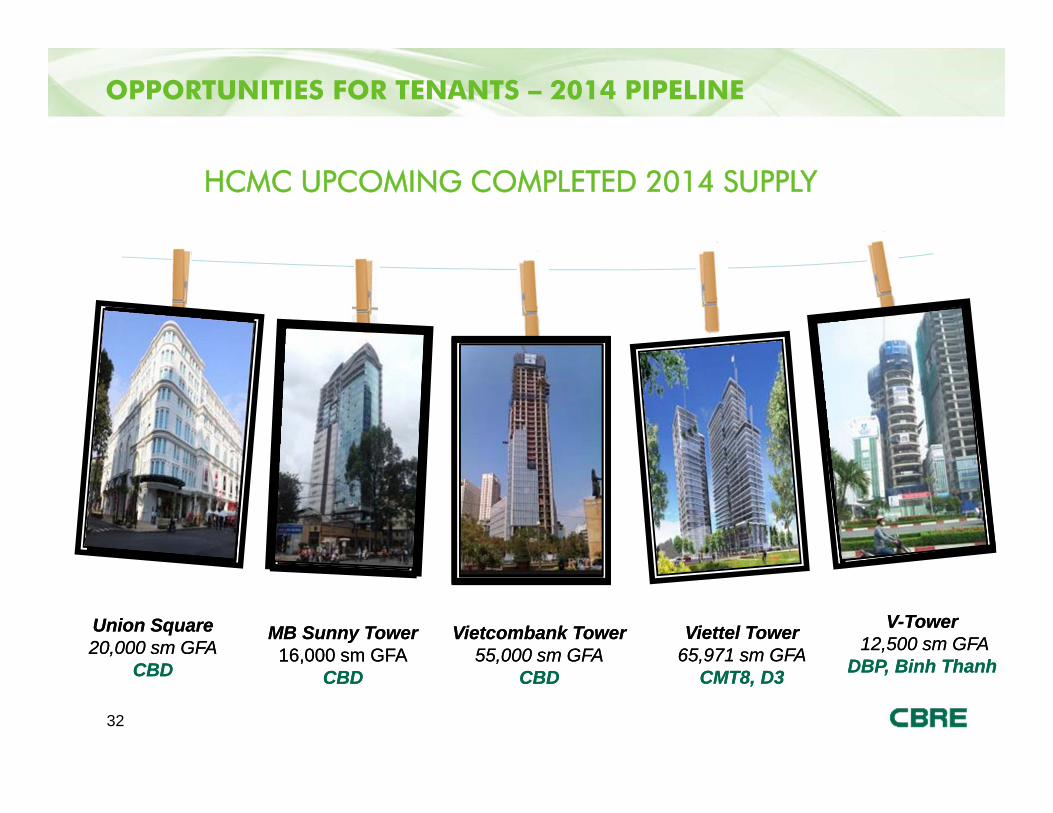
Union Square20,000 sm GFA
CBD
Union Square20,000 sm GFA
CBD
Vietcombank Tower55,000 sm GFA
CBD
Vietcombank Tower55,000 sm GFA
CBD
MB Sunny Tower16,000 sm GFA
CBD
MB Sunny Tower16,000 sm GFA
CBD
HCMC UPCOMING COMPLETED 2014 SUPPLY
Viettel Tower65,971 sm GFA
CMT8, D3
Viettel Tower65,971 sm GFA
CMT8, D3
OPPORTUNITIES FOR TENANTS – 2014 PIPELINE
V-Tower 12,500 sm GFA
DBP, Binh Thanh
V-Tower 12,500 sm GFA
DBP, Binh Thanh
33
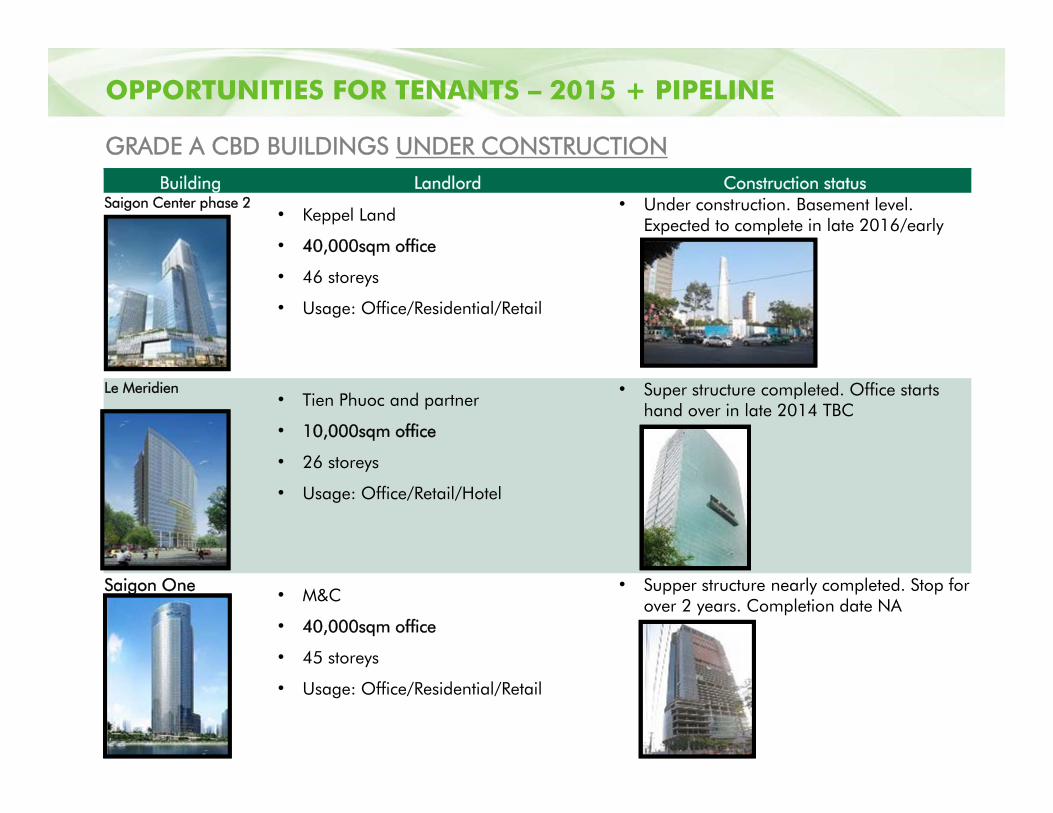
Building Landlord Construction statusSaigon Center phase 2
• Keppel Land
• 40,000sqm office
• 46 storeys
• Usage: Office/Residential/Retail
• Under construction. Basement level. Expected to complete in late 2016/early 2017
Le Meridien• Tien Phuoc and partner
• 10,000sqm office
• 26 storeys
• Usage: Office/Retail/Hotel
• Super structure completed. Office startshand over in late 2014 TBC
Saigon One • M&C
• 40,000sqm office
• 45 storeys
• Usage: Office/Residential/Retail
• Supper structure nearly completed. Stop for over 2 years. Completion date NA
OPPORTUNITIES FOR TENANTS – 2015 + PIPELINE
GRADE A CBD BUILDINGS UNDER CONSTRUCTION

34
Building Landlord Construction updateViettel
• Viettel Corporation
• 45,000sqm office
• 33 storeys
• Usage: Office/ Retails
• Under construction up to 20th
floor, aim to complete Q1 2015. Q4 2014 handover
SSG Tower• SSG Group
• 35,000sqm office
• Block 1: 27 storeys. Block 2: 19 storeys. 5
commercial storeys
• Usage: Office/ Apartment/ Retails
• Under construction up to 10th
floor. Expected to complete in Q1 2015 for handover
Lim Tower 2 • Hoa Lam
• 20,000sqm office
• 22 storeys
• Usage: Office/ Retails
• Under construction up to 3rd
level. Expected to complete in Q1 2015 for handover
OPPORTUNITIES FOR TENANTS – 2014 / 2015 + PIPELINE
MAJOR DECENTRALISED BUILDINGS UNDER CONSTRUCTION

Source: CBRE
WHAT DOES THE FUTURE HOLD? OUTLOOK ...

36
Pre-commitments in 2014. Only 4 buildings (A and B Grade)combined in the HCMC CBD have a floor plate over 1,000 sqm
In District 1, 10 buildings (A and B Grade) can provide over 1,000sqm of available space today
7 are Grade A buildings and only 3 Grade B buildings. MB SunnyTower is one of those Grade B buildings
Of the 7, only 3 buildings in District 1 can provide contiguous spaceover 1,000 sqm (in one line)
This means, VERY few options for MNCs seeking internationalstandard, quality buildings with large availability un til the end of2014
50% of the 175+ NEW Small-Medium sized buildings are beingbuilt by SOEs and 50% are for owner occupation
For large Tenants planning an occupancy solution, the market willremain tight until the end of 2014 as a result Rent levels will remainstable at least until Q1 2015 when the next wave of supply comesonline
WHAT DOES THE FUTURE HOLD? OUTLOOK ...
MB SUNNY TOWER
38
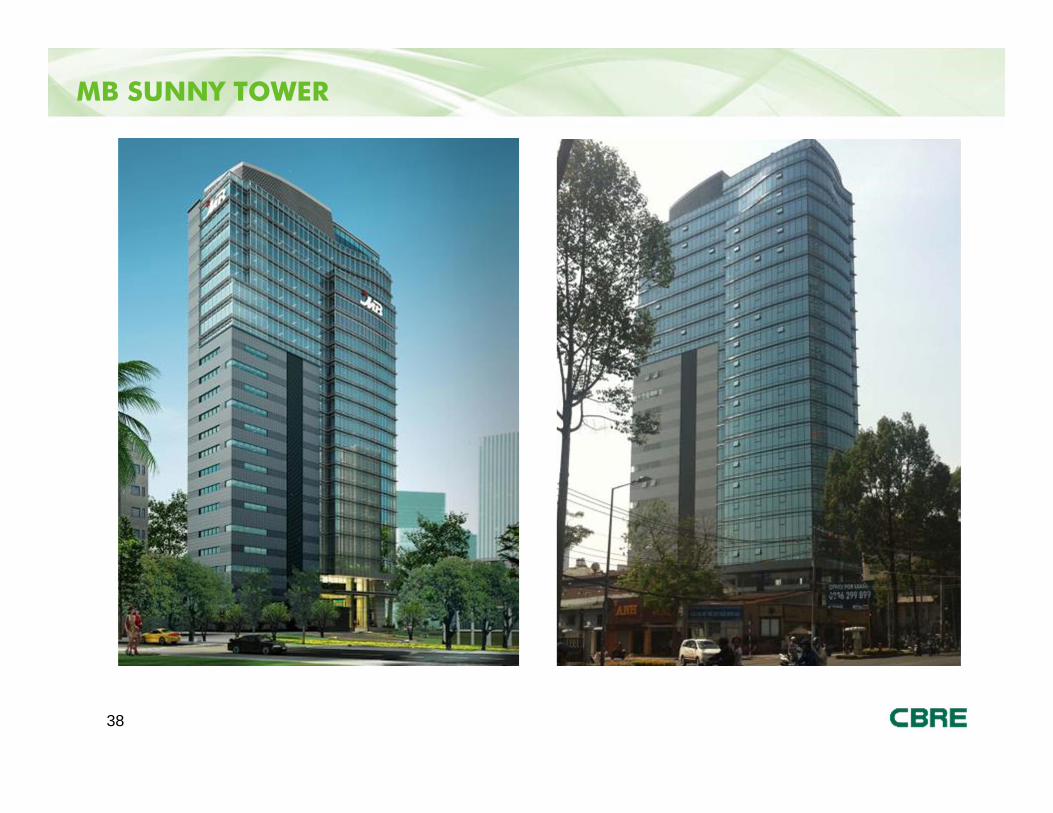
MB SUNNY TOWER

39
Prime location, positioned one of the main arterial roads of HCMC,connecting the CBD - D.1 and D.3 ,D.4, D5 with easy access from all districts Within a 1.5 km radius positioned opposite the newly completed 5 starPullman Hotel.
MB SUNNY TOWER – PRIME LOCATION
Panoramic city view
40
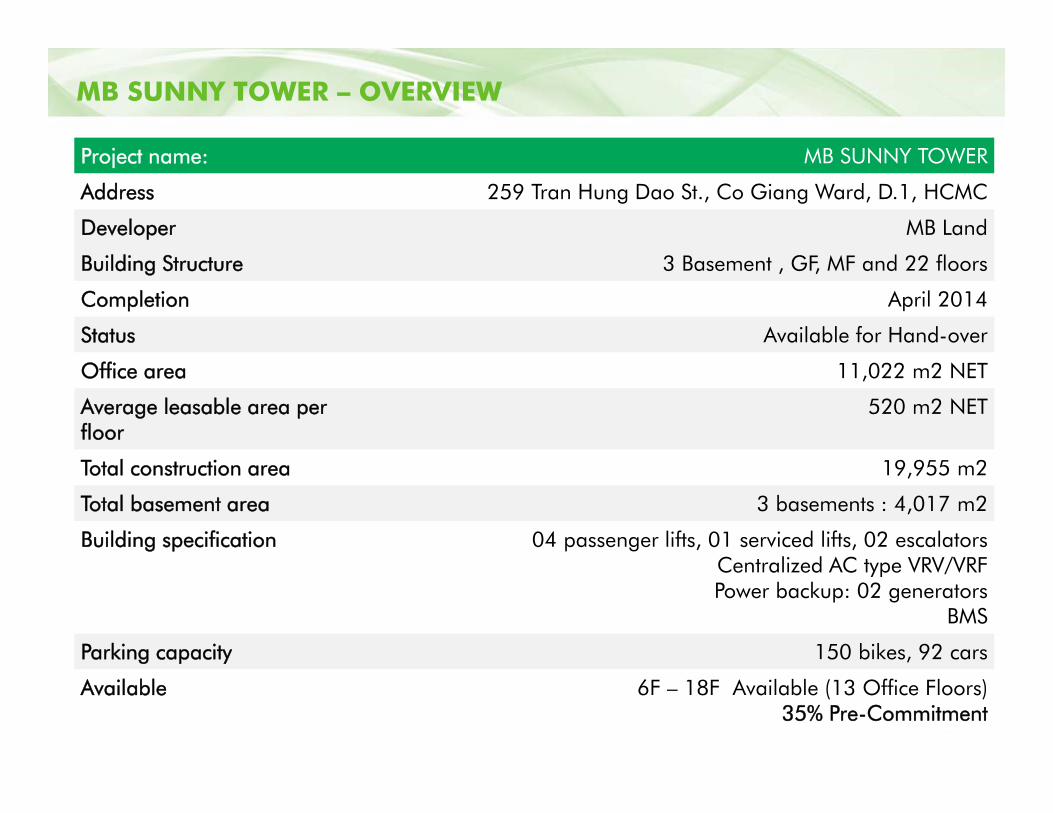
MB SUNNY TOWER – OVERVIEW
Project name: MB SUNNY TOWER
Address 259 Tran Hung Dao St., Co Giang Ward, D.1, HCMC
Developer MB Land
Building Structure 3 Basement , GF, MF and 22 floors
Completion April 2014
Status Available for Hand-over
Office area 11,022 m2 NET
Average leasable area per floor
520 m2 NET
Total construction area 19,955 m2
Total basement area 3 basements : 4,017 m2
Building specification 04 passenger lifts, 01 serviced lifts, 02 escalatorsCentralized AC type VRV/VRF Power backup: 02 generators
BMS
Parking capacity 150 bikes, 92 cars
Available 6F – 18F Available (13 Office Floors)35% Pre-Commitment
41
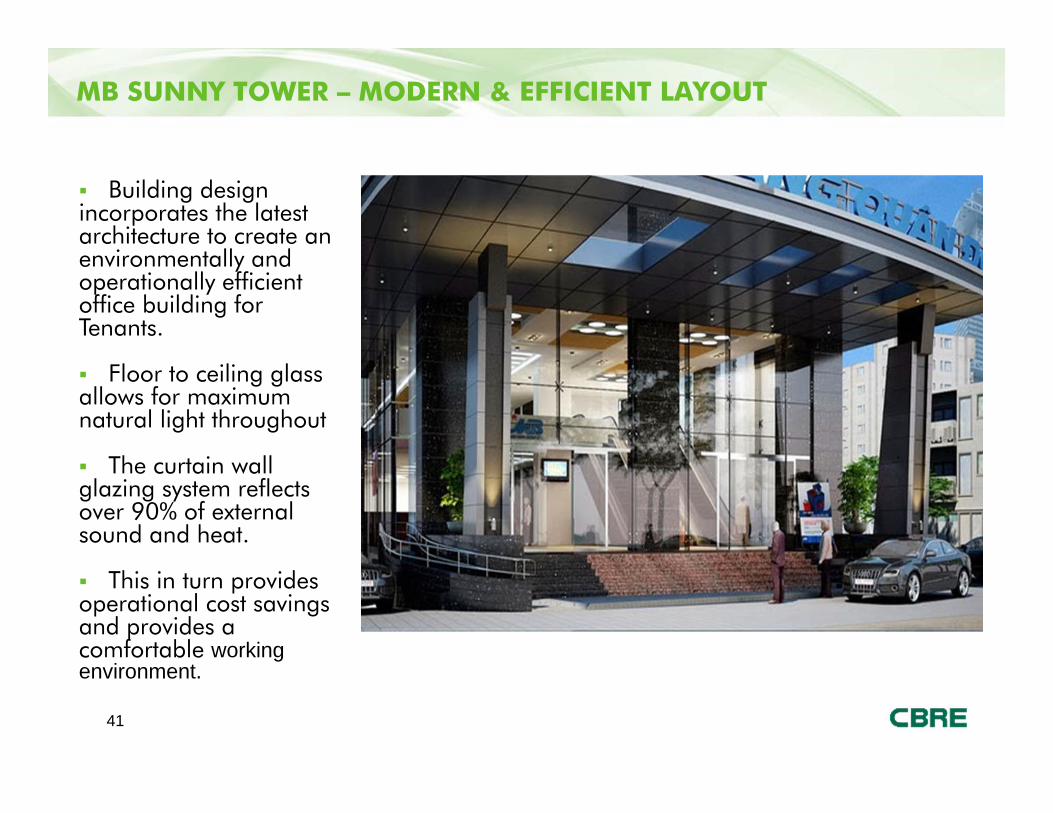
Building design incorporates the latest architecture to create an environmentally and operationally efficient office building for Tenants.
Floor to ceiling glass allows for maximum natural light throughout
The curtain wall glazing system reflects over 90% of external sound and heat.
This in turn provides operational cost savings and provides a comfortable working environment.
MB SUNNY TOWER – MODERN & EFFICIENT LAYOUT
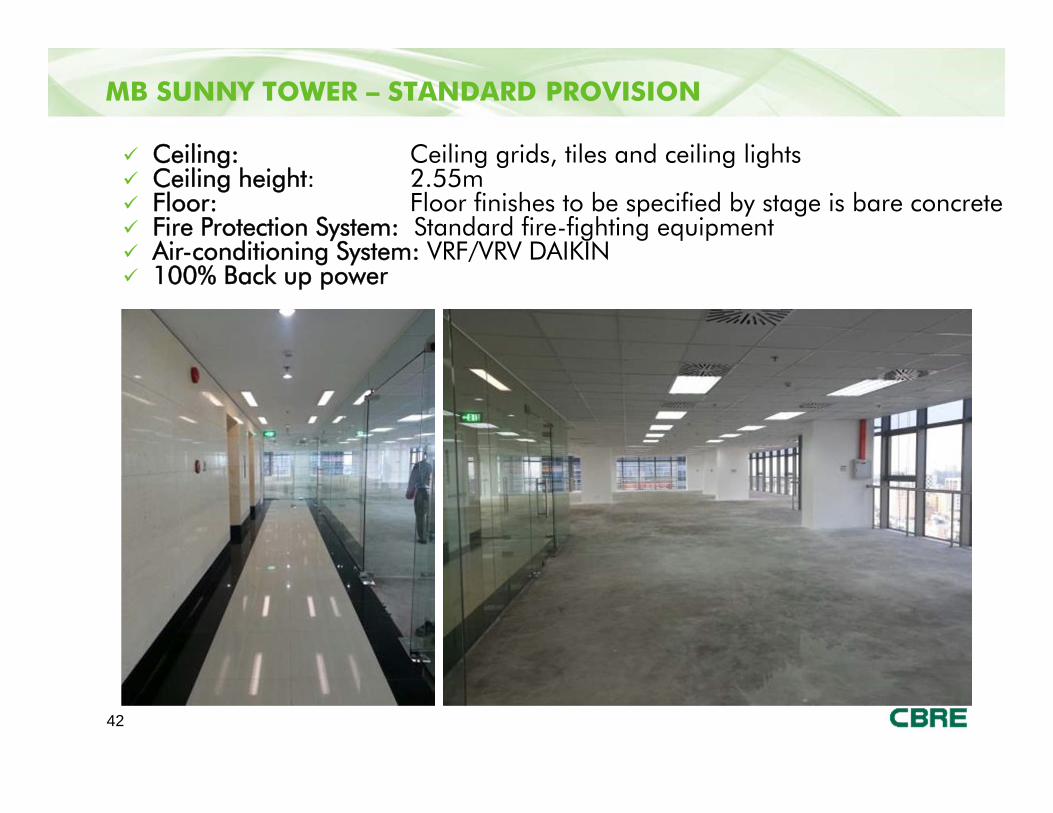
MB SUNNY TOWER – STANDARD PROVISION
42
Ceiling: Ceiling grids, tiles and ceiling lights Ceiling height: 2.55m Floor: Floor finishes to be specified by stage is bare concrete. Fire Protection System: Standard fire-fighting equipment Air-conditioning System: VRF/VRV DAIKIN 100% Back up power
43
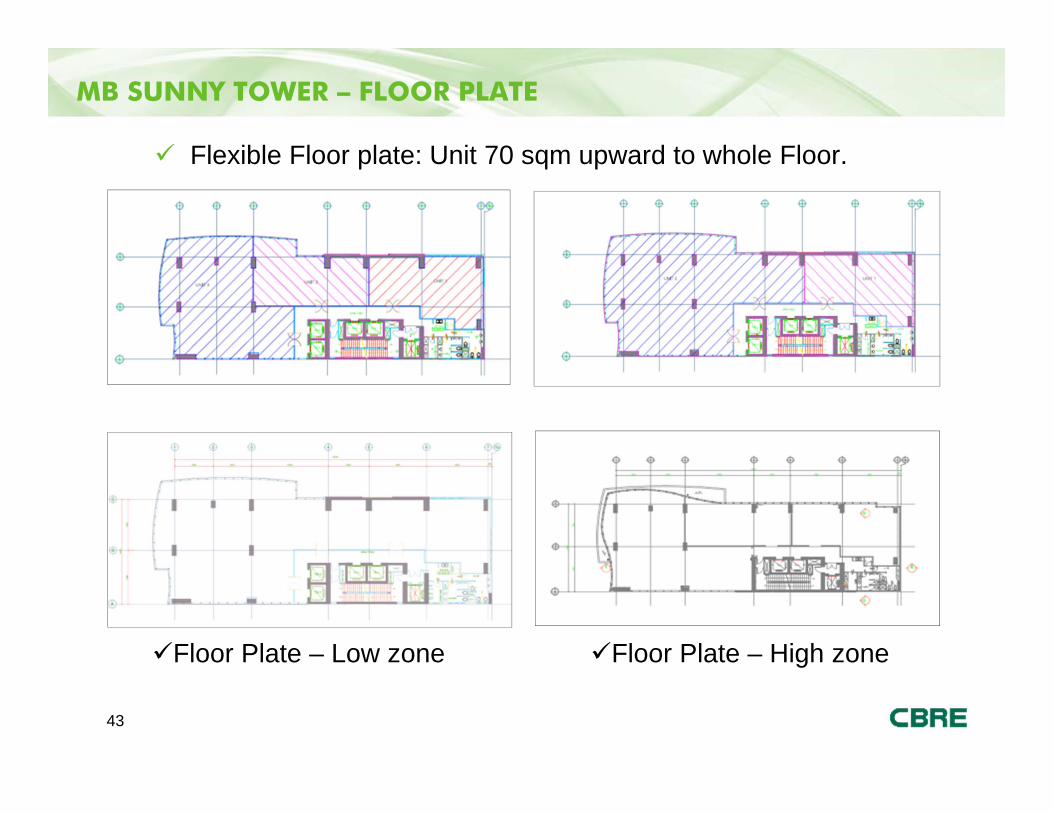
MB SUNNY TOWER – FLOOR PLATE
Flexible Floor plate: Unit 70 sqm upward to whole Floor.
Floor Plate – Low zone Floor Plate – High zone
44
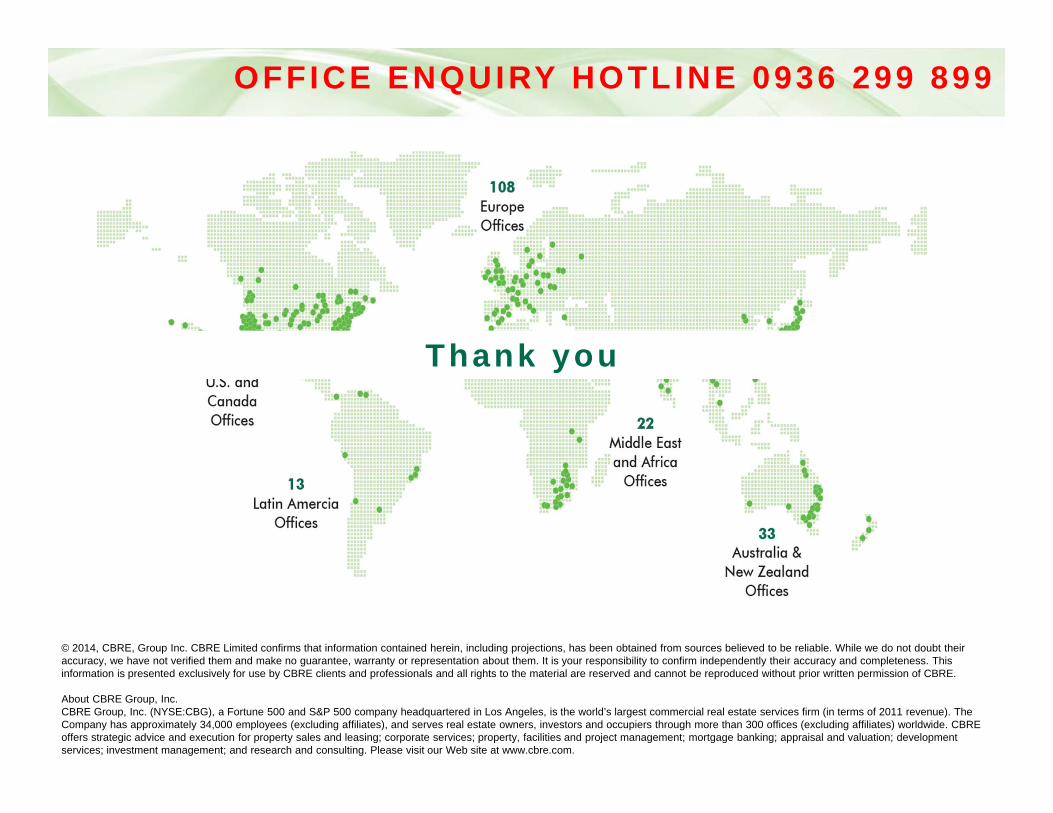
© 2014, CBRE, Group Inc. CBRE Limited confirms that information contained herein, including projections, has been obtained from sources believed to be reliable. While we do not doubt their accuracy, we have not verified them and make no guarantee, warranty or representation about them. It is your responsibility to confirm independently their accuracy and completeness. This information is presented exclusively for use by CBRE clients and professionals and all rights to the material are reserved and cannot be reproduced without prior written permission of CBRE.
About CBRE Group, Inc.CBRE Group, Inc. (NYSE:CBG), a Fortune 500 and S&P 500 company headquartered in Los Angeles, is the world’s largest commercial real estate services firm (in terms of 2011 revenue). The Company has approximately 34,000 employees (excluding affiliates), and serves real estate owners, investors and occupiers through more than 300 offices (excluding affiliates) worldwide. CBRE offers strategic advice and execution for property sales and leasing; corporate services; property, facilities and project management; mortgage banking; appraisal and valuation; development services; investment management; and research and consulting. Please visit our Web site at www.cbre.com.
OFFICE ENQUIRY HOTLINE 0936 299 899
Thank you