


Languages
Pages
Legal

Capital CarShare Business Plan
July 2012
Ch
apte
r: A
ckn
ow
led
gm
ents
1
Table of Contents
Acknowledgments ..................................................................................................................................... 3
1| Executive Summary .............................................................................................................................. 4
2| Industry Overview ................................................................................................................................ 7
History of Car Sharing ...................................................................................................................... 7
Car Sharing vs. Private Vehicle Ownership ................................................................................... 8
Car Sharing in the Capital Region ................................................................................................... 9
3| Membership Characteristics & Location Selection ......................................................................... 11
Target Car sharing Audience ......................................................................................................... 11
Car sharing Feasibility Index .......................................................................................................... 12
Site Selection ..................................................................................................................................... 16
Car Sharing Pod Location Criteria ................................................................................................. 20
Other Considerations....................................................................................................................... 20
4| Fleet Infrastructure ............................................................................................................................. 22
Ownership Method .......................................................................................................................... 22
Loanation ........................................................................................................................................... 22
Fuel Type ........................................................................................................................................... 23
Fleet Model Recommendations ...................................................................................................... 24
5| Technology & Services ....................................................................................................................... 26
Services .................................................................................................................................................. 27
6| Price Structure ..................................................................................................................................... 29
Competitive Analysis ...................................................................................................................... 29
Developing Capital CarShare Membership Plans ....................................................................... 31
Business Membership ...................................................................................................................... 32
Penalties & Fees ................................................................................................................................ 32
7| Organizational Structure .................................................................................................................... 34
For-Profit vs. Non-Profit ................................................................................................................. 34
Organizational Oversight ............................................................................................................... 34
Staffing ............................................................................................................................................... 34
Ch
apte
r: A
ckn
ow
led
gm
ents
2
8| Implementation & Future Growth.................................................................................................... 36
Growth Patterns ............................................................................................................................... 36
Implementation Timeframe ............................................................................................................ 36
9| Financial Outlook ................................................................................................................................ 38
Tables & Figures
Table 1: Cost of Vehicle Ownership vs. Car Sharing ............................................................................ 8
Table 2: Characteristics of Car-sharing members ................................................................................ 11
Table 3: Car sharing Feasibility Index - Indicators & Weightings .................................................... 13
Table 4: Potential Car-sharing Vehicle Models .................................................................................... 25
Table 5: Car sharing Membership Plan Comparison .......................................................................... 30
Table 6: Capital CarShare Membership Plan Tiers .............................................................................. 31
Table 7: Abbreviated Schedule of Fees ................................................................................................. 33
Table 8: Capital CarShare Financial Projections .................................................................................. 39
Ch
apte
r: A
ckn
ow
led
gm
ents
3
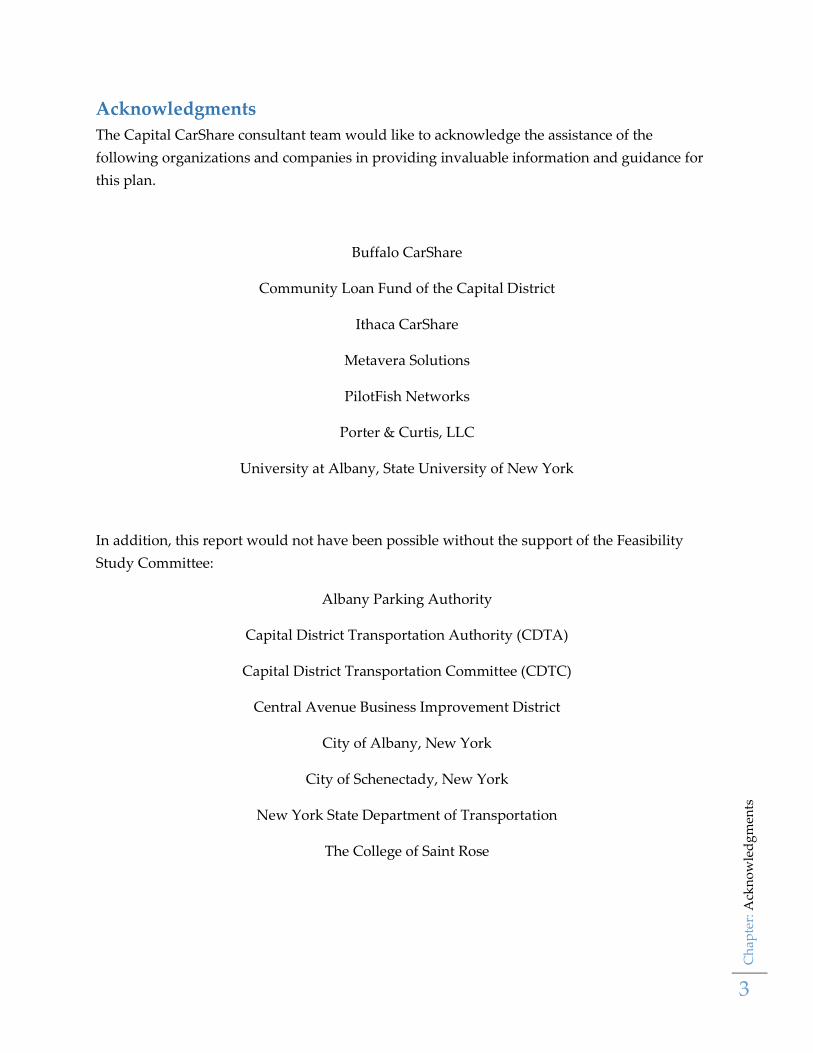
Acknowledgments
The Capital CarShare consultant team would like to acknowledge the assistance of the
following organizations and companies in providing invaluable information and guidance for
this plan.
Buffalo CarShare
Community Loan Fund of the Capital District
Ithaca CarShare
Metavera Solutions
PilotFish Networks
Porter & Curtis, LLC
University at Albany, State University of New York
In addition, this report would not have been possible without the support of the Feasibility
Study Committee:
Albany Parking Authority
Capital District Transportation Authority (CDTA)
Capital District Transportation Committee (CDTC)
Central Avenue Business Improvement District
City of Albany, New York
City of Schenectady, New York
New York State Department of Transportation
The College of Saint Rose

Ch
apte
r: 1
| E
xec
uti
ve
Su
mm
ary
4
1| Executive Summary
The Capital Region is quickly approaching a threshold: by the year 2040 our region is projected
to have over 884,831 residents, an increase of 140,000 residents from 19801. Recent estimates
from the U.S. Census Bureau show that during 2006 to 2010, 79.7% of Capital Region residents
commuted alone in their own vehicles2. As state offices and businesses begin to restack their
offices, parking (both on-street and private) which is already constrained in some places will
become increasingly contentious. At the same time, gas prices have continued to escalate, with
government projections showing continued elevated average gas prices over the next two
years3. Simply put, driving alone is getting more expensive and time-consuming; It’s time for an
alternative which helps residents and workers keep costs down while providing the flexibility
of vehicle ownership. This alternative is Capital CarShare, a comprehensive car sharing
organization designed to meet the transportation needs of Capital Region residents.
How does Car Sharing Work?
Car Sharing is a transportation innovation which gives subscribers the flexibility of having a
vehicle available for short-term trips, while freeing them from the financial and administrative
obligations of automobile ownership. Car sharing is largely self-service: subscribers reserve a
vehicle near their location using an online or telephone-based reservation system, access the
vehicle using their RFID (radio frequency identification)-enabled membership card, and return
it to the car sharing “pod”, or parking space, at the end of their trip. Billing is tracked and
completed automatically by an interface between the vehicle and the car-sharing server, with no
further action required by the member.
Membership Plans
The proposed membership plans are equally simple, with three tiers to allow members to
customize their plans to their driving habits. For members who rarely use a vehicle, the basic
plan allows them to rent a vehicle at a base hourly rate of $9.00, without any monthly
subscription fees. For more extensive users, an intermediate plan of $10 per month, with an
annual discounted rate of $100, grants them a lower hourly rate of $7.00, providing a substantial
discount for those driving more than five hours a month. Lastly, for those members who are
looking to Capital CarShare to replace their current vehicle, the Gold Plan provides the lowest
1 Capital District Regional Planning Commission. (n.d.) Capital District Population Projections. Retrieved
from: http://www.cdrpc.org/Proj-Pop.html 2 U.S. Census Bureau. Table B08101: Means of Transportation to Work by Age. 2006-2010 American
Community Survey 5-year estimates. 3 U.S. Energy Information Administration. (2012). Table 4c: U.S. Regional Motor Gasoline Prices and
Inventories. Retrieved from: http://205.254.135.7/forecasts/steo/tables/?tableNumber=10
Ch
apte
r: 1
| E
xec
uti
ve
Su
mm
ary
5
hourly rates in exchange for a monthly membership fee of only $30 or $300 annually. Combined
with a mileage charge of $0.25 per mile, this charge covers all gas, maintenance, and insurance.
Drivers no longer have to worry about the expense of unexpected flat tires, oil changes, or
transmission problems. Capital CarShare frees drivers from these obligations, allowing them to
focus on continuing to make the Capital Region a vibrant, exciting place to work, live, and play.
Where will Capital CarShare operate?
Capital CarShare has identified four initial implementation stages which are outlined in greater
detail in Section 3. This strategy was designed to build a strong membership base over its first
years of operations, which could in turn support future expansion. Initially starting in
Downtown Albany, Capital CarShare will expand out into surrounding neighborhoods over the
first three stages of implementation before continuing to expand to other Capital Region cities.
This plan was based on a demographic analysis of key car sharing indicators as well as potential
membership.
What type of vehicles will Capital CarShare use?
As detailed in Section 4, Capital CarShare will initially start with a fleet of gasoline-powered,
fuel-efficient hatchbacks such as the Toyota Yaris or similar vehicles, as well as a small pickup
truck to allow for a flexibility of uses. However, Capital CarShare will actively pursue funding
sources and partnerships to incorporate hybrid or alternative fuel vehicles into the initial fleet.
As the initial fleet of gasoline-powered vehicles nears replacement, hybrid vehicles will be
introduced to the fleet.
How will Capital CarShare be organized?
Capital CarShare will be organized as a non-profit corporation, to allow the organization to
achieve a broader social purpose without the pressures of maximizing profits for shareholders.
A Board of Directors, made up of key stakeholders and a membership representative, will be
responsible for organizational oversight and ensuring fiscal stability. An Executive Director will
be assisted in their duties by a membership coordinator and several interns in managing daily
operation of the organization. Member volunteers, called Car Captains, will assist in ensuring
that each vehicle in the car sharing fleet is in good condition and ready for use by our members.
Can Capital CarShare be financially self-sustainable?
Simply put, Yes. Initially, Capital CarShare will need to raise approximately $175,000.00
between grants, loans, and contributions (either financial or in-kind) from shareholders and
partners. The first several quarters do have projected losses, largely due to the high initial
infrastructure costs. The first year shows a net profit of approximately $4,848 including start-up
funding. With one-time expenses and funding sources removed, the first year shows a net loss
of approximately $28,911. The second year remains profitable over all, with a net profit of
Ch
apte
r: 1
| E
xec
uti
ve
Su
mm
ary
6
approximately $40,865 ($253,454 after one-time expenses and funding sources are removed.) As
with any business, profitability takes time as initial start-up expenses usually overshadow
initial revenue. However our financial outlook, outlined further in Section 9, shows a relatively
strong pattern of growth and associated shift to profitability within two years.
Summary
It’s not a secret: gas prices are rising, parking is becoming increasingly difficult, emissions from
private automobile usage are having a detrimental effect on our environment. This reality has
resulted in Capital Region residents and workers to increasingly look for solutions and
amenities to improve their quality-of-life while reining in expenses. Providing access to a
vehicle for residents, workers, and visitors without the associated cost and time investment of
private vehicle ownership will improve quality-of-life in the Capital Region, serve as an
economic driver in the region, and help facilitate an increase in footsteps in our downtown
cores. For years, the Capital Region has been discussing ways to reduce its environmental
footprint, increase its economic viability, and attract and retain its creative class. Capital
CarShare can help to make progress towards these goals, building upon the Capital Region’s
legacy of being an incredible place to work, live, and play.
Ch
apte
r: 2
| In
du
stry
Ov
erv
iew
7
2| Industry Overview
History of Car Sharing
Car sharing has been in existence almost as long as the car itself. The first formal attempt at car
sharing occurred in 1948 in Zurich, Switzerland with a car cooperative known as “Sefage”. The
20th century saw many experiments in car sharing. However, it wasn’t until the 1990s that
modern technology was developed which made car sharing more convenient and feasible.
Today, car sharing organizations are operating in twenty-six countries on five continents, with
over a million members and over thirty-thousand vehicles.4
Car sharing has gained popularity in North America in the last twenty years with no signs of
slowing down. As of July 2011, there were twenty-six U.S car sharing programs with over five-
hundred thousand members sharing ten-thousand vehicles.5 The car sharing market is
generally divided into for profit, non-profit and cooperative business models. Car sharing has
typically been composed of neighborhood based cars that members of a car sharing
organization can access with a special membership card or key. The key to the vehicle and a
card to purchase fuel are located within the car.
Car sharing is poised to continue to grow, especially with the development of new innovations
such as one-way car sharing and peer-to-peer car sharing. One-way car sharing allows vehicles
to be picked up in one location and returned to another within a designated area. This model is
in operation in select cities, both in the United Sates and globally. Peer-to-Peer car sharing,
where a vehicle owner directly shares their vehicle with their peers through a provider, is also
spreading and innovating car sharing.
According to some sources, it is estimated that each car sharing vehicle removes 9 to 13
personal vehicles a total of 90,000 to 130,000 across the country. This reduction in personal
automobile ownership results in a reduction of greenhouse gas emissions, reduced demand for
parking, increased use of public transit and non-motorized transportation and savings for
drivers.6
4 Car sharing, 2012 March 5, Innovative Mobility Research: http://www.innovativemobility.org/car
sharing/index.shtml 5 Car sharing, 2012 March 5, Innovative Mobility Research: http://www.innovativemobility.org/car
sharing/index.shtml 6 Martin, Elliot; and Susan A. Shaheen and Jeffery Lidicker, “Impact of Car sharing on Household Vehicle
Holdings: Results in North America, March 2010

Ch
apte
r: 2
| In
du
stry
Ov
erv
iew
8
Car Sharing vs. Private Vehicle Ownership
In order to be successful, car sharing programs need to be cost-effective for both operators and
drivers. As part of the plan development process, an analysis was run on several price points to
measure where the financial break-even point would be, such that private ownership was a
better fiscal option for potential users. To complete this analysis, data was taken from the 2010
American Automobile Association’s cost of driving survey, which was modified to reflect
current average gasoline prices in the Capital Region as of February 29, 2012. For drivers of
small sedans, the financial break-even point was around 3,500 miles annually. It is important to
note that while this appears to be a very small number, car share members reported driving as
much as 79.8% fewer miles than when they previously owned their own automobile, according
to a recent report. Furthermore, surveyed car-sharing members often reported increasing their
use of public transit, contributing to this reduction while demonstrating the synergy possible
between car sharing and transit.7
Table 1: Cost of Vehicle Ownership vs. Car Sharing
Miles Driven Annually 0 1,500 3,000 4,500 6,000
Car Share $100.00 $2,077.27 $4,054.55 $6,031.82 $8,009.09
Private Vehicle $4,381.00 $4,661.95 $4,942.90 $5,223.85 $5,504.80 Assumptions: Fixed vehicle ownership costs (insurance, depreciation, finance charges) of $4,381.00
Variable vehicle ownership charges (gas, maintenance, tires) of $0.1873/mile
Car Share Silver Plan ($100/year, $7.00/hour, $0.25/mile) 5.5 miles driven per hour
Figure 1: Cost of Vehicle Ownership vs. Car Sharing
7 Shaheen, S. Cohen, A., Chung, M. (2009). North American Car sharing : A Ten-Year Retrospective.
Transportation Research Board.
$0.00
$1,000.00
$2,000.00
$3,000.00
$4,000.00
$5,000.00
$6,000.00
$7,000.00
$8,000.00
$9,000.00
0 1,500 3,000 4,500 6,000
An
nu
al C
ost
Annual Mileage
Car Ownership vs. Car Share
Private
Vehicle
Car Sharing
Ch
apte
r: 2
| In
du
stry
Ov
erv
iew
9
Car Sharing in the Capital Region In the Capital Region, car sharing is relatively new. Over the last few years car sharing has been
discussed as a transportation option worth exploring, especially among a number of local
colleges. There have been several attempts to attract a large for-profit car sharing organization
to the area. Ultimately these private vendors were not interested in initiating a regional car
sharing program. In 2010, Hertz on Demand located several vehicles internally on the UAlbany
Uptown Campus, as well as one on the Downtown Campus. The vehicles are open to the
public but their availability may be limited when school is not in session. The purpose of
Capital CaShare is to have a regional car sharing program that serves the larger community.
Why Car Sharing is Vital for the Capital Region
Car Sharing Benefits:
Although there are many benefits to incorporating a car sharing program into the regional
transportation system, three major benefits are:
- Reduced environmental impact of commuting
- Reduced demand for parking
- Increased regional economic activity
Reduced Environmental Impact
Car sharing has been shown to decrease greenhouse gas emissions. It is estimated that car
sharing has resulted in a 225,000 ton reduction in greenhouse gas emissions in North America.8
Car sharing in the Capital Region is consistent with recent efforts of New York State and the
Capital Region to become more sustainable, which have been expressed in documents such as
C.D.T.C.’s New Visions Plan and the City of Albany’s Albany 2030 Comprehensive Plan. These
plans have emphasized the importance of transitioning to innovative, less-impactful
transportation options, such as mass transit, alternative fuels, and car sharing.
Reduced Demand for Parking
In many of the region’s dense urban areas, there is limited on-street parking for commuters,
visitors and residents. Car sharing has been shown to eliminate at least nine personal vehicles
for every car sharing vehicle in service, helping to reduce the demand for parking. This will be
vital for the region, especially in Albany where a number of developments are increasing
pressure on the existing parking infrastructure. One such development has been the
reorganization of office space used by New York State, which has resulted in the relocation of
8 Martin, E. W., & Shaheen, S. A. (2011, December). Greenhouse Gas Emission Impacts of Car sharing in
North America. IEEE Transactions of Intelligenet Trasnportation Systems, Vol.12 No.4 , pp. 1074-1086
Ch
apte
r: 2
| In
du
stry
Ov
erv
iew
10
between 2,000 and 5,000 workers to downtown Albany offices, including the Empire State
Plaza. 9 Also on the horizon, the City of Albany is implementing a residential parking permit
system for streets within a three-quarter of a mile radius surrounding the Empire State Plaza.10
Car sharing will be a viable option for anyone working, living or visiting the region to increase
mobility without out increasing the need for parking.
Economic Benefit
A car sharing operation stimulates economic activity through the maintenance and operation of
the vehicle fleet, as well as increases the purchasing power of members. Members who car share
in lieu of owning a private vehicle often save significant amounts of money on their
transportation costs, which in turn can be used in local businesses, further growing our
economy. PhillyCarShare estimated that the economic benefit for Philadelphia in the form of
direct expenditures by the organization was $14 million, while $13.2 million in net purchasing
power was saved by members due to cost savings by using car sharing services.11 Relying
heavily on PhillyCarShare’s methodology, Buffalo CarShare determined that their members had
saved over $377,000 in expenses simply by choosing car sharing over private car ownership.
Furthermore, as an organization, Buffalo CarShare directly spent over $440,000 over two years
in the local economy, and paid over $28,000 in sales/car rental taxes from to New York State.
9 (Carleo-Evangelist, 2011) 10 (Carleo-Evangelist, Times Union, 2012) 11Ecoonsult Corporation. (2010). The Economic And Environmental Impact of PhillyCarShare In The
Philadelphia Region. Philadelphia: PhillyCarShare

Ch
apte
r: 3
| M
emb
ersh
ip C
har
acte
rist
ics
& L
oca
tio
n S
elec
tio
n
11
3| Membership Characteristics & Location Selection
While the aim for Capital CarShare is to provide mobility solutions to as broad of a segment of
the regional population as possible, it is important to ensure that the where the pods are located
generate enough revenue to sustain and grow the organization. This is particularly crucial for
the initial stages of implementation, when capital is particularly limited. As such, a significant
portion of this project was spent looking at membership characteristics and site selection for the
initial rollout of Capital CarShare.
Target Car sharing Audience
Over the past decade, a significant amount of research has been completed focusing on the
typical demographics of car sharing members. Although it is important not to design programs
which favor one demographic over another, it is important to know which residents are more
likely to use your service for both marketing and financial projection purposes.
In 2005, the Transportation Cooperative Research Program released the report “Car-Sharing:
Where and How It Succeeds.” In this report, the authors identified key characteristics that were
common among the membership of a number of successful car sharing programs, which are
detailed in Table 2.
Table 2: Characteristics of Car-sharing members
Characteristic Typical Car-Sharing Member
Age Mid 30s – Mid 40s
Income Upper middle class
Education Upper levels (College degree(s))
Household size Smaller than average (1-2 persons)
Auto ownership Half own one vehicle
Gender Slightly more attractive to males Source: TCRP Report 108, Exhibit 3-3
Building upon this research, a report presented by the Transportation Research Board in 2007
showed statistically significant correlations between the success of car sharing programs and
most of the same characteristics from table 2. The one exception was education, which their
Ch
apte
r: 3
| M
emb
ersh
ip C
har
acte
rist
ics
& L
oca
tio
n S
elec
tio
n
12
research did not show as having a statistically significant relationship12. As such, this indicator
was not utilized in the feasibility index.
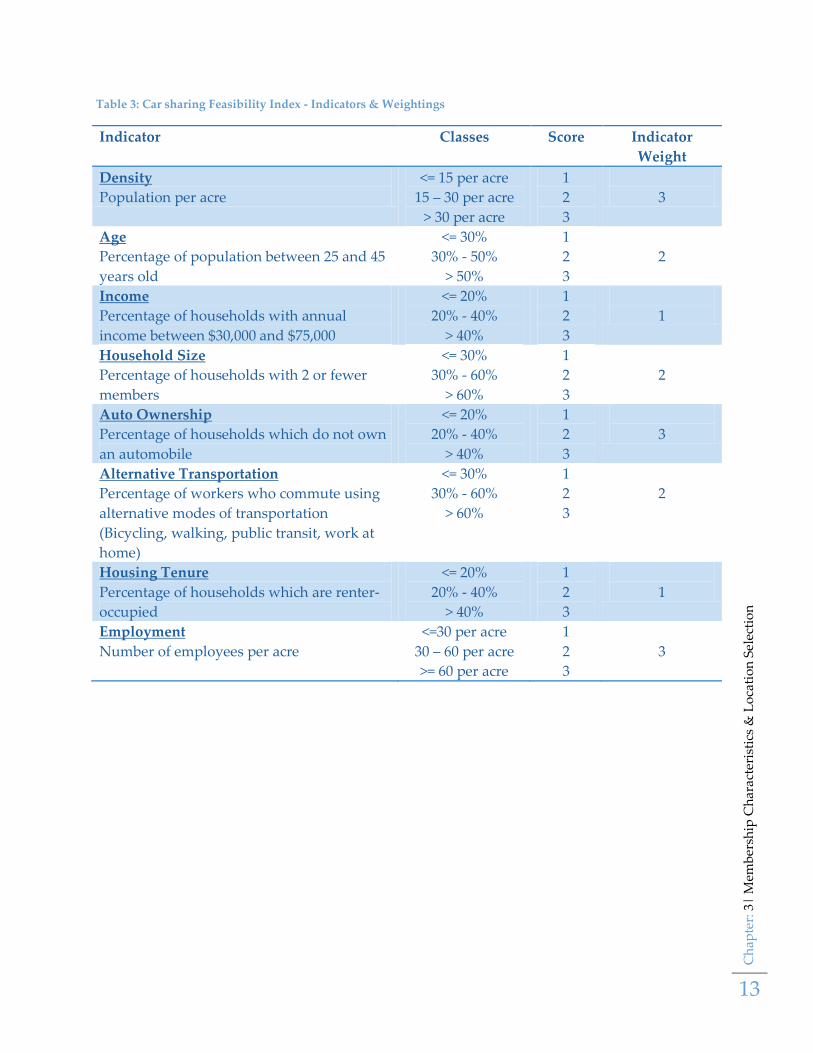
Car sharing Feasibility Index
In order to determine how to best empirically measure and identify areas where car sharing
would most likely be successful, it was imperative to develop a data model which incorporated
the aforementioned characteristics of car sharing members, as well as other key indicators.
A review of a number of location selection methodologies was completed early into the
planning process. One city, San Diego, used a methodology which was both comprehensive and
flexible enough to incorporate a wide range of data. This method incorporated a number of key
indicators which were each assigned relative weights. These weightings aligned with the
perceived importance of each indicator to the overall success of a car sharing program. The San
Diego model was used as the base for the model developed for this study, and was modified to
reflect the data available and particular distribution in the Capital Region. The criteria used and
the weightings assigned to each indicator are seen in Table 3.
Proportional data was primarily taken from the 2006-2010 American Community Survey 5-year
estimates, although data dealing with population counts or density was taken from the 2010
Decennial Census. In addition, employment data was obtained from the U.S. Census Bureau
Longitudinal-Employer Household Dynamics Program. All data was collected at the census
tract level, as it was the finest grain data consistently available from all sources.
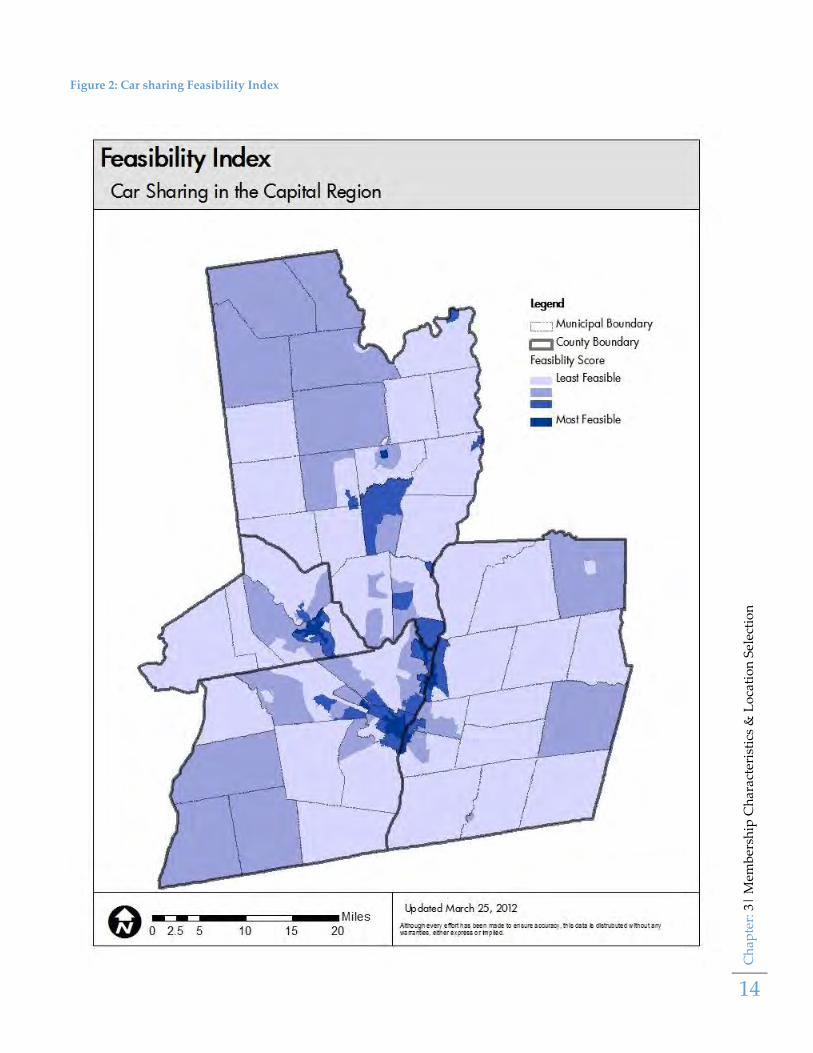
When this model was applied to the demographic data for the Capital Region, the feasibility
index scores ranged from a low of 19 to a high of 38, out of a possible range of 17 to 51. This
data was then broken into quartiles and mapped using ArcGIS 10, providing a visualization of
the spatial distribution of the feasibility index, as seen in Figure 1. Each quartile was assigned a
successively darker shade, with the darkest shades indicating those census tracts with the
highest proportion of the demographic and physical characteristics that have been identified as
key to a successful car sharing operation, and thus the highest feasibility scores.
12 Celsor, C., Millard-Ball, A. (2006). Where Does Car-Sharing Work? Using GIS to Assess Market
Potential. Transportation Research Board.
Ch
apte
r: 3
| M
emb
ersh
ip C
har
acte
rist
ics
& L
oca
tio
n S
elec
tio
n
13
Table 3: Car sharing Feasibility Index - Indicators & Weightings
Indicator Classes Score Indicator
Weight
Density
Population per acre
<= 15 per acre
15 – 30 per acre
> 30 per acre
1
2
3
3
Age
Percentage of population between 25 and 45
years old
<= 30%
30% - 50%
> 50%
1
2
3
2
Income
Percentage of households with annual
income between $30,000 and $75,000
<= 20%
20% - 40%
> 40%
1
2
3
1
Household Size
Percentage of households with 2 or fewer
members
<= 30%
30% - 60%
> 60%
1
2
3
2
Auto Ownership
Percentage of households which do not own
an automobile
<= 20%
20% - 40%
> 40%
1
2
3
3
Alternative Transportation
Percentage of workers who commute using
alternative modes of transportation
(Bicycling, walking, public transit, work at
home)
<= 30%
30% - 60%
> 60%
1
2
3
2
Housing Tenure
Percentage of households which are renter-
occupied
<= 20%
20% - 40%
> 40%
1
2
3
1
Employment
Number of employees per acre
<=30 per acre
30 – 60 per acre
>= 60 per acre
1
2
3
3
Ch
apte
r: 3
| M
emb
ersh
ip C
har
acte
rist
ics
& L
oca
tio
n S
elec
tio
n
14
Figure 2: Car sharing Feasibility Index
Ch
apte
r: 3
| M
emb
ersh
ip C
har
acte
rist
ics
& L
oca
tio
n S
elec
tio
n
15
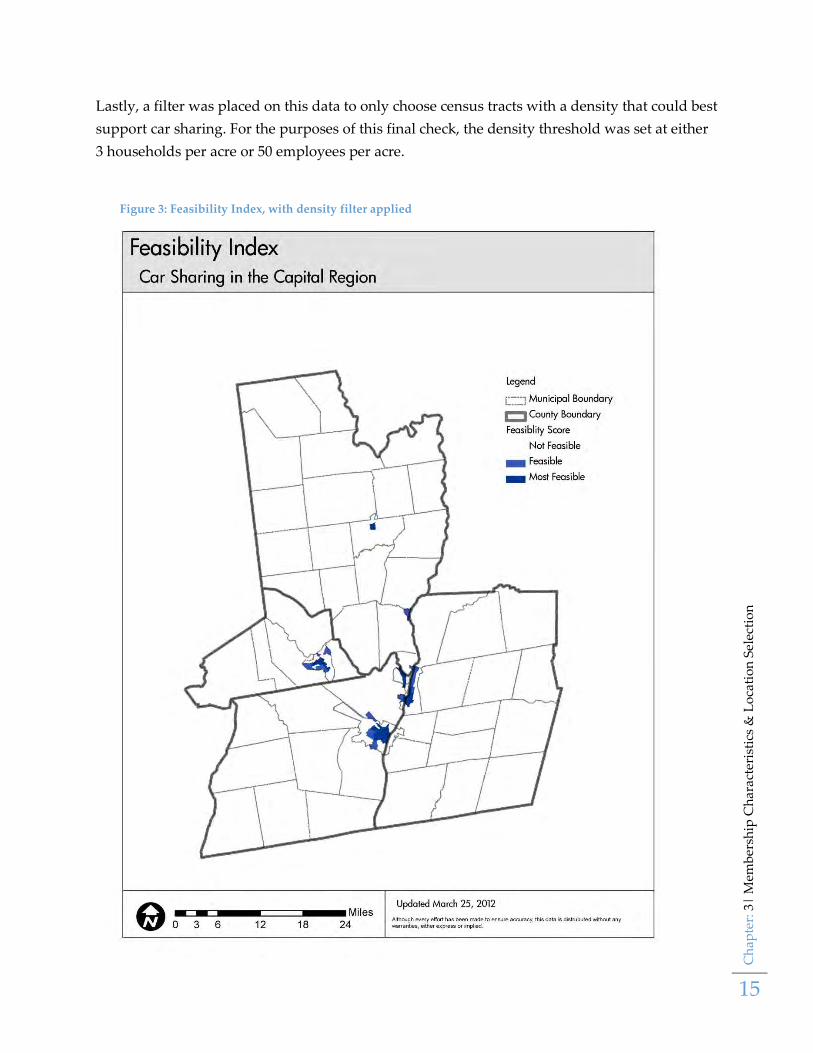
Lastly, a filter was placed on this data to only choose census tracts with a density that could best
support car sharing. For the purposes of this final check, the density threshold was set at either
3 households per acre or 50 employees per acre.
Figure 3: Feasibility Index, with density filter applied
Ch
apte
r: 3
| M
emb
ersh
ip C
har
acte
rist
ics
& L
oca
tio
n S
elec
tio
n
16
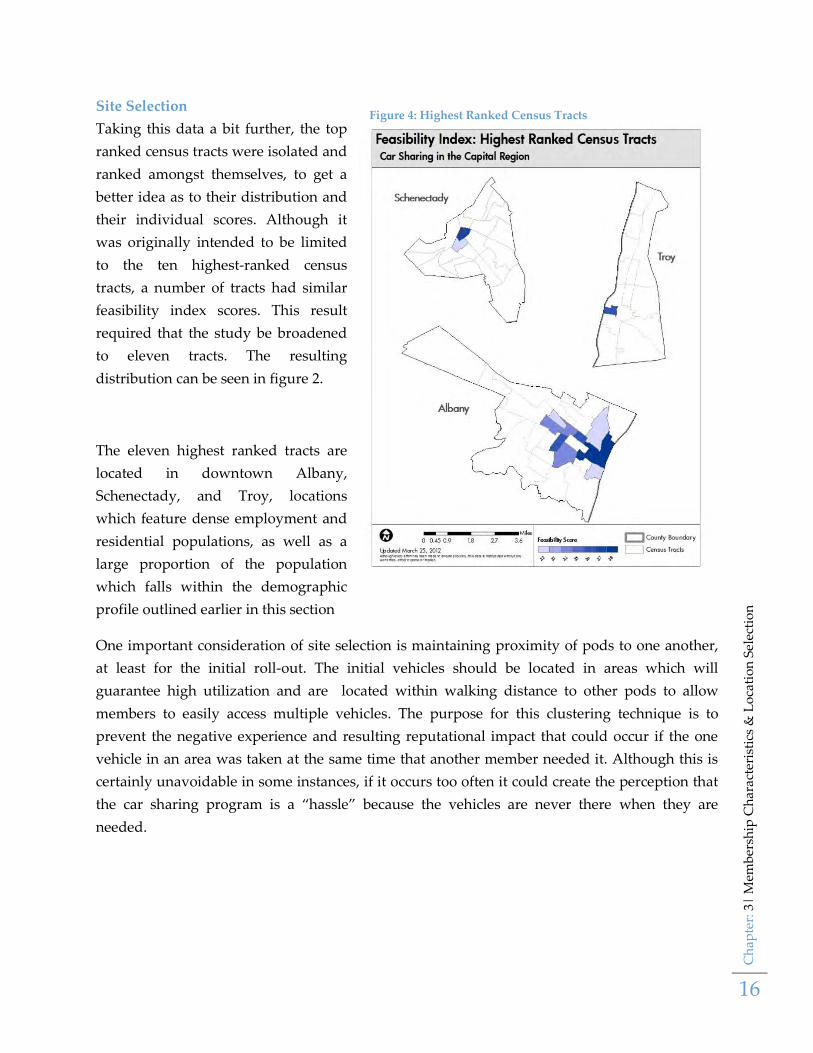
Site Selection
Taking this data a bit further, the top
ranked census tracts were isolated and
ranked amongst themselves, to get a
better idea as to their distribution and
their individual scores. Although it
was originally intended to be limited
to the ten highest-ranked census
tracts, a number of tracts had similar
feasibility index scores. This result
required that the study be broadened
to eleven tracts. The resulting
distribution can be seen in figure 2.
The eleven highest ranked tracts are
located in downtown Albany,
Schenectady, and Troy, locations
which feature dense employment and
residential populations, as well as a
large proportion of the population
which falls within the demographic
profile outlined earlier in this section
One important consideration of site selection is maintaining proximity of pods to one another,
at least for the initial roll-out. The initial vehicles should be located in areas which will
guarantee high utilization and are located within walking distance to other pods to allow
members to easily access multiple vehicles. The purpose for this clustering technique is to
prevent the negative experience and resulting reputational impact that could occur if the one
vehicle in an area was taken at the same time that another member needed it. Although this is
certainly unavoidable in some instances, if it occurs too often it could create the perception that
the car sharing program is a “hassle” because the vehicles are never there when they are
needed.
Figure 4: Highest Ranked Census Tracts
Ch
apte
r: 3
| M
emb
ersh
ip C
har
acte
rist
ics
& L
oca
tio
n S
elec
tio
n
17
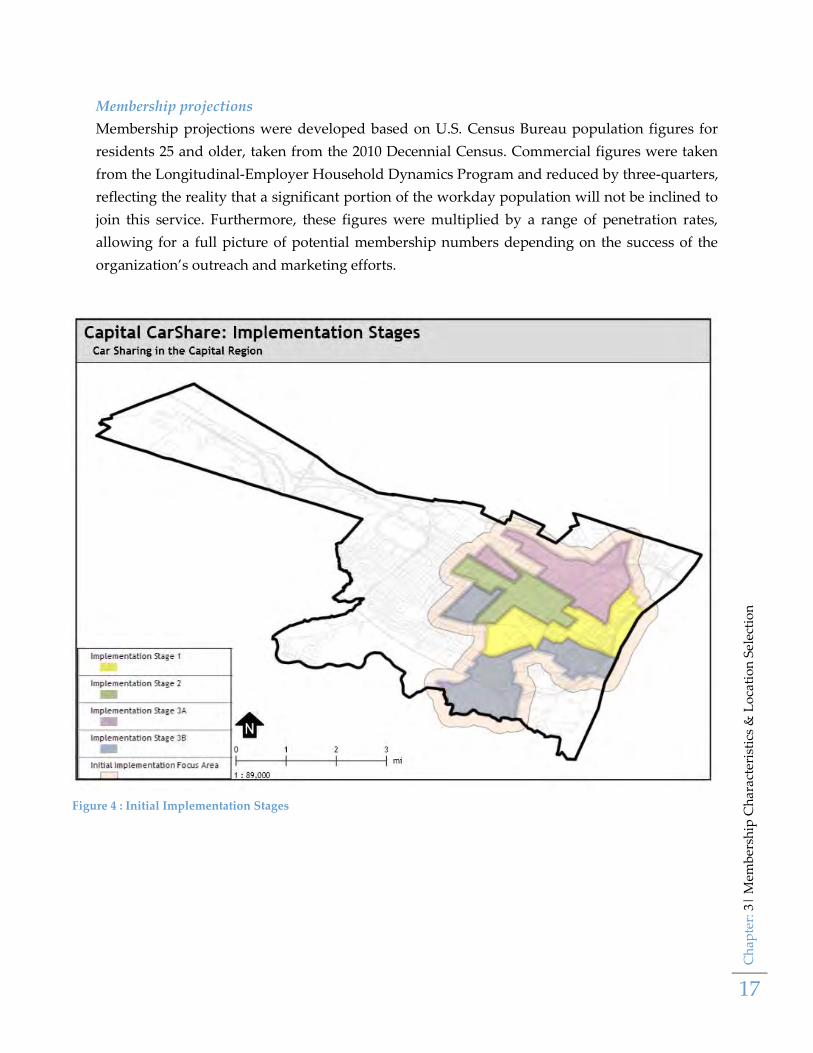
Membership projections
Membership projections were developed based on U.S. Census Bureau population figures for
residents 25 and older, taken from the 2010 Decennial Census. Commercial figures were taken
from the Longitudinal-Employer Household Dynamics Program and reduced by three-quarters,
reflecting the reality that a significant portion of the workday population will not be inclined to
join this service. Furthermore, these figures were multiplied by a range of penetration rates,
allowing for a full picture of potential membership numbers depending on the success of the
organization’s outreach and marketing efforts.
Figure 4 : Initial Implementation Stages

Ch
apte
r: 3
| M
emb
ersh
ip C
har
acte
rist
ics
& L
oca
tio
n S
elec
tio
n
18
Multi-stage Implementation
Stage 1: Center Square, Hudson/Park, Downtown, University Heights (Census Tracts 22, 11, 21)
Key Demographics
o Residents over 25: 4,415.
o Employees: 49,063.
o Households with 0 or 1 vehicle: 79.7%.
o Over three-quarters of households have 2 or fewer members.
High concentration of dense residential population, employment base, and high-rental
tenure make this an ideal core area to start within. Major employment centers are
located throughout the tracts, including State Offices, large office buildings, and several
institutions such as Albany Medical Center. Parking can be contentious in this area,
which may be improved through a wide-spread adoption of car sharing.
Potential Membership:
o Residents Alone: 1% penetration rate: 44 members; 3%: 132 members.
o Residents & Employees: 1%: 166 members; 3%: 500 members.
Timeframe: Year 1, first through third Quarter.
Stage 2: Washington Park, Pine Hills, West Hill neighborhoods (Census Tracts 8, 14, 15, 6, 5.02)
Key Demographics
o Residents over 25: 6,529.
o Employees: 6,160.
o Households with 0 or 1 vehicle: 69.8%
Relatively dense residential and key employment centers provide a strong potential
membership base. Adjacency to prior tracts allows network to grow organically and
contiguously. Fairly constrained parking situation in these neighborhoods would
improve with car sharing adoption, but may spark objections to the dedication of scarce
parking to car sharing pods.
Potential Membership:
o Residents Alone: 1% penetration rate: 65 members; 3%: 196 members.
o Residents & Employees: 1%: 81 members; 3%: 242 members.
Timeframe: Year 1, third quarter through Year 2, second quarter.
Ch
apte
r: 3
| M
emb
ersh
ip C
har
acte
rist
ics
& L
oca
tio
n S
elec
tio
n
19
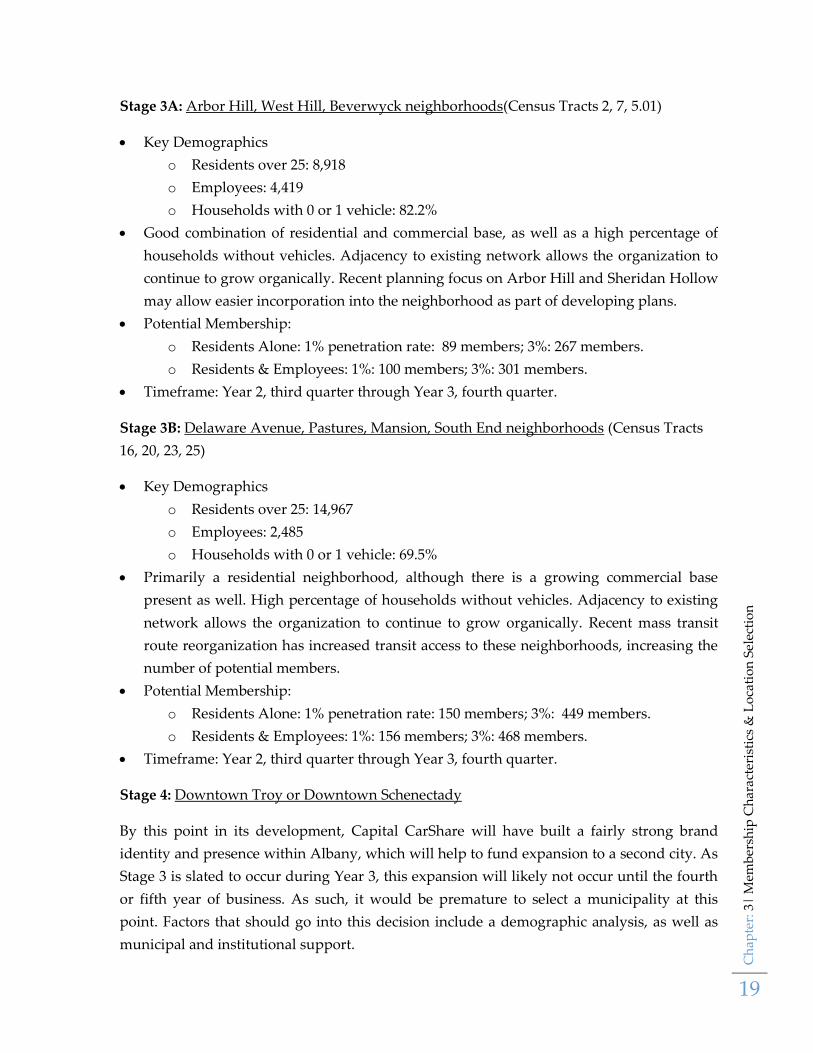
Stage 3A: Arbor Hill, West Hill, Beverwyck neighborhoods(Census Tracts 2, 7, 5.01)
Key Demographics
o Residents over 25: 8,918
o Employees: 4,419
o Households with 0 or 1 vehicle: 82.2%
Good combination of residential and commercial base, as well as a high percentage of
households without vehicles. Adjacency to existing network allows the organization to
continue to grow organically. Recent planning focus on Arbor Hill and Sheridan Hollow
may allow easier incorporation into the neighborhood as part of developing plans.
Potential Membership:
o Residents Alone: 1% penetration rate: 89 members; 3%: 267 members.
o Residents & Employees: 1%: 100 members; 3%: 301 members.
Timeframe: Year 2, third quarter through Year 3, fourth quarter.
Stage 3B: Delaware Avenue, Pastures, Mansion, South End neighborhoods (Census Tracts
16, 20, 23, 25)
Key Demographics
o Residents over 25: 14,967
o Employees: 2,485
o Households with 0 or 1 vehicle: 69.5%
Primarily a residential neighborhood, although there is a growing commercial base
present as well. High percentage of households without vehicles. Adjacency to existing
network allows the organization to continue to grow organically. Recent mass transit
route reorganization has increased transit access to these neighborhoods, increasing the
number of potential members.
Potential Membership:
o Residents Alone: 1% penetration rate: 150 members; 3%: 449 members.
o Residents & Employees: 1%: 156 members; 3%: 468 members.
Timeframe: Year 2, third quarter through Year 3, fourth quarter.
Stage 4: Downtown Troy or Downtown Schenectady
By this point in its development, Capital CarShare will have built a fairly strong brand
identity and presence within Albany, which will help to fund expansion to a second city. As
Stage 3 is slated to occur during Year 3, this expansion will likely not occur until the fourth
or fifth year of business. As such, it would be premature to select a municipality at this
point. Factors that should go into this decision include a demographic analysis, as well as
municipal and institutional support.
Ch
apte
r: 3
| M
emb
ersh
ip C
har
acte
rist
ics
& L
oca
tio
n S
elec
tio
n
20
Car Sharing Pod Location Criteria
Within each implementation area, choosing each car sharing vehicle location (also known as a
pod) will require careful study. Although there will always be extenuating circumstances, it is
important that car sharing pods are situated in locations that meet certain criteria. This criteria
includes:
- Land Use: Pods should be located near mixed land-use whenever possible. This will
increase the utility of the vehicle as residents, businesses and their patrons, and workers
have increased access to the vehicle for their transit needs.
- Density: In order for the pod to be financially successful, it is important that the the area
surrounding the pod (roughly a half mile radius) has a high residential and employment
density. Generally speaking, 2,500 residents within half a mile of the vehicle would
provide a solid base of potential members. This figure could be less if there are sufficient
potential members from nearby businesses.
- Accessibility: Pods should be easily recognizable and accessible to residents and visitors
alike. The ideal location will be near a centrally located primary road for the tract.
Although this may not be a high-traffic thoroughfare, it is important that this road have
steady traffic patterns, to both increase visibility and accessibility.
- Parking: Pods need to have a dedicated parking spot, ideally at the end of block or
street. This will increase visibility and allow members to locate the vehicles easily, even
in an unfamiliar neighborhood. Additionally highly visible signage/street markings will
be very important for identifying and advertising car sharing pods. As such, it is
important that selected locations allow for appropriate signage and/or street markings.
- Proximity to other pods: When possible, it is preferable for pods to be within walking
distance (half mile) of another pod. This allows members the option of using a different
pod if the vehicle they usually use is already booked.
Other Considerations
It is important to note that site selection will not be solely driven by the aforementioned data
model used to create the feasibility index. Occasionally, there will be other influences which
will help determine where the next phase of fleet expansion should take place. While it would
be difficult to identify every potential influence, pod sponsorship and government grants are
two examples which could help to expand Capital CarShare to new areas.
Pod Sponsorship
Many of the car sharing organizations that were studied had incorporated or solicited private
sponsorship of car-sharing pods. This provides the sponsor with a price-competitive alternative
to private fleet and parking management while providing the car sharing organization with
financial support for the start-up costs of the pod, as well as a cache of potential members.

Ch
apte
r: 3
| M
emb
ersh
ip C
har
acte
rist
ics
& L
oca
tio
n S
elec
tio
n
21
Although each potential partnership would need to be carefully analyzed to ensure that the pod
is otherwise feasible, this option can be a great way to expand the car sharing network with
much lower outlay of capital.
Potential partner organizations include:
- State, County, and Municipal Governments
- Universities / Colleges (Staff and Students)
- Hospitals
- Shopping Centers/Commercial Plazas
- Residential Complexes
- Hotels
Capital CarShare will actively work to solicit and
build these partnerships to help accelerate the
expansion of the network while raising the profile
and market penetration of car sharing.
Government Grants
Another potential source of funding which could influence the expansion of the car sharing
network is government grants. State and Federal agencies often provide financial grants to
incentivize private entities to tackle pressing social and economic issues. As part of this process,
the consultant team has been working to identify potential funding streams, including
government grants. Much like with the pod sponsorship, a grant award will allow Capital Car
Share to expand into areas which may not have been feasible until later in the implementation
timeline. These grants would reduce the startup and maintenance capital required to operate
the pod. In addition, some government grants may be able to be used to offer subsidized plans
for targeted populations. Some potential topics where grant funding may be available include
assisting with mobility, mitigating food deserts, and increasing environmental sustainability in
the region.
Figure 5: A Marriot Courtyard-branded Zip Car
Pod in Dallas, TX.
Ch
apte
r: 4
| F
leet
In
fras
tru
ctu
re
22
4| Fleet Infrastructure
Ownership Method
One of the first decisions that need to be made in terms of fleet management is whether it is
better to purchase or lease the car sharing vehicles. Leasing vehicles requires a much smaller
initial capital outlay than purchasing, but would involve a monthly lease payment per vehicle.
Leased vehicles generally have penalties for exceeding annual mileage limits, which could
prove to be an unplanned expense. Purchasing vehicles requires either a large initial investment
or securing financing from either a dealer or private institution. However, purchased vehicles
are not subject to mileage surcharges and provide the organization with complete flexibility to
customize them as needed, including adding car sharing equipment and vehicle graphics. The
latter point can be negotiated into the lease contract, as has been done by some organizations.
For the car sharing organizations reviewed as part of this study, both ownership models have
been utilized. However, for the purposes of Capital CarShare the preferred method would be to
purchase the fleet outright to allow for maximum flexibility in terms of fleet management and
customization.
Vehicles will be kept in service for approximately three to five years, or before the vehicle
depreciates significantly in resale value. This timeframe will be established based on the model
chosen and the Kelly Blue Book resale value for that model year.
Loanation
Once the organization is past the initial implementation stage it will explore allowing people to
share their car with the entire car sharing membership. The model for this program is currently
in use with eGo, a car sharing organization in Colorado. The criteria for vehicles are:
Automatic transmission
Less than five years old
Less than 75,000 miles
Body and interior in good condition
Reliable make and model
Fuel-efficient sedan, hatchback, AWD vehicle, minivan, pick-up truck
Must own vehicle outright (no liens on title)
Must be willing to enter into a two year loan agreement.
The car is outfitted with the car sharing organization’s hardware and it is put into the fleet
similar to that of other vehicles. The vehicle will be placed strategically to expand the
organization’s fleet but will also take into consideration the location of vehicle owner.
Ch
apte
r: 4
| F
leet
In
fras
tru
ctu
re
23
Those who share their car receive:
Use of their car and entire car share fleet with an annual usage credit based on the Kelly
Blue Book value of their vehicle.
The car share organization will take responsibility of the insurance, maintenance and gas
for the vehicle.
The owner of the vehicle can take their car back at any time but must give the
organization a minimum thirty day notice.
Fuel Type
There are three major fuel sources which are commercially available that need to be considered
during the vehicle selection. Gasoline is currently the default choice for private vehicles sold in
the United States, making up approximately 96% of vehicles sold in February 2012.
Comparatively, hybrid vehicles made up 3.16%, electric vehicles made up 0.15%, and clean
diesel made up 0.79% of total passenger vehicle sales in the same month13.
Many car sharing organizations utilize either gasoline or hybrid vehicles in their fleets. These
options each have their benefits and drawbacks which need to be carefully weighed. Gasoline
vehicles tend to be cheaper to purchase and maintain, but are subject to the increasingly
expensive and unpredictable gasoline prices, which in turn can rapidly increase operating
expenses. In addition, the burning of fossil fuels has been linked to a number of environmental
issues.
Hybrid vehicles use less gasoline, which reduces fuel expenses and emissions. However, hybrid
vehicles can be more expensive than their gasoline counterparts. Electric, Clean Diesel, and
Compressed Natural Gas (CNG) vehicles are also generally more expensive than gasoline
vehicles, and also require specialized refueling stations or equipment. These options would
have a lower environmental impact and would be more insulated from rising gasoline prices.
However, ensuring that there is sufficient recharging or refueling infrastructure in the
implementation area could pose a logistical problem.
That said, there has been an increase in the rate of installation of alternative refueling or
recharging infrastructure throughout the Capital Region over the past several years.
Furthermore, alternative fuel vehicles may make the organization more competitive when
applying for government grant programs and private partnerships. One valuable source for
information about alternative fuel sources, infrastructure, and funding sources can be found at
the U.S. Department of Energy’s Alternative Fuels & Advanced Vehicles Data Center Website:
13 February 2012 Dashboard. HyridCars.com. Retrieved from: http://www.hybridcars.com/news/february-
2012-dashboard-42085.html

Ch
apte
r: 4
| F
leet
In
fras
tru
ctu
re
24
http://www.afdc.energy.gov/afdc/. Incorporating alternative fuel vehicles into the Capital Car
Share Fleet will be actively pursued by Capital CarShare to help lower the Capital Region’s
carbon footprint.
Initially, Capital CarShare will likely start with a gasoline powered fleet which will be replaced
over time with hybrid vehicles. This choice will lower the initial vehicle expenses, which is
crucial during the initial start-up stages. However, Capital CarShare will actively pursue
funding sources and partnerships to incorporate alternative fuel vehicles as a significant portion
of its fleet.
Fleet Model Recommendations
When selecting a vehicle for Capital CarShare’s fleet, several factors had to be considered, such
as purchase price, gas mileage, maintenance costs, and flexibility. In order to keep maintenance
and on-board equipment installation costs as low as possible, it was decided to initially start
with one model of vehicle, with the exception of one truck for flexibility. A subcompact
hatchback was chosen for a vehicle class, as they are relatively compact and fuel-efficient, but
offer a greater amount of cargo room for members. In addition, the purchase price was only
slightly higher than their sedan counterparts. The Toyota Yaris provides the best combination
of fuel efficiency, purchase price, and maintenance costs in this vehicle class. This report
therefore has used the Toyota Yaris as the suggested standard fleet vehicle for budgetary and
planning purposes. Ultimately, the decision on a specific model will depend largely on the
availability of dealer financing and a negotiated fleet purchase price, as well as grant
opportunities and private partnerships

Ch
apte
r: 4
| F
leet
In
fras
tru
ctu
re
25
Table 4: Potential Car-sharing Vehicle Models
Hatchbacks
Make Model Transmission Fuel MPG
(city/hwy)
Price Maintenance
(5 years)
Chevrolet Sonic 2LS Hatchback Automatic Gas 25/35 $16,634 N/A
Ford Fiesta Hatchback Automatic Gas 29/39 $16,809 $1,858
Honda Fit Hatchback Automatic Gas 28/35 $15,441 $1,862
Nissan Versa S Automatic Gas 24/32 $16,460 $2,271
Toyota Yaris Automatic Gas 30/35 $15,041 $1,887
Sedans
Make Model Transmission Fuel MPG
(city/hwy)
Price Maintenance
(5 years)
Chevrolet Sonic 2LS Sedan Automatic Gas 25/35 $15,730 N/A
Ford Focus Automatic Gas 26/36 $16,558 $ 2,605
Honda Civic Automatic Gas 28/39 $16,499 $ 1,882
Nissan Versa S Sedan Automatic Gas 30/38 $13,900 $2,271
Toyota Corolla Automatic Gas 27/34 $16,004 $ 2,109
Electric/Alternative Fuels
Make Model Transmission Fuel MPG (city/hwy) Price Maintenance
(5 Years)
Chevrolet Volt N/A Gas/Electric 36 miles/charge,
35/40 mpg
$39,995 $1,680
Ford Fusion Automatic Gas/Electric 41/36 mpg $29,570 $2,370
Honda Civic Hybrid Variable Gas/Electric 44/44 mpg $24,820 $1,72
Nissan Leaf N/A Electric 100 miles/charge $37,250 $1,786
Toyota Prius Automatic Gas/ Electric 51/48 $23,725 $1,655
Crossovers/Vans/Trucks
Make Model Transmission Fuel MPG
(city/hwy)
Price Maintenance
(5 Years)
Chevrolet Equinox Crossover Automatic Gas 22/32 $24,340 $ 2,549
Ford F150 XL Automatic Gas 17/23 $22,649 N/A
Honda Odyssey (Minivan) Automatic Gas 18/27 $26,643 $2,024
Nissan Quest Van Automatic Gas 19/24 $28,575 $2,609
Toyota Sienna (Minivan) Automatic Gas 19/24 $24,261 $2,290
Ch
apte
r: 5
| T
ech
no
log
y &
Ser
vic
es
26
5| Technology & Services
While early car sharing initiatives often relied on the honor-system or relatively low-tech
methods for facilitating reservation scheduling, fleet management, and member accounts,
modern car sharing operations generally rely on a two-tiered system of technology to keep
operations flowing smoothly: on board (in-car) equipment, and server-side equipment. For each
category, there are a number of service providers, each with their own product line and cost
structure. Contact information for each provider contacted can be located in the Appendix.
On Board Equipment
The on-board equipment is responsible for controlling and providing access to the vehicle,
tracking and communicating mileage driven and vehicle location, as well as providing fleet
security and reservation management services with some models.
Access to the vehicle is gained by the member placing their membership card, which contains
an RFID chip, against the driver’s side of the windshield. RFID is a radio frequency
identification used to transfer data. The on-board equipment verifies that the member has a
current reservation and unlocks the vehicle. At the end of the reservation, the member simply
returns the vehicle key to the compartment in the glove box and places their membership card
back up to the RFID reader, which then locks the vehicle.
On-board equipment is available through a number of vendors, which offer options to either
purchase or lease the equipment. Generally speaking, purchase prices range between $1000 and
$1400, while lease prices are generally $50-70 per month. Installation procedures vary greatly by
the equipment, but take approximately two hours per vehicle for an experienced mechanic or
technician.
Server-Side Equipment
Modern car sharing operations often manage dozens of vehicles, used by hundreds or
thousands of members who subscribe to one of a number of different membership plans.
Without a well-developed technology solution, running such an organization would be
tremendously difficult. However, a number of technology vendors have developed systems
which take care of much of the “heavy lifting,” allowing car sharing operators to tailor their
service to what best meets the diverse needs of their clientele. Although each provider has
subtle differences in the interface and included features of their systems, all of the systems
reviewed offered:
Reservations – Internet & Telephone
Vehicle Tracking and immobilization
Membership management – Billing, Tier management & partnership discounts
Ch
apte
r: 5
| T
ech
no
log
y &
Ser
vic
es
27
Generally speaking, these systems are hosted by the vendor, reducing the technical expertise
required by the car sharing staff. In terms of cost, most of the systems that were studied had a
tiered pricing approach for the server-side equipment, assessing a monthly fee per networked
vehicle, generally between $38-60. Initial set up costs vary by provider, but generally cost
approximately $2000.
Services
Insurance
An initial quote was received from William P. Curtis, a principal at Porter & Curtis, LLC, a
consultative commercial insurance broker and risk management services provider. Porter &
Curtis is the insurance broker for other car sharing organizations such as Buffalo Car Share.
William Curtis presented on insurance for car sharing organizations at the fall 2011 Upstate
Transportation Forum in Ithaca, New York. Although premiums depend on the vehicle type,
limits, deductibles and ultimately loss experience, Mr. Curtis estimated a monthly expense of
between $150 and $200 per vehicle for budget purposes. This includes $1,000,000 of liability
coverage, statutory minimum limits for uninsured/underinsured motorists & PIP (no fault).
There would be a $500 deductible for comprehensive and collision. Those 18- 20 years of age
need to demonstrate that they are covered by another car insurance policy.
DMV/Credit Check
In order to protect the organization’s infrastructure, as well as to comply with insurance
requirements, Capital CarShare will be required to obtain a DMV record for each subscriber.
These records searches generally run between $10.00 and $15.00, depending on the vendor.
Merchant Services
In order to accept and process credit cards for reservations, Capital CarShare will need to
establish a contract with a merchant services provider. These services can either be obtained
through third-party vendors or often through the banking services provide. Generally, a
monthly fee is assessed as well as a percentage-based transaction fee, ranging from 1.5-5%
depending on the terms of the contract and usage patterns. For the purposes of the financial
projections, we have assumed $150 in setup costs, $25 a month in maintenance fees, and a 3.00%
transaction fee.
Office Rent & Utilities
As with any business, office space will be necessary to facilitate the organization’s operations. It
is suggested that Capital CarShare open a storefront office space, preferably in an area with
high pedestrian traffic. Although cheaper space may be available through a shared-space

Ch
apte
r: 5
| T
ech
no
log
y &
Ser
vic
es
28
arrangement with another organization, many car sharing organizations (such as Buffalo) have
found success in outreach efforts simply by having a highly-visible storefront office.

Ch
apte
r: 6
| P
rice
Str
uct
ure
29
6| Price Structure
After site selection, development of a membership structure is one of the most important
aspects of creating a successful car sharing program. A successful membership plan will
provide users with a range of options to best meet their transit needs, while providing the
organization with a strong revenue base to further maintain and develop its network.
Additionally, it is vital that the membership plan remain competitive with other means of
transportation. To achieve this balance, a competitive analysis was completed of several car
sharing programs, which in turn was used in conjunction with local market conditions to
develop a proposed Capital CarShare membership plan.
Competitive Analysis
To start off this process, a survey was completed of other car sharing programs of various sizes.
To best capture a range of programs that would provide the most relevant information,
programs were selected from both regionally proximate as well as more distant car sharing
operators. In addition, a more established program was included to provide context in terms of
scalability as Capital CarShare grows.
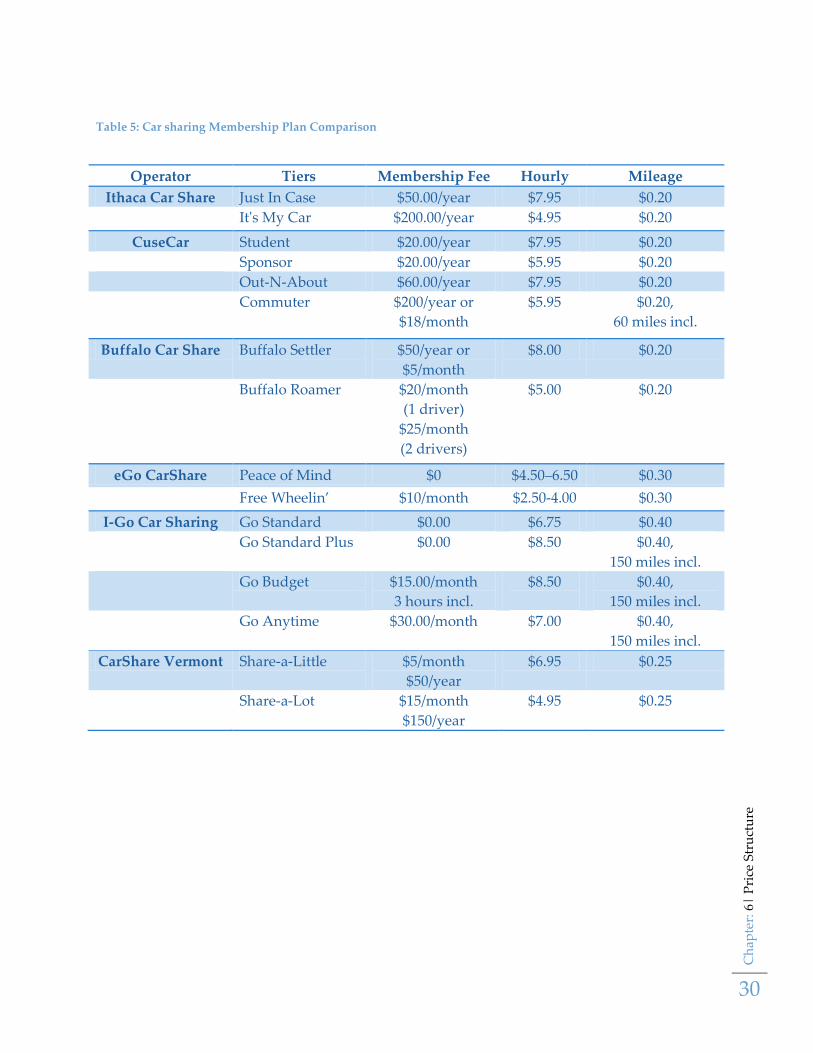
A total of twelve programs were analyzed as part of this process, from small single car
operators to a major regional operator with hundreds of vehicles. Ultimately, six programs were
chosen for a more in-depth analysis, given their proximity to the Capital Region, as well as
unique features of their programs. The six programs that were analyzed were Ithaca Car Share
(Ithaca, New York), CuseCar (Syracuse, New York), Buffalo Car Share (Buffalo, New York), eGo
CarShare (Boulder, Colorado), CarShare Vermont (Burlington, Vermont), and I-Go Car Sharing
(Chicago, Illinois).
Of these programs, all featured a multi-tiered approach to membership. This approach allows
users to choose the plan which best matches their anticipated level of usage, while encouraging
and rewarding users who use the service more regularly. This financial incentive is very
important, as each vehicle in the fleet incurs a number of fixed costs, regardless of how often
they are used. The higher the utilization of each vehicle, the lower the fixed cost per mile and
the greater the revenue stream. These cost savings can in turn be used to expand the car sharing
network.
Ch
apte
r: 6
| P
rice
Str
uct
ure
30
Table 5: Car sharing Membership Plan Comparison
Operator Tiers Membership Fee Hourly Mileage
Ithaca Car Share Just In Case $50.00/year $7.95 $0.20
It's My Car $200.00/year $4.95 $0.20
CuseCar Student $20.00/year $7.95 $0.20
Sponsor $20.00/year $5.95 $0.20
Out-N-About $60.00/year $7.95 $0.20
Commuter $200/year or
$18/month
$5.95 $0.20,
60 miles incl.
Buffalo Car Share Buffalo Settler $50/year or
$5/month
$8.00 $0.20
Buffalo Roamer $20/month
(1 driver)
$25/month
(2 drivers)
$5.00 $0.20
eGo CarShare Peace of Mind $0 $4.50–6.50 $0.30
Free Wheelin’ $10/month $2.50-4.00 $0.30
I-Go Car Sharing Go Standard $0.00 $6.75 $0.40
Go Standard Plus $0.00 $8.50 $0.40,
150 miles incl.
Go Budget $15.00/month
3 hours incl.
$8.50
$0.40,
150 miles incl.
Go Anytime $30.00/month $7.00 $0.40,
150 miles incl.
CarShare Vermont Share-a-Little $5/month
$50/year
$6.95 $0.25
Share-a-Lot $15/month
$150/year
$4.95 $0.25

Ch
apte
r: 6
| P
rice
Str
uct
ure
31
Developing Capital CarShare Membership Plans
When developing the structure for Capital CarShare, two key objectives were established: a)
Create a simple, easy to communicate structure, and b) ensure the structure is flexible,
competitive, and profitable. With these objectives in mind, the following membership plan was
created, providing users with a range of options to best fit their transit needs.
Table 6: Capital CarShare Membership Plan Tiers
Tier Target Audience Monthly Fee Usage Fee
Basic Members who are not sure of their
projected usage, or only plan on
using Capital CarShare occasionally.
$0 Hourly Rates starting
at $9.00; $0.25/mile
Silver Members who plan to use Capital
CarShare at least weekly.
(at least 5 hours per month)
$10
Or $100/year
Hourly Rates starting
at $7.00; $0.25/mile
Gold Members who plan to use Capital
CarShare on a regular basis.
(at least 10 hours per month)
$30
Or $300/year
Hourly Rates starting
at $5.00; $0.25/mile.
Application
Fee
Covers requesting and processing
the DMV records check
$30; Waived for Gold Annual
Subscriptions
This multi-tiered system provides plans which fit all usage patterns, while rewarding those who
more actively use their memberships and/or are willing to commit to an annual membership.
The member’s break-even point for the silver level is five hours monthly, while for the gold
membership it is seven hours monthly. This encourages greater use on the part of the member
while helping to increase vehicle usage.
Figure 5 revisits the chart shown earlier in the report, but expands to show all three tiers of
service. With this chart, it is easy to see how members who travel longer distances or use the
service more frequently can save on their travel expenses by opting for a higher membership
tier. Furthermore, the break-even point against the cost of private ownership becomes even
greater, allowing a wider segment of travelers to benefit from car-sharing while maintaining a
profitable revenue flow for the organization.

Ch
apte
r: 6
| P
rice
Str
uct
ure
32
Business Membership
In addition to the individual membership options, Capital CarShare will offer local businesses
the option of participating in this new transportation option through the Business Silver plan.
This plan is structured similar to the Silver Tier plan, with a $100 annual membership fee and a
$7.00 hourly charge. However, business owners will have the option of adding drivers for a
reduced rate of $20 each. Annual membership subscribers will have their first driver application
fee waived. The Business Silver plan will give business owners greater control over their
transportation expenditures, while eliminating the overhead that comes with owning a business
vehicle or fleet.
Penalties & Fees
As with any other service, occasionally there will be violations of the membership agreement.
These violations may range from the mundane, such as returning a car late or leaving the
windows open, to the more serious, such as smoking in the vehicle or damaging the vehicle. In
order to both discourage such behavior, as well as accommodate for the financial burden taken
on by the organization to remedy these actions, a penalty fee structure has been established.
Generally speaking these fees will run between $15 and $35 per infraction. These fees will be
used to help maintain these vehicles, as well as cover expenses such as providing alternate
transportation for affected members.
For accidents or vehicle damage which results in an insurance claim, members will be
responsible for paying the $500 insurance deductible incurred by the organization. This would
be similar if the incident occurred in their private vehicle. By holding the member responsible
for reimbursement of the deductible, the impact on the organization and larger membership
base is reduced.
$0.00
$2,000.00
$4,000.00
$6,000.00
$8,000.00
$10,000.00
$12,000.00
0 1,500 3,000 4,500 6,000
An
nu
al C
ost
Annual Mileage
Car Ownership vs. Car Share
Private Vehicle
Base Plan
Silver Level
Gold Level
Figure 6: Capital CarShare Membership Tiers and Private Ownership

Ch
apte
r: 6
| P
rice
Str
uct
ure
33
Table 7: Abbreviated Schedule of Fees
Violation Description Fee
Vehicle not left in
“Ready” Condition
Vehicle is left with less than ¼ tank
of gas, parked in an incorrect
location, and/or dirty or with litter.
$30
Late Return of Vehicle Car is returned after the
reservation time has finished.
Reported: $4.25/15 minutes
Unreported: $7.50/15 minutes
Smoking or Pets (without
crate) in Car
Occupant either smoked or had
animals in the vehicle.
$50 or reasonable cleaning
costs, whichever is greater.
Vehicle Damaged
(minor)
Minor damage to the vehicle, with
repair costs less than $500.
$30 + reasonable repair costs.
(No charge if caused by
normal wear and tear.)
Vehicle Damaged (major) Major damage to the vehicle, with
repair costs exceeding $50.0.
$30 + $500 deductible
Lost Gas Card Fleet gas card is lost/stolen $15
Lost Vehicle Key Vehicle key is lost or irreparably
damaged.
$150
Replacement
Membership Card
Membership RFID Card is
damaged or lost,
One complimentary
replacement per year.
$10 each afterwards.
Ch
apte
r: 7
| O
rgan
izat
ion
al S
tru
ctu
re
34
7| Organizational Structure
For-Profit vs. Non-Profit
Capital CarShare will be formed as a nonprofit corporation under the laws of New York State.
While this does entail some additional paperwork than forming as a for-profit corporation, this
type of legal entity will better position the organization to raise capital through grants and
donations. Furthermore, forming as a nonprofit entity will allow Capital CarShare to pursue
expanding car sharing and related services to areas which might prove more challenging to
serve profitably. Capital CarShare will purposefully set a double bottom line for itself,
measuring success not simply on profitability but also on improving quality of life of the
neighborhoods in which it operates while reducing the environmental impact of private car
ownership.
Organizational Oversight
The Board of Directors for Capital CarShare will be made up of representatives from key groups
representing stakeholders, local and regional transit organizations, as well as the members
themselves. Directors are responsible for overseeing and setting the overall strategy of the
organization, as well as providing guidance and direction for the executive director and staff. A
mix of inside and outside directorships was utilized to provide the board with a balance of
specialized experience and independent oversight. The tentative board composition is as such:
- Executive Director
- Local Government Representative
- Regional Transportation Agency (CDTA/CDTC) Representative
- Business Improvement District Representative
- Educational Institution Representative
- Member Representative
Staffing
Initially, Capital CarShare should be staffed with a full-time executive director, a part-time
membership coordinator, and two part-time interns. These staff members will be responsible for
the day-to-day operations of the business, as well as raising awareness of Capital CarShare and
car sharing in general in the community.
Executive Director
This position will be responsible for all aspects of the day-to-day operation of the program,
including member services, community outreach, car-sharing advocacy, grant-writing and
administration. It is critical that the individual chosen for this position be entrepreneurial and a

Ch
apte
r: 7
| O
rgan
izat
ion
al S
tru
ctu
re
35
self-starter. In a large part, the success of Capital CarShare will rely on the dedication and skills
of the executive director. This position will report to the Board of Directors.
Membership Coordinator
This position is responsible for all aspects of the member experience, including community
outreach, billing and account support, as well as system and infrastructure management. The
Membership Coordinator is responsible for overseeing the Car Captain program, as well as
resolving any disputes or situations that may arise between members or concerns members
have about the vehicles. Initially, this position will be a part-time position; however, it should
become full-time within twelve months. This position reports to the Executive Director.
Interns
Interns working for Capital CarShare during its early stages will have an invaluable
opportunity to assist in the building of a new car sharing organization, providing learning
opportunities which will well-position these individuals for their future careers. Ideally, one
intern each will be assigned to the Executive Director and the Membership Coordinator to assist
in projects related to their core responsibilities. In addition, each intern will be responsible for
providing front-line member support for reservation inquiries, basic problem resolution and
membership questions. Compensation will not be available for these positions; however
CarShare interns will be eligible for course credit at participating institutions and will receive a
complimentary Capital CarShare membership which will extend for one year after the
completion of their internship.
Car Captains
An important member of the Capital CarShare team will be the Car Captain. These volunteers
will be responsible for checking in on an assigned vehicle on a weekly basis to make sure that
the organization’s service standards are being upheld. Car Captains will ensure that the cars are
clean, visually ensure that they are not damaged or missing any components, and alert Capital
CarShare staff if the vehicle needs further attention. In addition, Car Captains will be
responsible for shoveling out their assigned vehicle within twelve hours of the end of a
snowstorm. For their service and support, Car Captains will be granted a complimentary Gold
Tier membership for as long as they serve in their capacity. The Car Captain program, used in
many car sharing organizations around the country, is a great way for supporters to get
involved in the Capital CarShare organization and provides invaluable support for car sharing
in the Capital Region.
Ch
apte
r: 8
| Im
ple
men
tati
on
& F
utu
re G
row
th
36
8| Implementation & Future Growth
Growth Patterns
Although Capital CarShare anticipates an aggressive pattern of membership growth, for our
financial projection we have worked with a conservative growth number of fifteen members per
month on average, adjusted for seasonal fluctuations and decreasing interest between
implementation rollouts. Furthermore, as a result of a planned outreach campaign, we have
anticipated an initial membership base of fifty members. These figures will lead to an
anticipated membership base of 340 members by the end of the second year in operation. This
level of membership will support up to fifteen cars, using a benchmark ratio of twenty-two to
twenty-five members to one car.
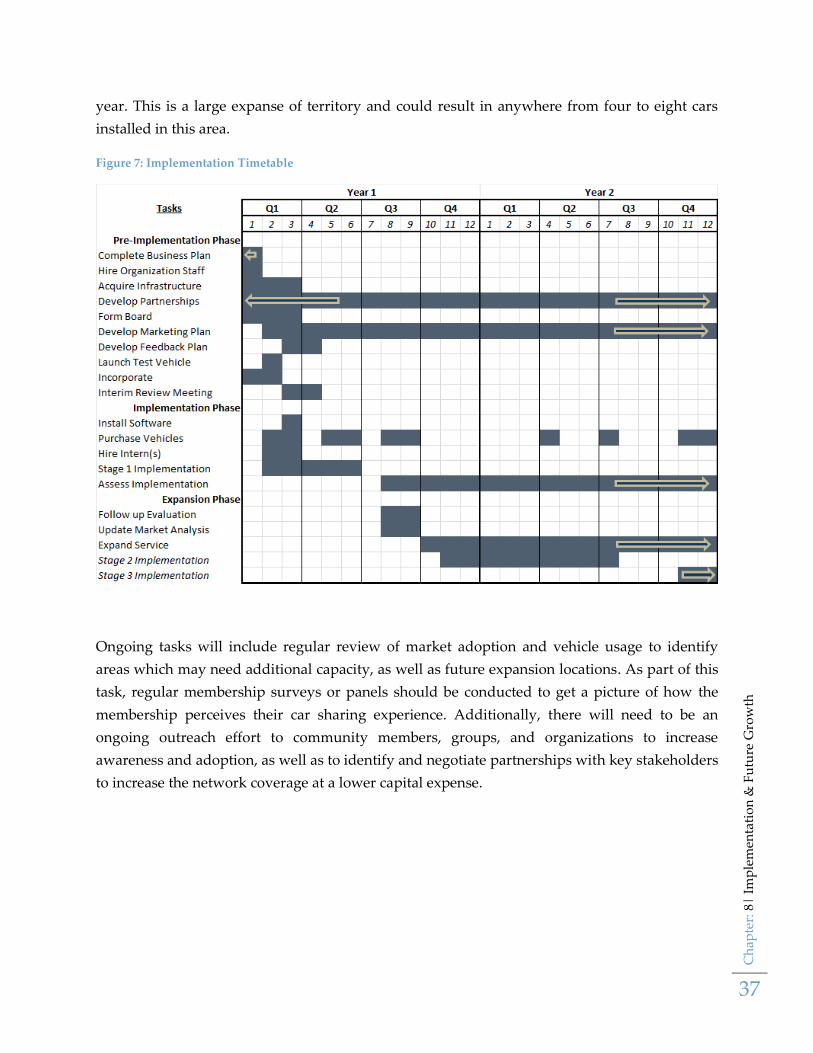
Implementation Timeframe
As mentioned in the discussion of implementation stages, the planned initial roll-out of Capital
CarShare is scheduled to take place over a period of three years, with continued expansion
afterwards. It is estimated that the first three to six months will be spent by organizers locating
and hiring an executive director, completing and filing the organizing documents for
incorporation and 501(3)c status, identifying and soliciting funding sources, and sourcing and
purchasing the required infrastructure. Although some of these tasks will be on-going, such as
soliciting grants and procuring infrastructure, the aforementioned tasks need to be completed
prior to the start of operations.
The first implementation stage, centered around Downtown Albany, Center Square, and
University Heights, will start as soon as feasibly possible and will initially wrap up
approximately in the third quarter of the first year. It will be vital that care is taken to identify
and correct any issues as soon as possible during this stage, as it will both serve as a model for
future implementation and attract substantial public and media attention. Initially, this stage
could involve the installation of anywhere between four and eight cars throughout the area,
depending on market penetration.
It is expected that implementation stage 2, which involves expanding car sharing pods into
Albany’s Park South and Pine Hills neighborhoods, will begin to start around the fourth quarter
of the first year and continue into the third quarter of the second year. Ideally, new pods will be
added gradually, expanding the network radially out through the targeted area. Depending on
adoption and market penetration, there could be anywhere from two to six cars installed during
this stage.
The third stage of implementation, which would bring car sharing into the Arbor Hill, South
End, and Delaware Avenue neighborhoods, would tentatively take place through the third
Ch
apte
r: 8
| Im
ple
men
tati
on
& F
utu
re G
row
th
37
year. This is a large expanse of territory and could result in anywhere from four to eight cars
installed in this area.
Figure 7: Implementation Timetable
Ongoing tasks will include regular review of market adoption and vehicle usage to identify
areas which may need additional capacity, as well as future expansion locations. As part of this
task, regular membership surveys or panels should be conducted to get a picture of how the
membership perceives their car sharing experience. Additionally, there will need to be an
ongoing outreach effort to community members, groups, and organizations to increase
awareness and adoption, as well as to identify and negotiate partnerships with key stakeholders
to increase the network coverage at a lower capital expense.

Ch
apte
r: 9
| F
inan
cial
Ou
tlo
ok
38
9| Financial Outlook
In order to develop a comprehensive set of financial projections, the consultant team
incorporated information gathered from service providers and other car sharing organizations,
as well as independent analysis specific to the Capital Region. As with any set of projections,
certain assumptions were made, specifically in regards to membership projections and funding
sources. While we feel these numbers are both conservative in nature and realistic in scope,
these figures should be viewed as acquisition goals; any change in these numbers could require
either extending the time frame of the implementation plan or finding alternative funding
sources.
For the first year of operations, our projections show revenue of $331,957.00, of which
$156,957.00 are revenue from operations and $175,000.00 are proceeds from start-up funding
sources. The largest revenue stream is from hourly usage charges, accounting for $99,400.50.
For this same period, our projections show an expense total of $328,795.94. Vehicle purchases
made up the largest expense at $121,278.00, followed by staff wages at $74,950.00. These figures
result in a projected net profit for the first year of $4,848.56. With one-time revenue and expense
categories omitted, there is a net operating loss of $28,911.20 for the first year.
During the second year, there is projected revenue of $399,607.00, primarily sourced from car
sharing operations. As with the first year the largest projected revenue stream is hourly usage
charges, which contributes $244,989.00 in revenue. During this same period, there is a projected
$358,741.90 in expenses. With one-time vehicle acquisition expenses omitted, annual expenses
are projected at $253,454.90, a 18.79% increase in variable expenses. This increase is largely
attributed to increased fuel and maintenance costs, as well as the transition of the membership
coordinator from part time to full time status.
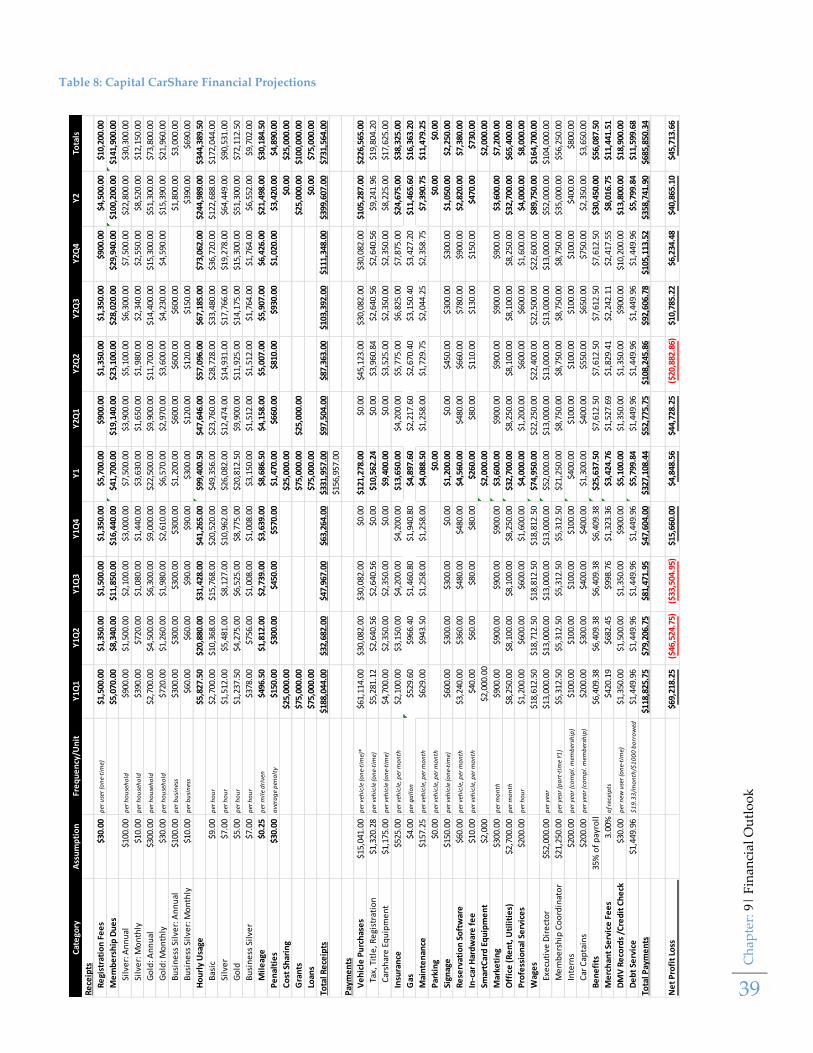
Ch
apte
r: 9
| F
inan
cial
Ou
tlo
ok
39
Table 8: Capital CarShare Financial Projections C
ate
gory
Ass
um
pti
on
Fre
qu
en
cy/U
nit
Y1Q
1Y
1Q2
Y1Q
3Y
1Q4
Y1
Y2Q
1Y
2Q2
Y2Q
3Y
2Q4
Y2
Tota
ls
Re
ceip
ts
R
egi
stra
tio
n F
ee
s$3
0.00
per
use
r (o
ne-
tim
e)$1
,500
.00
$1,3
50.0
0$1
,500
.00
$1,3
50.0
0$5
,700
.00
$900
.00
$1,3
50.0
0$1
,350
.00
$900
.00
$4,5
00.0
0$1
0,20
0.00
M
em
be
rsh
ip D
ue
s$5
,070
.00
$8,3
40.0
0$1
1,85
0.00
$16,
440.
00$4
1,70
0.00
$19,
140.
00$2
3,10
0.00
$28,
020.
00$2
9,94
0.00
$100
,200
.00
$141
,900
.00
Sil
ver:
An
nu
al$1
00.0
0p
er h
ou
seh
old
$900
.00
$1,5
00.0
0$2
,100
.00
$3,0
00.0
0$7
,500
.00
$3,9
00.0
0$5
,100
.00
$6,3
00.0
0$7
,500
.00
$22,
800.
00$3
0,30
0.00
Sil
ver:
Mo
nth
ly$1
0.00
per
ho
use
ho
ld$3
90.0
0$7
20.0
0$1
,080
.00
$1,4
40.0
0$3
,630
.00
$1,6
50.0
0$1
,980
.00
$2,3
40.0
0$2
,550
.00
$8,5
20.0
0$1
2,15
0.00
Go
ld: A
nn
ual
$300
.00
per
ho
use
ho
ld$2
,700
.00
$4,5
00.0
0$6
,300
.00
$9,0
00.0
0$2
2,50
0.00
$9,9
00.0
0$1
1,70
0.00
$14,
400.
00$1
5,30
0.00
$51,
300.
00$7
3,80
0.00
Go
ld: M
on
thly
$30.
00p
er h
ou
seh
old
$720
.00
$1,2
60.0
0$1
,980
.00
$2,6
10.0
0$6
,570
.00
$2,9
70.0
0$3
,600
.00
$4,2
30.0
0$4
,590
.00
$15,
390.
00$2
1,96
0.00
Bu
sin
ess
Sil
ver:
An
nu
al$1
00.0
0p
er b
usi
nes
s$3
00.0
0$3
00.0
0$3
00.0
0$3
00.0
0$1
,200
.00
$600
.00
$600
.00
$600
.00
$1,8
00.0
0$3
,000
.00
Bu
sin
ess
Sil
ver:
Mo
nth
ly$1
0.00
per
bu
sin
ess
$60.
00$6
0.00
$90.
00$9
0.00
$300
.00
$120
.00
$120
.00
$150
.00
$390
.00
$690
.00
H
ou
rly
Usa
ge$5
,827
.50
$20,
880.
00$3
1,42
8.00
$41,
265.
00$9
9,40
0.50
$47,
646.
00$5
7,09
6.00
$67,
185.
00$7
3,06
2.00
$244
,989
.00
$344
,389
.50
Bas
ic$9
.00
per
ho
ur
$2,7
00.0
0$1
0,36
8.00
$15,
768.
00$2
0,52
0.00
$49,
356.
00$2
3,76
0.00
$28,
728.
00$3
3,48
0.00
$36,
720.
00$1
22,6
88.0
0$1
72,0
44.0
0
Sil
ver
$7.0
0p
er h
ou
r$1
,512
.00
$5,4
81.0
0$8
,127
.00
$10,
962.
00$2
6,08
2.00
$12,
474.
00$1
4,93
1.00
$17,
766.
00$1
9,27
8.00
$64,
449.
00$9
0,53
1.00
Go
ld$5
.00
per
ho
ur
$1,2
37.5
0$4
,275
.00
$6,5
25.0
0$8
,775
.00
$20,
812.
50$9
,900
.00
$11,
925.
00$1
4,17
5.00
$15,
300.
00$5
1,30
0.00
$72,
112.
50
Bu
sin
ess
Sil
ver
$7.0
0p
er h
ou
r$3
78.0
0$7
56.0
0$1
,008
.00
$1,0
08.0
0$3
,150
.00
$1,5
12.0
0$1
,512
.00
$1,7
64.0
0$1
,764
.00
$6,5
52.0
0$9
,702
.00
Mil
eag
e$0
.25
per
mil
e d
rive
n$4
96.5
0$1
,812
.00
$2,7
39.0
0$3
,639
.00
$8,6
86.5
0$4
,158
.00
$5,0
07.0
0$5
,907
.00
$6,4
26.0
0$2
1,49
8.00
$30,
184.
50
P
en
alti
es
$30.
00a
vera
ge
pen
alt
y$1
50.0
0$3
00.0
0$4
50.0
0$5
70.0
0$1
,470
.00
$660
.00
$810
.00
$930
.00
$1,0
20.0
0$3
,420
.00
$4,8
90.0
0
C
ost
Sh
arin
g$2
5,00
0.00
$25,
000.
00$0
.00
$25,
000.
00
G
ran
ts$7
5,00
0.00
$75,
000.
00$2
5,00
0.00
$25,
000.
00$1
00,0
00.0
0
L
oan
s$7
5,00
0.00
$75,
000.
00$0
.00
$75,
000.
00
Tota
l Re
ceip
ts$1
88,0
44.0
0$3
2,68
2.00
$47,
967.
00$6
3,26
4.00
$331
,957
.00
$97,
504.
00$8
7,36
3.00
$103
,392
.00
$111
,348
.00
$399
,607
.00
$731
,564
.00
$156
,957
.00
Pay
me
nts
V
eh
icle
Pu
rch
ase
s$1
5,04
1.00
per
veh
icle
(on
e-ti
me)
*$6
1,11
4.00
$30,
082.
00$3
0,08
2.00
$0.0
0$1
21,2
78.0
0$0
.00
$45,
123.
00$3
0,08
2.00
$30,
082.
00$1
05,2
87.0
0$2
26,5
65.0
0
Tax
, Tit
le, R
egi
stra
tio
n$1
,320
.28
per
veh
icle
(on
e-ti
me)
$5,2
81.1
2$2
,640
.56
$2,6
40.5
6$0
.00
$10,
562.
24$0
.00
$3,9
60.8
4$2
,640
.56
$2,6
40.5
6$9
,241
.96
$19,
804.
20
Car
shar
e E
qu
ipm
en
t$1
,175
.00
per
veh
icle
(on
e-ti
me)
$4,7
00.0
0$2
,350
.00
$2,3
50.0
0$0
.00
$9,4
00.0
0$0
.00
$3,5
25.0
0$2
,350
.00
$2,3
50.0
0$8
,225
.00
$17,
625.
00
In
sura
nce
$525
.00
per
veh
icle
, per
mo
nth
$2,1
00.0
0$3
,150
.00
$4,2
00.0
0$4
,200
.00
$13,
650.
00$4
,200
.00
$5,7
75.0
0$6
,825
.00
$7,8
75.0
0$2
4,67
5.00
$38,
325.
00
G
as$4
.00
per
ga
llo
n$5
29.6
0$9
66.4
0$1
,460
.80
$1,9
40.8
0$4
,897
.60
$2,2
17.6
0$2
,670
.40
$3,1
50.4
0$3
,427
.20
$11,
465.
60$1
6,36
3.20
M
ain
ten
ance
$157
.25
per
veh
icle
, per
mo
nth
$629
.00
$943
.50
$1,2
58.0
0$1
,258
.00
$4,0
88.5
0$1
,258
.00
$1,7
29.7
5$2
,044
.25
$2,3
58.7
5$7
,390
.75
$11,
479.
25
P
arki
ng
$0.0
0p
er v
ehic
le, p
er m
on
th$0
.00
$0.0
0$0
.00
S
ign
age
$150
.00
per
veh
icle
(on
e-ti
me)
$600
.00
$300
.00
$300
.00
$0.0
0$1
,200
.00
$0.0
0$4
50.0
0$3
00.0
0$3
00.0
0$1
,050
.00
$2,2
50.0
0
R
ese
rvat
ion
So
ftw
are
$60.
00p
er v
ehic
le, p
er m
on
th$3
,240
.00
$360
.00
$480
.00
$480
.00
$4,5
60.0
0$4
80.0
0$6
60.0
0$7
80.0
0$9
00.0
0$2
,820
.00
$7,3
80.0
0
In
-car
Har
dw
are
fe
e$1
0.00
per
veh
icle
, per
mo
nth
$40.
00$6
0.00
$80.
00$8
0.00
$260
.00
$80.
00$1
10.0
0$1
30.0
0$1
50.0
0$4
70.0
0$7
30.0
0
S
mar
tCar
d E
qu
ipm
en
t$2
,000
$2,0
00.0
0$2
,000
.00
$2,0
00.0
0
M
arke
tin
g$3
00.0
0p
er m
on
th$9
00.0
0$9
00.0
0$9
00.0
0$9
00.0
0$3
,600
.00
$900
.00
$900
.00
$900
.00
$900
.00
$3,6
00.0
0$7
,200
.00
O
ffic
e (
Re
nt,
Uti
liti
es)
$2,7
00.0
0p
er m
on
th$8
,250
.00
$8,1
00.0
0$8
,100
.00
$8,2
50.0
0$3
2,70
0.00
$8,2
50.0
0$8
,100
.00
$8,1
00.0
0$8
,250
.00
$32,
700.
00$6
5,40
0.00
P
rofe
ssio
nal
Se
rvic
es
$200
.00
per
ho
ur
$1,2
00.0
0$6
00.0
0$6
00.0
0$1
,600
.00
$4,0
00.0
0$1
,200
.00
$600
.00
$600
.00
$1,6
00.0
0$4
,000
.00
$8,0
00.0
0
W
age
s$1
8,61
2.50
$18,
712.
50$1
8,81
2.50
$18,
812.
50$7
4,95
0.00
$22,
250.
00$2
2,40
0.00
$22,
500.
00$2
2,60
0.00
$89,
750.
00$1
64,7
00.0
0
Exe
cuti
ve D
ire
cto
r$5
2,00
0.00
per
yea
r$1
3,00
0.00
$13,
000.
00$1
3,00
0.00
$13,
000.
00$5
2,00
0.00
$13,
000.
00$1
3,00
0.00
$13,
000.
00$1
3,00
0.00
$52,
000.
00$1
04,0
00.0
0
Me
mb
ers
hip
Co
ord
inat
or
$21,
250.
00p
er y
ear
(pa
rt-t
ime
Y1)
$5,3
12.5
0$5
,312
.50
$5,3
12.5
0$5
,312
.50
$21,
250.
00$8
,750
.00
$8,7
50.0
0$8
,750
.00
$8,7
50.0
0$3
5,00
0.00
$56,
250.
00
In
tern
s$2
00.0
0p
er y
ear
(co
mp
l. m
emb
ersh
ip)
$100
.00
$100
.00
$100
.00
$100
.00
$400
.00
$100
.00
$100
.00
$100
.00
$100
.00
$400
.00
$800
.00
Car
Cap
tain
s$2
00.0
0p
er y
ear
(co
mp
l. m
emb
ersh
ip)
$200
.00
$300
.00
$400
.00
$400
.00
$1,3
00.0
0$4
00.0
0$5
50.0
0$6
50.0
0$7
50.0
0$2
,350
.00
$3,6
50.0
0
B
en
efi
ts35
% o
f p
ayro
ll$6
,409
.38
$6,4
09.3
8$6
,409
.38
$6,4
09.3
8$2
5,63
7.50
$7,6
12.5
0$7
,612
.50
$7,6
12.5
0$7
,612
.50
$30,
450.
00$5
6,08
7.50
M
erc
han
t Se
rvic
e F
ee
s3.
00%
of r
ecei
pts
$420
.19
$682
.45
$998
.76
$1,3
23.3
6$3
,424
.76
$1,5
27.6
9$1
,829
.41
$2,2
42.1
1$2
,417
.55
$8,0
16.7
5$1
1,44
1.51
D
MV
Re
cord
s /C
red
it C
he
ck$3
0.00
per
new
use
r (o
ne-
tim
e)$1
,350
.00
$1,5
00.0
0$1
,350
.00
$900
.00
$5,1
00.0
0$1
,350
.00
$1,3
50.0
0$9
00.0
0$1
0,20
0.00
$13,
800.
00$1
8,90
0.00
D
eb
t Se
rvic
e$1
,449
.96
$1
9.3
3/m
on
th/$
10
00
bo
rro
wed
$1,4
49.9
6$1
,449
.96
$1,4
49.9
6$1
,449
.96
$5,7
99.8
4$1
,449
.96
$1,4
49.9
6$1
,449
.96
$1,4
49.9
6$5
,799
.84
$11,
599.
68
Tota
l Pay
me
nts
$118
,825
.75
$79,
206.
75$8
1,47
1.95
$47,
604.
00$3
27,1
08.4
4$5
2,77
5.75
$108
,245
.86
$92,
606.
78$1
05,1
13.5
2$3
58,7
41.9
0$6
85,8
50.3
4
Ne
t P
rofi
t Lo
ss$6
9,21
8.25
($46
,524
.75)
($33
,504
.95)
$15,
660.
00$4
,848
.56
$44,
728.
25($
20,8
82.8
6)$1
0,78
5.22
$6,2
34.4
8$4
0,86
5.10
$45,
713.
66
Top Related