


Languages
Pages
Legal


CAM Network CodeCMP Guidelines
Peter Hlusek
Adviser, Market, ENTSOG
Stakeholders Engagement Workshop
Stakeholders Workshop
October 2017
2
Network Codes are looking to achieve
Competition
Increase
Transparency
Entry
Barriers
Removal
Short Term
Liquidity
Better
Connected
Markets
Legislation
Harmonization

3
Capacity Allocation Mechanism Network Code (EU) 2017/459

4
Capacity Allocation Mechanisms NC
Harmonized auction
procedures and
bundled products
enhance transparent
and equal access
Objective
Standard set of Bundled
capacity products
Auctions via booking
platform
Short term reservations
Virtual Interconnection
Points
IEM Contribution
Simplify allocation
procedures
Establish one-stop shop
for booking
Ensures availability of
short term capacity
Facilitate hub-to-hub
booking

5
Key concepts in the CAM NC
• Auctions as the mechanism for capacity allocation• Standardised product set• Short term capacity reservation of at least 10%• Bundled cross border contracts• Merging of IPs connecting the same TSO systems into a “Virtual
Interconnection Point”• Capacity offered via joint booking platform(s)

6
Booking platforms in EU
*

7
Changes in comparison to Regulation (EC) 984/2013:
Article 11 – In the auction process for annual yearly capacity auctions shall cover the period for at least the upcoming 5 gas years
Article 11 – Default auction date for yearly capacity products in July from year 2018
Article 12 – Default auction date for quarterly capacity products in August from year 2017 + additional three quarterly auctions in November, February and May
Article 20 – Alignment of main terms and conditions
Article 21 – Bundling of existing transport contracts – capacity conversion service to be offered from January 2018 by all TSOs
Changes introduced in CAM NC amendmententry into force in March 2017

8
Changes in comparison to Regulation (EC) 984/2013:
Article 22 to 31 – Incremental capacity process
Article 32 – From 1 January 2018 yearly, quarterly and monthly interruptible capacity products may be offered only if corresponding firm capacity product was sold at an auction premium, was sold out, or was not offered
Article 37 – Booking platforms – Obligations for adjacent TSOs, NRAs and ACER to agree on a booking platform to be used for offer bundled capacity products + fall-back provisions if no agreement by TSOs
old Article 26 – Tariffs – has been deleted from CAM NC
Changes introduced in CAM NC amendment

9
Impact on the Internal Market
• Improved transparency• Decreased congestion (cont. /physical)• Capacity booking platforms and auctions• Standard products
Measurable impact
0
2
4
6
8
10
12
14
16
18
20
22
24
26
28
30
32
34
36
38
40
42€/MWh
Day-ahead average gas price on European hubs (overall evolution since 2012)
TTF VHP GASPOOL VHP NCG PEG Nord TRS PSV CEGH NBP Zeebrugge PVB
Source: Platts, Bloomberg Note: more specific information can
• Hub price convergence• Increased market liquidity• European TYNDP / Outlooks• Joint view on needed
infrastructure projects

10
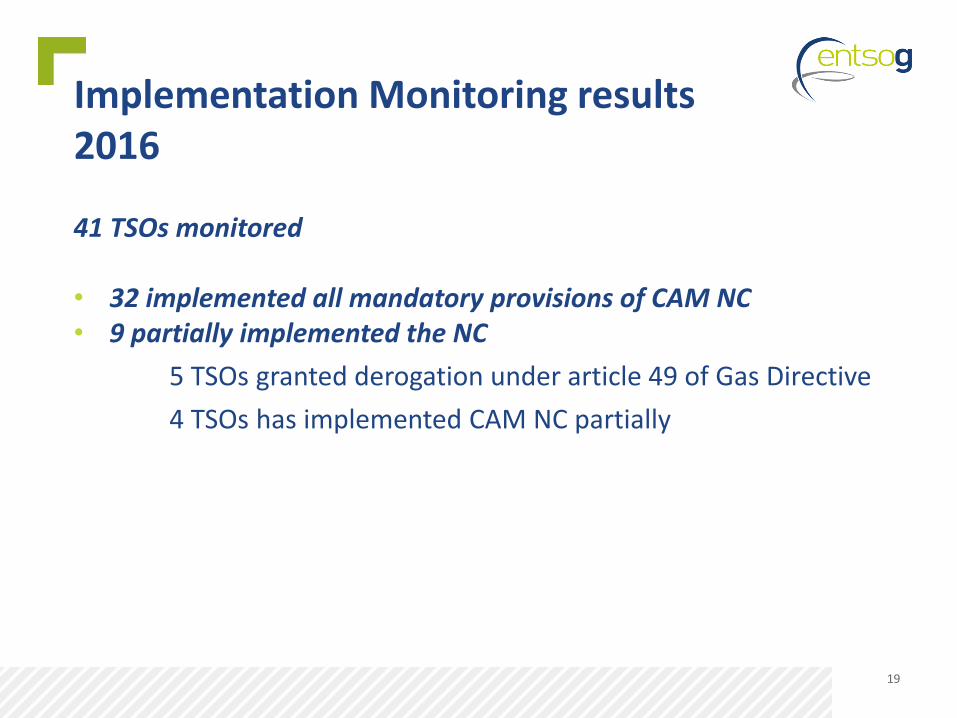
41 TSOs monitored
• 32 implemented all mandatory provisions of CAM NC• 9 partially implemented the NC
5 TSOs granted derogation under article 49 of Gas Directive
4 TSOs has implemented CAM NC partially
Implementation Monitoring results 2016
11
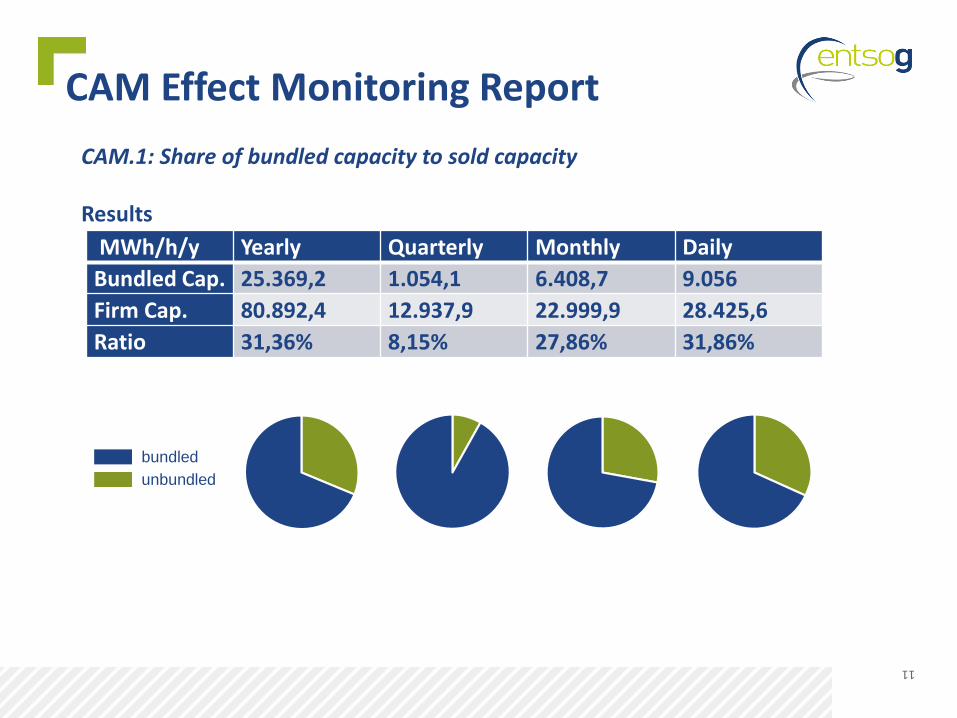
CAM Effect Monitoring Report
MWh/h/y Yearly Quarterly Monthly Daily
Bundled Cap. 25.369,2 1.054,1 6.408,7 9.056
Firm Cap. 80.892,4 12.937,9 22.999,9 28.425,6
Ratio 31,36% 8,15% 27,86% 31,86%
CAM.1: Share of bundled capacity to sold capacity
Results
bundled
unbundled
12
CAM 1: Share of bundled capacity to sold capacity
Improvements being considered for 2017 report:• Improved granularity (e.g. for MS or TSO or IP or Balancing zone)• New indicator CAM 1.1 where CAM relevant on one side only• Can we recalculate the CAM 1.1 for the previous year?• Look at IPs to see the level of bundled CAP offered• How to quantify the “reason for unbundled”?• Quarterly volumes – explanation why they are so low?• Use the same granularity as Balancing indicators
CAM Effect Monitoring Report
13
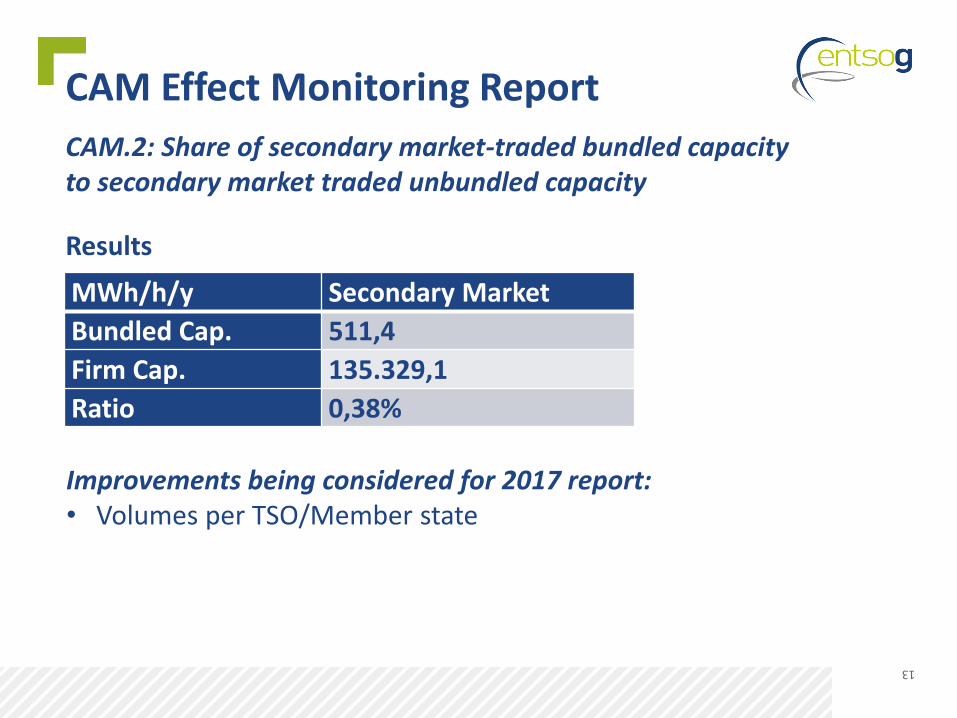
CAM Effect Monitoring Report
CAM.2: Share of secondary market-traded bundled capacity to secondary market traded unbundled capacity
Results
MWh/h/y Secondary Market
Bundled Cap. 511,4
Firm Cap. 135.329,1
Ratio 0,38%
Improvements being considered for 2017 report:• Volumes per TSO/Member state

14
CAM Effect Monitoring Report
CAM.3: Increase of market participants in a system
Results
Participants All Active
Sep 2015 1.892 494
Sep 2016 2.233 714
Improvements being considered for 2017 report:• Consider numbers per TSOs / MS / Market area
• Potential new indicator – number of VIPs created / in use per market area / per boundary
15
Congestion Management Procedures Guidelines Annex I, (EC) 715/2009

16
Capacity Allocation Mechanisms NC
Enhance markets
access and thereby
competitiveness by
effectively targeting
contractual congestion
Objective
Oversubscription and
Buy-Back
or
Day ahead UIOLI:
renomination restriction
Surrender of Capacity
Long Term UIOLI:
withdrawal of
systematically
underutilized capacity
IEM Contribution
To relief contractual
congestion
To enable shippers to
re-offer unused capacity
To avoid capacity
hoarding
17
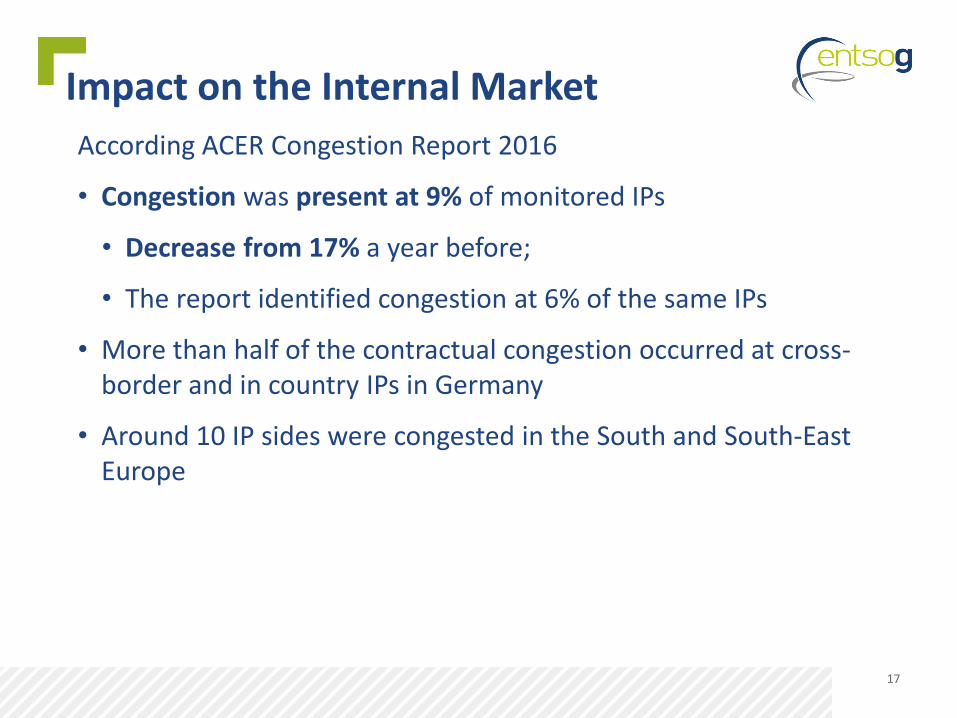
Impact on the Internal Market
According ACER Congestion Report 2016
• Congestion was present at 9% of monitored IPs
• Decrease from 17% a year before;
• The report identified congestion at 6% of the same IPs
• More than half of the contractual congestion occurred at cross-border and in country IPs in Germany
• Around 10 IP sides were congested in the South and South-East Europe

18
CMP Suggested Improvements
• Revise the CMP Guidelines to enhance the effectiveness of the measures.
• Offer more flexibility with regards to the application of the FDA UIOLI.
• Review the fourth criterion of the CMP Guidelines with regard to the Firm day-ahead use-it-or-lose-it mechanism (where no firm capacity product with a duration of one month or more has been offered) to align it with the other congestion criteria.
• Define contractual congestion for the day-ahead timeframes between hubs.
• Establish a deadline by which the Agency shall produce congestion reports in the future.
19
41 TSOs monitored
• 32 implemented all mandatory provisions of CAM NC• 9 partially implemented the NC
5 TSOs granted derogation under article 49 of Gas Directive
4 TSOs has implemented CAM NC partially
Implementation Monitoring results 2016

20
CMP Effect Monitoring ReportCMP.1: Additional capacity volumes made available through each CMPResult
MWh/h/y Offered Allocated
OS & BB 16.395,68 -
FDA UIOLI 679.346,10 2.344,21
Surrender 100.541,20 93.040,82
LT UIOLI - -
Improvements being considered for 2017 report:• How to consider volumes offered at non-congested IPs (to
provide a fuller picture)?• How to better indicate whether a “few” trades overly influence
the results?• To provide information on an IP basis• An overview of what is offered at each IP

21
CMP Effect Monitoring Report
CMP.2: Part of the capacity reallocated through CMP among total capacity reallocated
Result
Additional Capacity
MWh/h/y Offered Allocated
CMP Mechanisms 260.698,47 94.048,06
Secondary Market 105.117,59 104.967,59
Improvements being considered for 2017 report:• How many trades per measure• Include units on the graphs• How do the 2ndary market numbers for CMP2 and CAM2 tie
together
22
What might be next?
• Network code implementation is key to ensure the Internal Gas
Market – and should have highest priority
• Functionality of Network codes to be ensured
http://www.gasfuncnc.eu
• ENTSOG transparency platform - technical and commercial
data on transmission points
http://transparency.entsog.eu

Thank You for Your Attention
ENTSOG -- European Network of Transmission System Operators for GasAvenue de Cortenbergh 100, B-1000 Brussels
EML:WWW: www.entsog.eu
Top Related