


Languages
Pages
Legal

DISTRICT OF COLUMBIA WATER AND SEWER AUTHORITY249th MEETING OF THE BOARD OF DIRECTORS
Thursday, January 3, 20199:30 a.m.
5000 Overlook Avenue, SWRoom 407
I. Call to Order (Chairman Tommy Wells)
II. Roll Call (Linda Manley, Board Secretary)
Ill. Approval of December 1, 2018 Meeting Minutes and December 19, 201816th Special Meeting Minutes
lV. Chairman’s Overview
V. Committee Reports
1. Finance and Budget Committee (Sarah Motsch)2. Environmental Quality and Operations Committee (James Patteson)
Vl. Issues of General Interest
VII. CEO/General Manager’s Report (David Gadis)
VIIl. Summary of Contracts (FYI)
lX. Consent Items (Joint Use)
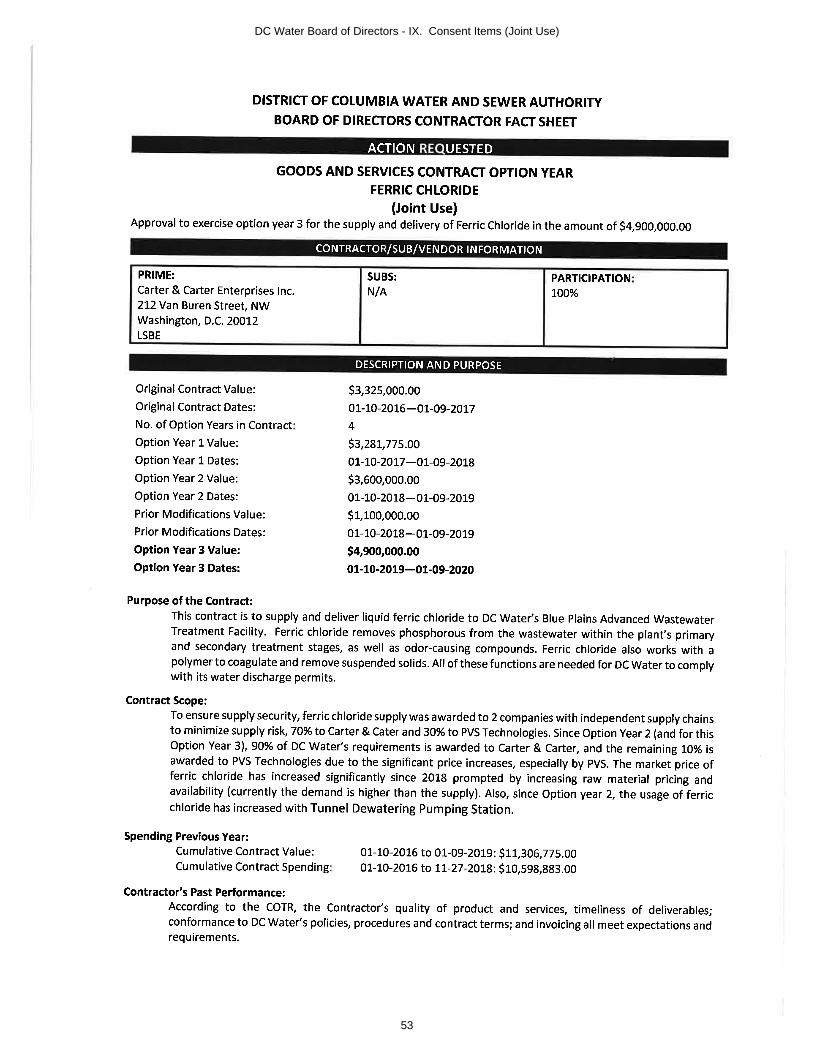
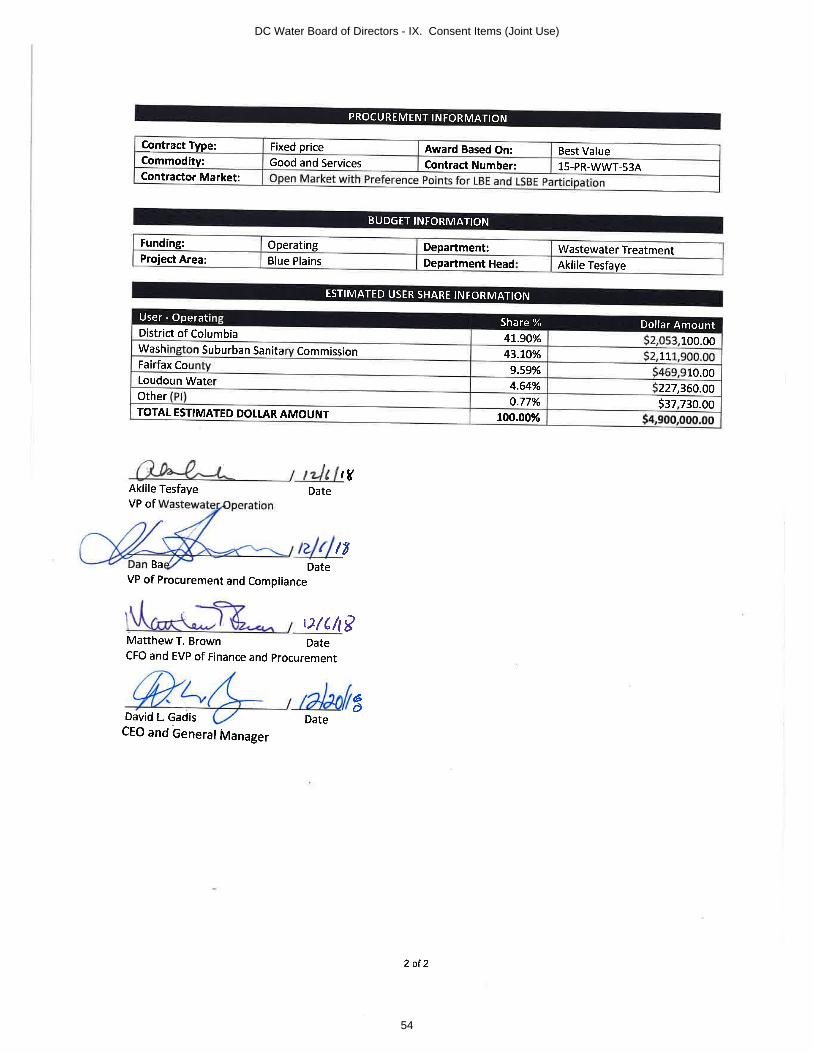
1. Approval to Exercise Option Year Three of Contract No. 15-PR-WWT-53A, Carter & Carter Enterprises, Inc. – Resolution No. 19-00 (Recommended by the Environmental Quality and Operations Committee 12/18/18)
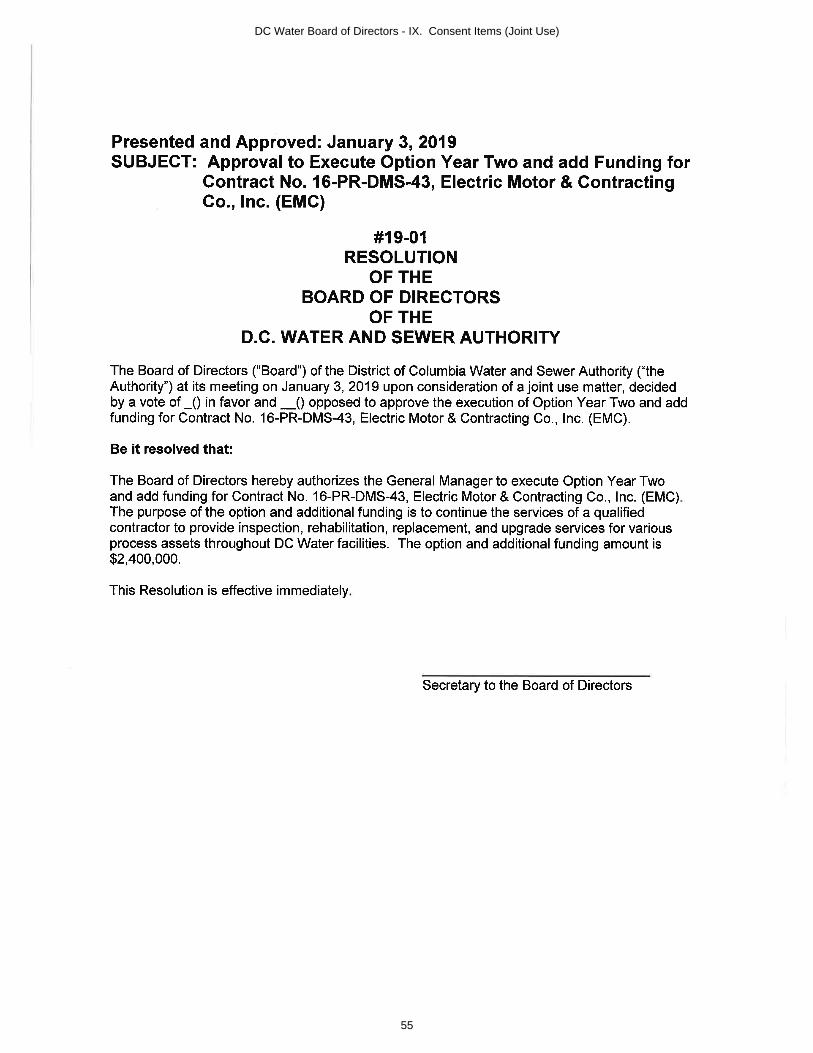
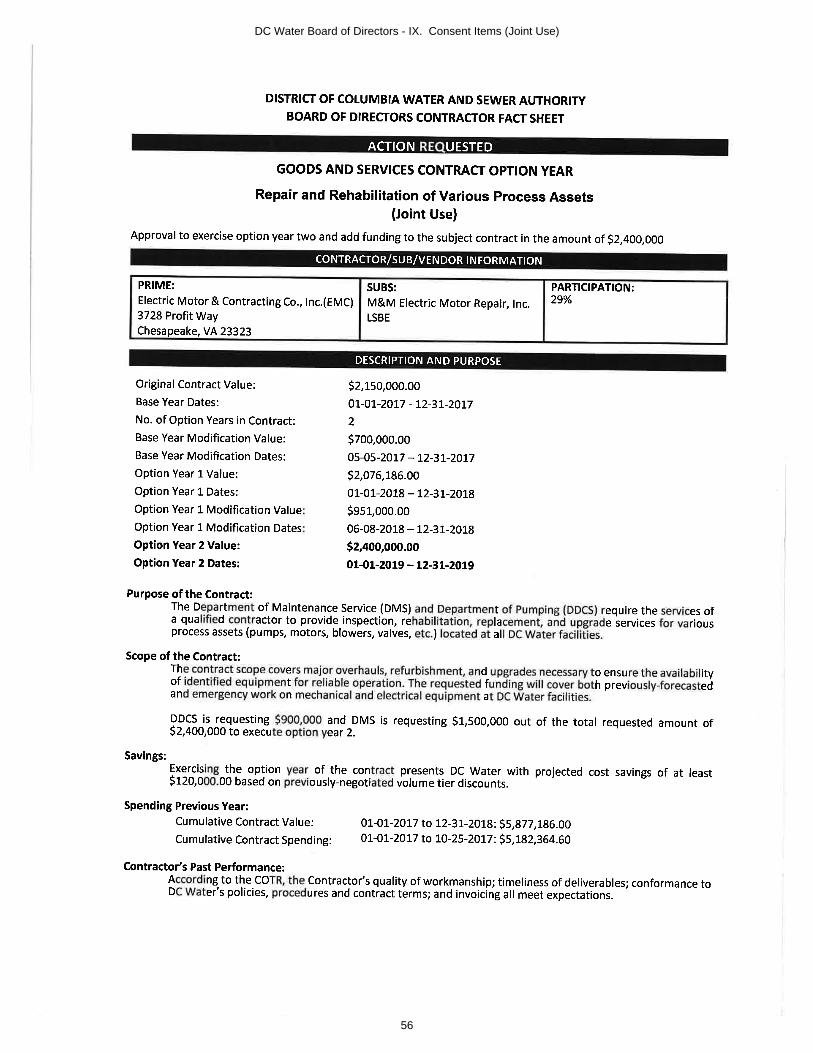
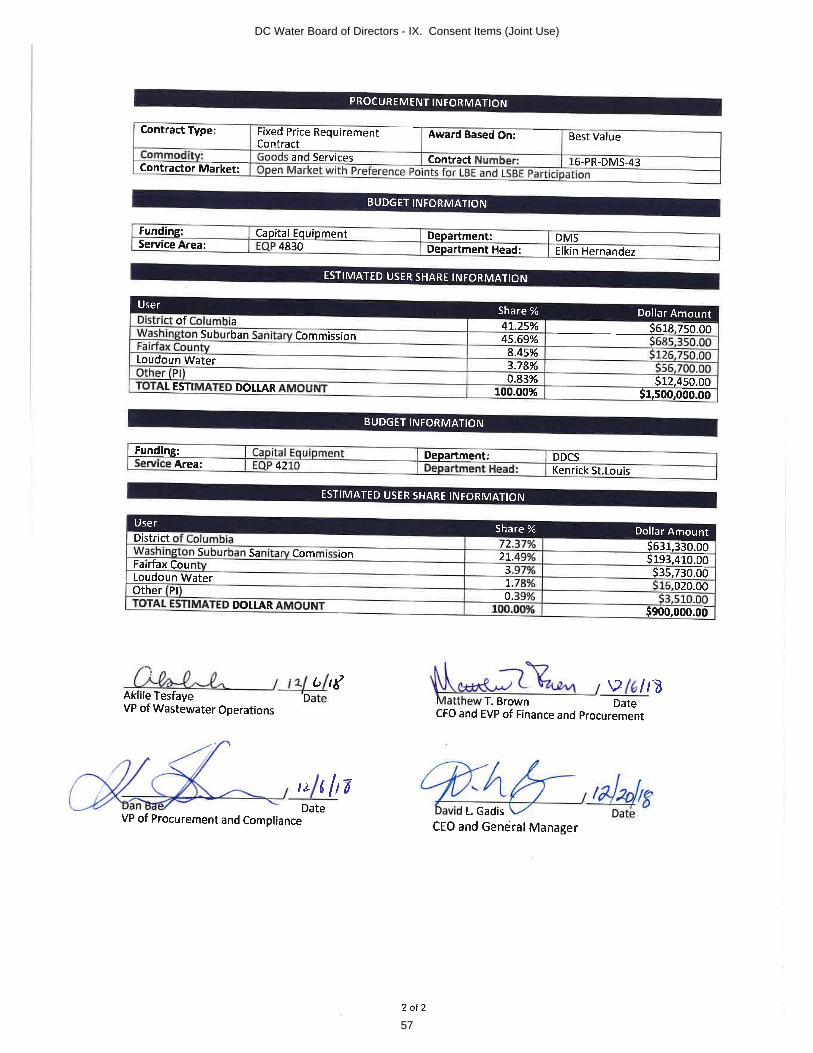
2. Approval to Exercise Option Year Two of Contract No. 16-PR-DMS-43, Electric Motor & Contracting Co., (EMC) – Resolution No. 19-01 (Recommended by the Environmental Quality and Operations Committee 12/18/18)
X. Consent Item Non-Joint Use
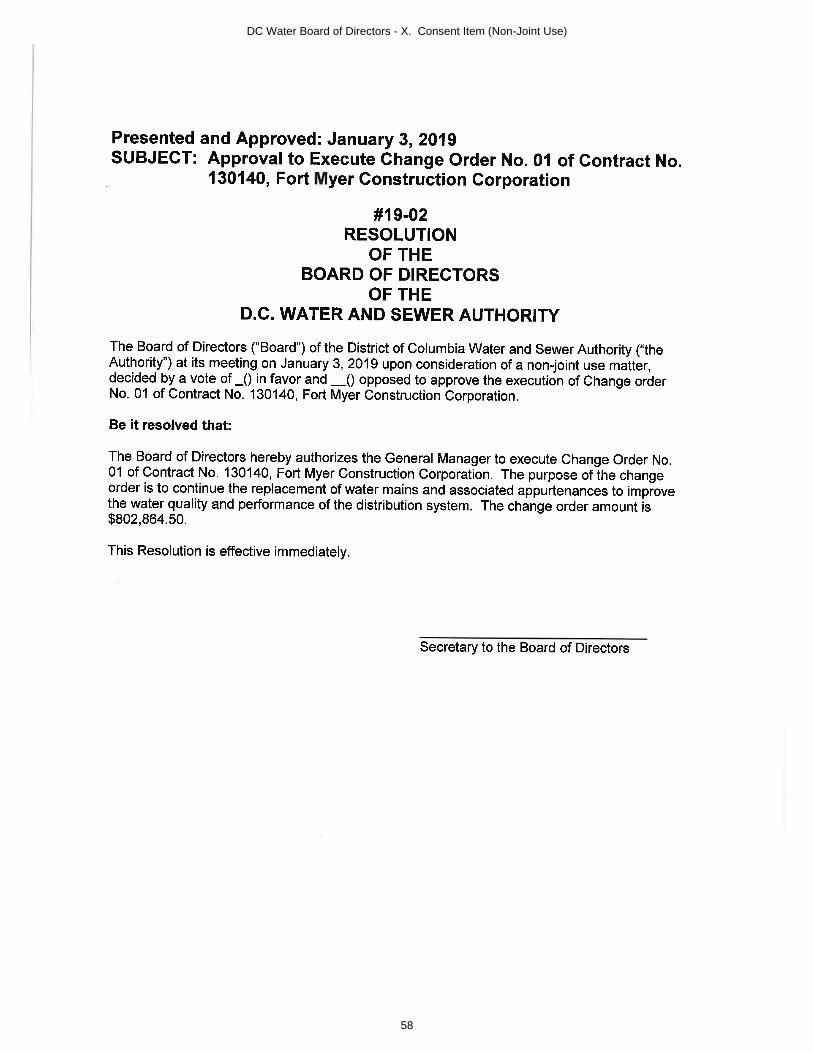
1. Approval to Execute Change Order No. 01 of Contract No. 130140, Fort Myer Construction Corporation – Resolution No. 19-02 (Recommended by the Environmental Quality and Operations Committee 12/18/18)
Xl. Executive Session
Xll. Adjournment (Chairman Tommy Wells)
DC Water Board of Directors - I. Call to Order (Chairman Tommy Wells)
1
2
1 The DC Water Board of Directors may go into executive session at this meeting pursuant to the District of Columbia Open Meetings Act of 2010, if such action is approved by a majority vote of the Board members who constitute a quorum to discuss: matters prohibited from public disclosure pursuant to a court order or law under D.C. Official Code § 2-575(b)(1); contract negotiations under D.C. Official Code § 2-575(b)(2); legal, confidential or privileged matters under D.C. Official Code § 2-575(b)(4); collective bargaining negotiations under D.C. Official Code § 2-575(b)(5); facility security under D.C. Official Code § 2-575(b)(8); disciplinary matters under D.C. Official Code § 2-575(b)(9); personnel matters under D.C. Official Code § 2-575(b)(10);proprietary matters under D.C. Official Code § 2-575(b)(11); decision in an adjudication action under D.C. Official Code § 2-575(b)(13); civil or criminal matters where disclosure to the public may harm the investigation under D.C. Official Code § 2-575(b)(14), and other matters provided in the Act.
Upcoming Committee Meetings
• Governance Committee – Monday, January 14, 2019 @ 9:00 a.m.
• Human Resource and Labor Relations Committee w/union presidents – Monday, January 14, 2019 @ 11:00 a.m.
• Environmental Quality and Operations Committee – Thursday, January 17, 2019 @ 9:30 a.m.
• DC Retail Water and Sewer Rates Committee – Tuesday, January 22, 2019 @ 9:30 a.m.
• Audit Committee – Thursday, January 24, 2019 @ 9:00 a.m.
• Finance and Budget Committee – Thursday, January 24, 2019 @ 11:00 a.m.
DC Water Board of Directors - I. Call to Order (Chairman Tommy Wells)
2
1
DISTRICT OF COLUMBIA
WATER AND SEWER AUTHORITY
Board of Directors
Finance and Budget Committee
Tuesday, December 16, 2018
11:00 a.m.
MEETING MINUTES
Committee MembersSarah Motsch, Committee Vice Chairperson
DC Water StaffDavid L. Gadis, CEO & General Manager
Tommy Wells, Board Chairman Matthew T. Brown, CFO and EVP of Finance and Procurement
Gregory Hope, Acting, EVP, Legal AffairsLinda Manley, Board Secretary
Call to Order
Ms. Sarah Motsch, Committee Vice Chairperson, called the meeting to order at 11:05 a.m.
November 2018 Financial Report
Mr. Matthew Brown, CFO and Executive Vice President of Finance and Procurement, provided the monthly report, noting that DC Water is on track with budgetary expectations. With approximately 16.7 percent of the fiscal year completed, total operating revenues are at $127.4 million, or 19.6 percent of budget, operating expenditures are at $84.2 million, or 14.4 percent, and capital disbursements are at $76.2 million, or 17.4 percent of budget in the respective categories.
CFO Brown explained that revenues are favorable to budget due to quarterly payments by Federal government and wholesale customers, and FY 2018 year-end billing for residential, commercial and multi-family received in the first quarter of FY 2019. He noted that the District has paid the November billing of $2.5 million in December. CFO Brown highlighted that the variance in personnel services is partially attributable to the absence of the employee merit and bonus payments which will be reflected in next month’s report. He stated that management is also reviewing vacancies to assess the needs and will be providing recommendations as part of the upcoming budget process. Detailed analysis of revenue and expenditures will be provided as part of quarterly review next month. Mr. Brown noted that at this early stage in the fiscal year, except for the stated revenue and disbursements variances, there are no other significant variances to report.
Next, Mr. Brown apprised the committee that the FY 2020 budget recommendations will be presented for Board review in February 2019. Furthermore, he acknowledged that the FY 2018 Audit is underway and expected to be completed in December. The A-133 audit and the Comprehensive Annual Financial Report are also underway with anticipated completions in
DC Water Board of Directors - V. Committee Reports
13
2
January. He stated that Requests for Proposal (RFP) were issued and completed for three services including Underwriters, Bond Counsel, and Merchant card services and anticipated for committee review in January/February. He also reported that proposals for the Enterprise Resource Planning(ERP) system have been received and are under review.
Path to Achieve Management
Next, Mr. Brown provided an overview of the various work by the Board Committees regarding the Capital Improvement Program (CIP). The current scenarios that are being presented are the current baseline of $4.1 million, a modified baseline/ramp up of $5.0 million, and full Asset Management of $6.5 million. He explained that the financial plan scenarios for discussion today were developed by running each capital scenario through the financial plan model to understand the impact on customer rates and other financial metrics.
Mr. Brown began by discussing the value of a AAA rating and the impact it has on customer rates. He quantified the approximate value of a AAA rating and noted that DC Water customers save about $19 million over a ten-year period when compared to the next highest rating of AA+. He cautioned that there are several assumptions in that number, but that it does give an overall magnitude estimate of the savings that result from a high credit rating. He showed a table and discussed how DC Water compares to other AAA and AA rated companies within the water and sewer industry, using various metrics that included debt ratio, outstanding debt levels, coverage ratios, debt service as a percent of total revenues, days of cash on hand and average bill as a percent of median effective buying income. In response to Ms. Motsch’s question on why these utilities were chosen for comparison to DC Water, Mr. Brown explained that these utilities are alsoon the higher end of the credit rating like DC Water. He also noted that there was input from our financial advisors on their selection for comparison. Mr. Davis Gadis, CEO and General Manager,added that the utilities chosen are some of the finest run utilities in the United States and since we consider ourselves in the same light, that it is fitting that we compare ourselves to them.
Ms. Motsch then asked if the services provided by selected utilities include stormwater, drinking water and sewer since DC Water includes all three. Mr. Brown responded that he would provide that information to the Committee. Next, Ms. Motsch asked if there are other factors such as the cost of energy that influences affordability in the various areas and what their impact might be. Mr. Brown suggested that the closest metric to Ms. Motsch’s request would be customers’ average bill as a percent of the median household income.
Mr. Brown noted that the number of days of cash on hand, which is the number of days that an organization can continue to pay its operating expenses given the amount of cash available, has been at approximately 260 days for FY 2015, FY 2016, and FY 2017. The total cash on hand for these fiscal years were $192 million, $214 million and $209 million, respectively and includes the Rate Stabilization Fund. Mr. Brown explained that 250 days is considered a best practice for AAArated agencies. DC Water’s current policy is to keep 120 days of cash on hand, however, Mr. Brown shared that management anticipates recommending that the Board adopt a policy that holds DC Water to 250 days of cash on hand. This could be accomplished either through year end contributions or planned contributions that do not include the Rate Stabilization Fund. Mr. Brown stressed the importance of days of cash on hand and cautioned that if we hold the ending cash
DC Water Board of Directors - V. Committee Reports
14
3
balance at $140 million, per the current Board policy, as operating expenditure increase, the days of cash on hand will fall, and this may also result if additional funds are drawn from the Rate Stabilization Fund.
Mr. Brown used a bar graph to depict how DC Water retail rates (with and without District fees) and the DC Water CAP customer rate compare to other large utilities. Ms. Motsch asked if these rates,compared to our peers, could be broken down to reflect the costs for each service area, i.e., water, sewer and stormwater? She also asked for a comparison to those agencies that have consent decrees. Mr. Brown responded that he would provide what he can to the Committee.
Next, CFO Brown reviewed the projected annual water and sewer rate increases and customer impacts for each of the three scenarios for FY 2019 to FY 2028. He noted that the FY 2019 and FY 2020 rates of 13 percent and 5 percent respectively, are the same for all scenarios. The annual rate increases for the remaining future years range from 5 percent to 8 percent for the baseline, 6 percent to 10 percent for the modified, 9 percent to 13 percent for Asset management. He went further to review the related impacts for the average residential, multi-family and commercial customer categories. Starting from FY 2021, the average monthly bill for the retail customer ranges from $124 to $164 for the current baseline, $125 to $185 for the modified, and $126 to $224 for the Asset management through FY 2028. Multi-family customer monthly bill range from $1,482 to $2,017 for the current baseline, $1,503 to $2,328 for the modified, and $1,515 to $2,915 for the Asset management. Commercial customers projected monthly bill ranges from $2,113 to $2,848 for the baseline, $2,141 to $3,262 for the modified, and $2,156 to $4,025 for the Asset management.
Regarding an average customer bill under each scenario, Ms. Motsch inquired as to whether the different scenarios would have a potential impact on DC Water’s bond rating. Mr. Brown explainedthat they could, in that additional debt would mean more debt service, and this would drive up the cost of water and sewer bills. Should that impact affordability, then there could be an impact on our bond rating. Mr. Brown emphasized that the more DC Water borrows, the more that will be paid annually to service the debt. He noted that under the Asset Management scenario, the debt service will double from about $200 million in FY 2019 to about $400 million in FY 2028. Mr. Brown advised that there are impacts to Wholesale customers due to additional investments in Blue Plainsunder the modified and asset management scenarios since they require investments in infrastructure.
Mr. Brown highlighted DC Water’s commitment to its community and the various strategies and initiatives undertaken to ensure public outreach and customer engagement. He acknowledged that the District’s water and sewer infrastructure, which has served us well for over 100 years, is nowshowing its age. He noted the need for DC Water to invest more than $4 billion in utility systems to meet federal mandates and suggested that this may still not be enough. While these investments require rate increases, they will also boost the local economy and provide jobs and other quality of life benefits for residents as can be seen at the Wharf and on the Anacostia River Front, which is experiencing significant economic development activities.
Mr. Brown shared that the strategy is to engage the customer and highlight what DC Water has done to benefit the residences and to educate them on the consequences of not investing
DC Water Board of Directors - V. Committee Reports
15
4
adequately in water and sewer systems. In response to Mr. Wells inquiry on how DC Water accounts for the variability in drinking water charges, Mr. Brown shared that DC Water tries to anticipate and mitigate those risks by making assumptions in the financial plan. He noted, as an example, that DC Water’s financial plan assumes an increase in overall costs and a 1% reduction in consumption each year, as that has been the trend over the past several years. Mr. Wells asked if the U.S. Army Corp of Engineers is planning any substantive change in their rates since that is what they use to fund capital investments. Mr. Brown responded that there will be an increase in investments based on conversations with the Aqueduct. Mr. Gadis added that DC Water is in constant contact with the Washington Aqueduct and the U.S. Army Corp of Engineers, and that DC Water has a pretty good handle on what is going on with their capital program. Ms. Motsch asked, with regard to the consequences of not investing adequately, if DC Water does not implement a full capital asset management track, what the financial impact or potential failures might be? Mr. Brown acknowledged that while it’s difficult to quantify, in most cases it is cost avoidance. He added that the Budget and Engineering teams are working to include the information for discussion with the committees as part of the budget review process. The committee members and staff agreed it would be more cost effective to be proactive than reactive and that an improved infrastructure will lead to less repairs and failures.
Mr. Wells wanted to know the plan for community outreach and whether there is anything different being done with the City Administrator’s Office and the Mayor’s Office regarding the budget presentation and DC Water’s capital needs. Mr. Brown responded that DC Water is planning to do outreach to the City, specifically regarding the condition of DC Water’s assets. He noted that DC Water has heard a lot from the Stakeholder Alliance regarding the Clean Rivers Impervious Area Charge (CRAIC) and the District’s Right of Way, acknowledging that in most cities there isn’t sucha charge.
Mr. Brown stated that the community outreach plan has not been finalized and that DC Water’s Marketing and Communications Department, in association with the Customer Service Department, are working to determine the most effective and appropriate way to reach the community. Mr. Gadis added that DC Water will lean heavily on the Stakeholder Alliance group for best ways to outreach the community as well as the best place to have meetings in each ward. He noted that DC Water plans to be out in the community to let people know the direction DC Water isgoing and why we are going in that direction.
Adjournment
Hearing no further business, Ms. Sarah Motsch adjourned the meeting at 11:59 a.m.
Follow-ups
1. Provide information on the median household income of the comparable jurisdictions (slide 10) (Ms. Motsch)
2. As part of peer review, for those that have CSO’s and consent decrees, provide cost comparison data for water, sewer and stormwater, with breakdown of cost for each service (slide 18) (Ms. Motsch)
DC Water Board of Directors - V. Committee Reports
16
1
District of ColumbiaWater and Sewer Authority
Board of Directors
Environmental Quality and OperationsMeetingThursday, December 20, 2018
9:30 a.m.
MEETING SUMMARY
Committee Members DC Water Staff Present James Patteson, Chairperson David Gadis, CEO & General ManagerHoward Gibbs, Vice Chairperson Leonard Benson, Senior VP, Chief EngineerPatty Bubar Linda Manley, Secretary to the BoardAnthony Giancola Gregory Hope, Acting Exec. VP, Legal AffairsJed RossKendrick CurryDavid FrancoIvan Frishberg
I. CALL TO ORDER
Mr. Patteson called the meeting to order at 9:30 a.m.
II. AWTP STATUS UPDATES
1. BPAWTP Performance
Mr. Aklile Tesfaye, Assistant General Manager for Wastewater Treatment stated that, going forward, the detailed report capturing the status of the Blue Plains Treatment Plant’s performance for a given month, would be provided during the second Committee meeting following that month (i.e., November 2018 report would be provided during the January 17, 2019 meeting) and so forth. This would allow for better data verification and QA/QC of information before presentation to the Committee.
Mr. Tesfaye did mention that while record precipitation levels were recorded in the DC Metro region during November, the performance of the Plant was excellent and that effluent quality parameters were below the NPDES permit limits.
During the month the Washington Metropolitan Region received record above normal total rainfall (7.57 inches vs normal of 3.17 inches) as measured at the National Airport. A total of 735 million gallons (MG) of CSOs captured in the tunnel system, were pumped, and treated using the new Enhanced Clarification Facility (ECF). Since the commissioning of the first
DC Water Board of Directors - V. Committee Reports
17
2
section of the Anacostia River Tunnel Systems and the Wet Weather Treatment Facility (WWTF) in March 2018 and including the wet weather events that occurred in November 2018, the total volume pumped and treated through the Wet Weather Treatment Facility is 4,140 MG. During the same period, over 800 wet tons of screenings and grit (trash, debris, sediment) were removed, that would otherwise have been discharged into the Anacostia River.
II. RESOURCE RECOVERY/ENERGY RFI
Mr. Chris Peot, Director, Resource Recovery, gave a presentation regarding resource recovery at DC Water and the Authority’s Request For Information (RFI) for Energy Innovation. The intent of the presentation was to inform the Committee about concepts, outline DC Water’s plan to realizing underleveraged resources and describing a potential path of investment and shared risk to fund future projects without raising rates. Mr. Peot noted projects that could potentially generate revenue and savings
Next, the Committee was briefed on the purpose and progress of DC Water’s Energy RFI (issued November 1, 2017) as follows:
∑ The purpose of the RFI is to identify partners willing to help design and implement energy innovations and share financial risks
∑ Met with the three (3) firms with the most relevant responses∑ DC Water received eleven (11) responses and started working on some low-risk, high
yield, projects in preparation for a Request for Proposal (RFP)∑ Outlined a draft approach to pay for services through revenue generated∑ Actively searching for a partnership to help with high priority projects
Mr. Peot also described the Renewable Identification Number (RIN) as a Renewable Fuel Standard (RFS) currency or credit generated for one ethanol equivalent gallon of renewable fuel. An EPA mandate and the Clean Air Act requires a percentage of refined transportation fuels be blended with renewable fuels. The EPA then sets renewable volume obligations annually and refiners and importers alike comply by blending fuels or via purchase of RINs. Each RIN has a D code which further classifies the type of renewable fuel. Digester gas from waste water treatment plants, such as Blue Plains, has a ‘D3’ (cellulosic) designation, and has the highest RIN value (D3 RINs are valued at $25-$35/MMBTUs).
As an example of how RINs can generate revenue, Mr. Peot mentioned the case study of the South Renton Treatment Plant (75 MGD) example located in King County, Washington. The treatment has had solids treatment with digestion and biogas scrubbing operations since 1987 and had their scrubbed gas registered as EPA “RIN Certified”. Through the sale of these RINs to third parties, King County receives the value of the commodity and 70% of the RIN value, totaling in $5.5 million in addition revenue in 2017 alone. This example highlights the revenue generating potential of renewable fuels through resource recovery.
The Committee inquired as to what the initial investment needs would be to set up such a process at DC Water. Mr. Peot replied while there hasn’t been detailed feasibility study conducted yet, a preliminary estimate would be a $25-$30 million initial investment. The Committee also inquired if there would be any jurisdictional issues when setting up such operations. Mr. Peot replied since the RIN program is a federal program, there would be no state level jurisdictional issues. Mr. Peot concluded the presentation by identifying the projects that could be funded if such a program is established,
DC Water Board of Directors - V. Committee Reports
18
3
III. ACTION ITEMS
JOINT USE
1. Contract No. 15-PR-WWT-53A – Supply and Delivery of Ferric Chloride, Carter & Carter Enterprises, Inc.,
2. Contract No. 16-PRDMS-43 – Repair and Rehabilitation of Various Process Assets, Electric Motor & Contracting Co., Inc.,
Mr. Dan Bae, Director, Procurement, DC Water presented joint use Action Items 1 and 2.
The Committee inquired if DC Water looked at suppliers other than the two contractors. Mr. Baereplied in the affirmative but added that Carter & Carter was the least expensive option available.The Committee also inquired as to what the projected future use of Ferric Chloride is for DC Water. Mr. Bae responded DC Water would get back to the Committee on those projections.
The Committee inquired if whether the repair and rehabilitation of process assets could be done in-house. Mr. Bae replied that scope calls for inspection, rehabilitation and replacement and upgrade services for major assets that are well beyond the existing, internal capabilities of DC Water.
NON-JOINT USE
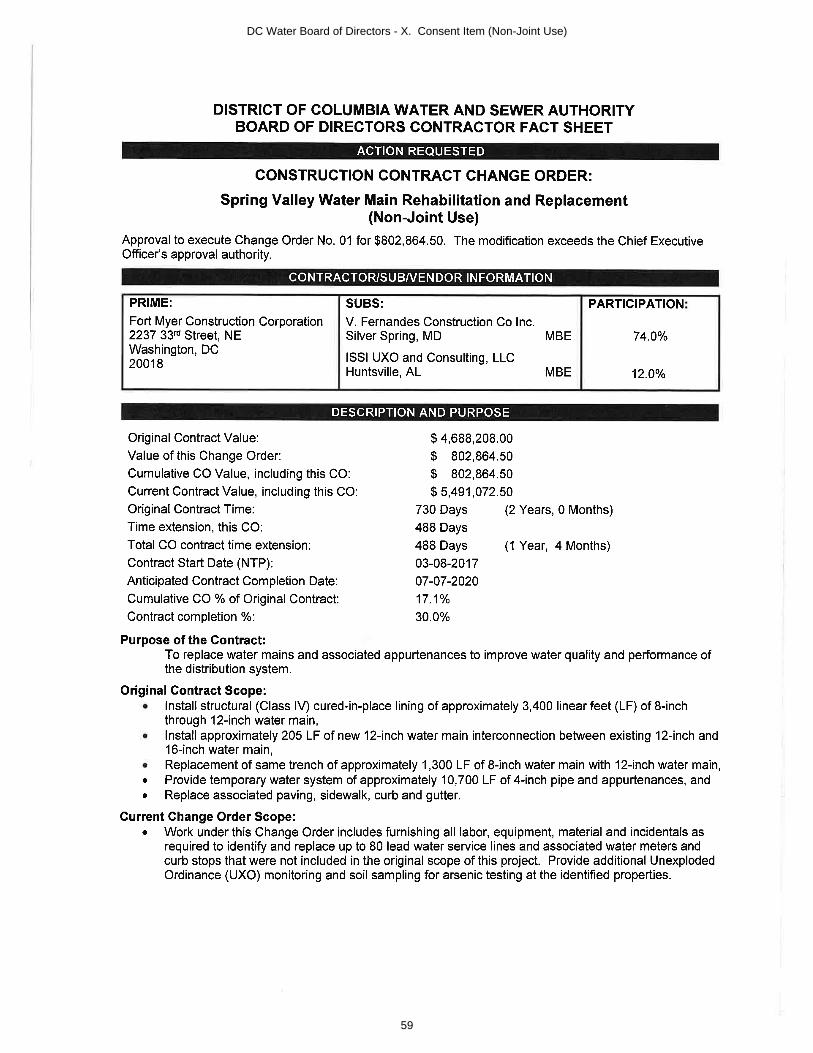
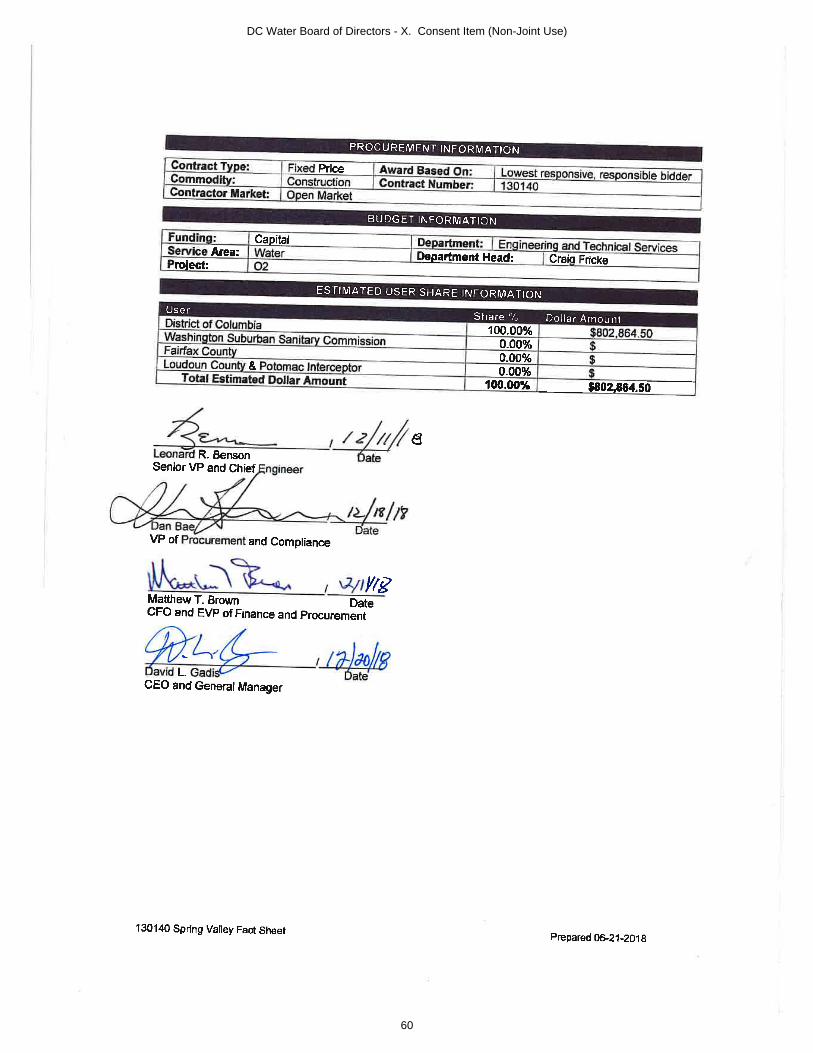
1. Contract No. 130140 – Spring Valley Main Rehabilitation & Replacement, Fort Myer Construction Corp. (change order).
The Committee inquired as to why these changes were not anticipated and identified prior to advertising the contract. Mr. Benson explained that the principal cause of the change order lay in the operation of the liner cutter tool that is routinely used throughout the water/wastewater industry to re-instate service connections once the main pipeline is lined and cured. The Water Quality department at DC Water alerted the project management team of the possibility that lead particulates from old lead service lines may seep into the drinking water during operation of the cutter tool. DC Water then elected to replace all known and suspected lead service lines in conjunction with the rehabilitation of the line before deploying the cutter tool. This conservative measure will avoid any issues that may arise from the known or suspected lead service lines and provide protection to the customer.
The Committee inquired as to who certifies if a service line is lead and needs replacement. Mr. Benson replied that the Contractor inspects the line for lead and an accompanying DC Water technician verifies and approves the resulting recommendation. The Committee advised DC Water to be wary of having contractors or vendors being responsible for replacement recommendations. Mr. Benson noted the advice and reiterated that DC Water technicians verify and approve any recommendations from the contractor or vendor.
The Committee recommended all joint and non-joint use Action Items to the full Board.
DC Water Board of Directors - V. Committee Reports
19
4
IV. DC CLEAN RIVERS (DCCR) PROJECT QUARTERLY UPDATE
Mr. Carlton Ray, Director, Clean Rivers Project, gave a quarterly update to the Committee. He began by mentioning the Tiber Creek Sewer Rehabilitation project, which is part of the Anacostia River Tunnel System, received the American Shotcrete Association (ASA) 2018 Outstanding Project of the Year award in the Underground category.
Mr. Ray gave a status update of the DCCR project as follows:∑ First phase of the Anacostia River tunnel system was commissioned on March 20, 2018∑ Northeast Boundary Tunnel (under construction) will increase Combined Sewer
Overflow (CSO) storage and flood risk mitigation by adding about 90 MG more of storage capacity
∑ Green Infrastructure (GI) project in Rock Creek is nearing completion while GI project in Potomac River basin will be completed in Spring 2019
∑ Potomac River Tunnel Facility Plan is on track to being submitted to EPA by end of 2018
The following projects are nearly completed: JBAB Overflow and Diversion Structures; Main Pumping Station Diversions; Anacostia River Tunnel (ART); Poplar Point Pumping Station Replacement and CSO 021 Diversions.
The following tasks are in progress for:
Division J – Northeast Boundary Tunnel∑ CSO 019 Site
o Tunnel Boring Machine (TBM) “Chris” mined 228 feeto CSO 019 force main relocation work completeo Eastside force main put back in service
∑ Mount Olivet Road (MOR) Siteo Jet grout test columns completedo Slurry wall panels completedo Production columns work ongoing
∑ W Street Siteo Retaining wall piles work completedo 24-inch storm pipe completedo Slurry wall panels completedo Ventilation Control Facility (VCF) work ongoingo Breakout of slurry wall ongoing
∑ Rhode Island Avenue Siteo Site setup ongoingo Asbestos removal work completed
∑ 4th Street Siteo Mobilization and site set-up completedo Slurry wall panel work 50% completedo Instrumentation installation completedo Removed overhead lines
Division RC-A – Rock Creek GI Project A∑ Project facilities were designed, permitted and constructed in three phases∑ One year maintenance period underway; completion expected in December 2019
DC Water Board of Directors - V. Committee Reports
20
5
Mr. Ray also stated that Clean Rivers project is expected to meet its FY2019 spending goal. Mr. Ray concluded the quarterly update by mentioning a recent song that referenced the Clean Rivers project and congratulated the team for their accomplishments.
The Committee inquired how DC Water measures seismic activities that might affect the community. Mr. Ray responded that their survey markers around buildings to help monitor if there has been any unwanted movement of structures.
III. MAKING I.T. HAPPEN – A STRATEGY FOR 2019 AND BEYOND
Due to time restrictions, this presentation was postponed to the next EQO Committee meeting to be held on January 17, 2019.
IV. OTHER BUSINESS/EMERGING ISSUES
DC Water CEO and President, David Gadis, on behalf of the Board of Directors and the employees of DC Water, presented outgoing Committee Chairman David Patteson with an appreciation award, and offered heartfelt thanks and best wishes in all his future endeavors.
V. ADJOURNMENT
Meeting adjourned at 12:00 p.m.
Follow-up Items
1. Director, Procurement: Provide update to the Committee on the projected future consumption of Ferric Chloride by the Blue Plains Treatment Plant.
DC Water Board of Directors - V. Committee Reports
21
CEO and PRESIDENT’S REPORTDavid L. Gadis – January 2019
DC Water Board of Directors - Vl. CEO/General Manager's Report (David Gadis)
22
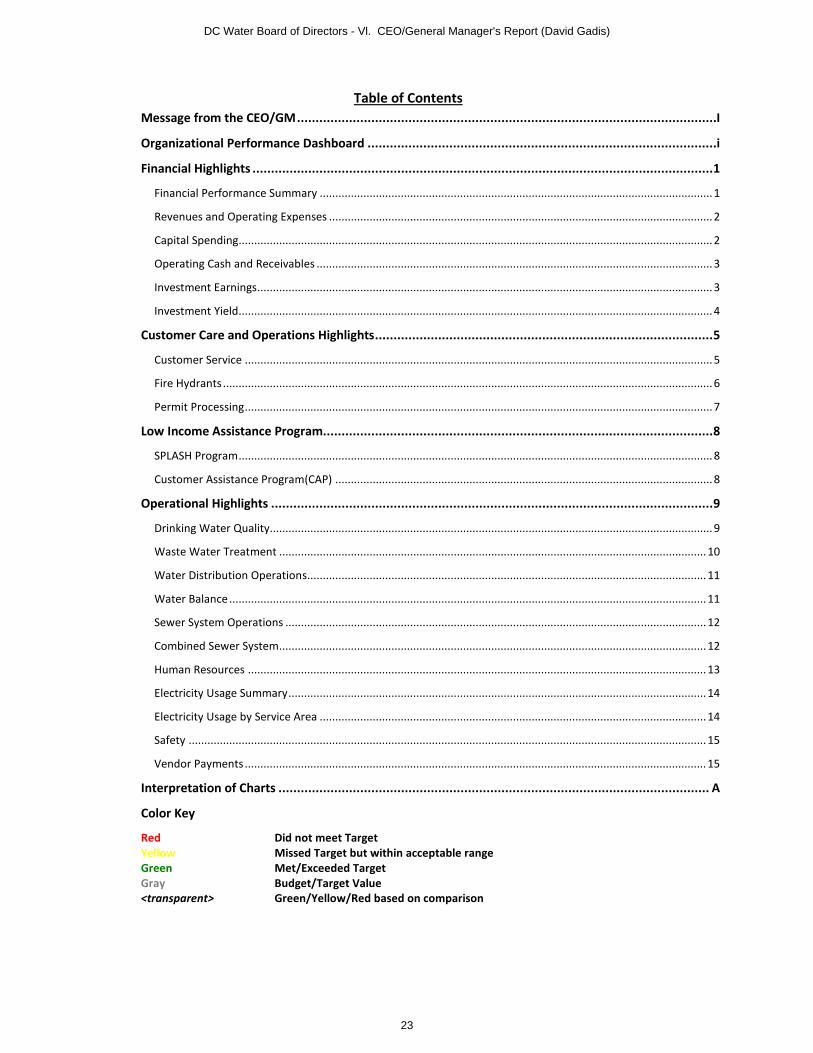
Table of Contents Message from the CEO/GM ................................................................................................................. I
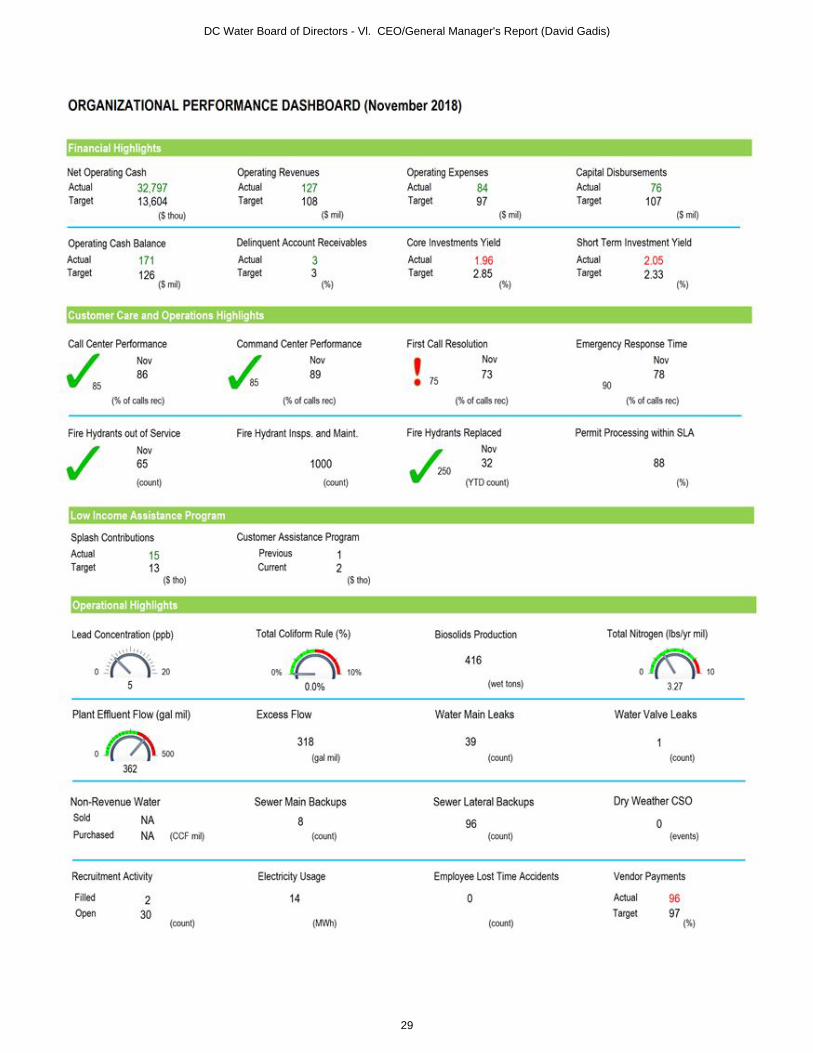
Organizational Performance Dashboard .............................................................................................. i
Financial Highlights ............................................................................................................................ 1
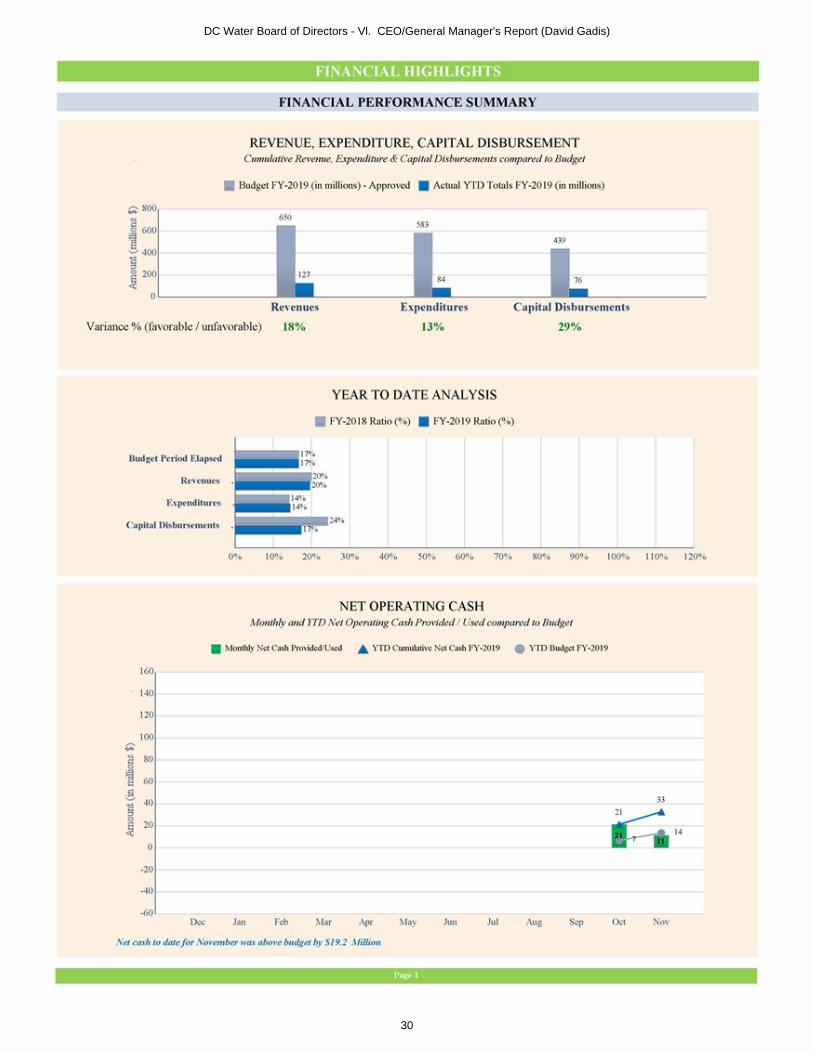
Financial Performance Summary .............................................................................................................................. 1
Revenues and Operating Expenses ........................................................................................................................... 2
Capital Spending ........................................................................................................................................................ 2
Operating Cash and Receivables ............................................................................................................................... 3
Investment Earnings .................................................................................................................................................. 3
Investment Yield........................................................................................................................................................ 4
Customer Care and Operations Highlights ........................................................................................... 5
Customer Service ...................................................................................................................................................... 5
Fire Hydrants ............................................................................................................................................................. 6
Permit Processing ...................................................................................................................................................... 7
Low Income Assistance Program......................................................................................................... 8
SPLASH Program ........................................................................................................................................................ 8
Customer Assistance Program(CAP) ......................................................................................................................... 8
Operational Highlights ....................................................................................................................... 9
Drinking Water Quality.............................................................................................................................................. 9
Waste Water Treatment ......................................................................................................................................... 10
Water Distribution Operations................................................................................................................................ 11
Water Balance ......................................................................................................................................................... 11
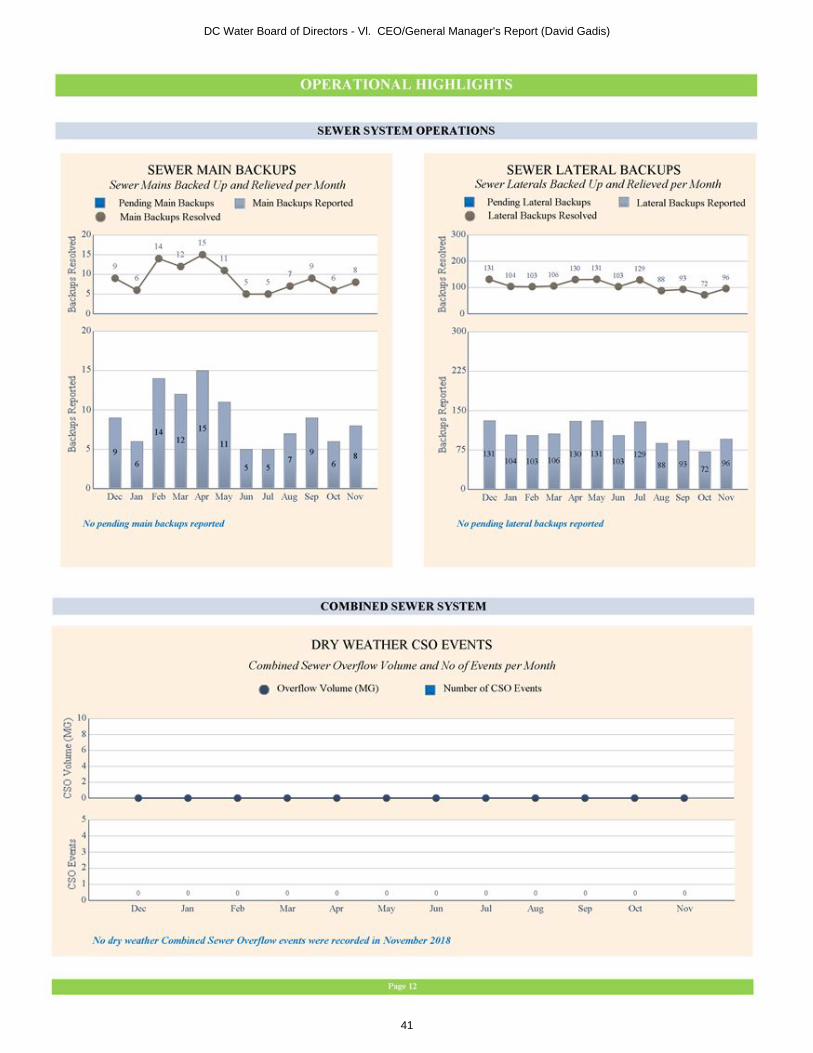
Sewer System Operations ....................................................................................................................................... 12
Combined Sewer System ......................................................................................................................................... 12
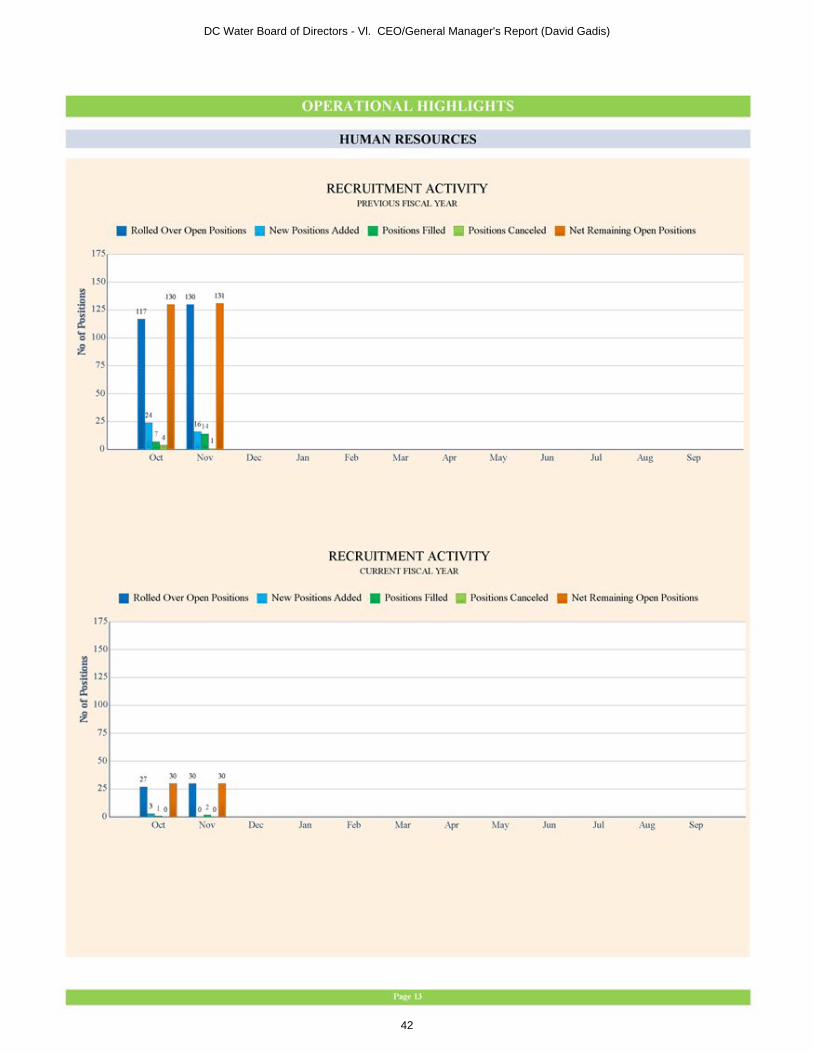
Human Resources ................................................................................................................................................... 13
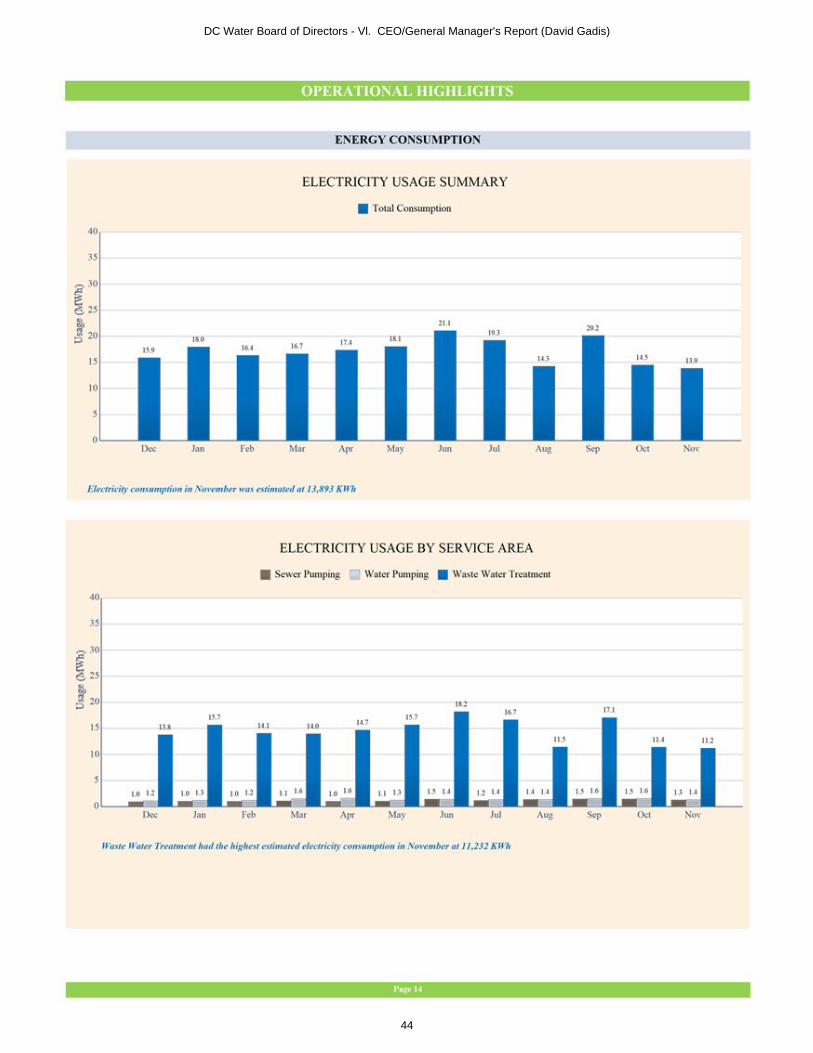
Electricity Usage Summary ...................................................................................................................................... 14
Electricity Usage by Service Area ............................................................................................................................ 14
Safety ...................................................................................................................................................................... 15
Vendor Payments .................................................................................................................................................... 15
Interpretation of Charts .................................................................................................................... A
Color Key
Red Did not meet Target Yellow Missed Target but within acceptable range Green Met/Exceeded Target Gray Budget/Target Value <transparent> Green/Yellow/Red based on comparison
DC Water Board of Directors - Vl. CEO/General Manager's Report (David Gadis)
23
Message from the CEO/GM
January CEO Report
FY2020 Budget Work continues to prepare the FY2020 Operating and Capital Budgets. In December, presentations were made to the Retail Rates Committee and the Finance and Budget Committee on the impact on the financial plan and rates of the capital investment scenarios. The capital investment scenarios were first presented to the Environmental Quality and Operations Committee by the Chief Engineer.
With the Stakeholder Alliance and rate consultants, work continues to evaluate the Clean Rivers Impervious Area Charge (CRIAC) and any possible changes that might be recommended with the Proposed FY2020 Budget. Finance is working with Clean Rivers to understand the amount of sanitary sewage that flows into the tunnels as one way to modifying the allocation of Clean Rivers to include a volumetric sewer charge. Based on work to date, a small shift from the impervious area charge to the sewer volumetric rate may be justified. This would reduce the CRIAC for small volumetric users who have large impervious area, and increase the overall bill for customers with high volumetric usage. Finance staff are also evaluating an expansion of the Impervious Area Charge Incentive Program. Currently, that program provides a four percent credit on the CRIAC when customers implement approved stormwater best management practices such as pervious paving and green roofs.
George H.W. Bush State Funeral OEM works closely with U.S. Secret Service and HSEMA to assist in coordinating National Special Security Events within the District. OEM facilitated the coordination with operations such as Sewer Services to inspect manholes along the secure routes. These inspections are often in the middle of the night to minimize traffic disruptions and occur immediately prior to the events. In addition, OEM represents DC Water in the Multi-Agency Coordination Center (MACC) and stays informed of event status and information to assist in assuring DC Water’s operations can continue to provide essential water services and can respond to emergency repairs in or around secure zones.
Efforts coordinated and facilitated by DC Water during George H.W. Bush State Funeral:
• Participated in District Operational Coordination meetings. OEM
• As requested by HSEMA, provided communication plan (ICS205) OEM and IT
• Assisted US Secret Service to inspect manholes at the National Cathedral during the earlymorning hours of Dec.5th. OEM and Sewer Services
• Provided status updates and critical information to the Multi-Agency Coordination Center andinternal/external stakeholders. OEM
• Facilitated DC Water reimbursement request for manhole inspections. OEM, Finance, and SewerServices
Solar Installation at Brentwood Reservoir In December, 2018 DC Water signed a Development Agreement with Urban Ingenuity / National Housing Trust (NHT) to explore the development and eventual land lease of the Brentwood Reservoir for a 1-1.5MW solar farm. This Agreement allows DC Water to continue exploring the development of solar capacity at the Brentwood Reservoir just across from Gallaudet University – which would provide direct revenue to DC Water to offset operations but also position DC Water as a champion for low-income residents by supporting the capacity of the DC Community Solar for All program.
DC Water Board of Directors - Vl. CEO/General Manager's Report (David Gadis)
24
Message from the CEO/GM
Green Infrastructure DC Water has been granted substantial completion for the first green infrastructure project in Rock
Creek, which comprises approximately 24 acres that will be managed with green infrastructure during a
1.2-inch storm event.
Winter Preparation DC Water has completed its preparedness to to respond to upcoming winter weather. This preparation
involves changing shift schedules, coordinating appropriate readiness of fleet, ensuring adequate
materials are in stock and working closely with Engineering to support repair work.
Blue Plains Award
DC Water received the NACWA Platinum Peak Performance Award for 6 years of 100% compliance.
Financial Statement Audit DC Water received twenty-second consecutive clean (unmodified) audit opinion on financial statements for the fiscal year ended September 30, 2018. CAP Expansion Programs With Customer Service, Finance continues to work to implement the Customer Assistance Program expansion programs so that when the District Department of Energy and the Environment (DOEE) begins certification, DC Water will be ready to issue credits to household and non-profit customers. DC Water Hosts U.S. DOE Delegation On December 17, DC Water hosted a delegation from the U.S. Department of Energy and the U.S. Environmental Protection Agency for a presentation and tour of Blue Plains, highlighting resource recovery trends and examples at DC Water. The delegation is leading the development of DOE’s Water Security Grand Challenge, launched in October. DC Water Apprenticeship Program In 2018, DC Water began to engage local partners and management around creating an Apprenticeship Program. The aim of the program is to begin a succession plan for entering young adults into a career path at DC Water. The program will provide new trainees with systematic On-The-Job work experience related to the HVAC, Plumbing, Quality Assurance, Utility Worker, and Waste Water Operator occupations, under the direction and oversight of capable and experienced journey workers. The program also includes classroom related training necessary for the completion of the apprenticeship. Government Relations This month the DC Council introduced, considered, and voted on two different pieces of legislation with a direct impact on DC Water: lead vouchers for homeowners and the Office of the People’s Counsel empowerment bill. Each of these initiatives took countless hours to negotiate and work thorough with staff and Council members and both pieces of legislation received final approval this month. Drinking Water Marketing and Communications
• DC Water continues the “Made with DC Tap” social media campaign—a marketing initiative highlighting local businesses and the ways their unique products and services rely on the District’s world-class tap water. This month the team has officially partnered with the Department of Small and Local Business Development’s “Made in DC” campaign, and will work
DC Water Board of Directors - Vl. CEO/General Manager's Report (David Gadis)
25
Message from the CEO/GM
with these partners to connect with more District businesses, and expand the reach and capabilities of this initiative.
• DC Water staff disseminated important updates about the Lead Service Line Replacement programs and the recent passage of the LSR Bill through Council to customers and other stakeholder groups via the Interagency Workgroup on Healthy Housing’s December newsletter, DC Healthy Homes Digest. The next meeting of the Workgroup is scheduled for mid-January. At this meeting, OMAC will bring partners from the American University to discuss our joint study, “Equity Considerations for Lead Service Line Replacement in Washington, DC.” The study will request additional data sets from group members that will be added to DC Water’s Voluntary LSR program data to examine the influence of variables on the rate and distribution of lead service line replacement. Proposed variables include household income, race/ethnicity, type of dwelling, and other demographic characteristics.
Press Releases:
• Dec 12: Falling temperatures can cause water main breaks and frozen pipes
• Dec 6: New District Lead Service Line Replacement Program Offers Historic Opportunity to Replace Old Plumbing
DC Water Board of Directors - Vl. CEO/General Manager's Report (David Gadis)
26
Message from the CEO/GM
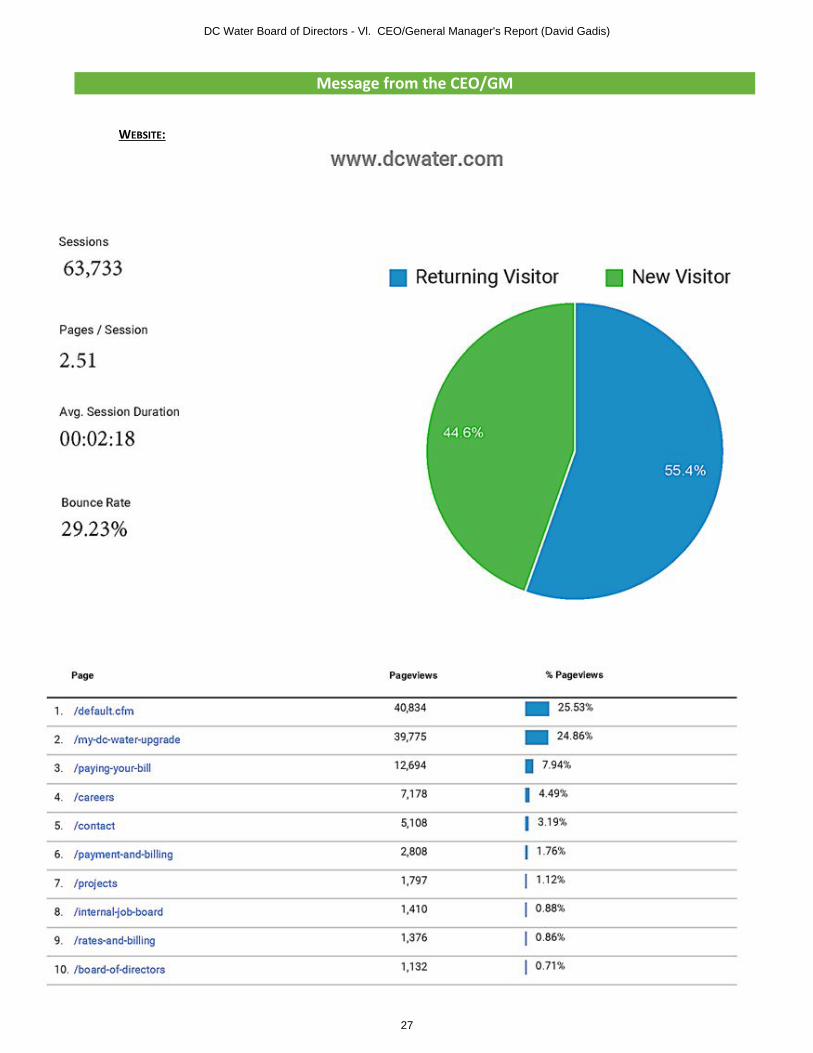
WEBSITE:
DC Water Board of Directors - Vl. CEO/General Manager's Report (David Gadis)
27
Message from the CEO/GM
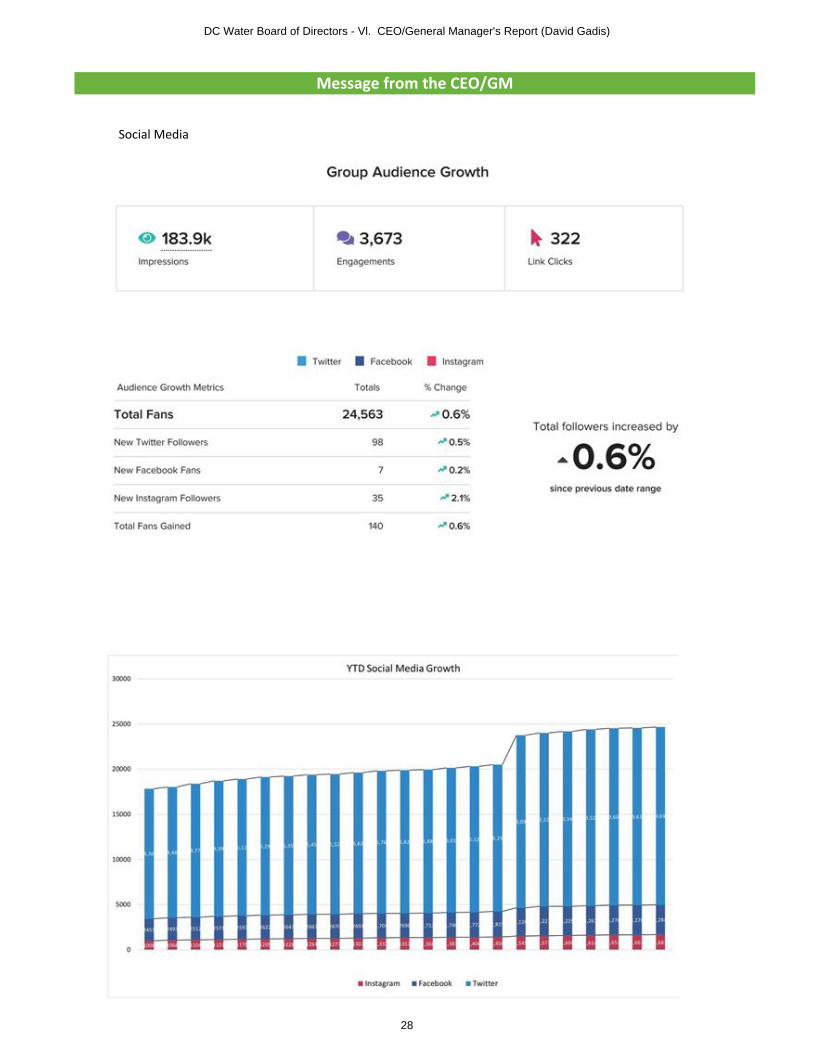
Social Media
DC Water Board of Directors - Vl. CEO/General Manager's Report (David Gadis)
28
DC Water Board of Directors - Vl. CEO/General Manager's Report (David Gadis)
29
DC Water Board of Directors - Vl. CEO/General Manager's Report (David Gadis)
30

DC Water Board of Directors - Vl. CEO/General Manager's Report (David Gadis)
31
DC Water Board of Directors - Vl. CEO/General Manager's Report (David Gadis)
32
DC Water Board of Directors - Vl. CEO/General Manager's Report (David Gadis)
33
DC Water Board of Directors - Vl. CEO/General Manager's Report (David Gadis)
34

DC Water Board of Directors - Vl. CEO/General Manager's Report (David Gadis)
35
DC Water Board of Directors - Vl. CEO/General Manager's Report (David Gadis)
36
DC Water Board of Directors - Vl. CEO/General Manager's Report (David Gadis)
37
DC Water Board of Directors - Vl. CEO/General Manager's Report (David Gadis)
38
DC Water Board of Directors - Vl. CEO/General Manager's Report (David Gadis)
39
DC Water Board of Directors - Vl. CEO/General Manager's Report (David Gadis)
40
DC Water Board of Directors - Vl. CEO/General Manager's Report (David Gadis)
41
DC Water Board of Directors - Vl. CEO/General Manager's Report (David Gadis)
42
DC Water Board of Directors - Vl. CEO/General Manager's Report (David Gadis)
43
DC Water Board of Directors - Vl. CEO/General Manager's Report (David Gadis)
44
DC Water Board of Directors - Vl. CEO/General Manager's Report (David Gadis)
45
Dynamic Color Coding Legend
* ** Red - when the actual is lower than 3% of budget or target Yellow - when the actual is within 3% of budget or target Green - when the actual is equal to or higher than budget or target
Red - when the actual is higher than 3% of budget or target Yellow - when the actual is within 3% of budget or target Green - when the actual is equal to or lower than budget or target
Symbols where the color code applies- (Δ, □) A
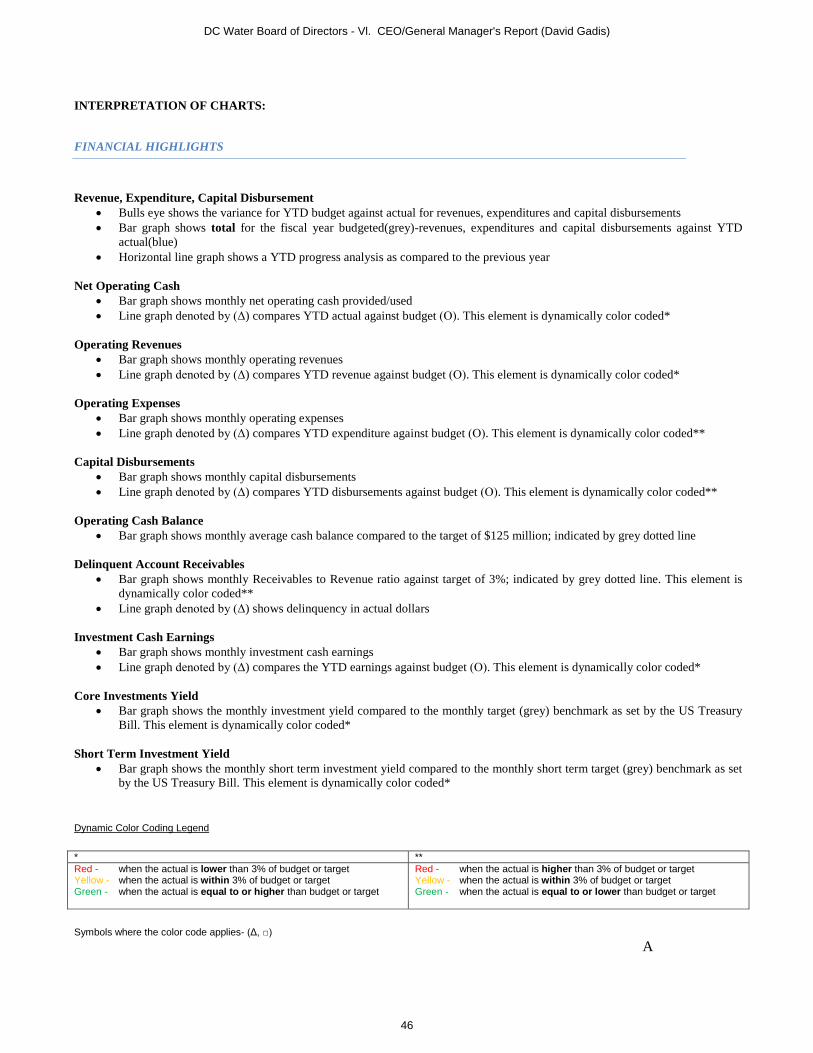
INTERPRETATION OF CHARTS:
FINANCIAL HIGHLIGHTS
Revenue, Expenditure, Capital Disbursement • Bulls eye shows the variance for YTD budget against actual for revenues, expenditures and capital disbursements• Bar graph shows total for the fiscal year budgeted(grey)-revenues, expenditures and capital disbursements against YTD
actual(blue)• Horizontal line graph shows a YTD progress analysis as compared to the previous year
Net Operating Cash • Bar graph shows monthly net operating cash provided/used• Line graph denoted by (Δ) compares YTD actual against budget (Ο). This element is dynamically color coded*
Operating Revenues • Bar graph shows monthly operating revenues• Line graph denoted by (Δ) compares YTD revenue against budget (Ο). This element is dynamically color coded*
Operating Expenses • Bar graph shows monthly operating expenses• Line graph denoted by (Δ) compares YTD expenditure against budget (Ο). This element is dynamically color coded**
Capital Disbursements • Bar graph shows monthly capital disbursements• Line graph denoted by (Δ) compares YTD disbursements against budget (Ο). This element is dynamically color coded**
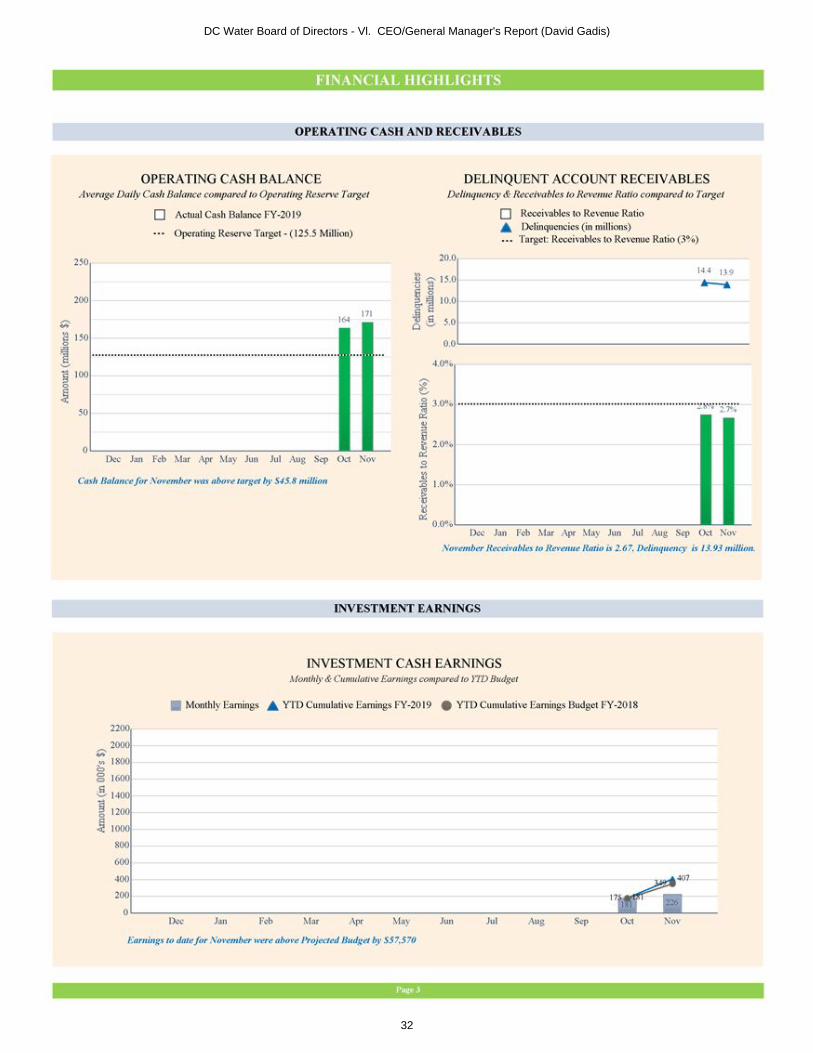
Operating Cash Balance • Bar graph shows monthly average cash balance compared to the target of $125 million; indicated by grey dotted line
Delinquent Account Receivables • Bar graph shows monthly Receivables to Revenue ratio against target of 3%; indicated by grey dotted line. This element is
dynamically color coded** • Line graph denoted by (Δ) shows delinquency in actual dollars
Investment Cash Earnings • Bar graph shows monthly investment cash earnings• Line graph denoted by (Δ) compares the YTD earnings against budget (Ο). This element is dynamically color coded*
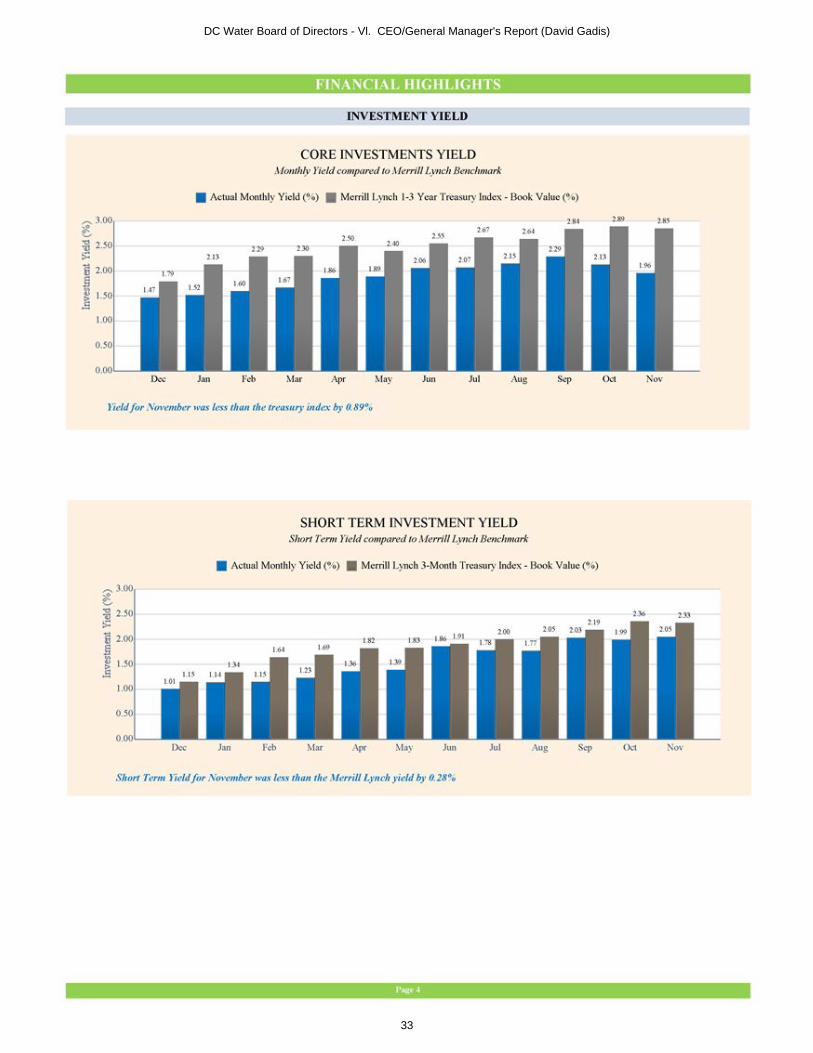
Core Investments Yield • Bar graph shows the monthly investment yield compared to the monthly target (grey) benchmark as set by the US Treasury
Bill. This element is dynamically color coded*
Short Term Investment Yield • Bar graph shows the monthly short term investment yield compared to the monthly short term target (grey) benchmark as set
by the US Treasury Bill. This element is dynamically color coded*
DC Water Board of Directors - Vl. CEO/General Manager's Report (David Gadis)
46
Dynamic Color Coding Legend
*** **** Red- when the actual is lower than 5% of budget or target Yellow- when the actual is within 5% of budget or target Green- when the actual is equal to or higher than budget or target
Red- when the actual is higher than 5% of budget or target Yellow- when the actual is within 5% of budget or target Green- when the actual is equal to or lower than budget or target
Symbols where the color code applies- (Δ, □)
B
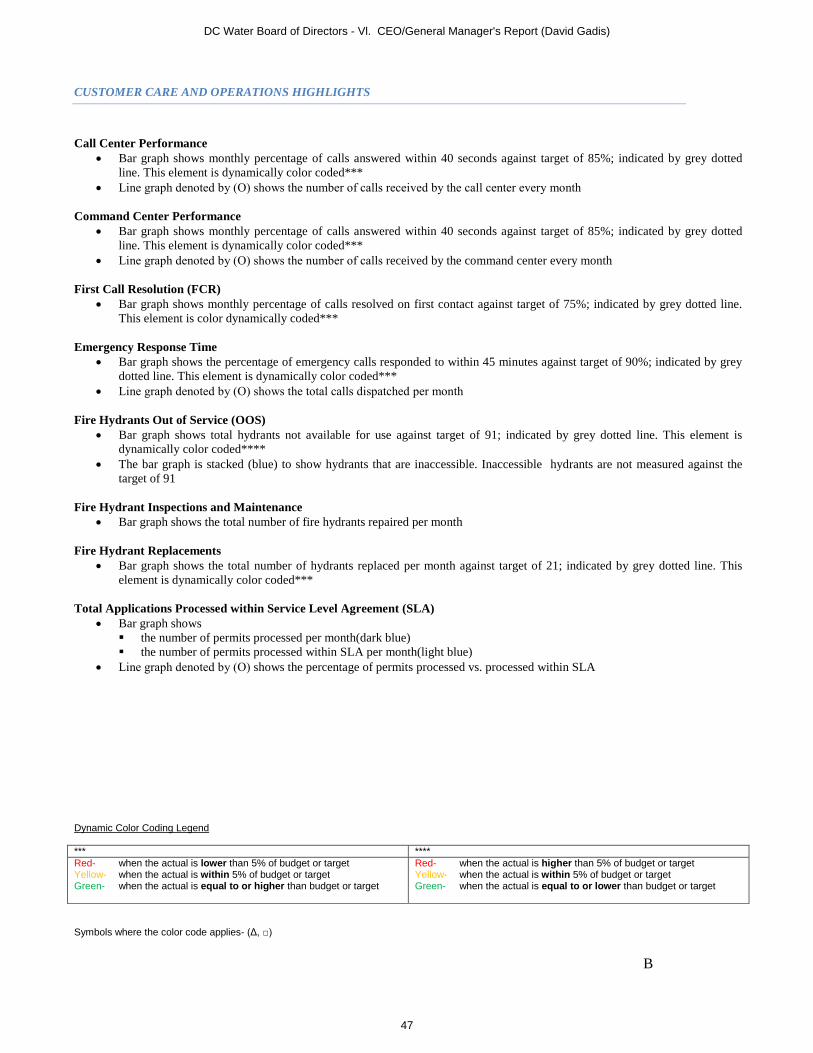
CUSTOMER CARE AND OPERATIONS HIGHLIGHTS
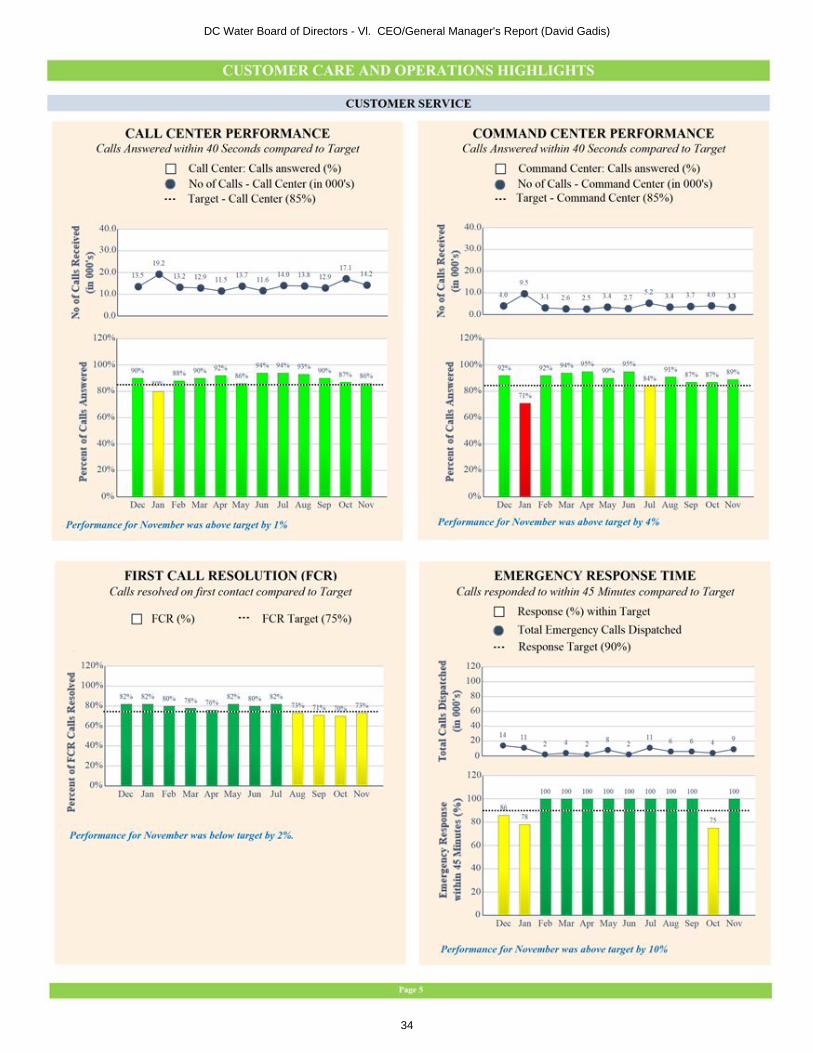
Call Center Performance • Bar graph shows monthly percentage of calls answered within 40 seconds against target of 85%; indicated by grey dotted
line. This element is dynamically color coded*** • Line graph denoted by (Ο) shows the number of calls received by the call center every month
Command Center Performance • Bar graph shows monthly percentage of calls answered within 40 seconds against target of 85%; indicated by grey dotted
line. This element is dynamically color coded*** • Line graph denoted by (Ο) shows the number of calls received by the command center every month
First Call Resolution (FCR) • Bar graph shows monthly percentage of calls resolved on first contact against target of 75%; indicated by grey dotted line.
This element is color dynamically coded***
Emergency Response Time • Bar graph shows the percentage of emergency calls responded to within 45 minutes against target of 90%; indicated by grey
dotted line. This element is dynamically color coded*** • Line graph denoted by (Ο) shows the total calls dispatched per month
Fire Hydrants Out of Service (OOS) • Bar graph shows total hydrants not available for use against target of 91; indicated by grey dotted line. This element is
dynamically color coded**** • The bar graph is stacked (blue) to show hydrants that are inaccessible. Inaccessible hydrants are not measured against the
target of 91
Fire Hydrant Inspections and Maintenance • Bar graph shows the total number of fire hydrants repaired per month
Fire Hydrant Replacements • Bar graph shows the total number of hydrants replaced per month against target of 21; indicated by grey dotted line. This
element is dynamically color coded***
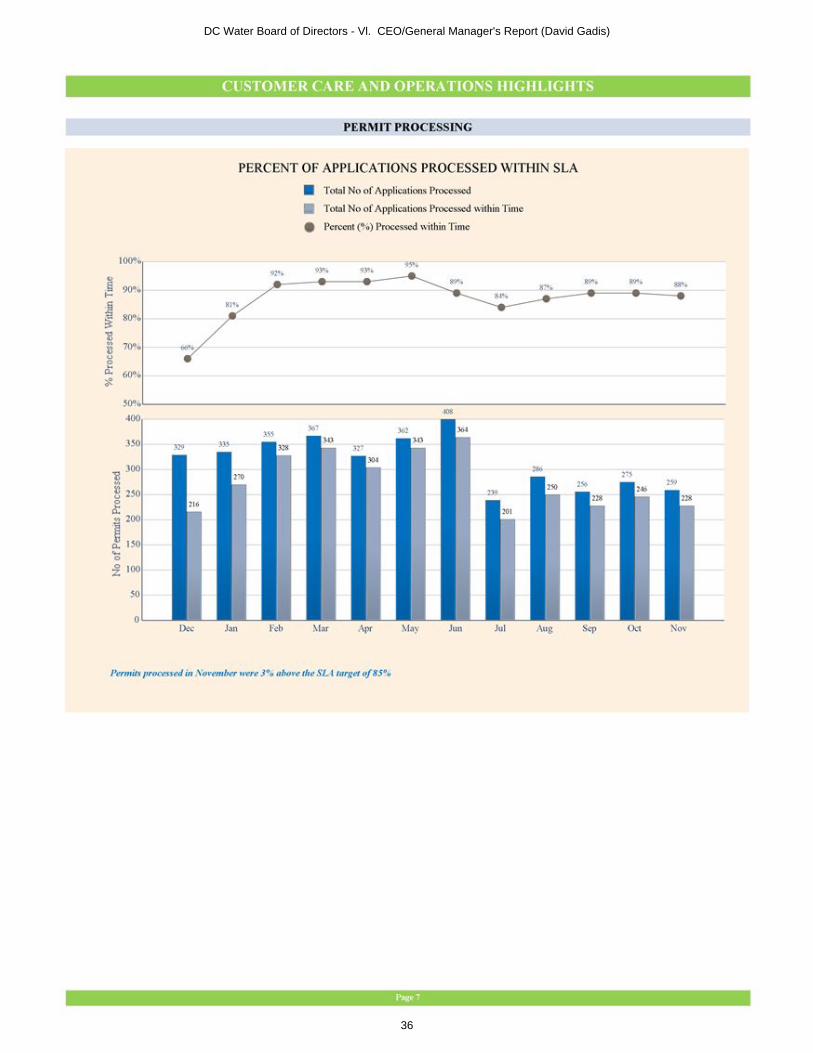
Total Applications Processed within Service Level Agreement (SLA) • Bar graph shows
the number of permits processed per month(dark blue) the number of permits processed within SLA per month(light blue)
• Line graph denoted by (Ο) shows the percentage of permits processed vs. processed within SLA
DC Water Board of Directors - Vl. CEO/General Manager's Report (David Gadis)
47
Dynamic Color Coding Legend
*** **** Red- when the actual is lower than 5% of budget or target Yellow- when the actual is within 5% of budget or target Green- when the actual is equal to or higher than budget or target
Red- when the actual is higher than 5% of budget or target Yellow- when the actual is within 5% of budget or target Green- when the actual is equal to or lower than budget or target
Symbols where the color code applies- (Δ, □)
C
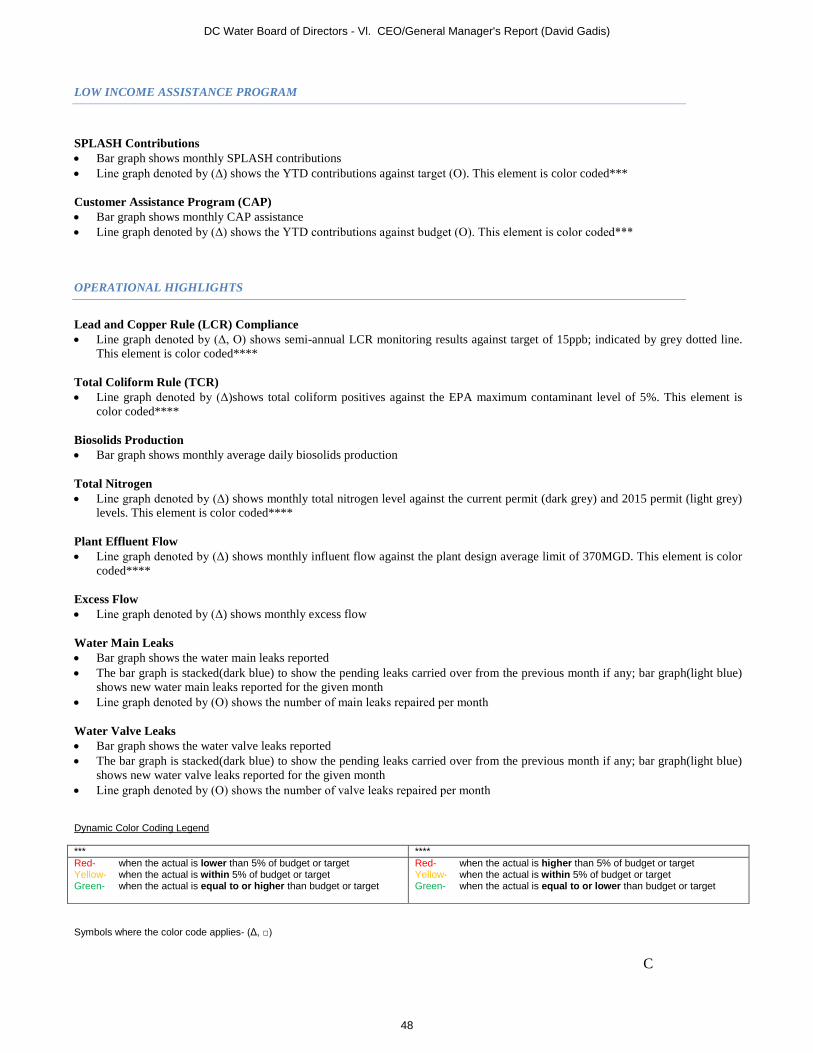
LOW INCOME ASSISTANCE PROGRAM
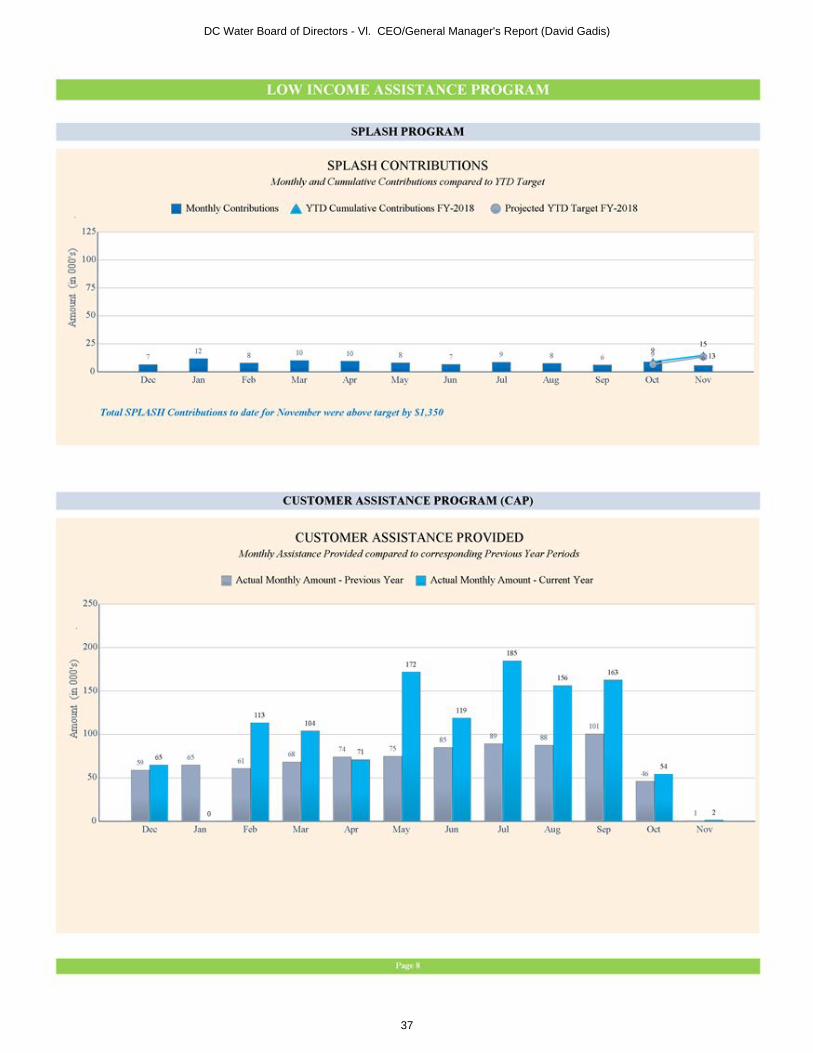
SPLASH Contributions • Bar graph shows monthly SPLASH contributions• Line graph denoted by (Δ) shows the YTD contributions against target (Ο). This element is color coded***
Customer Assistance Program (CAP) • Bar graph shows monthly CAP assistance• Line graph denoted by (Δ) shows the YTD contributions against budget (Ο). This element is color coded***
OPERATIONAL HIGHLIGHTS
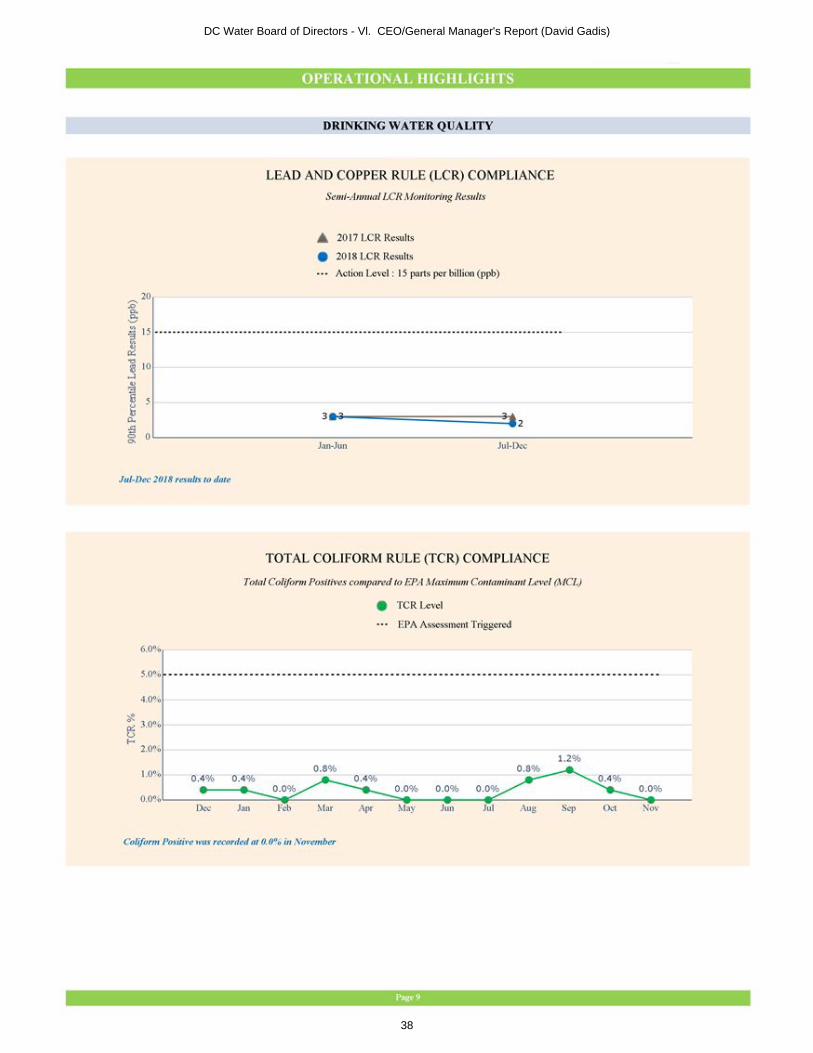
Lead and Copper Rule (LCR) Compliance • Line graph denoted by (Δ, Ο) shows semi-annual LCR monitoring results against target of 15ppb; indicated by grey dotted line.
This element is color coded****
Total Coliform Rule (TCR) • Line graph denoted by (Δ)shows total coliform positives against the EPA maximum contaminant level of 5%. This element is
color coded****
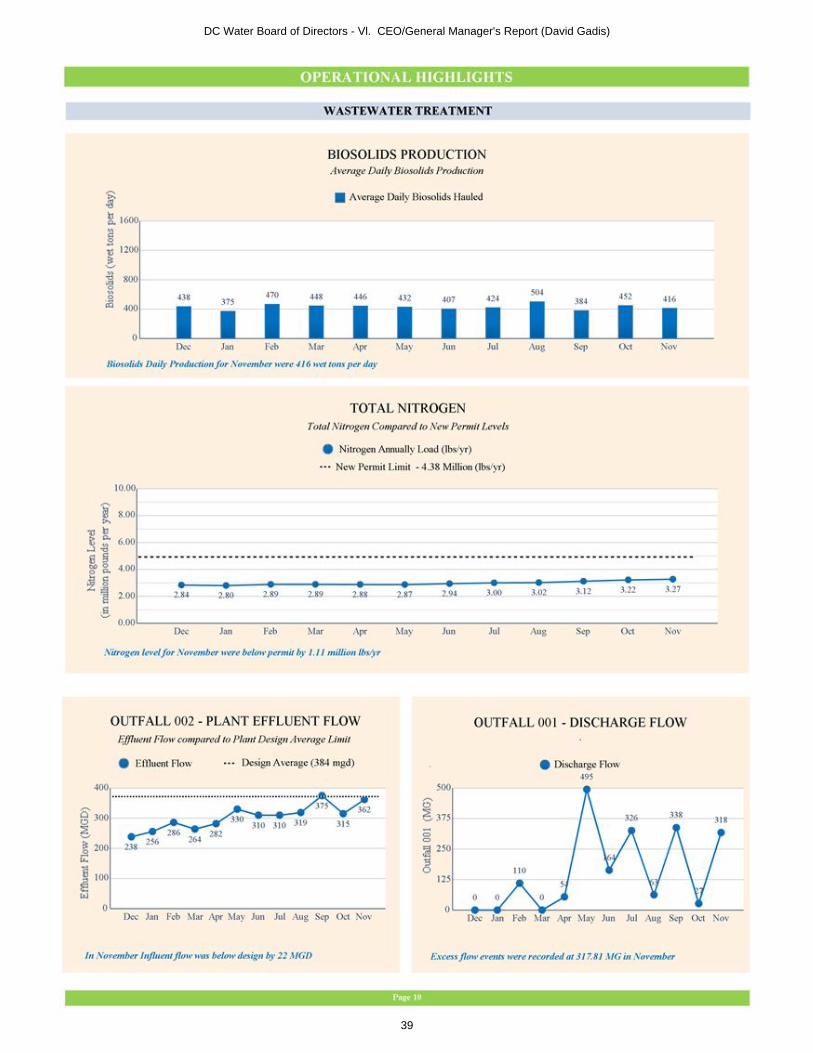
Biosolids Production • Bar graph shows monthly average daily biosolids production
Total Nitrogen • Line graph denoted by (Δ) shows monthly total nitrogen level against the current permit (dark grey) and 2015 permit (light grey)
levels. This element is color coded****
Plant Effluent Flow • Line graph denoted by (Δ) shows monthly influent flow against the plant design average limit of 370MGD. This element is color
coded****
Excess Flow • Line graph denoted by (Δ) shows monthly excess flow
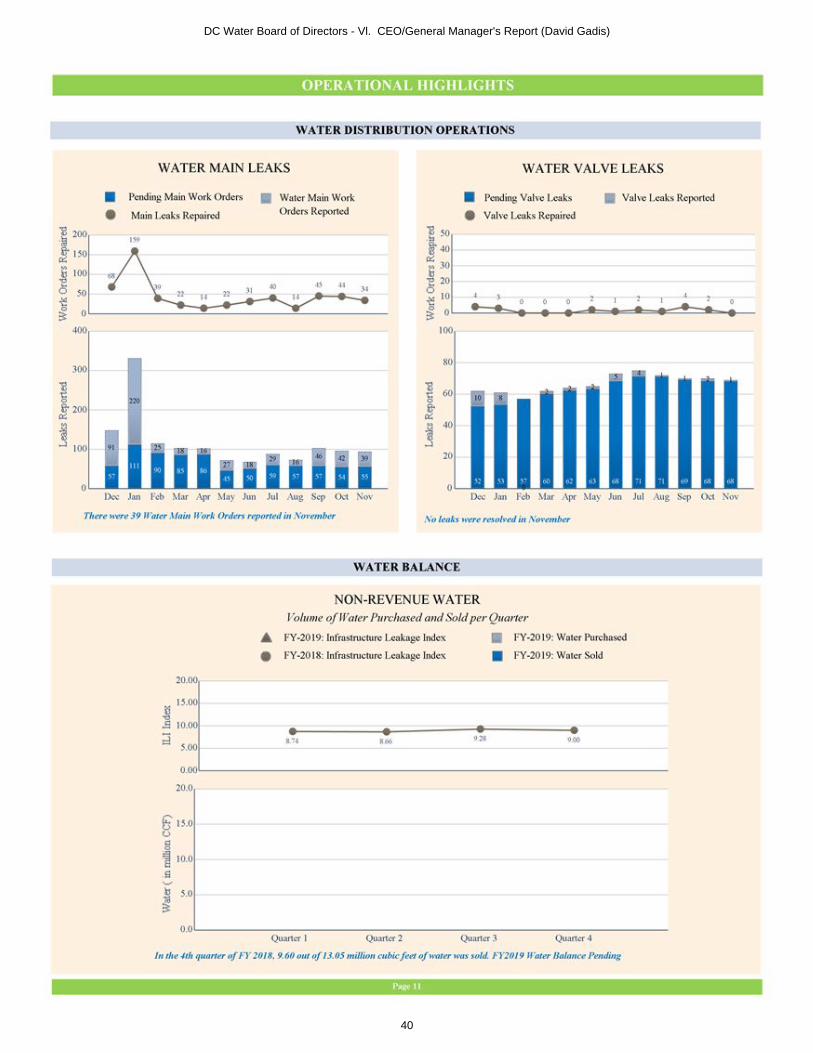
Water Main Leaks • Bar graph shows the water main leaks reported• The bar graph is stacked(dark blue) to show the pending leaks carried over from the previous month if any; bar graph(light blue)
shows new water main leaks reported for the given month• Line graph denoted by (Ο) shows the number of main leaks repaired per month
Water Valve Leaks • Bar graph shows the water valve leaks reported• The bar graph is stacked(dark blue) to show the pending leaks carried over from the previous month if any; bar graph(light blue)
shows new water valve leaks reported for the given month• Line graph denoted by (Ο) shows the number of valve leaks repaired per month
DC Water Board of Directors - Vl. CEO/General Manager's Report (David Gadis)
48
Dynamic Color Coding Legend *** **** Red- when the actual is lower than 5% of budget or target Yellow- when the actual is within 5% of budget or target Green- when the actual is equal to or higher than budget or target
Red- when the actual is higher than 5% of budget or target Yellow- when the actual is within 5% of budget or target Green- when the actual is equal to or lower than budget or target
Symbols where the color code applies- (Δ, □) D
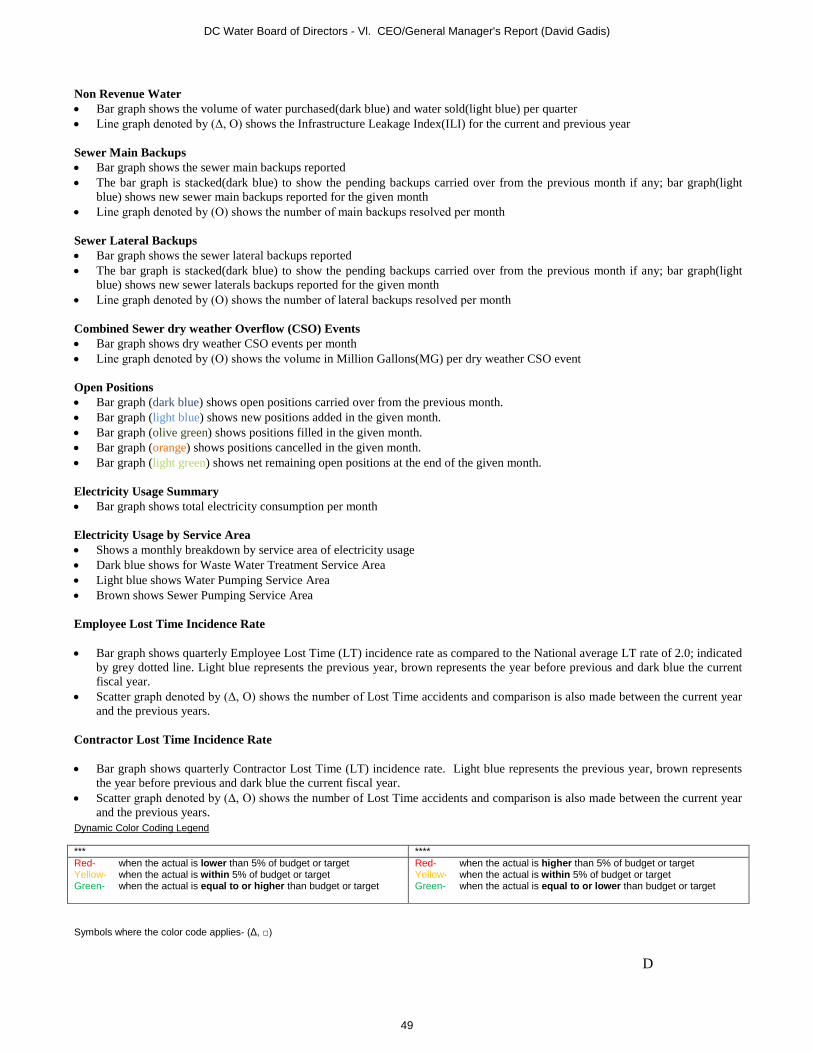
Non Revenue Water • Bar graph shows the volume of water purchased(dark blue) and water sold(light blue) per quarter • Line graph denoted by (Δ, Ο) shows the Infrastructure Leakage Index(ILI) for the current and previous year Sewer Main Backups • Bar graph shows the sewer main backups reported • The bar graph is stacked(dark blue) to show the pending backups carried over from the previous month if any; bar graph(light
blue) shows new sewer main backups reported for the given month • Line graph denoted by (Ο) shows the number of main backups resolved per month Sewer Lateral Backups • Bar graph shows the sewer lateral backups reported • The bar graph is stacked(dark blue) to show the pending backups carried over from the previous month if any; bar graph(light
blue) shows new sewer laterals backups reported for the given month • Line graph denoted by (Ο) shows the number of lateral backups resolved per month
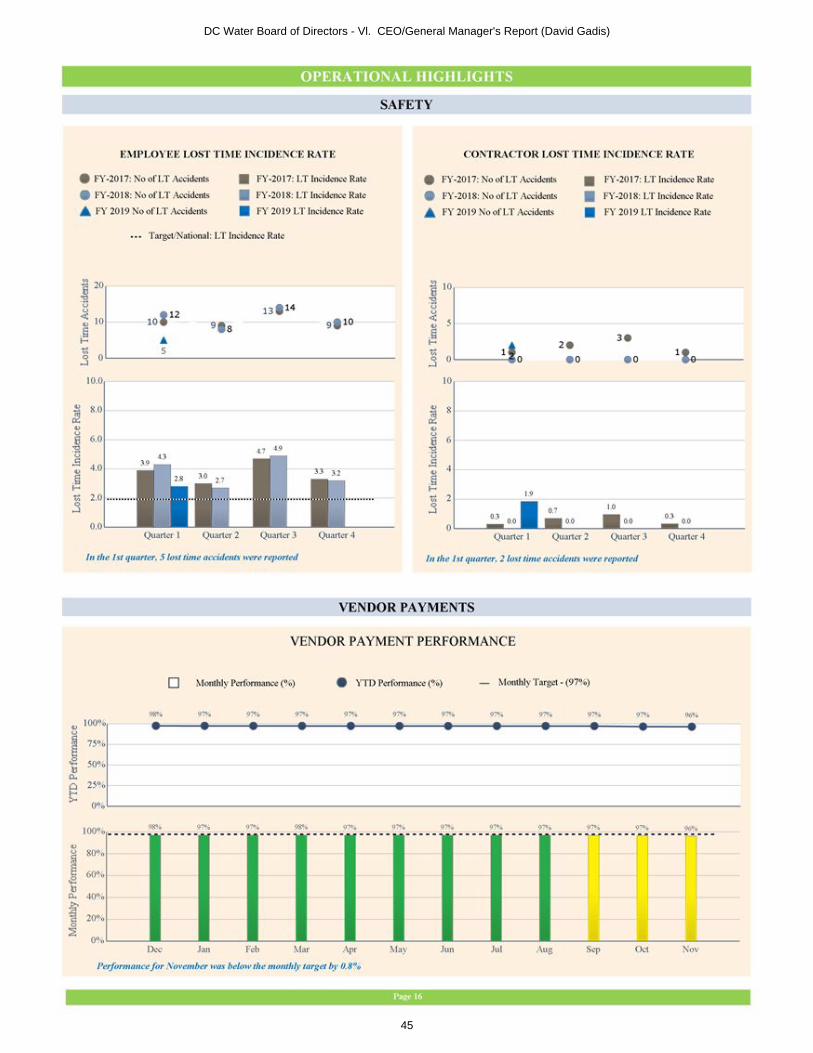
Combined Sewer dry weather Overflow (CSO) Events • Bar graph shows dry weather CSO events per month • Line graph denoted by (Ο) shows the volume in Million Gallons(MG) per dry weather CSO event Open Positions • Bar graph (dark blue) shows open positions carried over from the previous month. • Bar graph (light blue) shows new positions added in the given month. • Bar graph (olive green) shows positions filled in the given month. • Bar graph (orange) shows positions cancelled in the given month. • Bar graph (light green) shows net remaining open positions at the end of the given month. Electricity Usage Summary • Bar graph shows total electricity consumption per month Electricity Usage by Service Area • Shows a monthly breakdown by service area of electricity usage • Dark blue shows for Waste Water Treatment Service Area • Light blue shows Water Pumping Service Area • Brown shows Sewer Pumping Service Area Employee Lost Time Incidence Rate • Bar graph shows quarterly Employee Lost Time (LT) incidence rate as compared to the National average LT rate of 2.0; indicated
by grey dotted line. Light blue represents the previous year, brown represents the year before previous and dark blue the current fiscal year.
• Scatter graph denoted by (Δ, Ο) shows the number of Lost Time accidents and comparison is also made between the current year and the previous years.
Contractor Lost Time Incidence Rate • Bar graph shows quarterly Contractor Lost Time (LT) incidence rate. Light blue represents the previous year, brown represents
the year before previous and dark blue the current fiscal year. • Scatter graph denoted by (Δ, Ο) shows the number of Lost Time accidents and comparison is also made between the current year
and the previous years.
DC Water Board of Directors - Vl. CEO/General Manager's Report (David Gadis)
49
Dynamic Color Coding Legend *** **** Red- when the actual is lower than 5% of budget or target Yellow- when the actual is within 5% of budget or target Green- when the actual is equal to or higher than budget or target
Red- when the actual is higher than 5% of budget or target Yellow- when the actual is within 5% of budget or target Green- when the actual is equal to or lower than budget or target
Symbols where the color code applies- (Δ, □) E
Vendor Payment Performance
• Bar graph shows monthly Vendor Payment Performance percentage against monthly target of 97%; indicated by grey dotted line. This element is dynamically color coded**
• Line graph denoted by (Ο) shows the YTD vendor payment performance %.
DC Water Board of Directors - Vl. CEO/General Manager's Report (David Gadis)
50
Consent Agenda
Summary of Contracts
249th Meeting of the DC Water Board of Directors
Thursday, January 3, 2019
Joint Use Contracts
1. Resolution No. 19-00, Execute Option Year Three of Contract No. 15-PR-WWT-53A, Carter & Carter Enterprises Inc. The purpose of the option is to continue the supply and delivery of Ferric Chloride. The option amount is $4,900,000. (Recommended bythe Environmental Quality and Operations Committee 12/18/18)
2 Resolution No. 19-01, Execute Option Year Two and Additional Funding for Contract No. 16-PR-DMS-43, Electric Motor & Contracting Co., Inc. The purpose of the option and additional funding is to continue the services of a qualified contractor to provide inspection, rehabilitation, replacement, and upgrade services for various process assets throughout DC Water facilities. The option and additional funding amount is $2,400,000. Recommended by the Environmental Quality and Operations Committee 12/18/18)
Non-Joint Use
1. Resolution No. 19-02, Execute Change Order No. 01 of Contract No. 130140, Fort Myer Construction Corporation. The purpose of the change order is to continue the replacement of water mains and associated appurtenances to improve the water quality and performance of the distribution system. The change order amount is $802,864.50. (Recommended by the Environmental Quality and Operations Committee 12/18/18)
DC Water Board of Directors - VIII. Summary of Contracts (FYI)
51
DC Water Board of Directors - IX. Consent Items (Joint Use)
52
DC Water Board of Directors - IX. Consent Items (Joint Use)
53
DC Water Board of Directors - IX. Consent Items (Joint Use)
54
DC Water Board of Directors - IX. Consent Items (Joint Use)
55
DC Water Board of Directors - IX. Consent Items (Joint Use)
56
DC Water Board of Directors - IX. Consent Items (Joint Use)
57
DC Water Board of Directors - X. Consent Item (Non-Joint Use)
58
DC Water Board of Directors - X. Consent Item (Non-Joint Use)
59
DC Water Board of Directors - X. Consent Item (Non-Joint Use)
60
Top Related