


Languages
Pages
Legal

Calculus concepts and applications
This worksheet and all related files are licensed under the Creative Commons Attribution License,version 1.0. To view a copy of this license, visit http://creativecommons.org/licenses/by/1.0/, or send aletter to Creative Commons, 559 Nathan Abbott Way, Stanford, California 94305, USA. The terms andconditions of this license allow for free copying, distribution, and/or modification of all licensed works bythe general public.
1
Questions
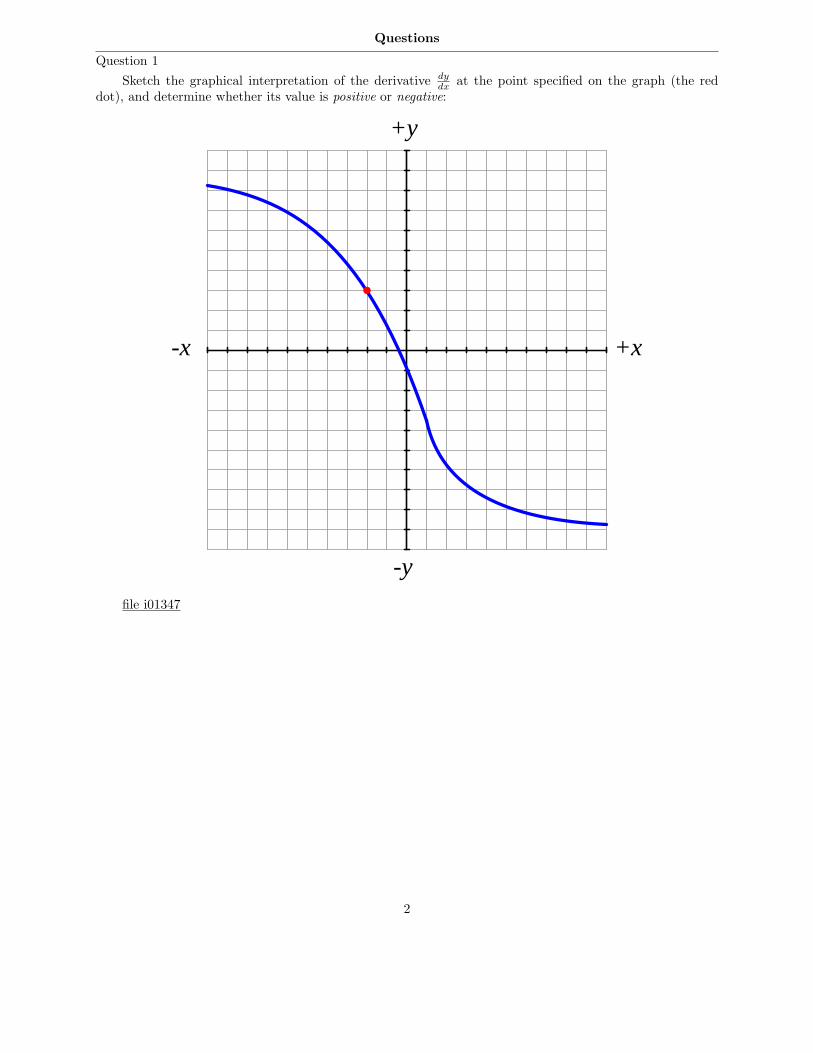
Question 1
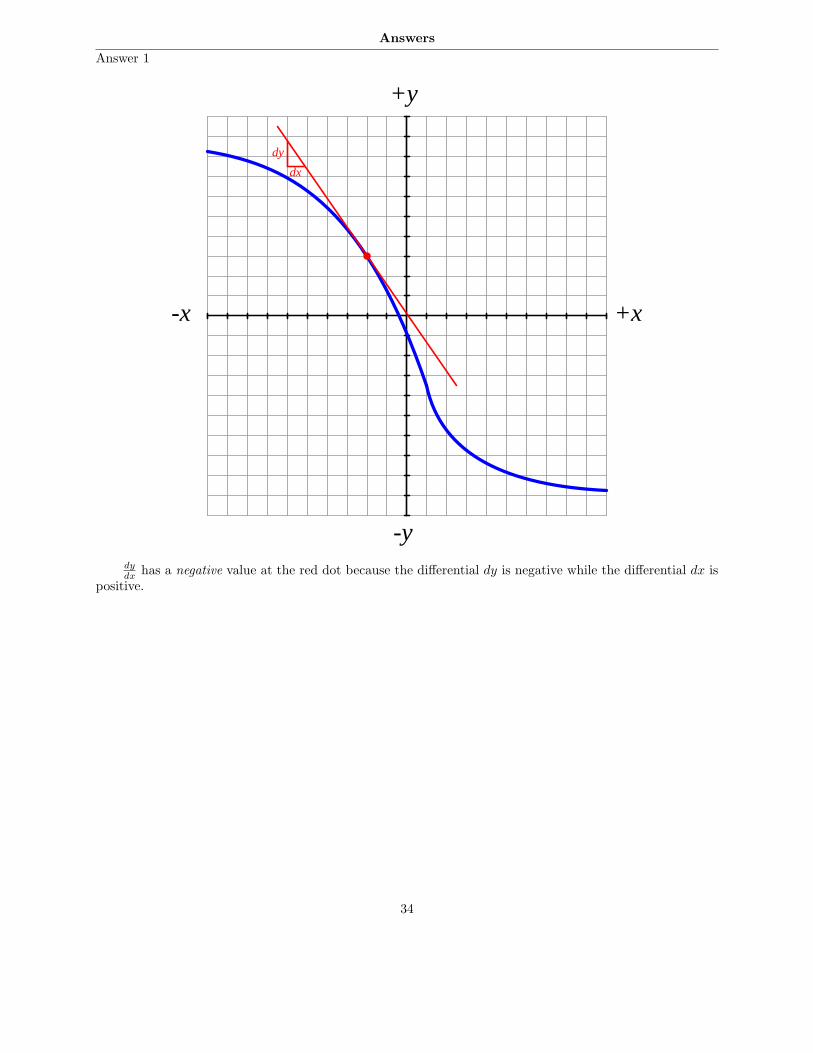
Sketch the graphical interpretation of the derivative dy
dxat the point specified on the graph (the red
dot), and determine whether its value is positive or negative:
+y
-y
+x-x
file i01347
2
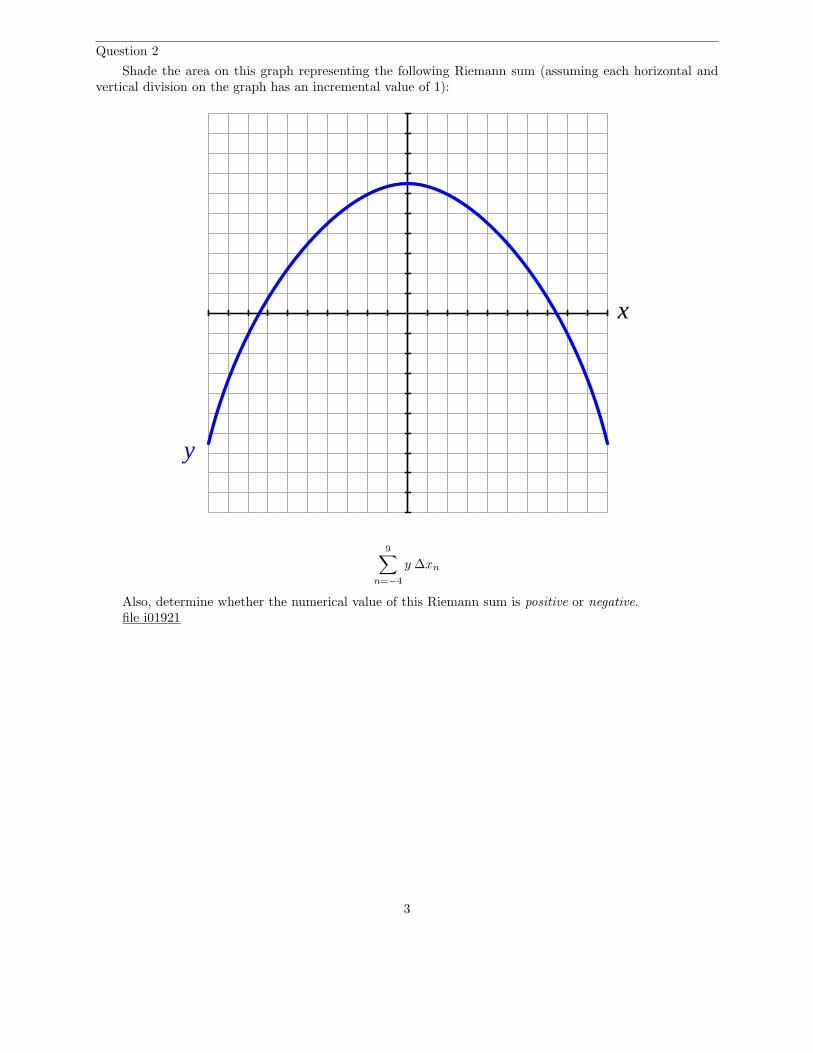
Question 2
Shade the area on this graph representing the following Riemann sum (assuming each horizontal andvertical division on the graph has an incremental value of 1):
x
y
9∑
n=−4
y ∆xn
Also, determine whether the numerical value of this Riemann sum is positive or negative.file i01921
3
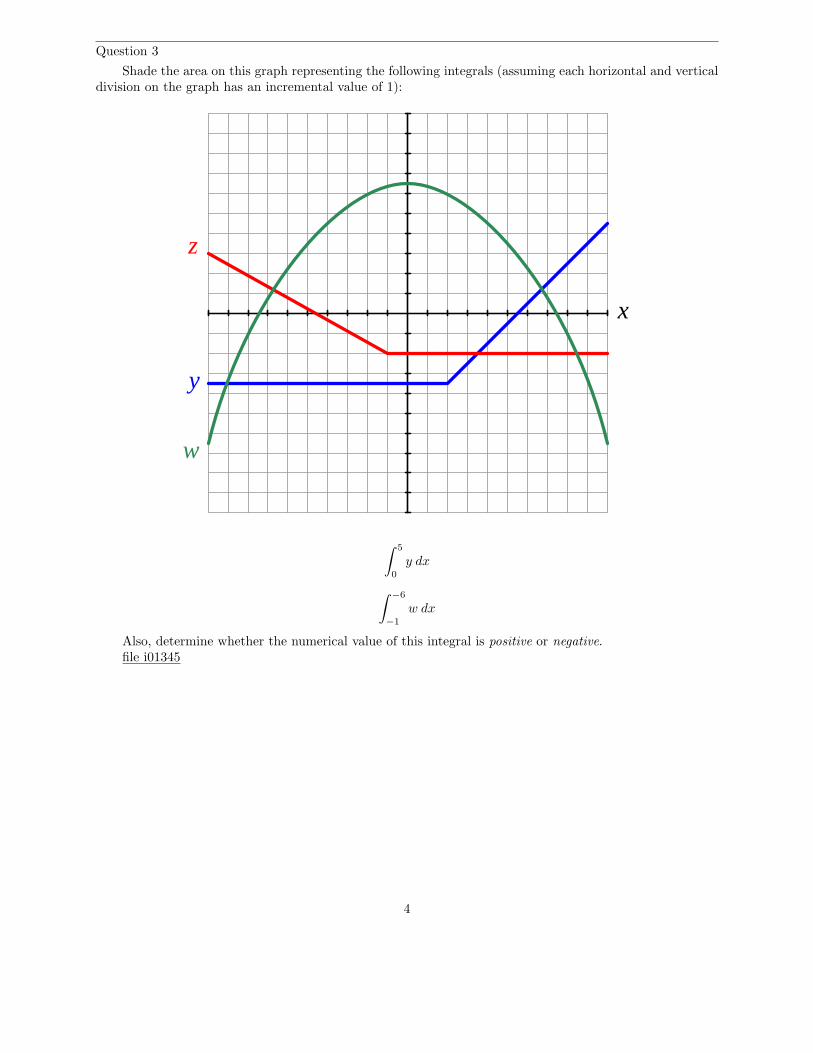
Question 3
Shade the area on this graph representing the following integrals (assuming each horizontal and verticaldivision on the graph has an incremental value of 1):
x
y
z
w
∫ 5
0
y dx
∫
−6
−1
w dx
Also, determine whether the numerical value of this integral is positive or negative.file i01345
4

Question 4
Shade the area(s) on this graph representing the following integral (assuming each horizontal and verticaldivision on the graph has an incremental value of 1):
x
y
z
w
∫ 3
−6
(w − y) dx
Also, determine whether the numerical value of this integral is positive or negative.file i01343
5
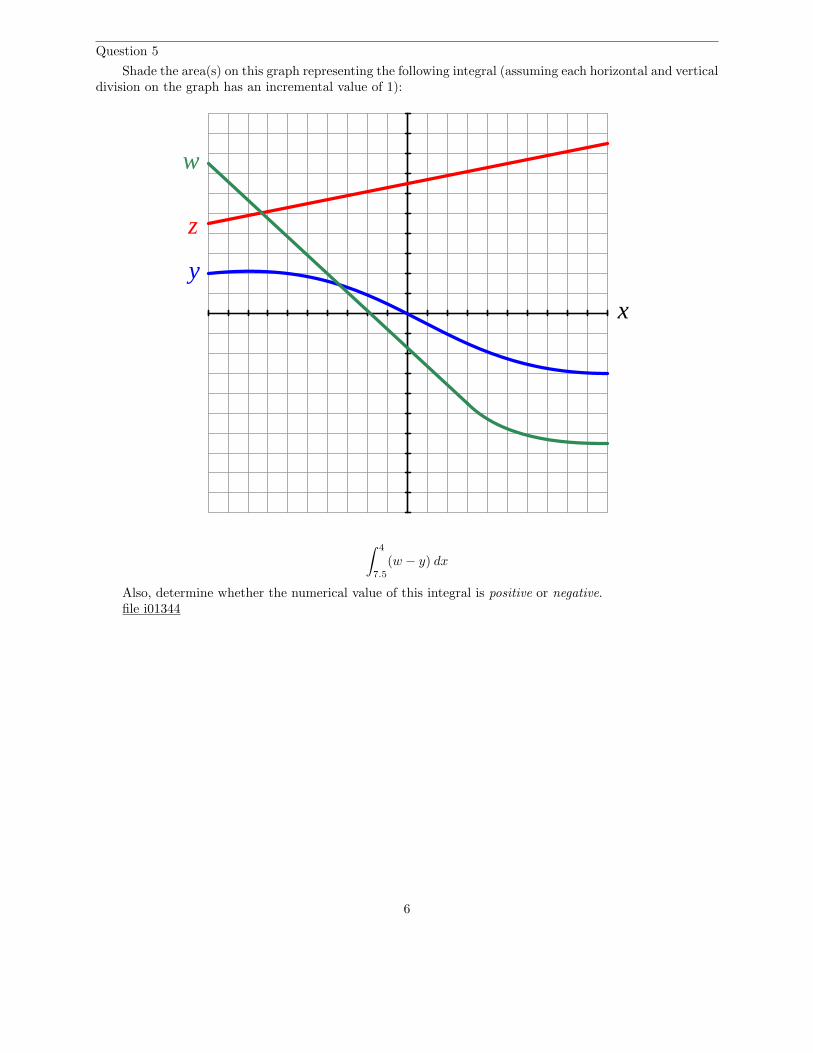
Question 5
Shade the area(s) on this graph representing the following integral (assuming each horizontal and verticaldivision on the graph has an incremental value of 1):
x
y
z
w
∫ 4
7.5
(w − y) dx
Also, determine whether the numerical value of this integral is positive or negative.file i01344
6

Question 6
Write the integral expression represented by the shaded area on this graph (assuming each horizontaland vertical division on the graph has an incremental value of 1). The integral for this shaded area has apositive value:
x
y
z
w
file i01346
7
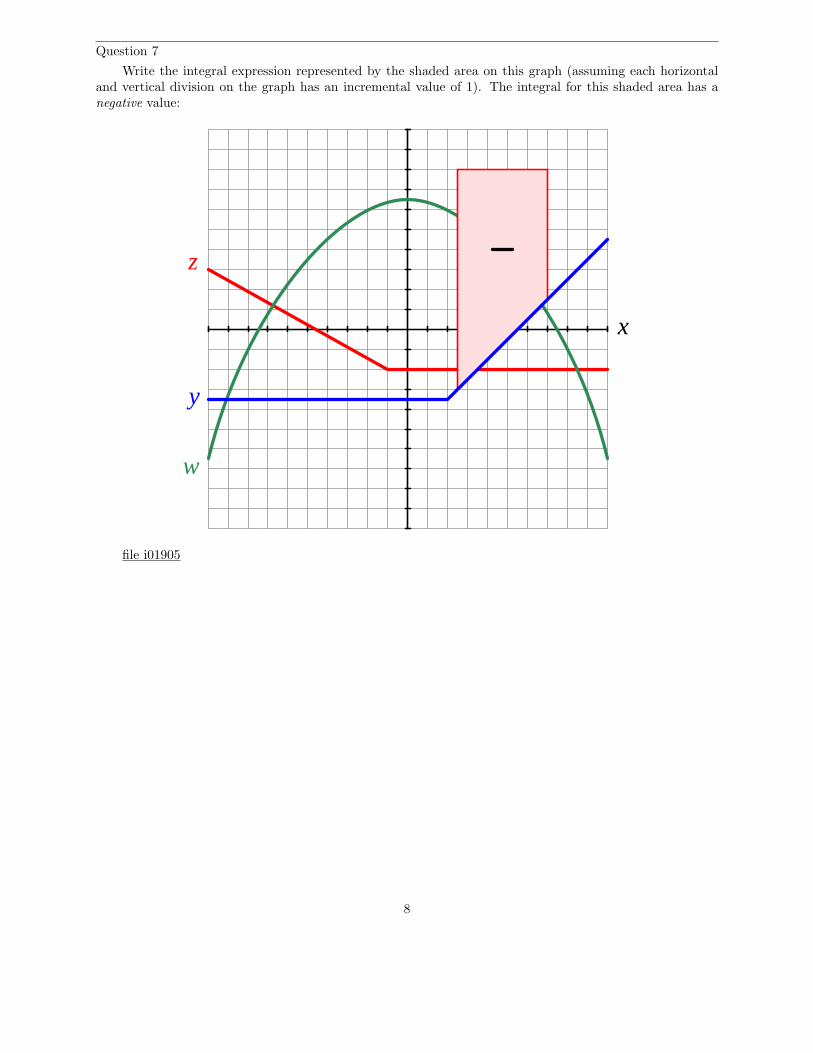
Question 7
Write the integral expression represented by the shaded area on this graph (assuming each horizontaland vertical division on the graph has an incremental value of 1). The integral for this shaded area has anegative value:
x
y
z
w
file i01905
8
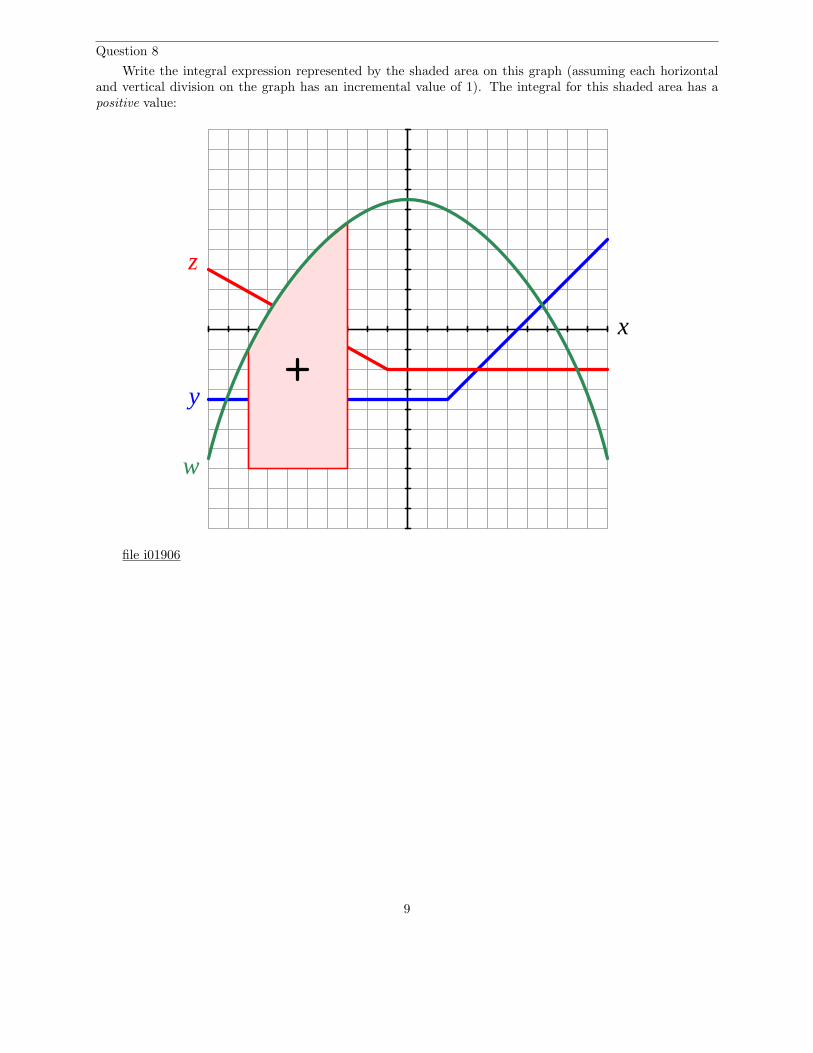
Question 8
Write the integral expression represented by the shaded area on this graph (assuming each horizontaland vertical division on the graph has an incremental value of 1). The integral for this shaded area has apositive value:
x
y
z
w
file i01906
9

Question 9
A small-scale biodiesel manufacturing plant records the production of biodiesel fuel by measuring theliquid level in a storage vessel. There is no flow transmitter monitoring flow rate into the vessel, but we caninfer flow rate by monitoring vessel level over time.
LT
Ultrasonic
Level transmitter
Biodiesel
Storagevessel
Computer
LIUPV
The liquid level measurement signal coming from the ultrasonic level transmitter (LT) is our processvariable (PV), and it is sent to a computer to be indicated and processed (LIU). The particular processingdone in the computer is calculation of average flow between sample intervals.
Suppose that the computer samples the transmitter’s signal once every minute and records thesemeasurements in a data file. Here is an example of that file’s contents after one tank-filling batch, shown ina table format:
Time Volume Time Volume Time Volume(minutes) (gallons) (minutes) (gallons) (minutes) (gallons)
0 17.05 10 31.12 20 40.151 17.05 11 33.89 21 42.222 17.05 12 36.69 22 44.603 17.05 13 39.40 23 47.164 17.05 14 40.15 24 50.005 17.05 15 40.15 25 52.856 20.06 16 40.15 26 55.767 23.01 17 40.15 27 58.648 25.44 18 40.15 28 61.539 28.23 19 40.15 29 64.31
10
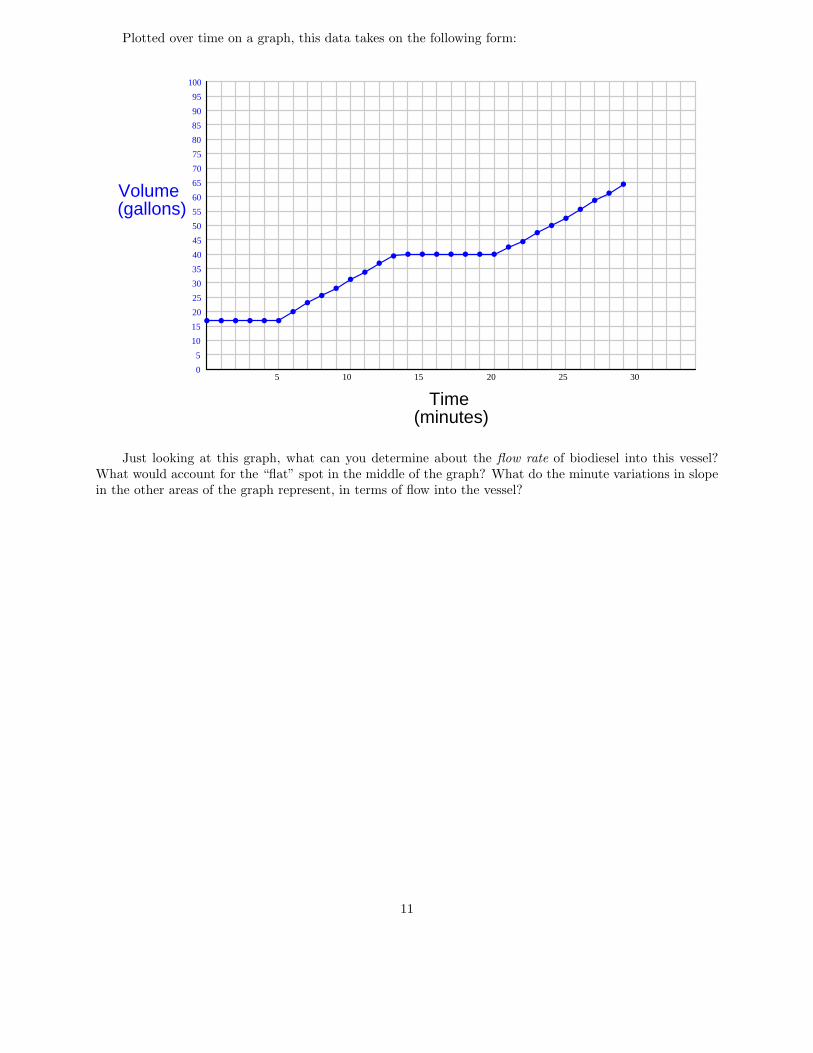
Plotted over time on a graph, this data takes on the following form:
Time
0
5
10
15
20
25
30
35
40
45
50
55
60
65
70
75
80
85
90
95
100
Volume(gallons)
5 10 15 20 25 30
(minutes)
Just looking at this graph, what can you determine about the flow rate of biodiesel into this vessel?What would account for the “flat” spot in the middle of the graph? What do the minute variations in slopein the other areas of the graph represent, in terms of flow into the vessel?
11

Now, use the data in the table to calculate and plot the flow rate of biodiesel in gallons per minute intothis vessel:
Time
0
5
10
15
20
25
30
35
40
45
50
55
60
65
70
75
80
85
90
95
100
Volume(gallons)
5 10 15 20 25 30
(minutes)
0
0.5
1.0
1.5
2.0
2.5
3.0
3.5
4.0
4.5
5.0
Flow(gal/min)
How do these two plots relate to each other? That is, how does the shape of one refer to the shape ofthe other, geometrically?
Suggestions for Socratic discussion
• Suppose a technician decided to calculate the flow rate at t = 4 minutes by taking the volume at thattime (17.05 gallons) and dividing by the time (4 minutes). Explain why this would yield an incorrectvalue for flow, then explain the correct way to calculate flow rate at that time from the given data.
file i01504
12
Question 10
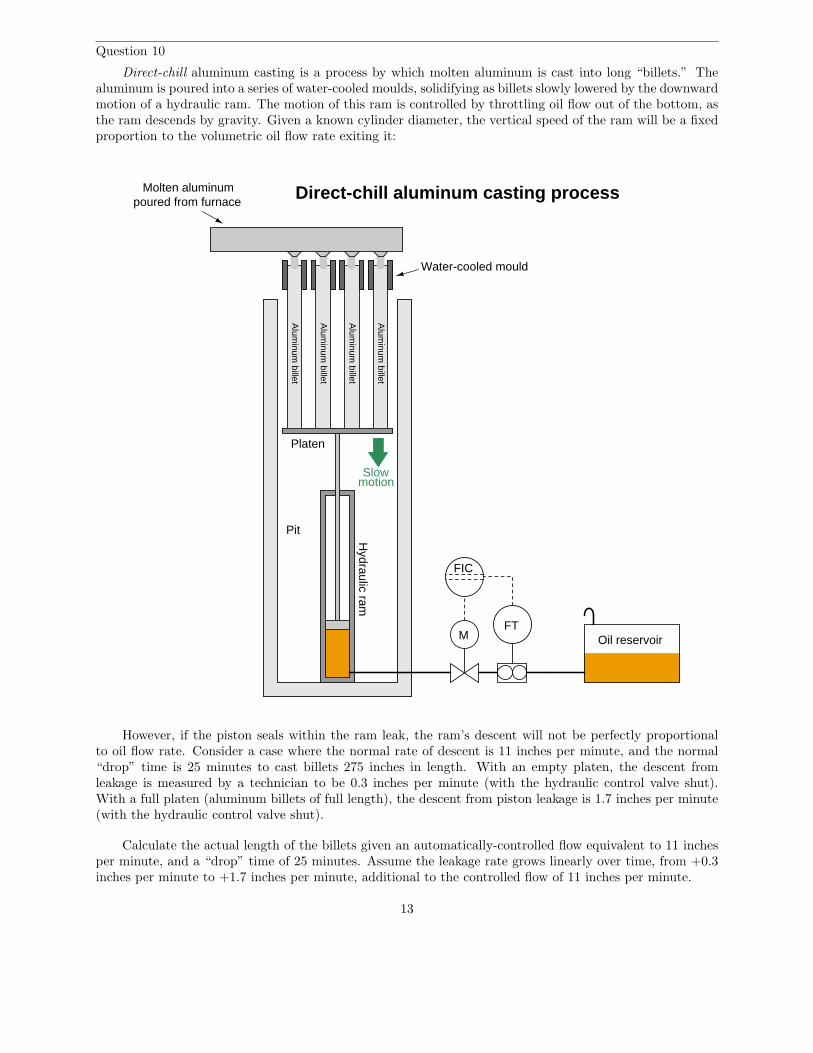
Direct-chill aluminum casting is a process by which molten aluminum is cast into long “billets.” Thealuminum is poured into a series of water-cooled moulds, solidifying as billets slowly lowered by the downwardmotion of a hydraulic ram. The motion of this ram is controlled by throttling oil flow out of the bottom, asthe ram descends by gravity. Given a known cylinder diameter, the vertical speed of the ram will be a fixedproportion to the volumetric oil flow rate exiting it:
Alum
inum billet
Alum
inum billet
Alum
inum billet
Alum
inum billet
Molten aluminumpoured from furnace
Slowmotion
MFT
FIC
Direct-chill aluminum casting process
Water-cooled mould
Oil reservoir
Platen
Pit
Hydraulic ram
However, if the piston seals within the ram leak, the ram’s descent will not be perfectly proportionalto oil flow rate. Consider a case where the normal rate of descent is 11 inches per minute, and the normal“drop” time is 25 minutes to cast billets 275 inches in length. With an empty platen, the descent fromleakage is measured by a technician to be 0.3 inches per minute (with the hydraulic control valve shut).With a full platen (aluminum billets of full length), the descent from piston leakage is 1.7 inches per minute(with the hydraulic control valve shut).
Calculate the actual length of the billets given an automatically-controlled flow equivalent to 11 inchesper minute, and a “drop” time of 25 minutes. Assume the leakage rate grows linearly over time, from +0.3inches per minute to +1.7 inches per minute, additional to the controlled flow of 11 inches per minute.
13

Suggestions for Socratic discussion
• A useful problem-solving technique for calculus-based problems is to sketch a graph of the variablesbeing considered. The derivative of a function is the slope of the graph, while the integral of a functionis the area bound by the graph. Apply this problem-solving technique to the problem at hand in thisquestion.
file i02099
14

Question 11
Complete a table showing x and y values for the following equation, then plot the equation on thecoordinate grid provided:
y = 3x + 2
x y
-3-2-10123
x
y
Calculate the slope (at any point) for this equation. Explain both how you may determine the slope bylooking at x and y values in the table, and also by examining the written equation.
file i01514
15
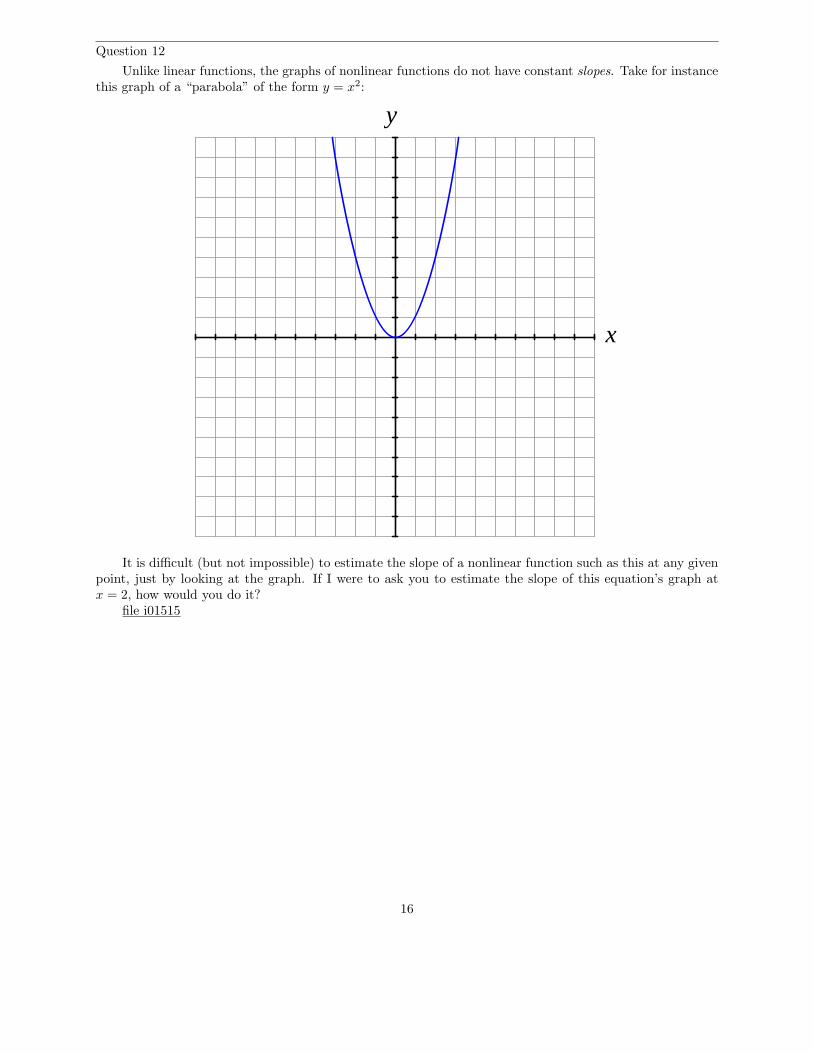
Question 12
Unlike linear functions, the graphs of nonlinear functions do not have constant slopes. Take for instancethis graph of a “parabola” of the form y = x2:
x
y
It is difficult (but not impossible) to estimate the slope of a nonlinear function such as this at any givenpoint, just by looking at the graph. If I were to ask you to estimate the slope of this equation’s graph atx = 2, how would you do it?
file i01515
16

Question 13
Two straight lines appear on this graph, along with a parabola, defined by the equation y = x2. Dotsmark where each of the straight lines intersects the parabola:
y = x2
One of these straight lines is a tangent line, while the other is a secant line. Identify which is which, andthen give general definitions for each line type.
file i01506
17

Question 14
Shown here is a view of a secant line and a tangent line (both thin) to a curve (thick):
curvex
y
The slope of one of these lines is represented by the ratio of two “increments,” ∆y and ∆x:
∆y
∆x
The slope of the other line is represented by the ratio of two “differentials,” dy and dx, better knownas a derivative:
dy
dx
Determine which slope (∆y
∆xor dy
dx) belongs to which type of line (secant or tangent), and label all
increments and differentials on the graph.file i01508
18
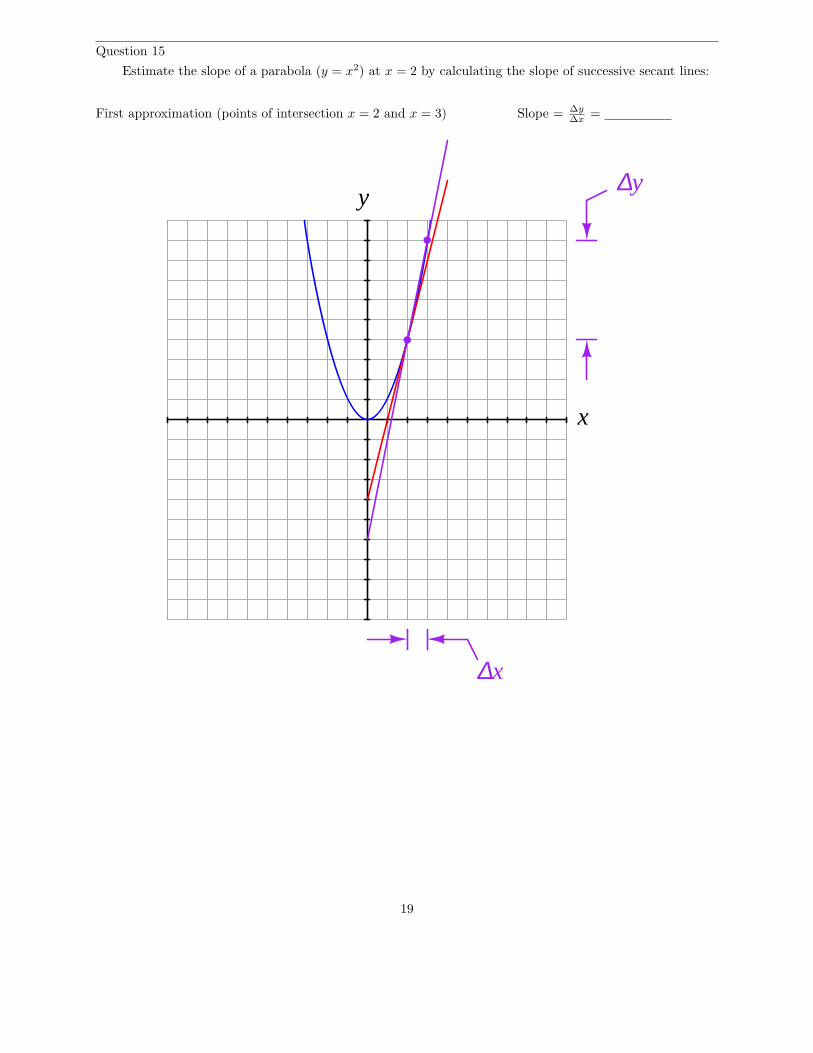
Question 15
Estimate the slope of a parabola (y = x2) at x = 2 by calculating the slope of successive secant lines:
First approximation (points of intersection x = 2 and x = 3) Slope = ∆y
∆x=
x
y
∆x
∆y
19
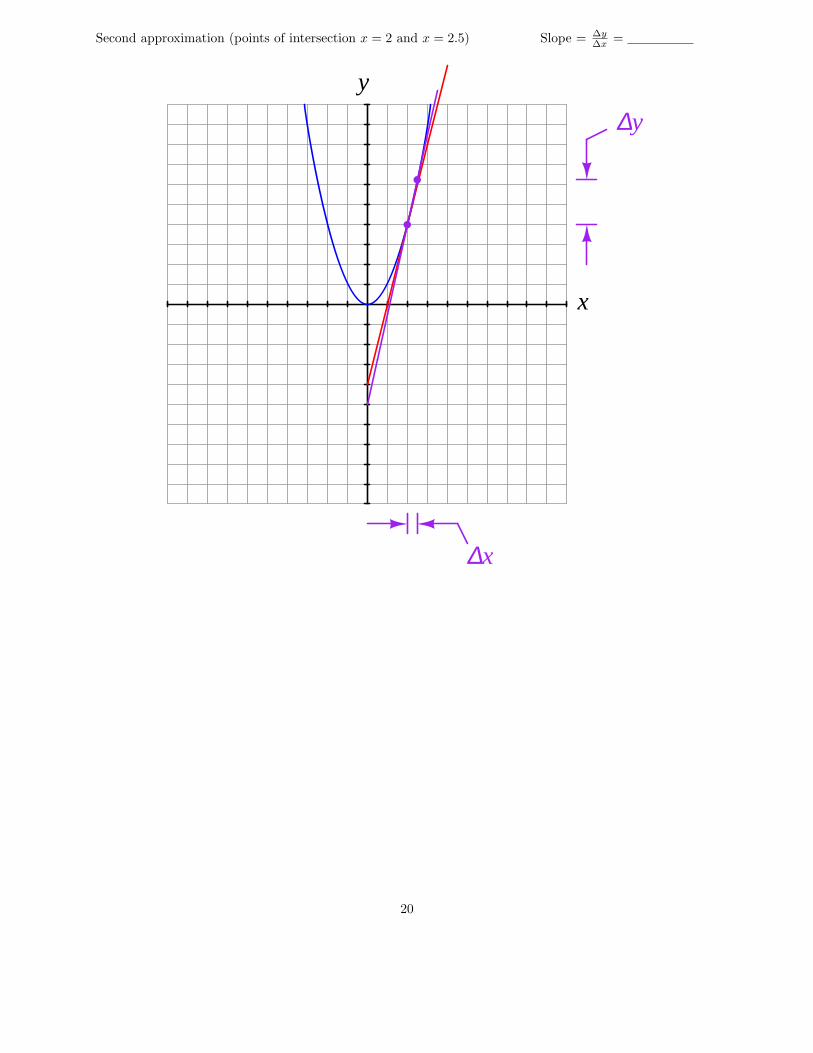
Second approximation (points of intersection x = 2 and x = 2.5) Slope = ∆y
∆x=
x
y
∆x
∆y
20
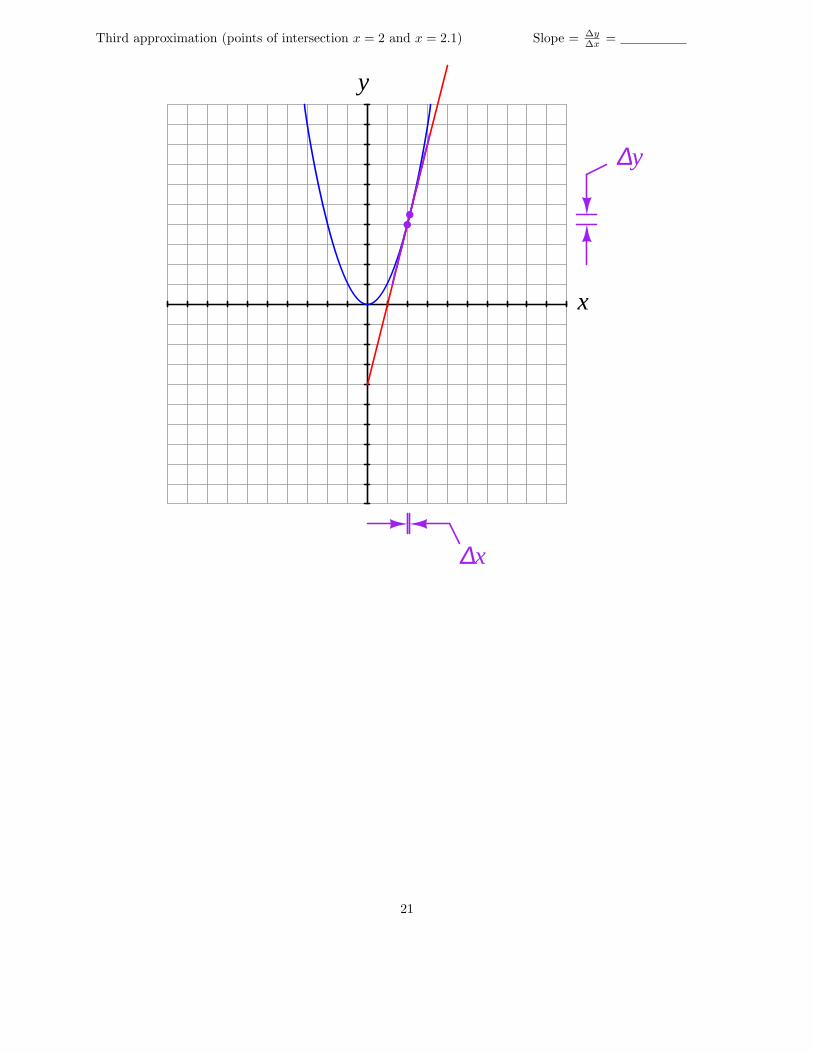
Third approximation (points of intersection x = 2 and x = 2.1) Slope = ∆y
∆x=
x
y
∆x
∆y
21
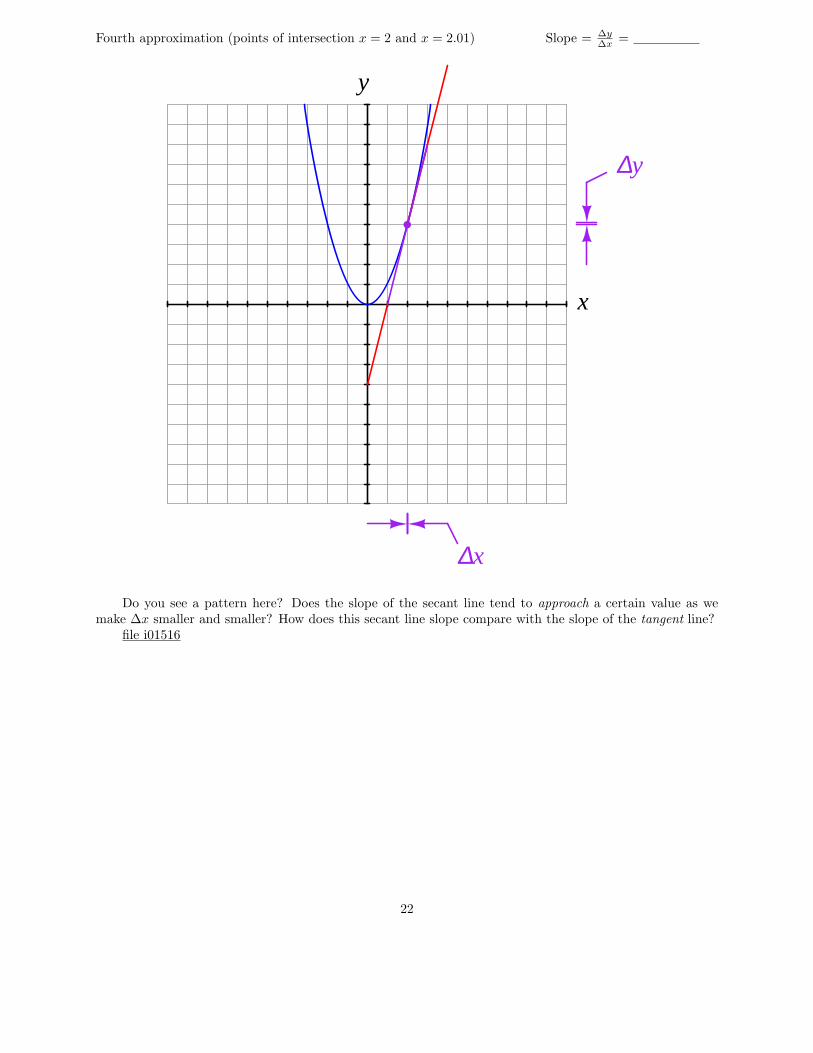
Fourth approximation (points of intersection x = 2 and x = 2.01) Slope = ∆y
∆x=
x
y
∆x
∆y
Do you see a pattern here? Does the slope of the secant line tend to approach a certain value as wemake ∆x smaller and smaller? How does this secant line slope compare with the slope of the tangent line?
file i01516
22
Question 16
Estimate the slopes of the tangent lines touching a parabola (y = x2) at x = 3, x = 4, and x = 5 byusing secant line approximations:
If y = x2 then,
dy
dx
∣
∣
∣
∣
x=3
=
dy
dx
∣
∣
∣
∣
x=4
=
dy
dx
∣
∣
∣
∣
x=5
=
Do you see a mathematical relationship between the value of x and the slope of the line tangent to thatpoint on the parabola? Can you express that relationship as a function of x?
dy
dx= ???
file i01517
23

Question 17
Estimate the slopes of the tangent lines touching a nonlinear function (y = x3) at x = 1, x = 2, x = 3,x = 4, and x = 5 by using secant line approximations:
If y = x3 then,
dy
dx
∣
∣
∣
∣
x=1
=
dy
dx
∣
∣
∣
∣
x=2
=
dy
dx
∣
∣
∣
∣
x=3
=
dy
dx
∣
∣
∣
∣
x=4
=
dy
dx
∣
∣
∣
∣
x=5
=
Do you see a mathematical relationship between the value of x and the slope of the line tangent to thatpoint on the cubic function? Can you express that relationship as a function of x?
dy
dx= ???
file i01518
24
Question 18
The “Power Rule” in differential calculus tells us how to find a formula for the derivative of a functionconsisting of an integer power of the independent variable:
If y = xn thendy
dx= nxn−1
Using the Power Rule, differentiate the following functions:
y = xdy
dx=
y = x2dy
dx=
y = x3dy
dx=
y = x4dy
dx=
y = x5dy
dx=
y = x−1dy
dx=
y =√
xdy
dx=
y = 11dy
dx=
file i01519
25
Question 19
The “Constant Multiple Rule” in differential calculus tells us that the derivative of a function multipliedby a constant will be that constant multiplied by the derivative of the function:
If y = af(x) thendy
dx= a
[
d
dxf(x)
]
The “Sum Rule” in differential calculus tells us that the derivative of a sum will be the sum of thederivatives:
If y = f(x) + g(x) thendy
dx=
d
dxf(x) +
d
dxg(x)
Both of these rules (plus the “Power Rule”) are useful when we must differentiate a polynomial functionsuch as this:
y = 3x2 + 5xdy
dx= 6x + 5
Apply these rules of differentiation to the following functions:
y = 4x3 + 17x2 + 2xdy
dx=
y = x5 + 4x3 + 6x2dy
dx=
y = −x2 + 3x + 10dy
dx=
y = 3x2 − 8x − 1dy
dx=
y = −5x3 + 10x2 − 6xdy
dx=
file i01520
26
Question 20
In physics, a very common formula relating position (x), velocity (v) and constant acceleration (a) is asfollows:
x = xo + vot +1
2at2
Where,x = Final positionxo = Original positionvo = Original velocitya = Accelerationt = Time
Differentiate this equation with respect to time, showing your work at each step. Also, explain themeaning of the derived equation (what does dx
dtrepresent in physics?).
file i01522
Question 21
Capacitors store energy in the form of an electric field. We may calculate the energy stored in acapacitance by integrating the product of capacitor voltage and capacitor current (P = IV ) over time, sincewe know that power is the rate at which work (W ) is done, and the amount of work done to a capacitortaking it from zero voltage to some non-zero amount of voltage constitutes energy stored (U):
P =dW
dt
dW = P dt
U = W =
∫
P dt
Find a way to substitute capacitance (C) and voltage (V ) into the integrand so you may integrate tofind an equation describing the amount of energy stored in a capacitor for any given capacitance and voltagevalues.
file i02464
27
Question 22
Inductors store energy in the form of a magnetic field. We may calculate the energy stored in aninductance by integrating the product of inductor voltage and inductor current (P = IV ) over time, sincewe know that power is the rate at which work (W ) is done, and the amount of work done to an inductortaking it from zero current to some non-zero amount of current constitutes energy stored (U):
P =dW
dt
dW = P dt
U = W =
∫
P dt
Find a way to substitute inductance (L) and current (I) into the integrand so you may integrate tofind an equation describing the amount of energy stored in an inductor for any given inductance and currentvalues.
file i02465
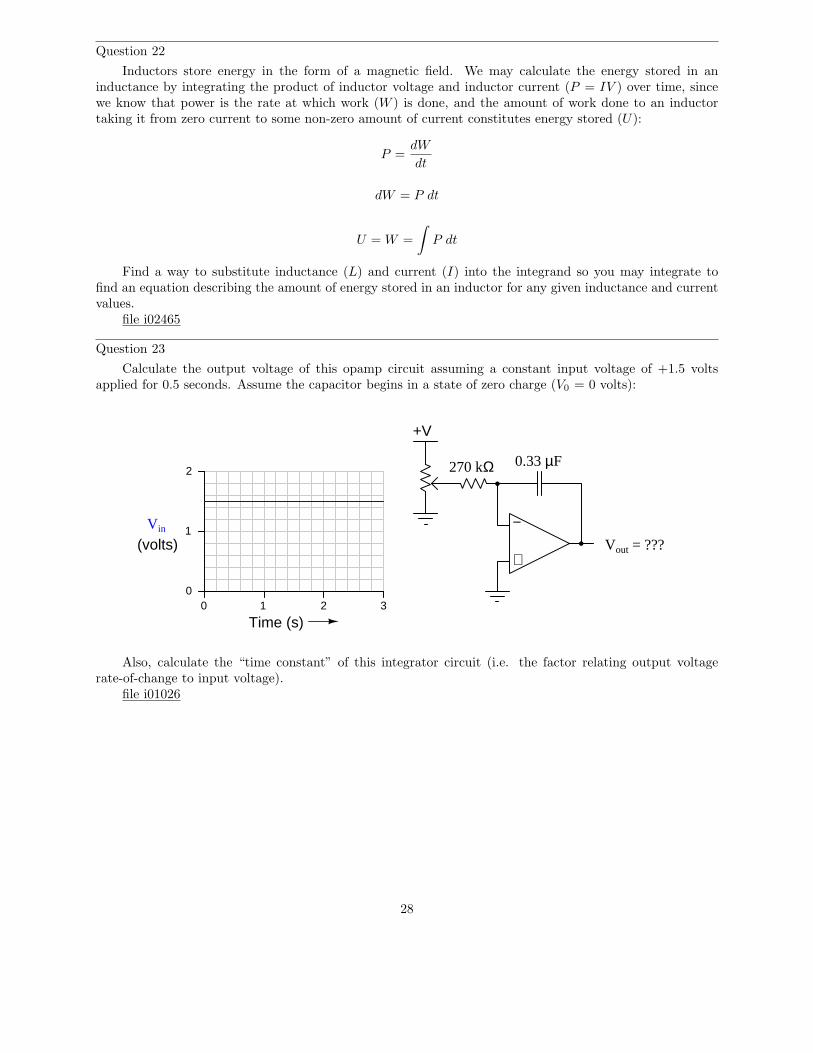
Question 23
Calculate the output voltage of this opamp circuit assuming a constant input voltage of +1.5 voltsapplied for 0.5 seconds. Assume the capacitor begins in a state of zero charge (V0 = 0 volts):
+V
−
+Vout = ???
0.33 µF270 kΩ
Vin
2
1
00
Time (s)1 2 3
(volts)
Also, calculate the “time constant” of this integrator circuit (i.e. the factor relating output voltagerate-of-change to input voltage).
file i01026
28
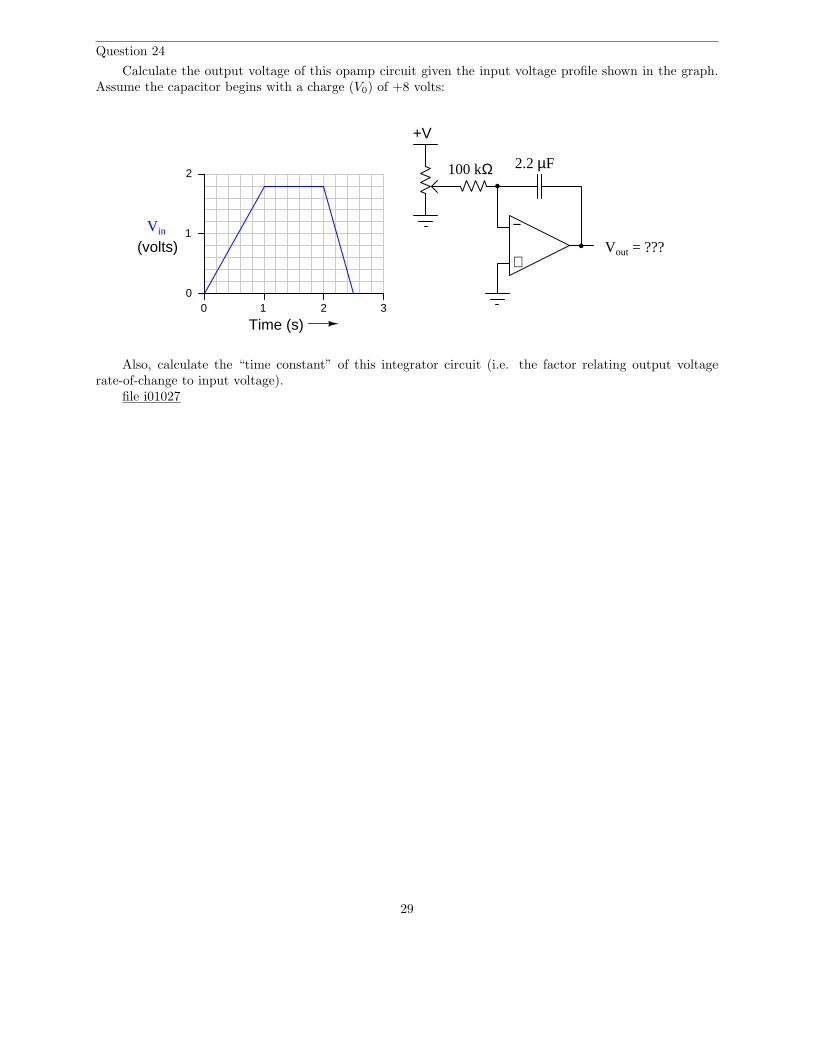
Question 24
Calculate the output voltage of this opamp circuit given the input voltage profile shown in the graph.Assume the capacitor begins with a charge (V0) of +8 volts:
+V
−
+Vout = ???
Vin
2
1
00
Time (s)1 2 3
(volts)
100 kΩ 2.2 µF
Also, calculate the “time constant” of this integrator circuit (i.e. the factor relating output voltagerate-of-change to input voltage).
file i01027
29
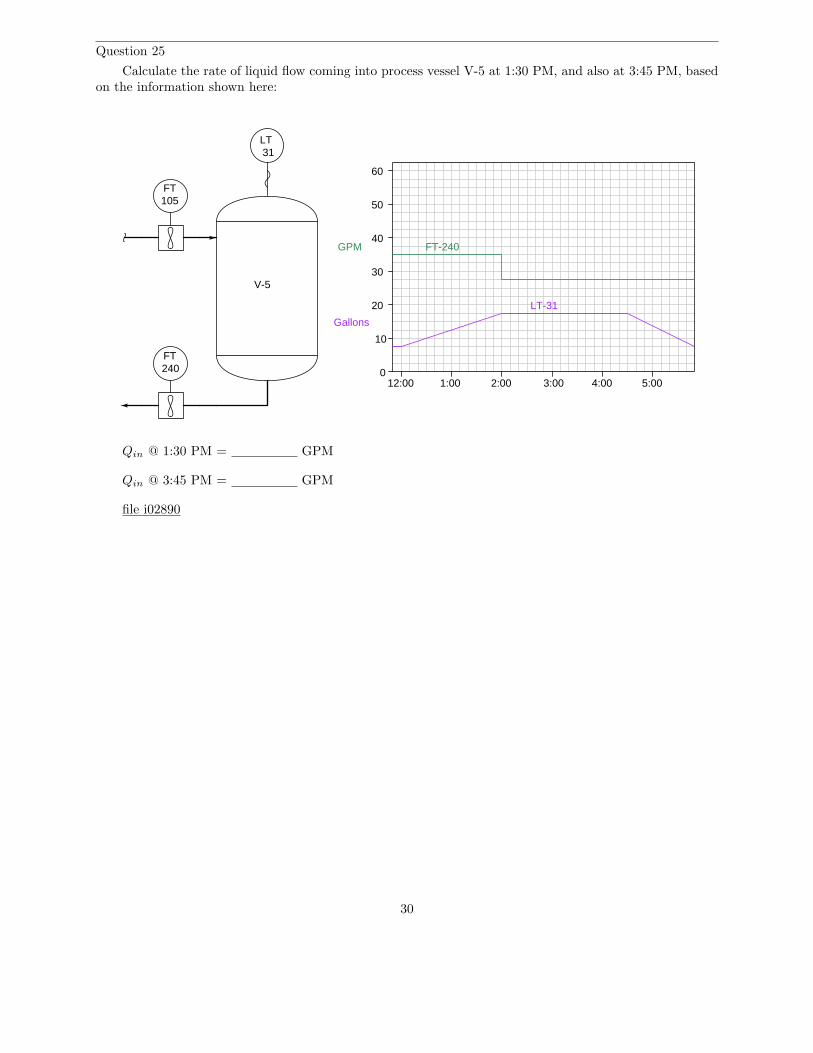
Question 25
Calculate the rate of liquid flow coming into process vessel V-5 at 1:30 PM, and also at 3:45 PM, basedon the information shown here:
FT
FT
LT
105
240
31
V-5
12:00 1:00 2:00 3:00 4:00 5:000
10
20
30
40
50
60
FT-240
LT-31
GPM
Gallons
Qin @ 1:30 PM = GPM
Qin @ 3:45 PM = GPM
file i02890
30
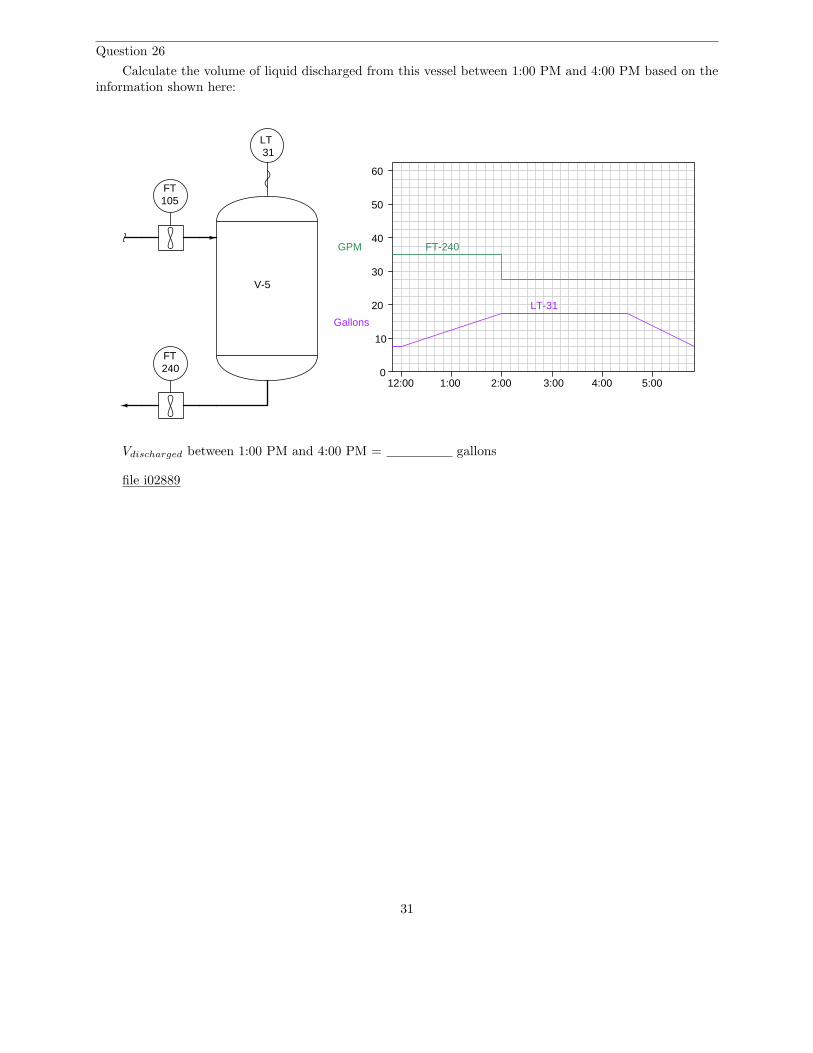
Question 26
Calculate the volume of liquid discharged from this vessel between 1:00 PM and 4:00 PM based on theinformation shown here:
FT
FT
LT
105
240
31
V-5
12:00 1:00 2:00 3:00 4:00 5:000
10
20
30
40
50
60
FT-240
LT-31
GPM
Gallons
Vdischarged between 1:00 PM and 4:00 PM = gallons
file i02889
31
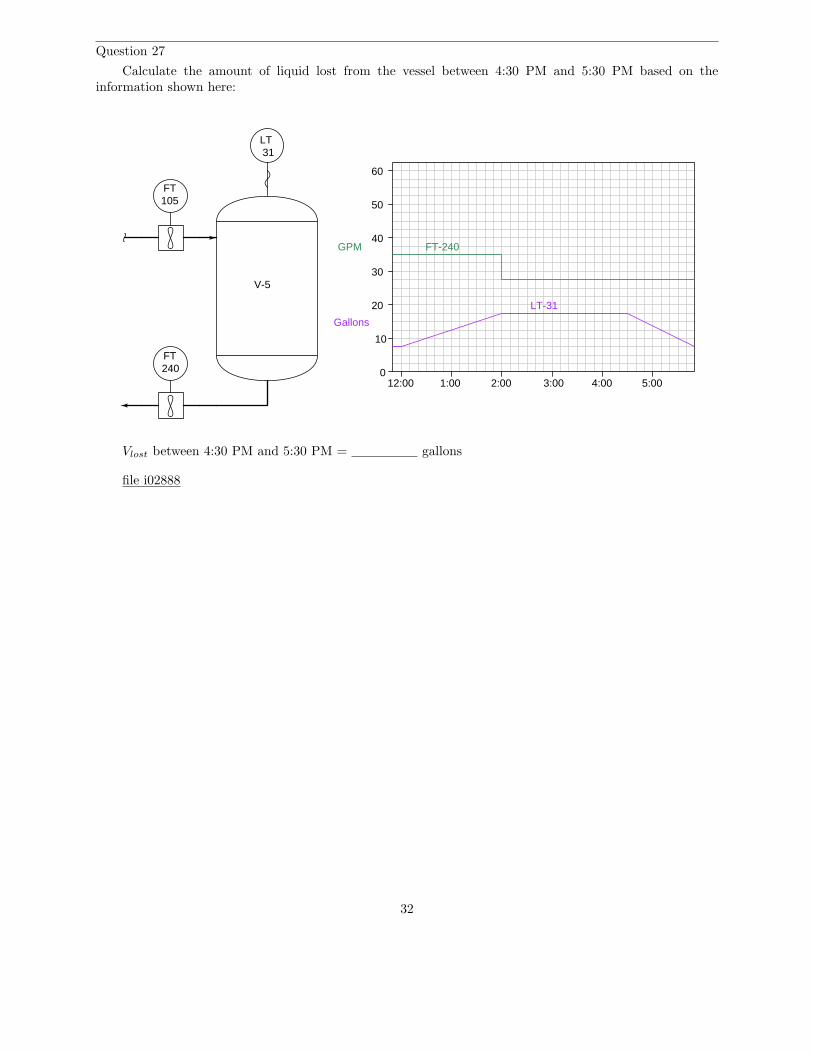
Question 27
Calculate the amount of liquid lost from the vessel between 4:30 PM and 5:30 PM based on theinformation shown here:
FT
FT
LT
105
240
31
V-5
12:00 1:00 2:00 3:00 4:00 5:000
10
20
30
40
50
60
FT-240
LT-31
GPM
Gallons
Vlost between 4:30 PM and 5:30 PM = gallons
file i02888
32
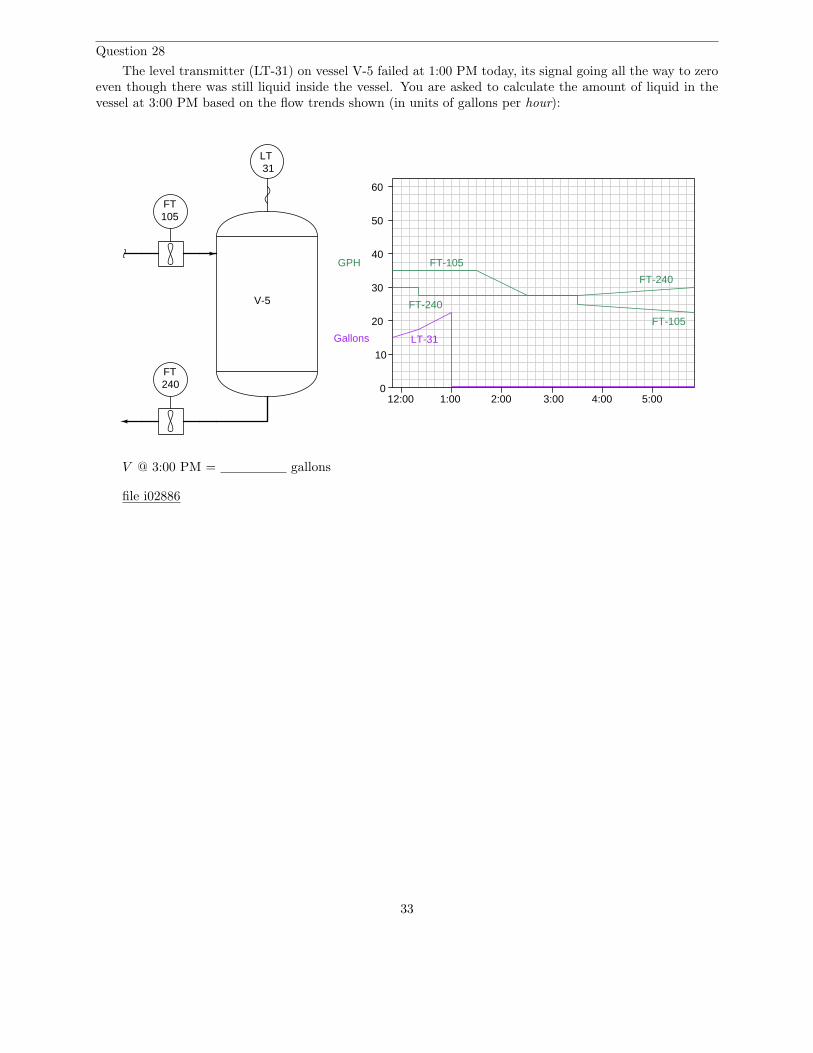
Question 28
The level transmitter (LT-31) on vessel V-5 failed at 1:00 PM today, its signal going all the way to zeroeven though there was still liquid inside the vessel. You are asked to calculate the amount of liquid in thevessel at 3:00 PM based on the flow trends shown (in units of gallons per hour):
FT
FT
LT
105
240
31
V-5
12:00 1:00 2:00 3:00 4:00 5:000
10
20
30
40
50
60
FT-240
LT-31Gallons
GPH FT-105
FT-105
FT-240
V @ 3:00 PM = gallons
file i02886
33
Answers
Answer 1
+y
-y
+x-x
dy
dx
dy
dxhas a negative value at the red dot because the differential dy is negative while the differential dx is
positive.
34
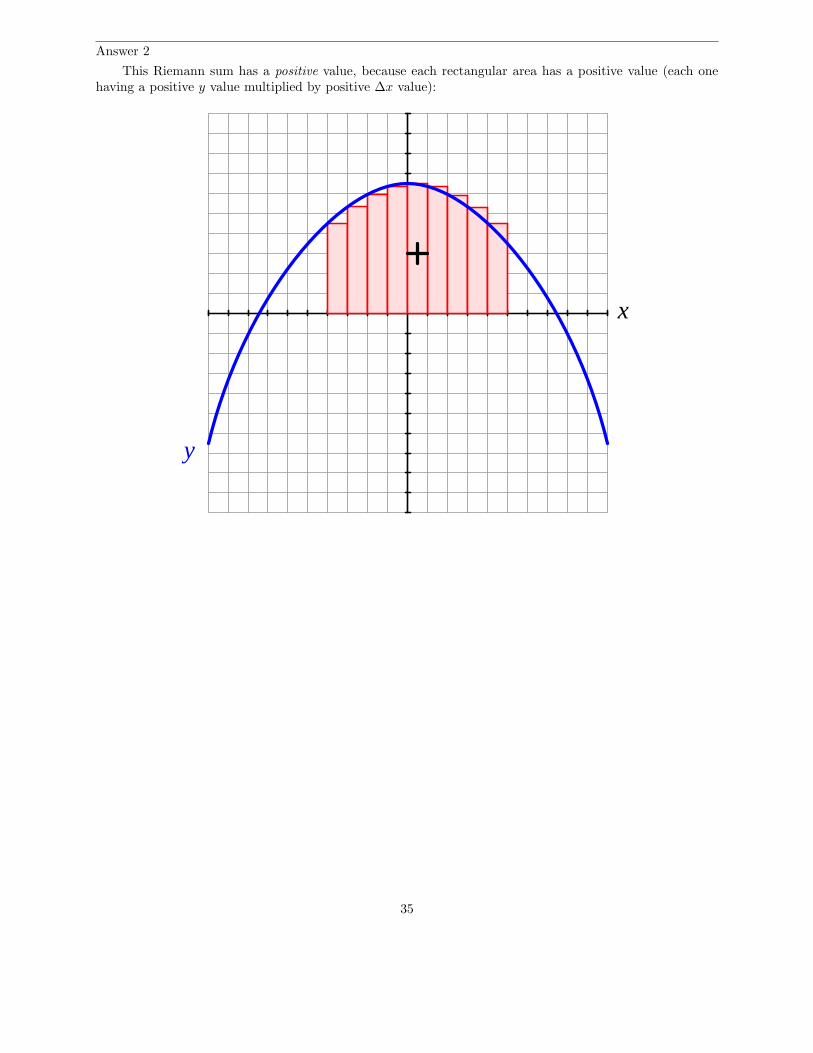
Answer 2
This Riemann sum has a positive value, because each rectangular area has a positive value (each onehaving a positive y value multiplied by positive ∆x value):
x
y
35

Answer 3
Both integrals have negative values:
x
y
z
w
The first integral (shaded red) has positive dx increments but negative y values. The second integral(shaded violet) has negative dx increments and positive w values.
36

Answer 4
This integral has a negative value:
x
y
z
w
From x = −6 to approximately x = −3.5, the integral accumulates a positive value because it has positivedx increments and w is larger than y. From approximately x = −3.5 to x = 3 the integral accumulates anegative value because y is larger than w (a negative integrand) while dx increments still remain positive.Overall, the negative area is greater than the positive area, and so the integral from x = −6 to x = 3 has anet negative value.
37
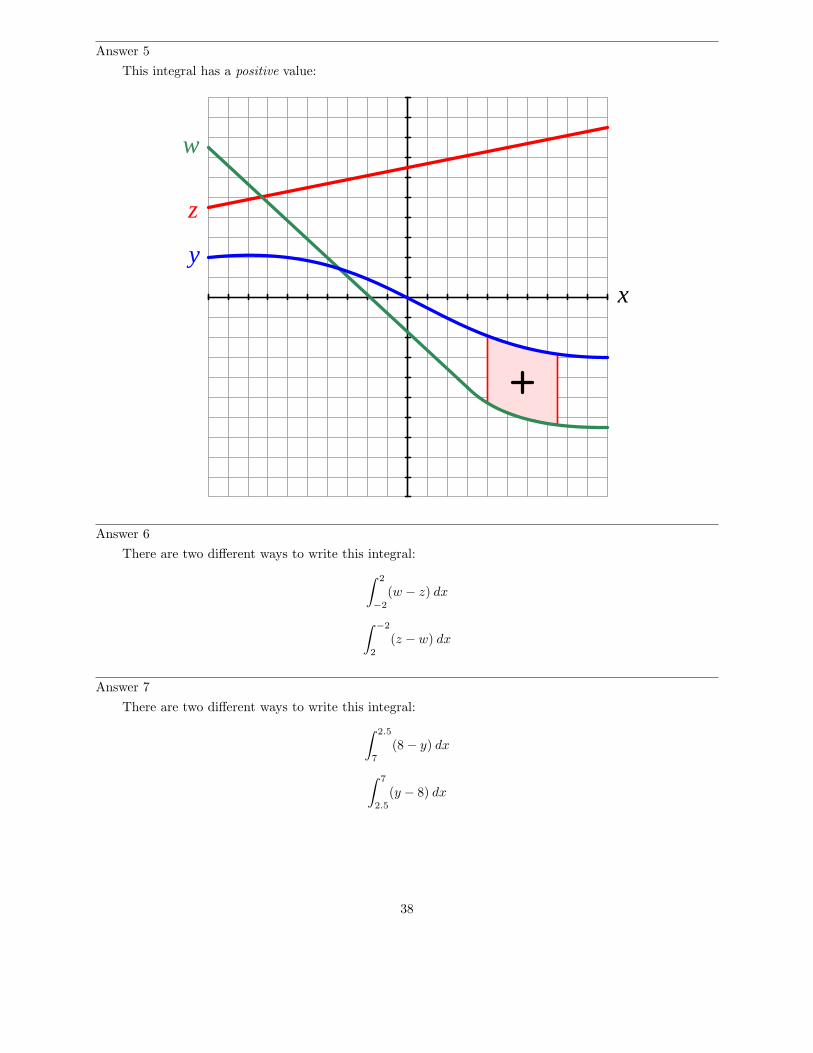
Answer 5
This integral has a positive value:
x
y
z
w
Answer 6
There are two different ways to write this integral:
∫ 2
−2
(w − z) dx
∫
−2
2
(z − w) dx
Answer 7
There are two different ways to write this integral:
∫ 2.5
7
(8 − y) dx
∫ 7
2.5
(y − 8) dx
38
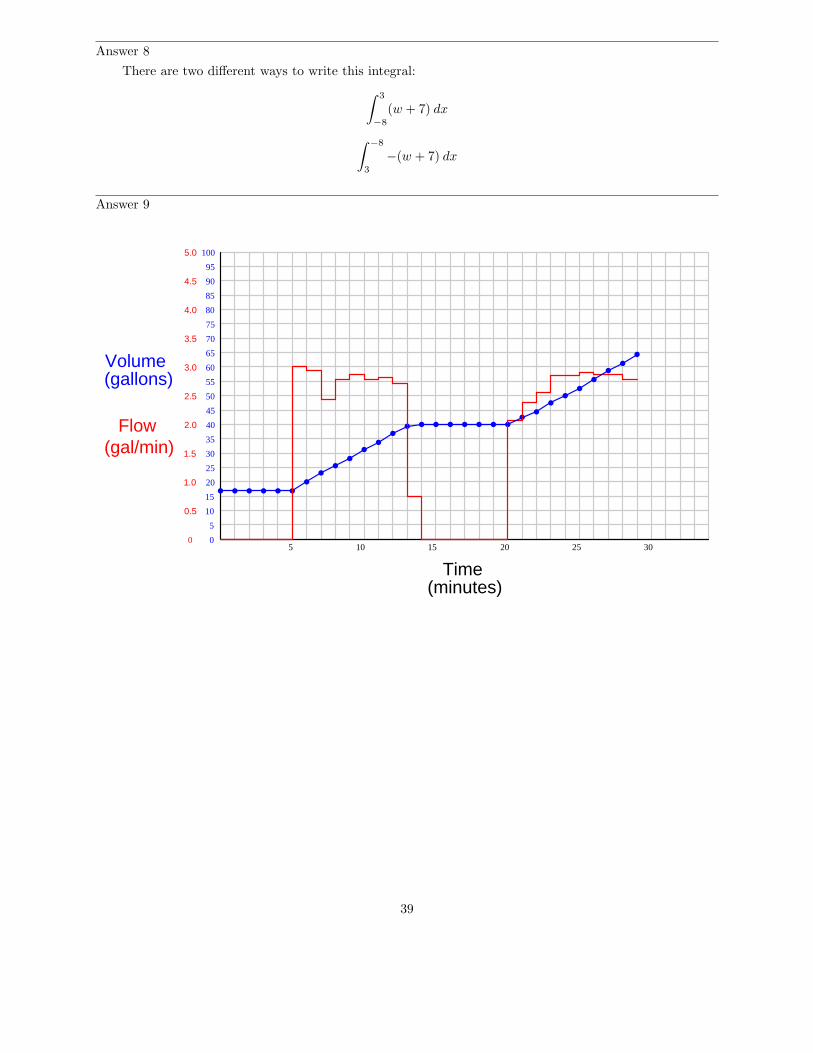
Answer 8
There are two different ways to write this integral:
∫ 3
−8
(w + 7) dx
∫
−8
3
−(w + 7) dx
Answer 9
Time
0
5
10
15
20
25
30
35
40
45
50
55
60
65
70
75
80
85
90
95
100
Volume(gallons)
5 10 15 20 25 30
(minutes)
0
0.5
1.0
1.5
2.0
2.5
3.0
3.5
4.0
4.5
5.0
Flow(gal/min)
39
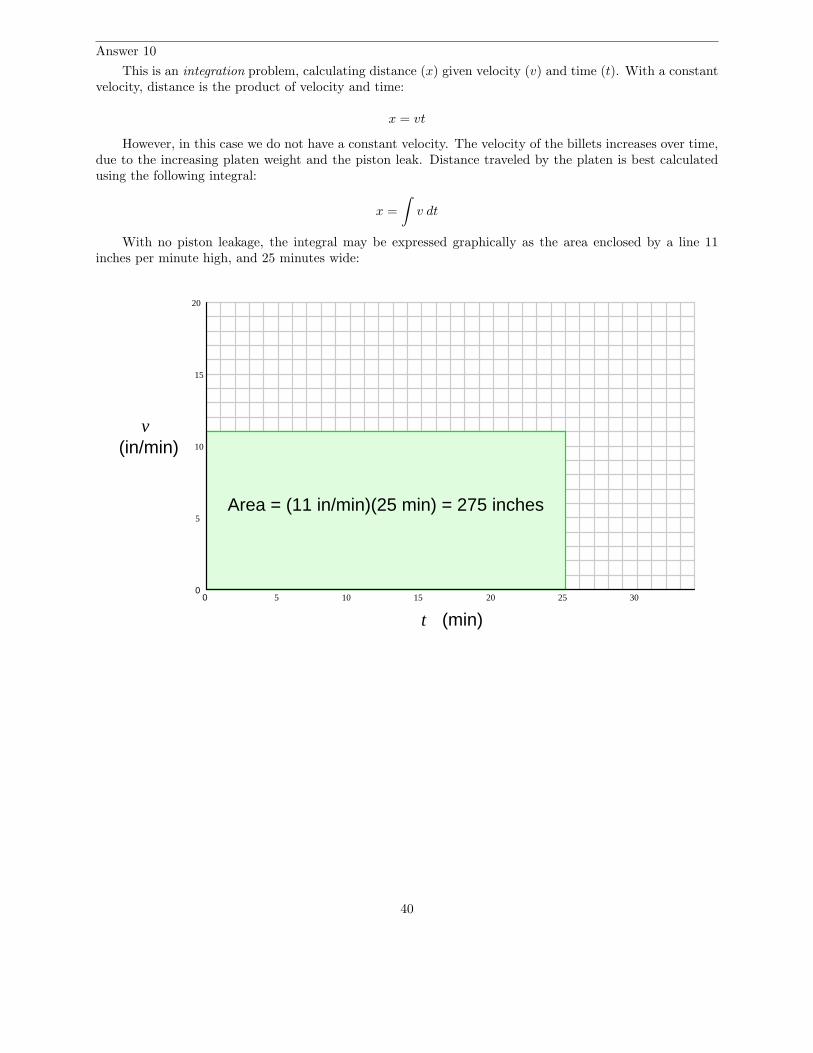
Answer 10
This is an integration problem, calculating distance (x) given velocity (v) and time (t). With a constantvelocity, distance is the product of velocity and time:
x = vt
However, in this case we do not have a constant velocity. The velocity of the billets increases over time,due to the increasing platen weight and the piston leak. Distance traveled by the platen is best calculatedusing the following integral:
x =
∫
v dt
With no piston leakage, the integral may be expressed graphically as the area enclosed by a line 11inches per minute high, and 25 minutes wide:
5 10 15 20 25 3000
5
10
15
20
Area = (11 in/min)(25 min) = 275 inches
v(in/min)
t (min)
40
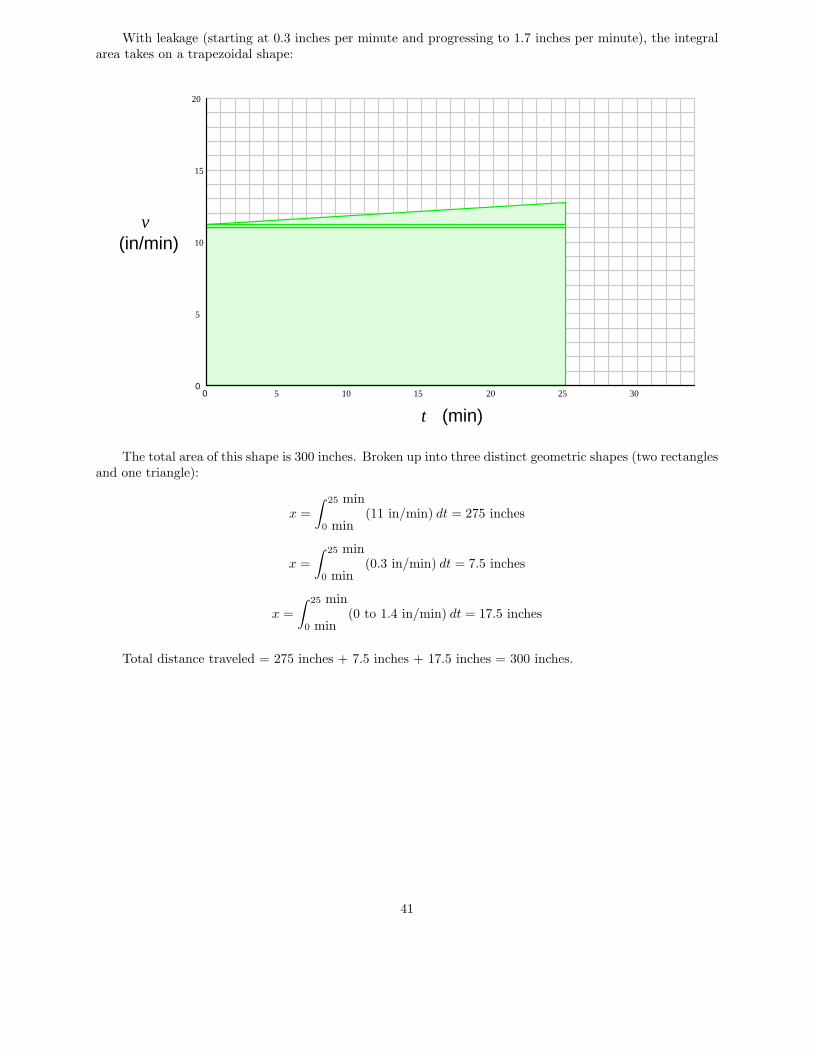
With leakage (starting at 0.3 inches per minute and progressing to 1.7 inches per minute), the integralarea takes on a trapezoidal shape:
5 10 15 20 25 3000
5
10
15
20
v(in/min)
t (min)
The total area of this shape is 300 inches. Broken up into three distinct geometric shapes (two rectanglesand one triangle):
x =
∫ 25 min
0 min(11 in/min) dt = 275 inches
x =
∫ 25 min
0 min(0.3 in/min) dt = 7.5 inches
x =
∫ 25 min
0 min(0 to 1.4 in/min) dt = 17.5 inches
Total distance traveled = 275 inches + 7.5 inches + 17.5 inches = 300 inches.
41
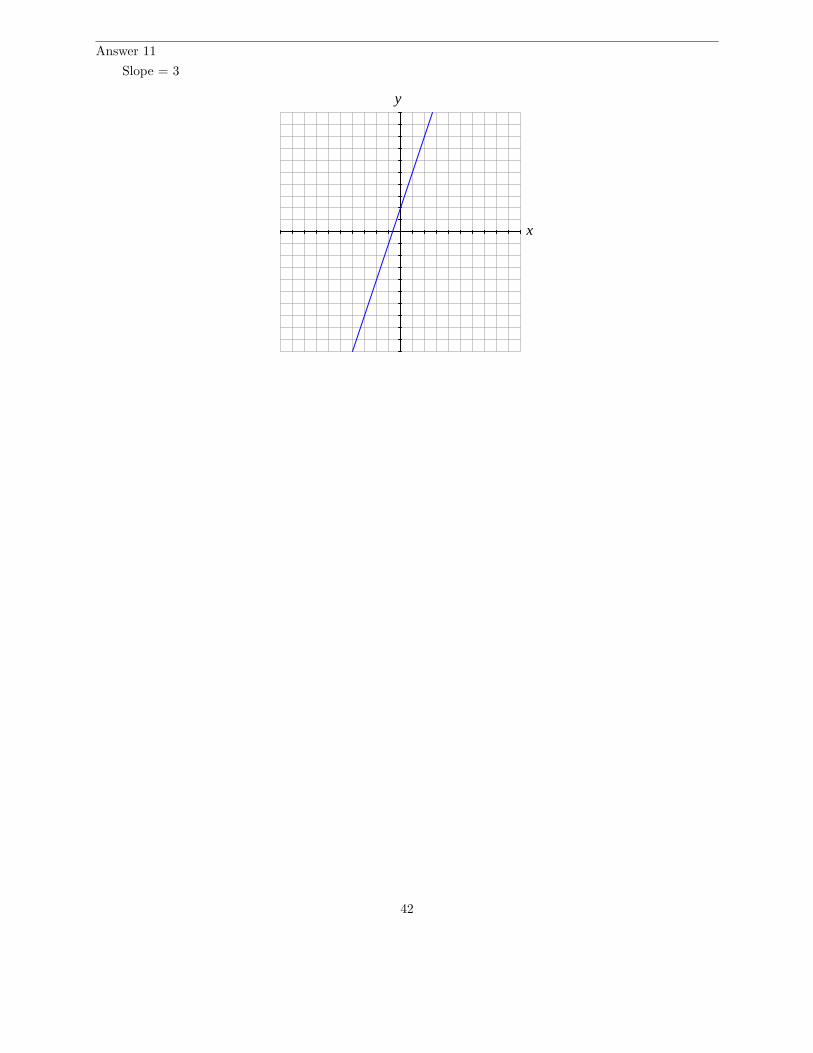
Answer 11
Slope = 3
x
y
42

Answer 12
One way is to draw a line that just grazes the curve of the parabola at the coordinate (2,4) and estimateits slope:
x
y
(2,4)
Answer 13
A secant line intersects a curve at two points, approximating the slope of that curve at some point inbetween the two intersections. A tangent line, on the other hand, intersects a curve at a single point withoutcrossing that curve, the slope of that line equaling the slope of that curve at the exact point of intersection.
43

Answer 14
curvex
y
∆y
dy
∆x dx=
∆y
∆x= Slope of secant line
dy
dx= Slope of tangent line
Due to the classic definition of the derivative as being the limit of the secant line slope as ∆x approacheszero, many people are initially led to believe that dx and dy must necessarily be very small. Not so!Differentials such as dx and dy may assume any non-zero real number value, it’s just that they indicate theslope of the tangent line, not the slope of the curve between intervals. For practical applications of large-valued differentials, consult an introductory calculus book on the subject of linear approximations usingdifferentials.
44

Answer 15
First approximation (points of intersection x = 2 and x = 3) Slope = ∆y
∆x= 5
Second approximation (points of intersection x = 2 and x = 2.5) Slope = ∆y
∆x= 4.5
Third approximation (points of intersection x = 2 and x = 2.1) Slope = ∆y
∆x= 4.1
Fourth approximation (points of intersection x = 2 and x = 2.01) Slope = ∆y
∆x= 4.01
Fine approximation (points of intersection x = 2 and x = 2.00001) Slope = ∆y
∆x= 4.00001
The slope of the secant line approaches 4 (which is the exact slope of the tangent line at x = 2) as wemake ∆x smaller and smaller.
Answer 16
dy
dx
∣
∣
∣
∣
x=3
= 6
dy
dx
∣
∣
∣
∣
x=4
= 8
dy
dx
∣
∣
∣
∣
x=5
= 10
dy
dx= 2x
45
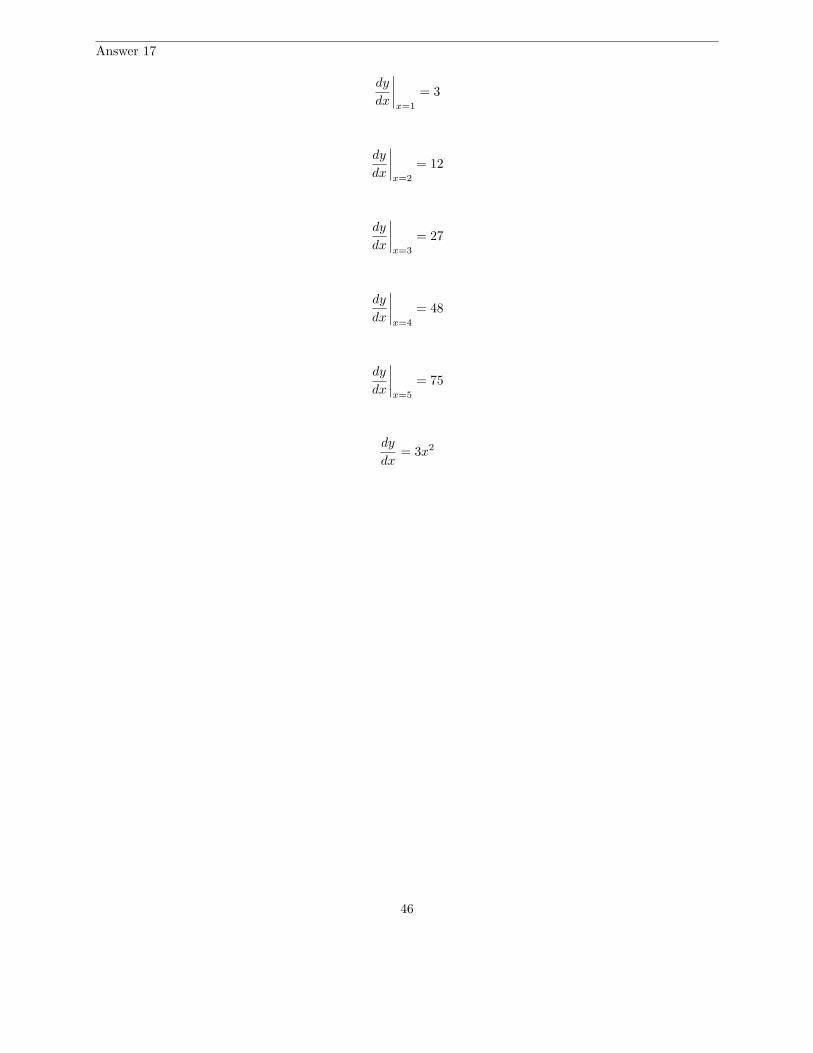
Answer 17
dy
dx
∣
∣
∣
∣
x=1
= 3
dy
dx
∣
∣
∣
∣
x=2
= 12
dy
dx
∣
∣
∣
∣
x=3
= 27
dy
dx
∣
∣
∣
∣
x=4
= 48
dy
dx
∣
∣
∣
∣
x=5
= 75
dy
dx= 3x2
46
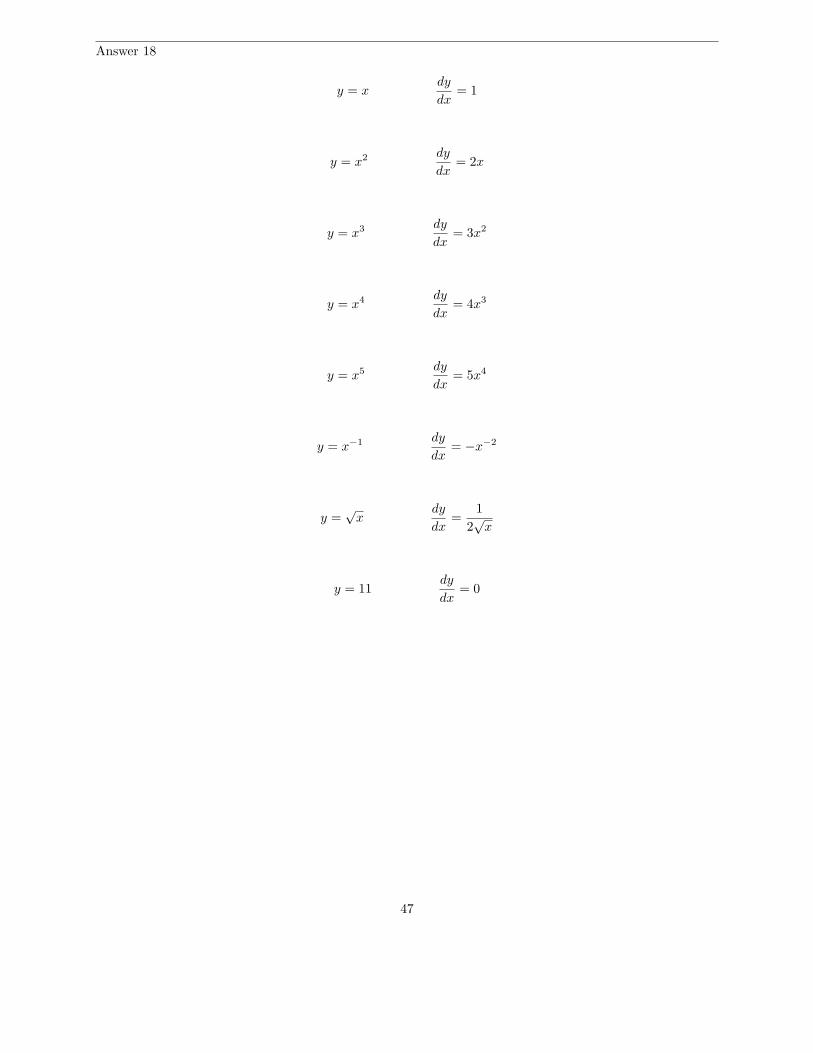
Answer 18
y = xdy
dx= 1
y = x2dy
dx= 2x
y = x3dy
dx= 3x2
y = x4dy
dx= 4x3
y = x5dy
dx= 5x4
y = x−1dy
dx= −x−2
y =√
xdy
dx=
1
2√
x
y = 11dy
dx= 0
47
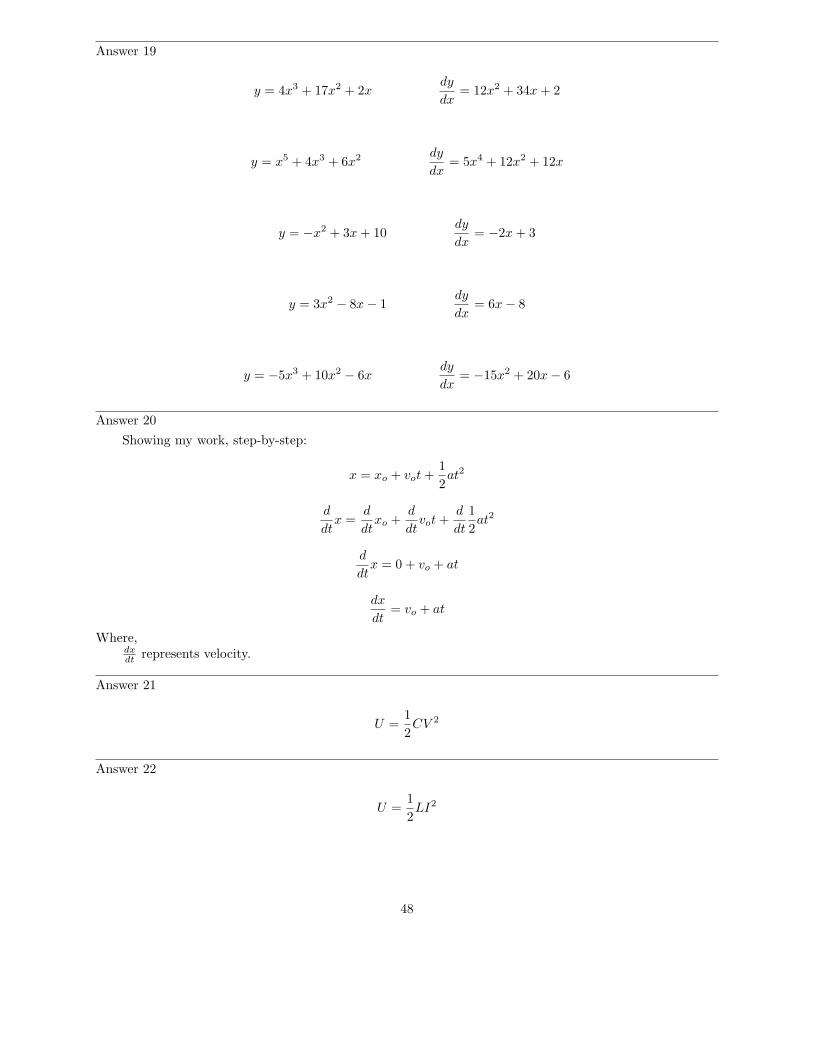
Answer 19
y = 4x3 + 17x2 + 2xdy
dx= 12x2 + 34x + 2
y = x5 + 4x3 + 6x2dy
dx= 5x4 + 12x2 + 12x
y = −x2 + 3x + 10dy
dx= −2x + 3
y = 3x2 − 8x − 1dy
dx= 6x − 8
y = −5x3 + 10x2 − 6xdy
dx= −15x2 + 20x − 6
Answer 20
Showing my work, step-by-step:
x = xo + vot +1
2at2
d
dtx =
d
dtxo +
d
dtvot +
d
dt
1
2at2
d
dtx = 0 + vo + at
dx
dt= vo + at
Where,dxdt
represents velocity.
Answer 21
U =1
2CV 2
Answer 22
U =1
2LI2
48
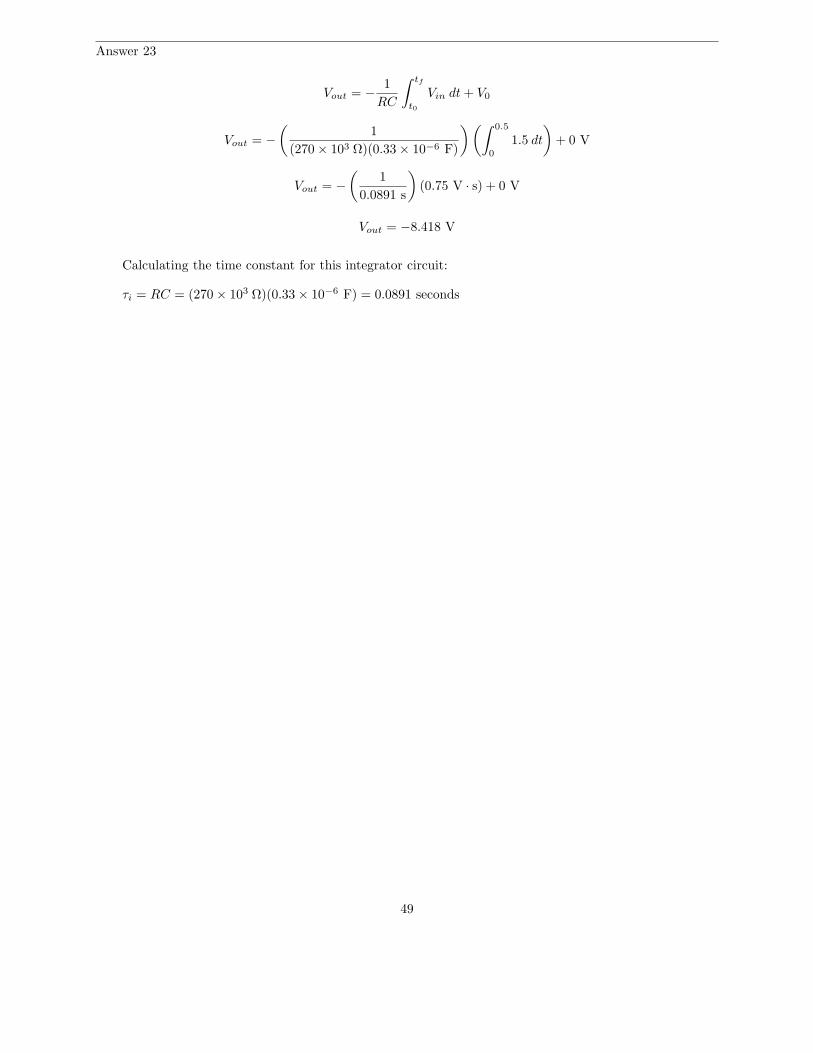
Answer 23
Vout = −1
RC
∫ tf
t0
Vin dt + V0
Vout = −
(
1
(270 × 103 Ω)(0.33 × 10⁻⁶ F)
) (∫ 0.5
0
1.5 dt
)
+ 0 V
Vout = −
(
1
0.0891 s
)
(0.75 V · s) + 0 V
Vout = −8.418 V
Calculating the time constant for this integrator circuit:
τi = RC = (270 × 103 Ω)(0.33 × 10⁻⁶ F) = 0.0891 seconds
49

Answer 24
Vout = −1
RC
∫ tf
t0
Vin dt + V0
Vout = −
(
1
(100 × 103 Ω)(2.2 × 10⁻⁶ F)
)(∫ 2.5
0
Vin dt
)
+ 8 V
At this point we need to evaluate the integral in order to proceed much further. Since Vin is not aconstant, and we have no means to symbolically integrate the input voltage function, we must find the integralvalue graphically. Recalling that the graphical meaning of integration is the geometric area encompassed bythe function, all we need to do is calculate the area of the trapezoid:
Vin
2
1
00
Time (s)1 2 3
(volts)
0.9 V⋅s
1.8 V⋅s
0.45 V⋅s
Total area under the curve =0.9 + 1.8 + 0.45 = 3.15 volt-seconds
Note the units of measurement used to express the integral: volt-seconds, because the vertical dimensionis expressed in units of volts and the horizontal dimension is expressed in units of seconds and integrationinvolves multiplication of units.
Vout = −
(
1
0.22 s
)
(3.15 V · s) + 8 V
Vout = −14.318 V + 8 V
Vout = −6.318 V
Calculating the time constant for this integrator circuit:
τi = RC = (100 × 103 Ω)(2.2 × 10⁻⁶ F) = 0.22 seconds
Answer 25
At 1:30 PM, the level is increasing at a rate (dVdt
) of 5 gallons per hour, which is equivalent to 0.083GPM. At that time the outgoing flow rate (FT-240) registers 35 GPM. Therefore, the incoming flow ratemust be 0.083 GPM greater than FT-240, which is 35.083 GPM.
Qin @ 3:45 PM must be equal to Qout because the level (LT-31) is holding steady. Therefore, Qin =27.5 GPM at 3:45 PM.
What this means is that the incoming flow decreased at the same time as the outgoing flow decreased(both at 2:00 PM). Between Noon and 2:00 PM Qin was 35.083 GPM and Qout was 35 GPM, but then bothflow rates stepped down to 27.5 GPM at 2:00 PM.
50

Answer 26
Here we are asked to calculate a total volume given flow rate (in gallons per minute) and time. Thisinvolves multiplication (so that minutes of time will cancel out the ”minutes” in GPM to yield an answer ingallons), which means the appropriate calculus function is integration. Specifically, we need to integrate theflow rate of FT-240 over the time interval of 1:00 PM to 4:00 PM:
Vdischarged =
∫ 4:00 PM
1:00 PMQFT−240 dt
This integral represents the area beneath the FT-240 flow function between 1:00 PM and 4:00 PM onthe trend graph, represented by the two shaded rectangles below:
FT
FT
LT
105
240
31
V-5
12:00 1:00 2:00 3:00 4:00 5:000
10
20
30
40
50
60
FT-240
LT-31
GPM
Gallons2100gal 3300
gal
The first rectangle is 35 GPM high and 60 minutes wide, yielding an area of 2100 gallons:
(
35 gal
min
)(
60 min
1
)
= 2100 gal
The second rectangle is 27.5 GPM high and 120 minutes wide, yielding an area of 3300 gallons:
(
27.5 gal
min
)(
120 min
1
)
= 3300 gal
Together, the total area of these two rectangles is 5400 gallons, which is the value of our integral, andtherefore the total quantity of liquid discharged from the vessel between 1:00 PM and 4:00 PM.
Vdischarged between 1:00 PM and 4:00 PM = 5400 gallons
51

Answer 27
This question is designed to probe your critical thinking, because there is absolutely no calculus involvedin the answer! Level transmitter LT-31 already measures the amount of liquid stored in the vessel, socalculating volume lost between any two points in time is simply a matter of subtracting those LT-31 valuesat those times:
FT
FT
LT
105
240
31
V-5
12:00 1:00 2:00 3:00 4:00 5:000
10
20
30
40
50
60
FT-240
LT-31
GPM
Gallons 7.5 gallons
Since the vessel holds 17.5 gallons of liquid at 4:30 PM and holds 10 gallons of liquid at 5:30 PM, theamount of liquid lost from the vessel between those times is 7.5 gallons:
Vlost between 4:30 PM and 5:30 PM = 7.5 gallons
52
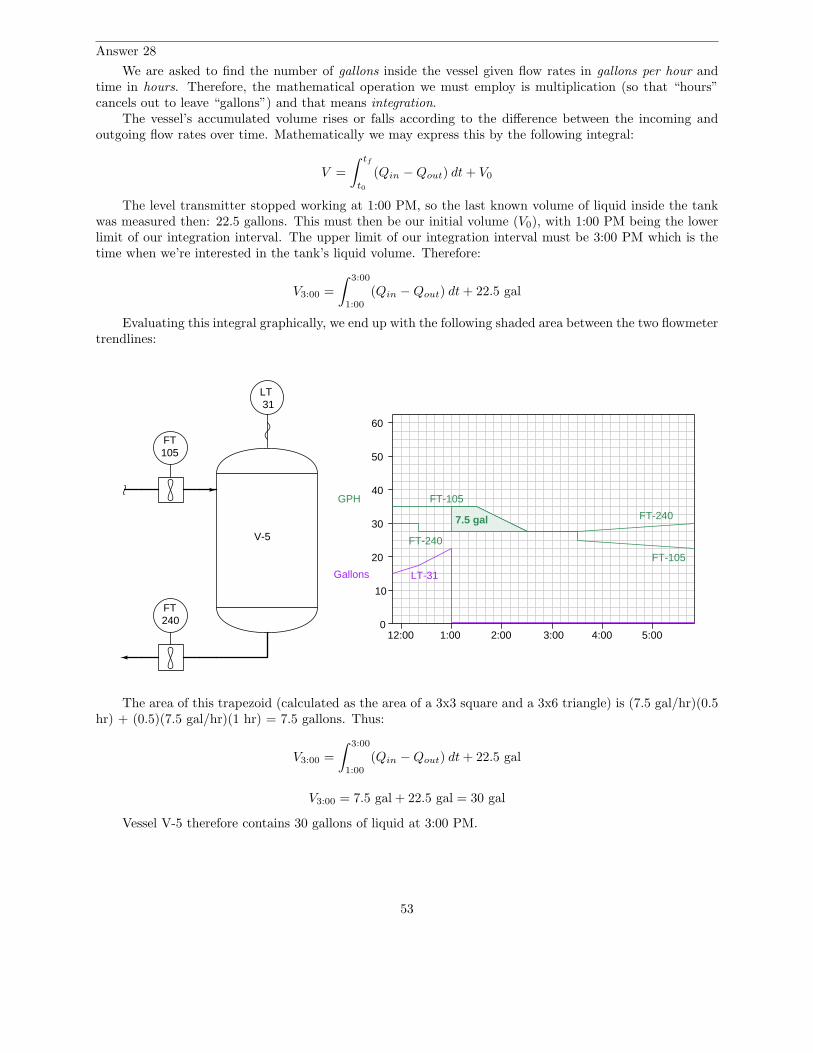
Answer 28
We are asked to find the number of gallons inside the vessel given flow rates in gallons per hour andtime in hours. Therefore, the mathematical operation we must employ is multiplication (so that “hours”cancels out to leave “gallons”) and that means integration.
The vessel’s accumulated volume rises or falls according to the difference between the incoming andoutgoing flow rates over time. Mathematically we may express this by the following integral:
V =
∫ tf
t0
(Qin − Qout) dt + V0
The level transmitter stopped working at 1:00 PM, so the last known volume of liquid inside the tankwas measured then: 22.5 gallons. This must then be our initial volume (V0), with 1:00 PM being the lowerlimit of our integration interval. The upper limit of our integration interval must be 3:00 PM which is thetime when we’re interested in the tank’s liquid volume. Therefore:
V3:00 =
∫ 3:00
1:00
(Qin − Qout) dt + 22.5 gal
Evaluating this integral graphically, we end up with the following shaded area between the two flowmetertrendlines:
FT
FT
LT
105
240
31
V-5
12:00 1:00 2:00 3:00 4:00 5:000
10
20
30
40
50
60
FT-240
LT-31Gallons
GPH FT-105
FT-105
FT-2407.5 gal
The area of this trapezoid (calculated as the area of a 3x3 square and a 3x6 triangle) is (7.5 gal/hr)(0.5hr) + (0.5)(7.5 gal/hr)(1 hr) = 7.5 gallons. Thus:
V3:00 =
∫ 3:00
1:00
(Qin − Qout) dt + 22.5 gal
V3:00 = 7.5 gal + 22.5 gal = 30 gal
Vessel V-5 therefore contains 30 gallons of liquid at 3:00 PM.
53
Top Related