


Languages
Pages
Legal


* 00
*00. 0* C3
00 I*.
00
so t
*c *. 00
C..
00 G. ot
0 ,*0 0
00 0.ý0.. 0
goU

00-M• HARRIS RESEARCH LABORATORIES, INC.
1246 Taylor Street, N.W.Washington 11, D.C.
Report No. 20 A/s" • TF L I
Quarter Ending June 25, 1956
THE EVALUATION OF EXPRIMENTAL FABRICS ASALTERNATES FCR STANDARD WOOL FABRICS
Contract No. DA-19-129-qm-331
Project No. 7-93-18-018DDevelopment of Alternate Fabrics to Conserve Wool
SU101ARY
Mt. Washinpton Feas-bility Test
A small scale field test has been carried out to assess the improvement in
protection against cold that can be expected from using vapor barrier films over
certain parts of the underwear of the standard combat cold weather ensemble. Of
the clothing assemblies tested, those in which either the limbs or the torso of
the underwear was covered by a vapor impermeable film showed prcmise in two
comfort areas. Compared with an assembly in which the barrier covered the body
more completely, they appeared to alleviate heat stress of the active soldier.
They were also effective in providin& additional insulation against chilling
f'/
S. . . .. + ,| I I I I - I I I - I I-IIi--

in comparison with the standard vapor permeable ensemble for men at rest in the
cold. Assemblies in which the membrane covered only the armpits and crotch of
the underwear did not appear to differ in behavior from the standard ensemble.
These field tests were in agreement with previous laboratory findings on a
clothed "sweating" cell in which partial coverage of the underwear with a vapor
barrier produced improved resistance to chilling and a reduction of the over-
heating problem. In addition, the laboratory studies had shown that increased
insulation in the assemblies was due to restriction of sweat moisture to the
underwear layer so that the moisture could not penetrate the insulating layers
immediately over the impermeable film. This type of moisture distribution in
assembly layers was also found in the field, indicating that the same mechanism
was in operation in the real case.
(i/ The field test plan involved sending the subjects around a prescribed walking
course, to provide an exercise level which would result in mcderate sweating,
and then allowing them to sit at rest in the cold. The McGinnis scale method
used for assessing the subjective sensations of the subjects was found to be
most useful in evaluating overheating tendencies of the exercising men. On the
other hand, finger temperature measurements were most successful in appraising
the extent and speed of chilling of the men at rest. As would be expected,
fluctuations in weather and individual differences in physiological response
created some problems in isolating the main effects due to garment types. How-
ever, by using the finger temperature data in terms of a cooling curve "rating"
technique, it was possible to remove most of the interaction effects of weather
and subject. Both the experimental techniques and the data handling methods
used in tthe test appear to have general value for other cold weather field studies
of clothing comfort.I sa -

DETAILS
A FEASIBILITY STUDY OF THE USE OFMOISTURE T•hPERIWABLE MEM3RANES FOR PARTIAL BODY
COVERAGE IN COLD'T1EATHER CLOTHING
A. Itrtoduction
1. Laboratory Basis for the Study
Laboratory work on the insulation of cold weather garment assemblies
(Reports 15 and 16) has indicated that increased thermal protection can be
achieved by inclusion of a moisture vapor impermeable layer and that the effect
is most pronounced when the impermeable layer is placed as close as possible to
the skin side of the assembly. At the same time, adequate ventilatic'n in these
assemblies, placed over a heavily sweating cell, seems possible if some holes or
gape are left in the impermeable layer. Increased insulation in both cases is
apparently due directly to the fact that moisture transfer from the skin surface
is limited and thus the clothing is kept dry.
2. General Nature of the Proposed Field Study
It was proposed that a feasibility study of these princ'.ples in actual
clothing on subjects under cold stress be tried. The test would consist of
modifying the standard cold weather ensemble to include a thin impermeable layer
and these ensembles would be worn in a cold 3utdoor environment. Comfort of the
wearers would be assessed by means of finger temperature measurements and by means
of the recently proposed "McGinnis" scale subjective method. A test cycle would
be devised to provide vigorous exercise, sufficient to induce sweating of the
subjects, followed by rest and hence chilling in the cold. The subjects and
garments would be weighed to dttermine the amount of moisture collected by each
garment item from perspiration during the test.
"2-

UTED E ýD -ýEI
3. Main Purposes of the Study
It has been visualized that such a study could serve several purposes
in a program aimed at obtaining more functional cold weather garment assemblies:
(a) First, a simple practical way in which to evaluate the results
from laboratory tests is needed. Thus, such a feasibility study would become
part of the larger program aimed at providing correlation between field and
laboratory testing and would be particularly valuable because so little informa-
tion is available in the area of clothing insulation and comfort.
(b) Specifically, it is important to determine whether the use of
partial body coverage with a water vapor impermeable membrane does result in a
more comfortable cold weather garment assembly as indicated in the laboratory
experiments.
* (c) Finally, it is valuable to learn how McGinnis scale subjective
rating and finger temperature measurements correlate in assessing "heat stress"
and "chilling" sensations of a clothed subject.
4. The Plan of Operation
A formal plan for such a feasibility study was drawn up. Those concur-
ring in its formation included Messrs. R. Woodbury and J. Vanderbie of the
Operations Programing Office, Mr. T. Dailey who took charge of having the ex-
Vertutual underwear prepared, Dr. McGinnis and Lt. V. Allen of the Human Re-
sources Branch, E.P.D.,who were responsible for subjective testing, Mr. L. Weiner
and Mr. C. Monego of the Textiles Engineering Laboratory and Mr. E. A. Snell who
coordinated arrangements with the Field Evaluation Agency at Fort Lee.
A .tentative test plan was submitted to FEA in October, 1955, and a final
plan in December, 1955. Thence the test became FEA 55103, entitled "Underwear,
-3-

Experimental, Representing Various Amounts of Moisture Impermeable Material," to
be performed in the vicinity of the Agency's Mt. WJashington test site. Accord-
ing to the plan, the FEA would supply 6 test subjects and 3 administrative
assistants plus all clothing except the experimental underwear. Full support
in setting up and equipping the test site was also to be supplied. Finger
temoerature measuring equipment was to be provided by thcee laboratories, while
Sthe experimental underwear data recording &ear would be obtained from the Natick
laboratories. The final test starting date was set for February 13, 1956.
B. Experimental
1. Preparation of the Test Site
After examination of a number of areas near Mt. Washington, an advance
party of six finally selected the Glen flats at the base of the mountain as the
- ' most appropriate test site. A figure eight walking course one mile long was
laid out with the aid of a weasel for packing down the snow. At the cross of
the figure eight a Janesway hut was set up to be used as a clothes changing
shelter as well as to house the scales and recording equipment. With the aid of
the base camp meteorologist, a weather station was set up just outside the
Janesway hut to measure air temperature (thermograph), radiation temperature
(globe thermometer), and wind velocity (ML-8O snerometer). Adjacent to the
weather station a bench was placed on which subjects could sit during the cooling
portion of the experimental run. At the base camp a hut was provided in which
the garments used in each test run could be dried. Test personnel and technical
assistants were housed at the base camp.
2. Cold Meather Garments Used
The expc'lmental underwear consisted of standard upper and lower garments
-4-

to vhich a thin Mylar sheet was sewn coverirg various portions of the body, as
indicated in Table 1. The underwear types with complete coverage, D, and no
coverage, E, were included as controls to aid in determining what range of com-
fort factors might be assessed by the experimintal techniques adopted. Under-
wear of all 5 types was provided for each test subject.
Other cothing in the ensemble consisted of standard items; shirt, trousers,
socks, boots, leather gloves with wool liners, overpAn1s, field jacket without
liner, and a winter field cap. Each man was prouided with two complete sets of
thesi items, one for morning and one for afternoon runs, and they were worn only
during the course of the run, re described in the next section.
3. The Test Procedure
Prior to the test, all subjects were given an orientation sheet (Exhibit
C) A -- Appendix) to ftmiliarize them with the general outline of what they were ex-
pected to do. In response to a questi,)n of how long they would be expected to
sit out in cold (item 3), they were %:old that a fixed time would be chosen for
all men which -'ould be not too se-ere for the man who chilled the most. It was
found necessary to reemphasize the "no smoking" requirement on a number of
occasion3.
At the beginning of each test day the subjects selected the appropriate
underwear and outerwear clc~hing items from the storage racks in the drying hLt
and then they were tre :te' by :r,:tk to the test site shelter. khile the
subjects rested quietly wiclir, the shelter, all clothing items to be worn by each
san were preweighed by techrAcal assistant #1. These weights were recorded on
the test data sheet for each subject (Exhibit B - Appendix) and indeed all record-
Ing operations were continued on the same sheet until the end of that run.
-5-

While this was being carried out, technical assistant #2 took weather readings
outdoors to ascertain a suitable starting time for the first man. The first man
was then weighed nude and, after donning the test garments, proceeded outside
for a ten minute rest period before starting the walking course. Near the end
of this period technical assistant #2 made a reading of the finger temperature
of this first man using a small thermistor element which could be held between
the thumb and index finger. Simultaneously, the first subject was questioned
by the psychologist concerning his feeling of comfort using the McGinnis scale
(Exhibit C - Appendix). The man then set out to walk the course, timing himself
from markers set at 5 minute intervals along the way. This whole procedure was
repeated with each man at five minute intervals until all were out walking the
course. Weather readings were continued at regular intervals.
As each man crossed back near the shelter after completing the first loop,
his comfort was again rated using the McGinnis scale mounted on a large board,
which the test subject could see as he approached. On completion of the course
his subjective sensations were again rated and then he sat on the bench outside
the shelter for the cooling portion of the run. Finger temperatures were taken
approximately every 10 miniutes and further subjective ratings approximately every
20 minutis. At the end of 40 minutes of total cooling, or 50 minutes on the
warmer days, the subjects then proceeded back into the shelter. There they were
weighed with and without c€lothcs and the test garments were reweighed. After
the last man had completed his chilling run, all were transported back to the
base camp and the test clothing hung up to dry. The whole procedure was repeated
in the afternoon.
-6-s

4. The Experimental Design
An attempt was made to randomize the distribution of different underwear
t:ype belwenn subjects on successive test days. The underwear samples were used
ir. such an c-br that each set had at least 46 hours to dry between successive
runs. The final experimental design used is given in Table 2, showing the
distribution of the 5 underwear types among 6 men for 12 runs. The test was
called off on the afternoon of the fifth day because of heavy snow. This re-
sulted in some i±.bAlance of plan not entirely corrected by an additional run
on the mi:ui-g of the seventh day. However, each underwear type was worn at
least 14 times,
C. Re•;,Itc in General
1. Variations in Weather
One of the reasons the lit. Washington test site is valuable for winter
field tesý:lng is based on the constancy of weather conditions, and indeed a
survey of the camp recmrds indicated that weather during the period of this
test was unusually uniform. However, there were some variations from day to
day and also between morning and afternoon runs, and these are indicated by the
weather summary in Table 3. For the purposes of evaluating the effect of the
weather on comfort factors of the test, the test periods were classified as
"cold," "moderate" and "warm." This classification was based on a broad in-
spection of the consummate effects of temperature, sun, and wind for each day.
As will be seen in later examination of the data, the decision to obtain weather
readings right at the site of the test was well Justified.
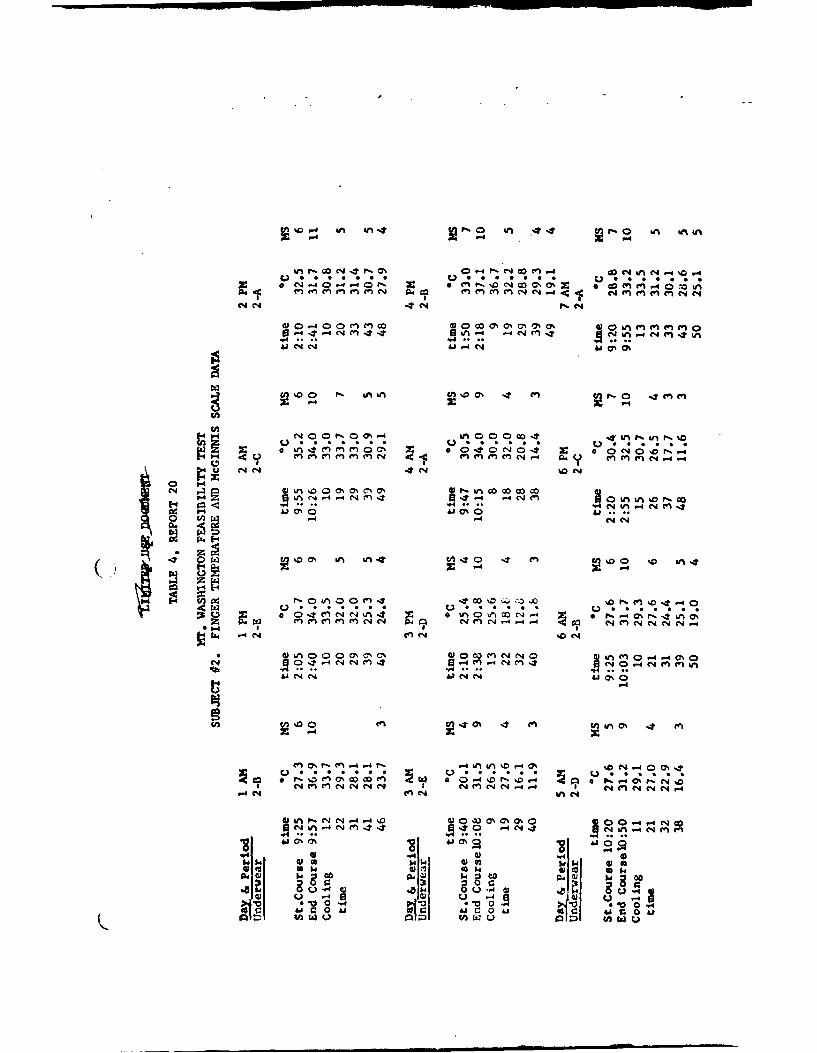
2. Typical Response of a Subject to Exercise and Chilling
As an indication of the type of comfort information that was obtained
S7-
over the course of the tei., the fl-.gr te,: s-re and Mc~innis scale data are
summarized for uj",i- .. t 2 in T.-', 4, Se"ev,. type: o.0 behavior wh.ch occurred
with all of the -ub;ez:s .'zc :nc*.,evrc.'thy, From Ohe be.d.n.'Lnz of the course to
the en.,r C .'- c•r "nL:e u.tce n.id McS.!nnis szale ra!irgs :rie apr,'ciably,
in *,:t.;r'r : r.:.e•¢' zv * reculting f:om sa'kitig :epldiy tnr3•,gh the snow.
S'i,-..' i.':'.y, -•.."- te r' t.-.od, Lha finger tem,;e-et.t,re.4 and M G`neris rat-
ir.Fg3 de.rie., iL- ZCniý in..ta-r.es to quite a Io: level ao-a: 50 WI:•u-es of cool-
ing. 7,T.¾.; -er -. -,7 . e cf bi.a"ior w•a noted for all c-.,jc•:.s on all days ir-
respcctive of ,,- ;z-•rt rsrc-.l&iy -o:..n
A rlose3 e - u-.n'ion of nn-. ci.ui& .-. d fV~p .-.- ure values showed
that there was not a one to o'.: -*,e two systems and that
this was apparent'ly due to tb. .if ;r.v,± in ,e -i:i...y (f the two methods in
-" ~ the warm. a-,d cold rcgions. A).2!g- i, f4 .nger t-imp'-:.'.~zre method was very
sensitive to chilling differe,,::. Or.:,enr. men on cold a.- warm days, the McGinnis
scale rcdi. in the chilliig p-:-_c(. Znd.,J #.o appzcnzh the same values, i.ee,
a rating of 3 c7 4 for most -7l-
On ths or 4ie - .ed, the firgc.r per,- m.ti od 1e-.i~d to rate the warm
sweatina men qvi..e Eln'3y af -,auli be !-:p2ct,'_A as the skin, a, ?roached deep
body tem' erature. In 3.:re int'nc4r(e3 The cvat produced cCu3ed the temperature
sen31r.g resistor to be "tihcr.:ed" sligr.•Ay. This resulted in some apparently
high finger temperature readings, greater than 35*C. as for example in the 4 AM
run of Table 4. On the other hand, the McGinnis scale rating technique appeared
to be at its best in the warm-hot comfort range as is discussed in the next
section.
"-I II -
UK L r Ic II Ii
3. McGinnis Scale Ratingcs a a Mea.sure of Heat Stress
The McGinnir s.:cle vaiue. taken irmcdiately after the men had completed
walking the course were clez&Iiad according to weather (Table 3), and these re-
sults are nhz.n in Table 5. U:ider "cold" conditions all of the assemblies kept
the wearer- co•..•fc' bl' while exe'cising, while under "warm" conditions all men,
exce'. Lhcse ve:.z:ng the ccnt.rol underwear with no vapor barrier, tended to get
fairly ho: aft2• v'alkirg a mile in the snow. The days of "moderate" weather
-tended to gi-ie J.he lbeot differentiation between the assemblies as indicated by
McGinnis scale ratlrgs. Assemblies with underwear sanples C and E showed no
tendency for ovcrh'aiing, while those with A and ", sarples showed only slight
overheating, and the ensemble :on2ain'ng D ,3howed sever3 heat stress. These
assemblies were thus rated £" order of the body coverege by impermeable film,
-the greatest coverage giving -.!ghost heat stress, as shown in earlier laboratory
studies. No appreciable difteren:e between assemblies with underwear types
with limb coverage (A) or torso coverage (B) was noted.
- Some comment should be made on the statistical significance of these figures.
Taking all the data, one can clearly demonstrate the extreme differences between
assembly E - full coverage - and assemble E - no coverage - but in general it is
difficult to sort out the remaining assemblies on this basis other than they are
nearer to behavior of E than D. In general there are too few runs in each
weather category to make a similar analysis worthwhile on this basis, but in-
dications from the average values of the McGinnis ratings and finger temperature
results discussed later give a very consistent picture of the behavior of these
experimental assemblies under real conditions.
Q -9-

4. Moisture Collection in Different Clothing Types
It was possible, in the laboratcry examination of clothing assemblies
in which a vapor impermeable membrane was used, to determine how the flow of
moisture from the sweating skin was altered by the presence of the membrane.
Indeed rentriction of moisture from the insulating layers of these assemblies
was offered as Lhe most likely explanation of the improved insulating value of
this clothing design.
Weight changes in the underwear (1st) and neighboring layer (2nd) of the
cold weather ensembles were obtained during the course of feasibility runs.
This evidence is summarized in Table 6 for all assembly types and under the
three classes of weather encountered. Unfortunately weight changes in the outer-
most layers were ccmnlicate! by 310W on many of the uniforms so this information
was not included.
Moisture collection in the underwear was small in cases C and E, moderate
in A and B and large in type D, again in proportion to the area of the body
covered by the impermeable membrane. For example, with underwear type B in
which only the upper garment was covered with a film, S to 20 times as much
water was caught in this section as in the uncovered lower half of the underwear.
These effects were most pronounced in runs made on "warm' days, indeed very
little sweating occurred in some assemblies on the "cold" days. Thus, clearly,
as in the corresponding laboratory experiments, body moisture was collected
beneath the impermeable membrane in proportion to the area covered.
Moisture transferred to the second layer (end presumably to layers further
out) was therefo-e hindered by the underwear sections having a plastic membrane,
as is clearly Ghown in Table 6. Indeed for the assembly using "completely cover-
ed" underwear D, there was some drying of the outer layers during the course of
- 10 -
the experiment, as shown by the negative moisture values. Greatest moisture
transfer to the second layer occurred in the a3semblies with little or no mem-
brane, C and E respeczively, particularly in runs on "warm' days. Overall
transfer to the 2nd layer of assemblies containing underwear types A and B was,
for the most part, small, an agreement with laboratory findings. The general
level of moisture pickup by the outer layers in the field runs was not as large
as in the laboratory, precumably because the sweating was not nearly so severe,
and tbare• awopportunity to weigh the garments immediately after the exercise
period. These data clearly showed, however, that partial coverage of the body
with a water vapor impermeable film over the underwear layer could lower the
collection of sweat in outer garments. In addition, little tendenzy was shown
for the moisture to transfer from wet (membrane covered) to dry (membrane un-
covered) areas in the same underwear sample.
5. Finger Temperatures of Chilled Subjects
The finger temperature cooling curve of a man under cold stress is not
a simple function and often defies direct analysis in terms of a single represent-
ative temperature reflecting the overall response. However, as has been done in
laboratory work, the lowest temperature reached can be used as a rough indicator
of the insulating power of the garments used.
In Table 7 are summarized the average lowest finger temperature values for
the field runs classified according to underwear type and weather. In general
there was least temperature fall, with the assemblies containing fully membrane
covered underwear D. Greatest temperature drop in runs on "ward' and'taoderate"
days occurred in assemblies C and E. All final finger temperatures were low on
- the cold days, indicating again the rather large effect of weather conditions on
- 11 -

the results obtained. If, for this analysis, we accept the grand average as the
best indication of the relative effectiveness of these assemblies as insulators,
then the partial coverage systems A, B, and C fall between the least insulating
aamrie, E, and highest insulating sample, D. The underwear with either limbs
(A) or torso (D) areas covered by a membrane show slightly greater total chill-
ing than the complete coverage control (D). On the other hand, the sample
covered only at armpits and crotch chilled almost as far as the no membrane con-
trol (E).
Clearly then, from the resistance shown to overheating (Table 5) and from
the maintenance of insulation (Table 7), the cold weather assemblies containing
underwear with extrenities in a membrane cover (A) and torso covered (D) would
both be possible types of improved functional design. The tendency for the pants
'•- / 4 n outer layers of type B (Table Q) to collect moisture might have to be con-
sid~red further if severe sweating or chilling were encountered.
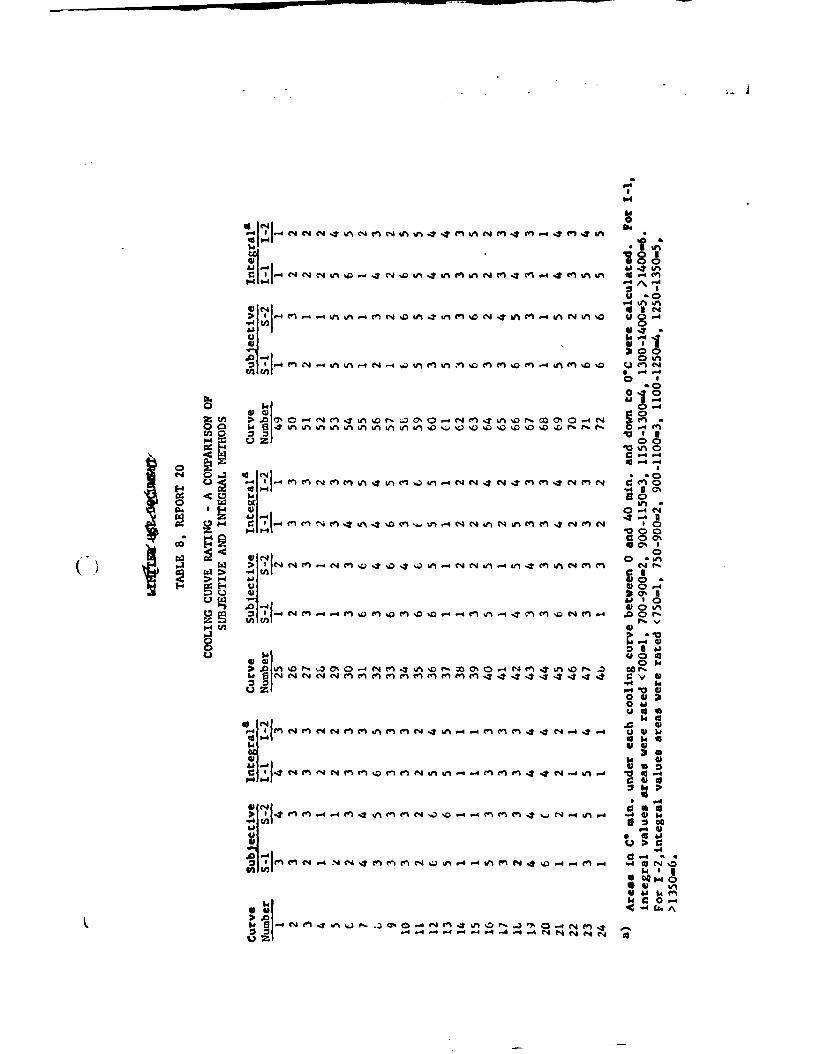
D. Cooling Curve Rating as an Index of Chilling
I. The Rating Method
A number of attempts were made to treat the finger temperature cooling
data in an ana:ytical fashion that would result in a useful chilling index. These
were found to be difficult to handle because of the strong interaction of weather
and subject sensitivity with those differences brought about by the cold weather
assemblies themselves. Concern was also expressed over the fact that the exact
time of fall-off in these finger temperature curves could have been missed in
the 10 minute interval between readings. In addition, short time fluctuations
of skin temperature due to the body heat regulating mechanism could also lead to
a source of error. Reference was then made to earlier chilling experiments in
- 12 -

which temperatures had been used as a cooling index.
In the experiments carried out in the Philadelphia Q.M. Depot Cold Roams
in 1954, finger temperature readings were taken approximately every four minutes,
with results of the type shown in Figure 1. (For a more detailed description
see Report 13, p. 12-15.) in this work, shirts of different types were compared
on lightly clad man 1.,ing at rest in a cold room at 600F. From the rates of
chilling and fiLa. firger temperatures it was estimated that the cold stress
on these men was not greatly different from the men in the Mt. Washington test.
Hence it was possible to draw some general conclusions from the curves of Figure
1 which could apply to the field test finger temperature curves.
These detailed cooling curves indicated first of all that the short time
fluctuations did not seriously depart from the general form of the cooling curve.
Secondly, a set of points chosen with ten minute intervals represented the
general shape of the curves quite accurately. Differences in response between
individual subjects were found to be quite important in interpreting the results.
In addition, these studies showed that the sudden drop off of the cooling curve
was most closely related to the sensation of chilling recorded by the subjects.
Thus a study of these earlier runs suggested that it might be possible to
relate the finger temperature cooling curves of the present test to some sort of
chilling index which would make use of all of the experimental points. Ratings
were chosen from I to 6 and, to confcrm with the McGinnis scale convention, a
low index was chosen to represent an abrupt cooling cycle. Three curves from the
Mt. Washington runs are given in Figure 2 along with assigned ratings shoving
the ranges chosen. A curve with no temperature drop off would be rated 6.
A subjective rating of all the curves was tried in which the suddenness of
o 13 -

cooling, the temperature level of cooling, and the extent of cooling were all
considered. The results for two independent judgments of all the curves are
shown under S-i and S-2 in Table 8. Certainly it appeared that an unambiguous
rating of the curves was possible. As these ratings corresponded most closely
to visual integration of the areas under each curve, the areas were calculated
separately. These areas were then divided into six groups to correspond to
six rating clasces into which all the cooling curves could be placed. The re-
suits for two area-rating divisions are given under I-I and 1-2 in Table 8.
The overall agreement with subjective rating was remarkably good. Thus this
general technique for using all the finger temperature data from the cooling
portion of the feasibility runs appeared to warrant further consideration.
Classification of the rating data in terms of weather, subject, and cold weather
assembly was accordingly attempted.
2. Cooling Curve Rating and Its Relation to Weather
In connection with classification of the finger temperature cooling
curves according to weather, an attempt was made first to devise a single index
which would lump the various weather elements of wind and radiation together.
Quite a number of "exposure indices" have been proposed by various workers,
including the "wind-chill" index of Siple developed from measurements in the
Antarctic. One of the most complete approaches to this problem has been worked
out by Dr. A. C. Burton of the University of Western Ontario Medical School.
In a paper before the Fourth Commonwealth Defense Conference on Clothing and
General Stores in 1953, he presented a discussion on "Assessment of the Thermal
Demand of the Environment". This included charts for calculating the equivalent
still shade temperature from air temperature, cloudiness, and wind velocity
1- 14 -
values. Using 1.is charts and assuming that the resting men in the cooling
portions of the tests had a metabolic activity of about 1 MET, the weather
data from the Mt. Washington test site was reexamined.
From the wind velocity and metabolic activity the "Thermal Wind Decrement",
or adjustment for exposure to wind, was calculated. From the difference between
the temperatures of the globe and air thermometers, a cloudiness value was
estimated for each run period. The cloudiness values and wind velocities were
then used to calculate the "Thermal Radiation Increment", using Burton's scale
for khaki-colored clothes.
A summary of this work in which the raw weather data were normalized by
correcting for differences in wind and radiation i# givcn in Table 9. By com-
paring these figures with the average raw weather data (Table 3), several in-
teresting facts can be observed. In general, the effect of wind on the
equivalent temperature was quite sizable and not in general balanced by the
radiation contribution, except on bright moderately still days, e.g., 4 A.M.
More often the corrections for radiation were about half those for wind and,
being opposite in sign, only partly cancelled the effect of the wind. en cloudy
days the effect of radiation was, as one would expect, small, e.g., 6 P.M. In
general, the values of equivalent still shade temperature over the course of a
run remained quite constant.
The still shade temperatures were listed in order of increasing value in
Table 10. It was interesting to find that the still shade values divided the
runs into three classes corresponding to the "cold", "moderate", and "warm"
divisions of Table 3. The cooling curve ratings for each run (Table 8) were then
added up for each run period and also listed in Table 10. Not only did the
o 15 -

cooling curve rating technique divide the runs according to the same three
weather classifications but placed each, as with the still shade temperature%
almost exactly in order of increasing value. Clenrly, the cooling curve rating
technique could distinguiah the effects of weather on the chilling of the man
with some prezisicn. Thn3 p-:ov'ded, then, a possibla approach for removing the
wra'I; £-.lu-nte from t::e r,=:ult3 where comparisons of the insulation of the
different ccld wanther aasemblies was involved.
3. Chilling S2nsitivity Differences between Subjects
The tendency for some of the test subjects to cool more easily than
others was apparent as the runs progressed, and indeed quite large differences
in response are not uncommon in physiological testing. Accordingly, the cooling
curve ratings were classified according to the cubject and these results are
summarized in Table 11.
The curve ratings have been listed according to the number of curves in each
rating category. Clearly subjects 3 and 5 experienced more curves of low rating
than high, while subject 2 tended to give high rating curves. This was borne
out also in the rating totals given in the last column of the table. Thus, sub-
jects 3 and 5 were mo:e su.sitive to cold while weori.ng an average assembly ou
an average day, while subject 2 tended to be least sensitive of the group studied.
It is interesting to note :hat cubject 6 had very broad distribution of curve
ratings, indicating quite a different type of subje:t sensitivity altogether.
In general it was evident that a single figure rating technique oversimplifies
the problem of comparing peuope's physiological rezponses with one another. In
any case, the subject clazi;fication of ratings is a first approximaticn toward
bringing the responses of each to the same base level for comparison purposes.
o 16 -
4. Average Rating as a Measure of Clothing Insulation
A comparison could also be made of the effectiveness of insulation of
the cold weather assemblies employing the different underwear samples by using
the cooling curve rating technique. Such a comparison has been made in Table
12, using the frequency of distribution of the curve types as in the previous
table. The distribution figures and the total rating values indicate that low
rating curves are most commoa in runs with assemblies of type C and type E. On
the other hand, high rating curves are most prevalent with the assemblies employ-
ing underwear type D. Distribution of curve types for the assemblies with under-
wear A and B are very broad but the total rating values lie between the extremes
of the other types.
An examination of the average rating values for all assemblies in each
C underwear type shows that they fall into the same three groups as were observed
earlier in low finger temperature data (Table 7). The three groups are:
greatest chilling - types C and E
moderate chilling - types A and B
least chilling - type D.
These again correspond inversely to the area of the impermeable membrane used
in covering the underwear. Statistically, the averages for assemblies A and B
have little significance because of the widespread distribution of curve rating
types for each. However, the effects of weather and subject sensitivity are
large effects (cf. Tnbles 10 and 11) nd tend to mask the differences due to
assembly type. It is worthwhile, therefore, to try to remove these extraneous
influences using the curve rating technique so as to define,more clearly, the
garment effects.
- 17

5. Improved Ratings by Adjustment for Weather and Subject
Average cooling curve ratings for each run period were calculated by
dividing the ?um values ir Teble 10 by the number of subjects and these are
listed 4.r. S¶*:n :3, Ž:.--y the average cc&.3n3 curve ratings for each test
subJect •-,' rw.!uir' f:,o u1i total ratin•g 'ire• in Table 11 divided by the
t4,f: . : 6 t,n peri-.c 'cJ thtse to'. e-:n Zven in Thble 13.
lth crisr to nýciULa the effect of weaiihsr and subje:t variations on the
cooling curve rating of a single run, the average values in Table 13 were con-
sidered in reýerence to an average cooling curve rating of 3. For example, if
the weather average on a certain day, say 1 A.M., was 2.6 then 0.4 would have to
be added to the individual curve ratings to correct for the weather effect,
Similarly if the particular subject tended to cool wilh an average rating of 3.2
2 (#I in Table 13), then 0.2 would have to be subtracted frcm the individual cool-
ing curve ratings for that subject to normalize for the difference in subject
response.
The cooling curve ratirgs of all 72 runs were accordingly readjusted in this
manner and then classified again according to garment assembly as shown in Table
14. Corrections for weather and subject definitely narrowed the distribution of
cu-ve classes for each assembly (cf. Table 12), although average ratings were not
greatly changed. Cooling was apparently most sudden with the assemblies having
little or no impermeable membrane over the underwear layer (C and E), while the
slowest cooling was obseived with assembly D, with a membrane over bath upper
and lower underwear garments. The assemblies with underwear B, in which only
the upper underwear garment was covered with a water barrier film, produced only
moderate chilling of the test subjects. This was clearly better behavior than
- 16 -
""U)DtJ

C but not as good as D. The experimental assembly with the arms and the legs
of the underwear covered wi:;h .!e vapor barrier (:ywA) gave a wide variety of
cooling curve types. This .old possibly be due to a change in physiological
response rf the body from h•virg, the arms and legs kept warm or perhaps the
variation -c.s related to whnt.er o: not the subjects held their arms close to
t !i. e&iring the cooling tast. Apparen'1y a few more cooling runs with this
particular sample would have been particularly valuable in distinguishing it
more clearly from the other experimental types used. On the average, however,
the assembly of this type was still in an intermediary range in its overall
chill protection value. Certainly all the methods tried tended to rate the
thermal insulating value of the assemblies in the same order.
E. Conclusions
(-j In summarizing what has been learned from this "feasibility" field test, it
"it important to consider the findings in terms of the original goals outlined
in the introduction. Starting with one of the specific aims, how finger tempera-
ture and subjective McGinnis ratings correlate to give a measure of comfort in
cold weather clothing studies, a number of conclusions can be drawn:
(1) Although the overall response of the methods to heating and chill-
ing is roughly the same, an exact correlation between the two is not possible.
This apparently arises mainly from the fact that the McGinnis scale is sensitive
in the comfortable to hot range where finger temperatures approach a constant
value and the finger temperature method is sensitive in the chilly to cold range
where the cold men do not appear to distinguish different degrees of cold sen-
sation, at least in this test situation.
(2) It appears then that the two methods for comfort evaluation in such
19

clothing studies are complementary in their action and hence both are very
valuable in the overall anelynis. Possible improvements in these techniques
are discussed in the next section.
The second specific aim of these studies was to determine whether the general
result& ef ccld weather garme-nt assessment, found in the laboratory for assemblies
car.t.r.ring an impermeable membrane, would hold for real garments in practical
tasks on subjects. Good agreement has been found in at least three areas:
(1) The use of partial body coverage with a water vapor impermeable
membrane placed on the underwear layer reduces appreciably the tendency for
heat stress on an active body, compared with assemblies with a completely
enveloping impermeable layer.
(2) The same type of partial coverage is apparently successful in re-
ducing the chilling tendency of the wearer at rest in the cold in comparison
with the present permeable multilayer ensemble, as was also predicted in
laboratory trials.
(3) The role played by the membrane in restricting the passage of
perspiration to the outer insulating layers is apparently the same in field
practice as on the laboratory scale.
Finally, the experimental test program has indicated a number of things
about general field testing of cold weather clothing which are worth considering
in future work, e.g.,
(I) A simple "sweat" and "chill" test of this type is feasible with
very little modification in present field practice procedures. The finger temper-
ature measuring and subjective chart techniques are simple and rapid and easily
adapted to the specific needs of this type of field testing. Certainly elimi-
nation of the skin temperature harness provides greater facility in handling
- 20 -

L-rients, test subjects, and test variations.
(2) For the comparison of cold weather ensembles in which the differences
between assemblies are small, a cold room controlled environment test seems
advisable because of the rather large influence of the weather on this type of
testing, The problems of differences in the response of individuals to heat
stress and chill are, of course, not solved by going to cold room studies, but
the chances are much greater that this complex variable can be evaluated under
controlled climatic conditions. The alternative in this testing would be to
use more men and to run the test longer, both expensive changes and more difficult
to administer. However, the techniques used for weather analysis in this report
appear to be sufficiently powerful that data from a large scale test could be
handled adequately.
C\ There is another area which deserves some coumment in discussing the con-
clusions from this feasibility test. The careful planning and successful com-
pletion of this test was a direct result of close and complete cooperation pro-
vided by the personnel of the different agencies and Quartermaster divisions
involved. Continuation of this new material evaluation and clothing design
program will be greatly aided by further tests of this cooperative type.
F. Proposals for Future Work
The specific results of this feasibility test suggest that "partial coverage"
cold weather garment systems employing a water vapor impermeable membrane.should
be looked at in greater detail, both in the field ano in the laboratory. It
would appear that some of these specific systems such as the assembly with torso
coverage (B) or limb coverage (A) should be examined further in controlled cold
-21-

chamber studies on men. In addition, practinal ways should be sought to apply
the vapor barrier principle to pre~ern clothing items, for example in the pre-
paration of a plastic coated unfet-vai gar.m.ent wi.th the proper areas sealed from
moisture.
In the area of general cold w.' -ecite1., ft appears that the finger
temperature method using a the:zi::rcr el'-'n for ar~sesszing chilling could be
used much more effectively and accurately in conjunction with a portable record-
er. A similar element for estimating waeer contant of the clothing layers would
also be valuable. Two such elements a:e being developed by the American Instru-
ment Co. and the Minneapolis Honeywell Regla:or Co. It ic. apparent also that
an improvement in the MGhinis cualective method at the cold end, for example,
by expansion of the scale wjcld be of considerable aid in verifying the gen~wal
results obtained by skin ten.pcature measurements.
- 22 -
\
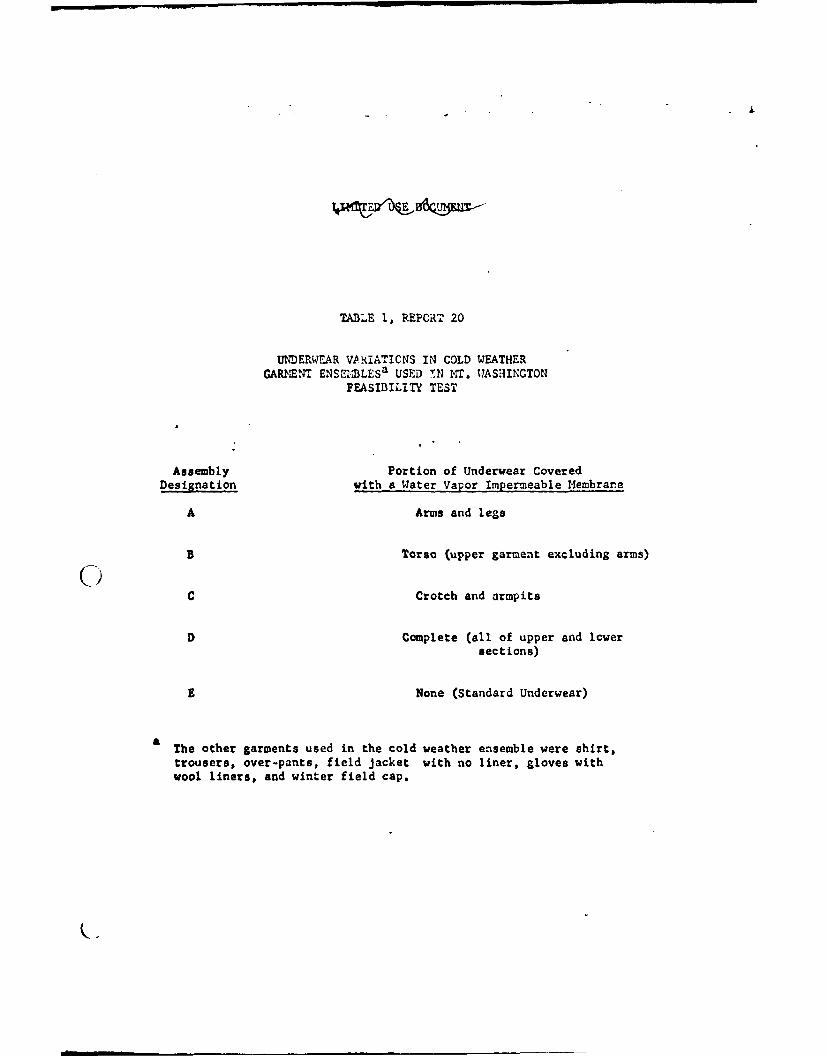
TABLE 1, REPORT 20
UNDERWEAR V RI'ATICNS IN COLD WEATHERGADRENT ENSEI.LESa USED !N mr. WASHINGTON
FEASIBILITY TEST
Assembly Portion of Underwear CoveredDesignation with a Water Vapor Impermeable Membrane
A Arms and legs
B Torso (upper garment excluding arms)0C Crotch and armpits
D Complete (all of upper and lcwer
sections)
E None (Standard Underwear)
a The other garments used in the cold weather ensemble were shirt,
trousers, over-pants, field jacket with no liner, gloves withwool liners, and winter field cap.

TABLE 2, REPORT 20
FIVL EXPERIMENTAL DESIGNMT. WA.SHINGTON FEASIBILITY TEST
Underwear Type Worn by SubjectDate Day Period 1 2 3 4 5 C
2/14/56 1 AM D B E C A APM A E D B C D
2/15/56 2 AM E C B A D BPH B A C D E C
2/16/56 3 AM A E D B C DPM C D A E B E
2/17/56 4 AM B A C D E q C
PM D B E C A A
2/18/56' 5 AM C D A E B E
2/19/56 6 AM D B E C A APH E C B A D B
2/20/56 7 AM B A C D E C
a No rvns were made on the afternoon of the fifth day because ofheavy snow.
C
LIfTA QS "IT
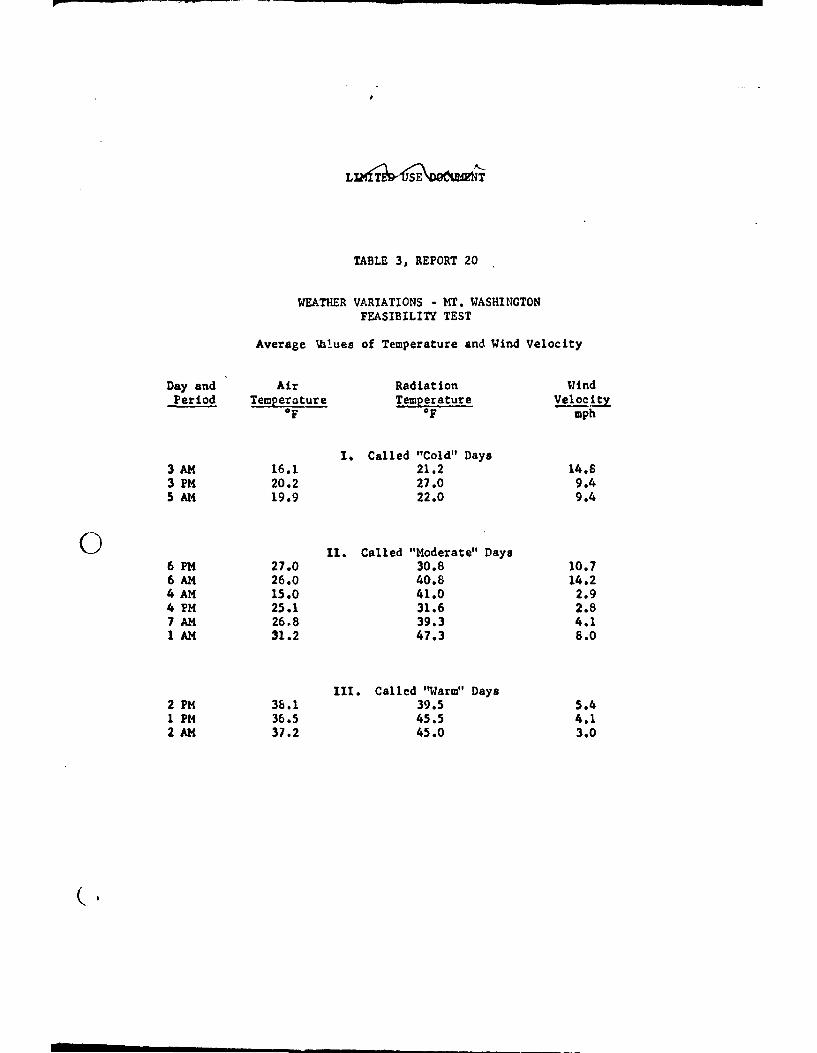
TABLE 3, REPORT 20
WEATHER VARIATIONS - MT. WASHINGTONFEASIBILITY TEST
Average %hlues of Temperature and Wind Velocity
Day and Air Radiation WindPeriod Temperature Temperature VelocAty
OF OF mph
I. Called "Cold" Days3 AM 16.1 21.2 14.83 PM 20.2 27.0 9.45 AM 19.9 22.0 9.4
II. Called "Moderate" Days6 PM 27.0 30.8 10.76 AM 26.0 40.8 14.24 AM 15.0 41.0 2.94 PM 25.1 31.6 2.87 AM 26.8 39.3 4.11 AM 31.2 47.3 8.0
11I. Called "Warm" Days2 PM 36.1 39.5 5.41 PM 36.5 45.5 4.12 AM 37.2 45.0 3.0
km .. Go U~j r- 7% 0 P, Go cn- in
0 C'..4.4 00M O 00C C I N 4 in en en m cOn
C0-4 0 N ~ 1- b %
" " i kc C~%0 % en en44
W! 1 T-C'wr , ý%
.4... '.me4nM nr lMr)MC 4 0 (nI U' en e*4 .4 -40J' y y'
C4 ) n 0 a% % h % -4 inCD oc 0I m n% P I
4(ný 4"e 1: :!4 I 1. 4 " (
.4 Cii * 4U
%0 04~Ch Ln 4U'n 0 It0en gn %0 0 %04O NiO
&Je c3 4l;e4N 'aOC0
z w-4 4C rlý 4-
I* 0 L -. 0 a-, -ON % c m '.M -0
4 . ( O CC C ' Ci0 0-.. r- Q-4 C4 cn eni&A C.4 A4 N 'C1(4 N AJ- CI
*~~- U' in. %o4 -4 a%4 %C N0 *OC%% %-4 00%4'
01 0' %* %
0 V '-4 "a I is V
c 0 0 9 C: 0 4J 4 (la 0

TABLE 5, REPORT 20
McGINNIS SCALE RATINGS IMMEDIATELYAFTER COMPLETING COURSE
McGinnis Ratings for Assemblies with Underweara)Weather Run A B C D E
"Cold" 3 AM 8 7 7 7.8 93 PM 6 9 8 10 4,85AM 8 8 10 9_
Averages 7.3 8.0 8.3 8.5 7.4
"Moderate" 6 PM 11 8.10 10 10 106 AM 10,11 10 10 11 94 AM 9 8 6,8 11 74 PM 8,10 10 8 10 77 AM 10 9 9,9 12I AM 1-0-,11 10 8 11 8
Averages 9.2 9.3 8.5 11.9 8.2
"Wsrm" 2 PM 11 11 9,10 10 91 PM 10 8 12 11,12 92 AM 9 "All 10 11 7
Averages 10.0 10.2 10.2 11.0 8.3
In these underwear samples the impermeable membrane was placed over:A - limbs, B - torso, C - armpits and crotch, D - all areas, E - noneof the areas.

i n. ,
TABLE 6, REPORT 20
MOISTURE DISTRIBUTION IN THE FIRST AND SECOND CLOTHINGLAYERS AT THE COMPLETION OF THE CHILLING EXPERIMENTSa
Underwear in Weather Weather WeatherAssembly "Cold" "Moderate" "Warm"
le shirt eants shirt pants shirt pants
bA lot layer 0.0 1.8 5.7 7.5 6.4 7.5
2nd layer 0.0 -0.1 0.3 0.1 1.4 0.6
B lot layer 6.2 1.6 8.6 0.7 10.7 1.22nd layer 0.1 0.5 0.1 0.5 0.3 0.5
C 1st layer 0.0 0.7 0.9 1.3 1.3 2.4"".•' 2nd layer 0.7 0.4 1.1 0.4 0.8 1.2
D l oet layer 7.8 3.9 16.7 12.0 15.7 14.52nd layer -1.1 -0.8 -0.8 -0.6 -1.9 0.3
( £ lot layer 0.2 0.2 0.5 0.9 1.1 2.2-,-- 2nd layer 0.7 0.4 0.7 0.5 0.7 1.0
a) Average values for all men based on initial weights of individual
clothing items.
b) lot layer - underwear, 2nd Layer - shirt and serge trousers.

TABLE 7, REPORT 20
AVERAGE LOWEST FINGER TEMPERATURE VALUESOBSERVED AT THE END OF THE COOLING PERIOD
Underwear in Weather Weather Weather GrandAssembly "Cold" "Moderate" "Warm" Average
"oc OC eC c
A 12.2 15.2 24.9 17.4
B 8.5 15.2 28.0 17.2
C 8.5 13.6 23.0 15.1
D 15.1 18.4 26.2 19.9
9 11.0 12.9 21.1 11.3
! |
CI-4
Aj4 A -
6INýDLeNM vs.4 M~af
41 C4
uu
o34viuý% nL nL , nQý D% D V fH 04
v z %n 0- N0c C -4
-4i M 00L Dk - * 1 '4 c n C
(.4 0 -4 0 -45
-' >14M m (1 ~4) U ) in 'A &M NN4 N 4M 4n m m C4 M
E-4-
.Z -4 -I m.- 3%-4
01j4
do4 C4 X
a A1 -V
LI H 0o40
a W4
1 M .-4 N . N-4 M4 W% MMC .4 .. 4 MMM ~ .. 4 IA .4 to.
-4I0 0 0
MNJ C%. r4 N(M ~ '% .- 4 -d C4 MNm~l.. 0 . .dO.4 4 ý -4 -4 .4 .-4 V4 C- (4
U

NOT
TABLE 9, REPORT 20
RAn•IT:.:o A'T) E. '41FD CCR ..E , TO UYPOSURECOND;.:I;S - :,r. WASIi:GTCN Fs%;. '.:T TEST
The •--ma! T- e'-77I Eou.velentDay pnd Air Radisto:. 3till ShadeP( ::,d Time T-nn -'r rt ::.re Incre T .t 7. at . "-.. ,a".ur e
I AM 9-23 3.. C 5 "5,31q08 ON " 70i;'.o,0
10-46 3- ":4 ..1!.20 . 4 1 ._'. K0
Average Still , ie,,perature 24-9
1 PM 2:42 36,0 4 1i 29.03:25 3).0 2 11 27,03:55 36,0 2 8 30.0
Average Still Shade Temperature 26.7
2 AM 10:37 37.0 6 8 35,011:07 39.0 4 10 33.011:40 41.0 6 8 39.0
Average Still Shade Temperature 35.7
2 PH 2:15 39.5 1 11 29.53:27 36.0 2 11 27.03:50 36.0 1 11 26.0
Average Still Shade Tcmperature 27.5
3 AM 3:50 12.5 1 14 -0.59:35 15.0 1 14 2.0
10:10 17.0 1 13 5.010:45 20.0 3 13 10.011:05 20.2 3 13 10.2
Average Still Shade Temperature 5.3
3 PM 2:45 21.0 3 12 12.03:15 19.0 1 13 7.03:40 18.0 1 12 7.0
Average Still Shade Temperature 8.6
(Continued)
NOT REPRODUCIPT

ContinuedTABLE 9, REPORT 20
RADIATION AND WIND CORRECTIONS TO EXPOSURECONDITIONS - MT. WASHINGTON FEASIBILITY TEST
Thermal Therinal EquivalentD~y and Radiation Wine" Still ShadePe-iod Ti-'e a.•! " _ Increme,i' De . -m e re
4 AML ~ 351'1 %9 7-5
Average Still Chet '-7tnrature 17.7
4 PM 2:30 25 0 4 10 19.03:18 2530 4 8 21.03:26 25.c 4 8 21.0
Average Still Shade Temperature 20.3
5 AM 10:37 19.5 1 12 6.511:17 20.0 1 12 9.011:45 20.0 1 12 9.0
Average Still Shade Temperature 6.8
6 AM 9:57 26.0 2 13 15.010:25 27.0 3 13 17.011:12 27.0 3 14 16.0
Average Still Shade Temperature 16.0
6 PM 2:00 27.0 1 13 15.03.45 26.0 1 13 14.04:09 27.2 1 13 15.0
Average Still Shade Temperature 14.7
7 AM 9:50 26.0 3 11 18.010:31 27.0 6 10 23.011:00 28.0 9 b 29.0
Average Still Shade Temperature 23.3
T. C1 -

TABLE 10, REPORT 20
CLASSIFICATION OF TEST DAYSACCORDING TO WEATHER USING STILL SHADE
TEMPERATURES AND TOTAL COOLING CURVE RATING VALUES
Class Day and Still Shade Cooling Curvea
of Day Run Temperat.ure Ratings, SumOF
"Cold" 3 A4 5 93 PM 9 95 AM 9 10
"Moderate" 6 PM 15 146 AM 16 154 AM 18 154 PM 20 197 AM 23 18
( lAM 25 22
"Varm" 2 PM 28 30I PM 29 282 AM 36 33
a) Sum of the ratings of all curves obtained on each test day. Actually
values S-I from Table 8 were used in calculating the sums althoughany other cooling curve rating of this table could have bcen uced equallyyell.

TABLE 11 REPORT 20
A COMPARISON OF SUBJECT TYPEUSING COOLING CURVE RATING VALUES
Subject Number of Curves Having Rating Totala)Number 1 2 3 4 5 6 Rating
1 4 0 3 2 1 2 38
2 0 2 3 1 4 2 49
3 4 0 2 0 29
4 2 3 2 1 0 4 42
. 6 1 3 1 0 1 27
6 1 2 5 0 1 3 43
a) Total ratings vere calculated by multiplying the number of ratings in
each rating class by the rating itself end adding these products to-gether, This vas equivalent to adding up all the cooling curve ratingsfor each subject on all days.

TABLE 12, REPORT 20
A COMPARISON OF GARMENT ASSEI2.3LIES CONTAININGDIFFERENT UNDERWEAR TYPES, USING COOLING CURVE RATING VALUES
Underwear Number of Curves Having Rating Total a) Averageb)Type Used 1 2 3 4 5 6 Ratiingg
A 5 1 4 0 2 3 47 3.1
B 6 0 1 1 3 3 47 3.1
c 3 3 5 2 1 1 43 2.8
D 1 1 5 1 1 5 61 4.0
C' E 3 4 5 1 0 0 36 2.5
a) Assemblies with underwear types B, D, and E were worn 14 times and
those with types A and C were worn 15 times. This total is normalizedto 15 vearings.
b) The total rating averaged for 15 wearings.

TABLE 13, REPORT 20
COOLING CURVE RATING ADJUStVENTVALUES FOR WEATHER AND SUBJECT
Day and Averagea) Subject Averageb)
Period Ri: inp, Number Rating
I AM 2.6
1 PM 4.1 1 3.2
2 AM 5.5
2 PM 5.0 2 4.0
3 AM 1.5
3 PM 1.5 3 2.4
4 AM 2.5
4 PM 3.1 4 3.5
5 AM 1.6
6 AM 2.5 5 2.2
6 PM 2.3
7 AM 3.0 6 3.5
a) Sum of the cooling curve ratings from Table 10 divided by the number
of subjectsi.e., six.
b) Total cooling curve rating of Table 11 divided by the numbcr of runs,
Lee., twelve.

A .... |ý r,
TABLE 14, REPORT 21
,A-ENT ASSEMBLY COMI*P .",3'.,' ITF_'v.3COOLING CU). •R RATINGS ADJUSTED F-" 4-' IER AND SUBJECT
Underwear 11v&.1 - of Cu.:ves Having Rrt'" • . ______) _ AverageType Used 1.4 & 1,5-2A4 2.5-3.4 3.5-., 4,j-5.4 5,5 & RatinE
less above
A 2 6 3 2 2 0 2.7
B 1 3 5 5 0 0 3.0
C 1 6 6 2 0 0 2.5C,D 0 0 7 2 3 2 4.0
E 1 7 3 3 0 0 2.4
These ranges were chosen to correspond as closely as possible tothe six ranges of Table 12.

iPPENDIX REPORT 20
SUPPLEMENTARY CHARTS
Exhibit A. Orientation Sheet for Subjects
Exhibit B. Field Da.s Sheets
EExhibit C. McGinnis Scale f or Subjective As~essrnent of Comifort

EXHIBIT A
2 February 1956
FEASIBILITY STUDY OFCO.Z - WEATHER CLO'LhING
Th.3, sl':ay i. vhi'bh you are to take par.7t is to - ?p!or•, w of im-p- r0iig rod.t :e*t-h:: clu.ing." The sweat r-todun.1 by 7ou-_" b )y spick:3 Up. by x,.C L- ifc.:'l s material and hea-t is lost more easjl-,.You will ' e. r w neearr.•-• with materic-l so placed as to reduce theamount of sweat tha;L get.s to your clothing.
The value and success of this study will depend upon your cooperation
and the accuracy of you'- observations.
As a test participant the following will be your job:
1. Upon arriv.n at 1-e2t site, you will be given a set of testgarments. We will weigC, y)u and upon a given signal you will beginthe walking course.
2. You will walk a measured course for approximately 45 minuteswearing a specific uniform.
3. After the exercise period you will be seated and finger tcapera-tures will be taken periodically.
4. Throughout the teest period, questions relative to your experienceof comfort will be asked.
5. Following the rest period the test run will terminate by takingyour weight and the weight of the test garments.
6. Two such runs will be conducted each day.
The success of this test will depend alsn on your cooperation inkeeping your body in a rested and healthy state. We therefore ask youto refrain during this one week of testing from:
a. Use of alcoholic beveragesb. Smoking during the test hours
Furthermore; get a full night's sleep, have a f•od breakfast, and havea good lunch.
! PRODUCIBLE

DATA SHEET EXHIBIT B
j0!T1ZT QMC-HRL DAU. SHEET
FEAS:5BLITY STUDY OFCOLD WFMAIER CLOTHING
(1)
1. Name Date
Code Test Starting Time
2. CLOTHING IDENTIFICkýTION
Underwear Other
3. PRECOURSE DATA
Weights Time
Nude Underwear
ShirtDrawers
l lot layer 2nd layer 3rd layerShirt Jacket liner Jacket shellTrousers Pants liner Pants shell
Socks (pr)
Weight of man clothed
Temperature
Thermistor No. Reading Temperature
4. COURSE DATA
TimeLeaves tent Starts course Finishes
Other Course
Weights
Weight of man clothed Time
QMRD Form OT-3630 Jan 195,,

ContinuedEKHIBIT B
DATA SHEET DATA SHEET
JOINT QMC-HRLFEASIBILITY STUDY OFCOLD WEATHER CLOTHING
(2)
5. POST COURSE DATA
Temperature
Time Thermistor No. Reading Temperature
Weights
Weight of man clothed Time
Underwear Layer lIt Layer 2nd LayerShirt Shirt Jacket LinerDrawers Trousers Pants Liner
3rd LayerJacket ShellPants Shell
Weight of man nude
6. CCM4ENTS
(

EXHIBIT C
McGINITIS SCALE
K AM:
1. SO COLD I AM HELPLESS
2. NUM WITH COLD
3. VERY COLD
4. COLD
5. UNCOMFORTABLY COOL
6. COOL BUT FAIRLY COMFORTABLE
7. COMFORTABLE
8. WARM BUT FAIRLY CONFORTABLE
9. UNCOMFORTABLY WARM
10. HOT
11. VERY HOT
12. ALMOST AS HOT AS I CAN STAND
13. SO HOT I A14 SICK AND NAUSEATED

Figure 1, .encrt 20.
Finger Temperature Coolin• Crvei_,Philarnelphia C.M. Depot Cold Room, June, 1954I I0
30 00 Run No. A11QhT
0
000
20- 02000 0 0 0 0 0
1' 0 0 0 0 0
0 50 100
I I I0 0 0 Run No. A12`5D
?30
0Uo 0
S0 0 020 0 0 0 0 0 0 0
1' I
O 50 100
I '0 - 0 0 0 0 0 Run No. D3lC4J
30- 00 00 0
0 0 00
0 0 00 0 00
20 0
I I0 50 100
Time (minites)

Figure 2, F.eoort 20.
Flnger Temlersture Cco:L; Curves.Mt. :ashln.ton FeasilPAity -est, February, 1956
40 Curve No. 37, Rating 1
20
0
10/ 0 00 20 40
I ~I
40 Curve No. i,, Rating 3
0V
I-
020 20
40 Curve No. 54•, R~ating 5
20
0 20 40
Time (min4Cteo.)
Top Related