


Languages
Pages
Legal

1=E
I -E
"THE COMPOSITE SIGNAL - KEY TO QUALITY FM BROADCASTING"
By
Geoffrey N. Mendenhall, P.E.Manager FM Products
Broadcast Electronics, Inc.Ouincy, IL
BROADCAST ELECTRONICS INC.4100 N 24th ST P 0 BOX 3606 QUINCY. IL 62301 PHONE 217 224-9600
SUMMARY
"The Composite Signal - Key to Quality FM Broad-
casting" is a technical paper oriented toward helping
the station engineer better understand how the trans-
mission system affects the composite signal.
The author explains how new circuitry can help
reduce distortion of the composite signal.
The final portion of this paper describes tech-
niques that the station engineer can use to improve
the performance of the existing equipment.

THE COMPOSITE SIGNAL - KEY TO QUALITY FM BROADCASTING
This discussion of the FM composite baseband deals more
with the practical, operational aspects of an FM transmitting
system rather than an in-depth, theoretical analysis of the
modulation/demodulation process.
The composite signal is the sum of all the individual
components that make up a mulitplex system. FM broadcast-
ing usually includes these individual components, as shown
in Figures 1A, 1B, and 1C:
COMPOSITE BASEBANDSPECTRAL COMPONENTS
1. L + R information at the audio modulating
frequencies (30Hz to 15KHz).
2. The 19KHz pilot tone.
3. L -R information at 38KHz plus and minus the
audio modulatirg frequencies (23KHz to 53KHz).
4. The 67KHz FM modulated SCA subcarrier (53-81KHz).
Figure lA
-2-

TIME DOMAIN SCOPE WAVEFORM OF COMPOSITE BASEBAND CONTAININGSTEREO (ONE CHANNEL ONLY AT 10KHz) PLUS UNMODULATED 67KHz
(OUTPUT TAKEN FROM COMPOSITE TEST JACK ON BEI FX-30 EXCITERDRIVEN BY BEI FS -30 STEREO GENERATOR AND BEI FC-30 SCA GENERATOR)
Figure 1B
FREQUENCY DOMAIN SPECTRUM OF COMPOSITE BASEBAND CONTAININGSTEREO (ONE CHANNEL ONLY AT 10KHz) PLUS UNMODULATED 67KHz SCA
(SPECTRUM AT COMPOSITE TEST JACK ON BEI FX-30 EXCITER DRIVENBY BEI FS -30 STEREO GENERATOR AND BEI FC-30 SCA GENERATOR)
Figure 1C
-3-

Figure 1B shows what the composite baseband looks
like if viewed on an oscilloscope with peak -to -peak ampli-
tude shown as a function of time. It is difficult to identi-
fy the various components as a function of time.
Figure 1C shows the composite baseband as viewed on
a low frequency spectrum analyzer. This is a representation
of amplitude as a function of frequency. It is now easy
to identify the various frequency components within the
baseband.
Non -linearity within the modulation/demodulation process
will alter the composition of the baseband, which results
in distortion of the demodulated signal.
Let's assume that we have a perfect demodulator, and
focus our attention on the transmission portion of
the total system. I will also assume that we have perfect
output signals from our stereo and SCA generators. Now
we are left with three areas for signal degradation to
occur as shown in Figure 2.
AREAS AFFECTING THE COMPOSITE BASEBAND
I. The composite link to the FM modulator (stereo
generator, SCA generator, composite processor,
and STL equipment)
II. The FM modulator
III. The RF path to the demodulator (FM exciter, :PA,
PA, and antenna system)
Figure 2
Each of these three areas has its own special effect on
the baseband signal. I'll discuss each of these in detail.
-4-

I. The Composite Link
The composite path from the stereo and SCA
generators to the FM modulator should be linear
in both amplitude vs. frequency and in phase vs.
frequency response. Simply stated, this means that
no frequency component within the baseband should
be attenuated more than any other frequency component.
Furthermore, all frequency components should propa-
gate thru the system at the same speed (constant
group delay) and thus arrive at the modulator
at the same time. EQ. lA and EQ. 1B mathematically
relate stereo separation to amplitude response.
EQ. 2A and EQ. 2B mathematically relate stereo
separation to phase response.
-5-
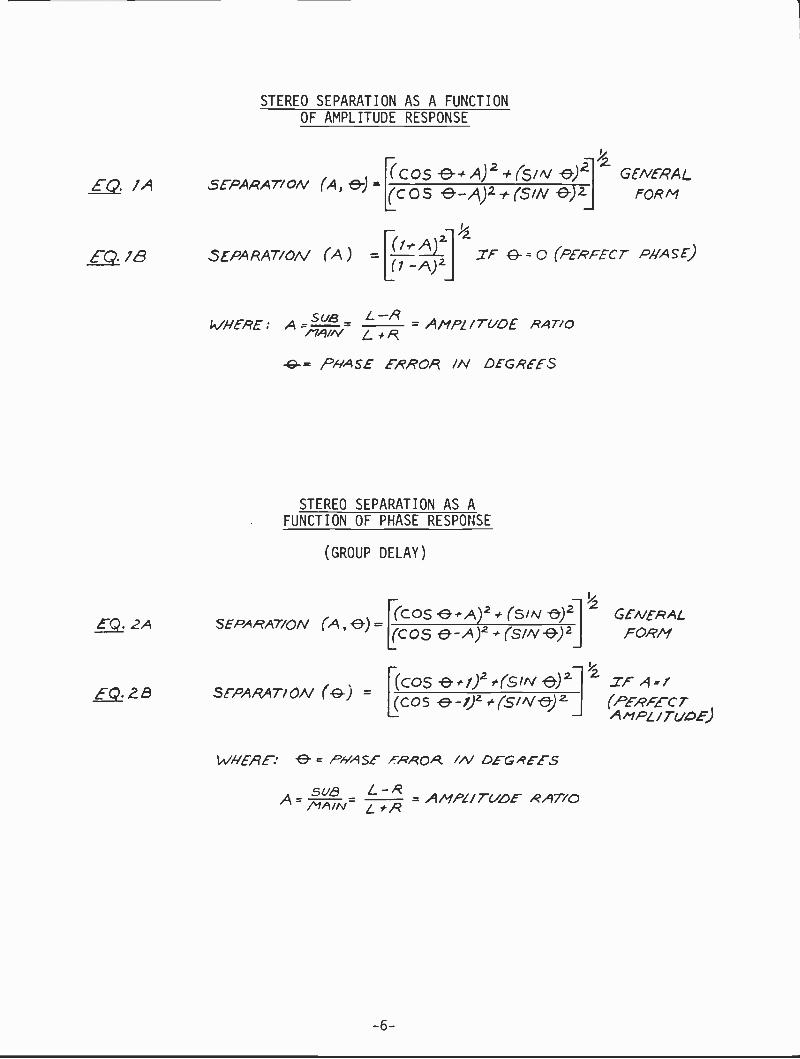
EQ. 1A
EQ. 18
STEREO SEPARATION AS A FUNCTIONOF AMPLITUDE RESPONSE
_I [COS "e" "1)2 4- (5/AI el GENERALfue-)SEPARATION (A, a
(C 0 s (soy e-)2- FORM
SEPARAT/ON (A) ((7-,92 49- c (PERFECT PHASE)
568- AtIRI/TUDE RATIOWHERE: A =1,74/A/
..= fA1ASE ERRO/i /N DEGREES
STEREO SEPARATION AS AFUNCTION OF PHASE RESPONSE
(GROUP DELAY)
EQ. 2A SEPARAT/ON (A, e-)-(cos 6#A)2 # (SIN -11 2
GENERAL(COS e-A)2+(s//v-e)2 FORM
[cos -e,i)2#(stiv e)21' SF A=/E -C, 28 S I -PA RAT I OA/ ($) = (COS e-1)2. (SI AI -69z (PERFECT
AMPLITUDE)
WHERE: -e- = RIM SE ERROR IN DEG/41-Es
5v8 -L R - /IMP 7-44D F R/017-70
-6-
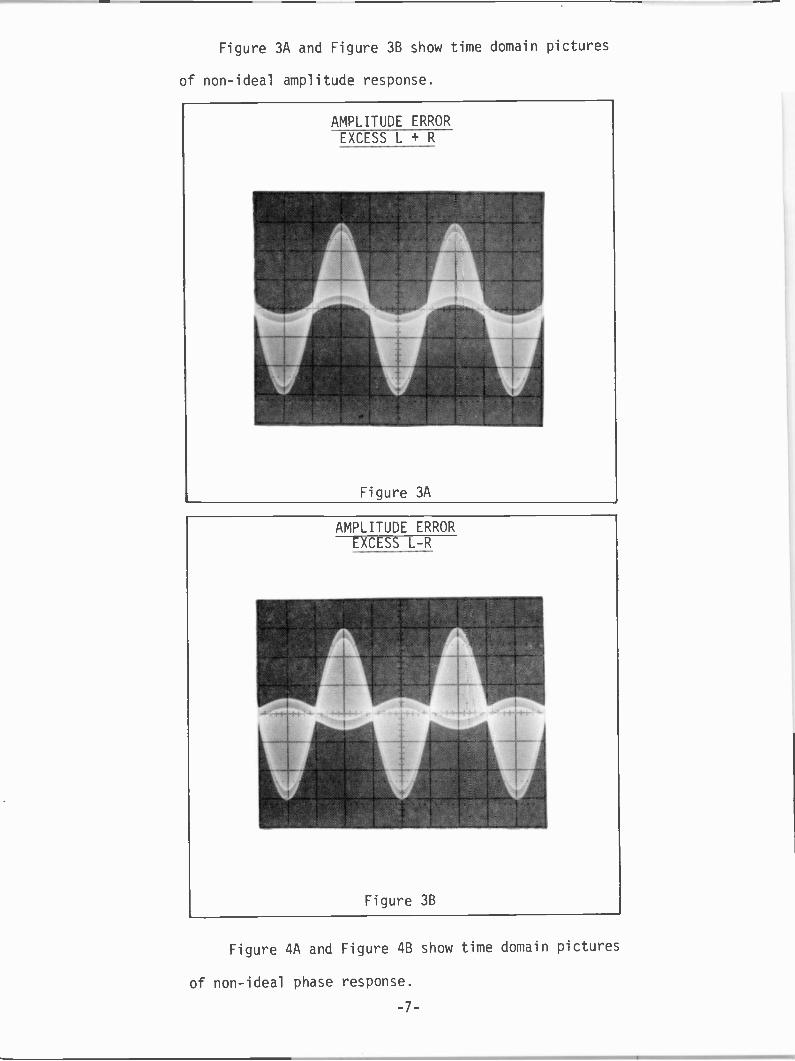
Figure 3A and Figure 36 show time domain pictures
of non -ideal amplitude response.
Figure 4A and Figure 4B show time domain pictures
of non -ideal phase response.
-7-

0
Correct phasing and equal group delay of
the pilot tone is also essential to achieving stereo
separation.
The final stereo performance of the complete
system will be determined by the algebraic summa-
tion of the individual composite amplitude response
and composite phase response of each device within
the composite signal path.
The exciter, STL link, and any other composite
device should specify these composite performance
parameters so that total system Performance can
be easily predicted. In order to maintain a system
separation of greater than 45dB, the composite
amplitude response must be within +/- 0.07dB or less, 30Hz
to 53KHz and the composite phase response must be less than
+/- 0.45° from linear phase 30Hz to 53KHz as calculated
in Figure 5A,

CALCULATED SEPARATION
SEPARAT/OA/ (4, 6) - [Dos e.A)2-# (s/A1(C40.549 --A)2,- (SiNte-)z
WHERE: A = 0.99209 OR /. 00 798 (t 0.06 9 04ANDe 045°S ,19.) = SEPARATION AS A FU/vc7/0A/
OF AND -0-
;2-
(A,,e)-rcos 0.4-5°4-0.99209)z* (Sw 0.45
(coS 0.45°- 0-99.20V1,4 (sin/ o 45°)z
5 (d6) = 20 LoG, 79)= 4. 5 06 dB SEPARATION
Figure 5A
STEREO WAVEFORM WITH CORRECTAMPLITUDE AND PHASE RESPONSE
(OUTPUT OF BEI FS -30 STEREO GENERATOR, WAVEFORM EXPANDED TENTIMES, PILOT EXCLUDED FOR EXAMINATION OF BASELINE FLATNESS)
Figure 5B
-10-

An amplitude and delay equalizer for the
composite baseband is now available as part of
the stereo generator. Equalization for amplitude
and phase deficiencies in the STL or exciter will
improve the overall system performance. An FM
exciter with flat amplitude and phase response
utilizing a balanced composite input will avoid
ground loop problems as well as minimize equali-
zation requirements.
The use of any non-linear devices, such as
clippers or limiters in the composite line will
alter not only the peak amplitude of the baseband,
but also the frequency spectrum of the baseband.
This generates several types of distortion at
the receiver.
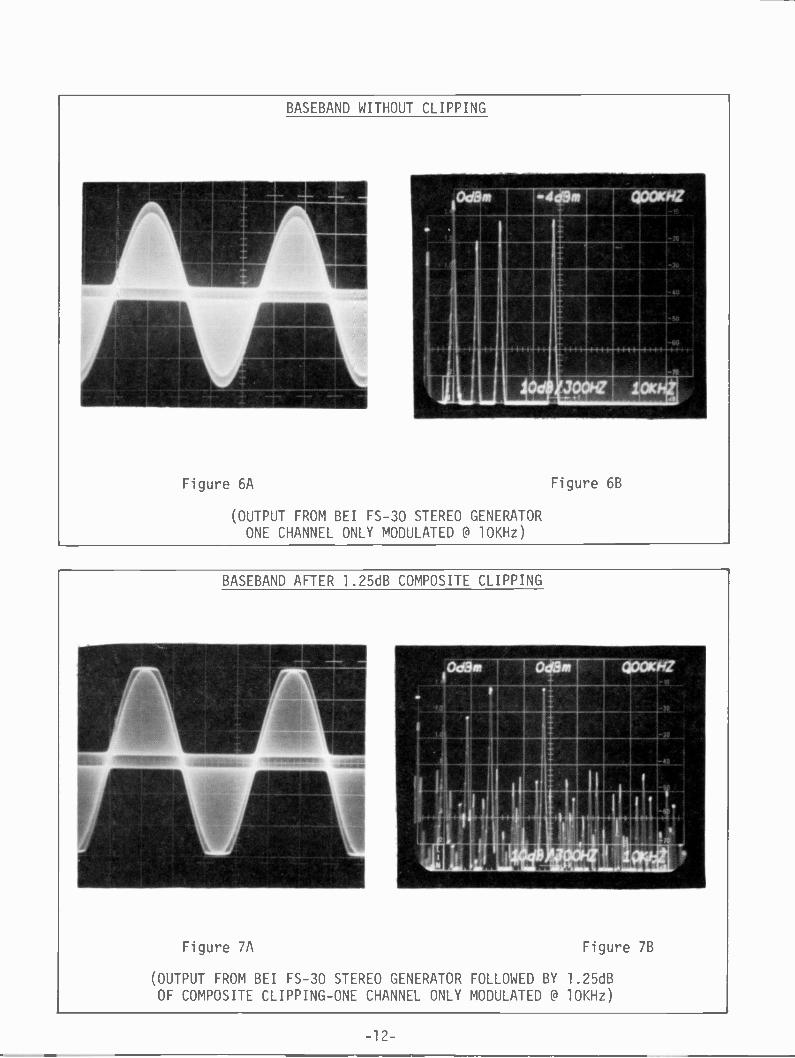
Figure 6A and Figure 6B show the waveform
and spectrum of unprocessed baseband while Figure 7A
and Figure 7B show the same waveform and spectrum
after 1.25d6 of composite clipping. Figure 8
summarizes the types of distortion caused by
composite processing.
-11-
BASEBAND WITHOUT CLIPPING
Figure 6A
(OUTPUT FROM BEI FS -30 STEREO GENERATORONE CHANNEL ONLY MODULATED @ 10KHz)
Figure 6B
BASEBAND AFTER 1.25dB COMPOSITE CLIPPING
Figure 7A Figure 7B
(OUTPUT FROM BEI FS -30 STEREO GENERATOR FOLLOWED BY 1.25dBOF COMPOSITE CLIPPING -ONE CHANNEL ONLY MODULATED @ 10KHz)
-12-

SUMMARY OF TYPES OF DISTORTIONCAUSED BY COMPOSITE PROCESSING
1. Intermodulation of all baseband frequency components
causing extraneous spectral components.
2. Harmonic distortion of baseband causing degradation
of crosstalk and separation.
3. Modulation of pilot injection level causing loss
of lock at the synchronous detector.
Figure 8
The received audio is high in intermodulation
distortion and non -correlated information due to
aliasing of the extraneous spectral components
added by composite processing. For more detailed
information on the effects of composite processing,
see Reference [1] 121.
If minimum system distortion is the goal,
composite processing should not be used. Audio
processing should be performed before the audio is
multiplexed into baseband.
Distortion of the composite baseband signal
can also be caused by transient intermodulation
distortion (TIM) within the amplifier stages.
Transient intermodulation distortion of the
baseband signal is caused by the same mechanisms
that produce TIM in audio signals. The composite
amplifiers must have sufficient feedback bandwidth
-13-

to accept baseband frequencies to 100KHz anc should
slew symmetrically to minimize slew -induced distor-
tion. The TIM performance becomes largely a matter
of operational amplifier selection and circuit
configuration.
II. FM Modulator Linearity
The composite baseband signal is translated
to a frequency modulated carrier frequency by
the modulated oscillator. Frequency modulation is
produced by applying the composite baseband signal
to a voltage tunable RF oscillator. The modulated
oscillator usually operates at the carrier frequency
and is voltage tuned by varactor diodes, operating
in a parallel LC circuit.
To have perfect modulatior linearity, the RF
output frequency must change it direct proportion
to the composite modulating voltage applied to the
varactor diodes. This requirement implies that
the capacitance of the varactor diodes must change
as nearly the square of the modulating voltage as
shown in EQ. 3A, EQ. 3B, and EQ. 3C.
Eq, 3A rc oc L4, (G)e-S.,,469 Li/YE-AR VOLTAGE- 70 /cRE xle7vCTRAA 5 LATic AO
Q 3 B Fc -2 ir l/TET
Q. 3C Cv cc (IF CA -/D > 0)(Vm)z
WHERE _Z //STA N Tz4NE" 0 c. / 5 CARRIER ERE°i/e7vCy= BAS 4N.,0 /70.0L/LATilV6 VOL TA G
= _TN,De./CTANC E OF RESONANTc/Rc(// TCT TOTAL IPA C/ TA A/C E ACRoSS L
(C. )((c) # C vARACToRs)Cv = C OF VARA CTOR TLiAN/va D/0 DE5
-14-
Unfortunately, the voltage versus capacitance
characteristic of practical varactor diodes is not
the desired square law relationship. All varactor-
tuned oscillators have an inherently non-linear
modulating characteristic. This non -linearity
is very predictable and repeatab-e for a given circuit
configuration, making correction by complementary
predistortion of the modulating signal feasible [31.
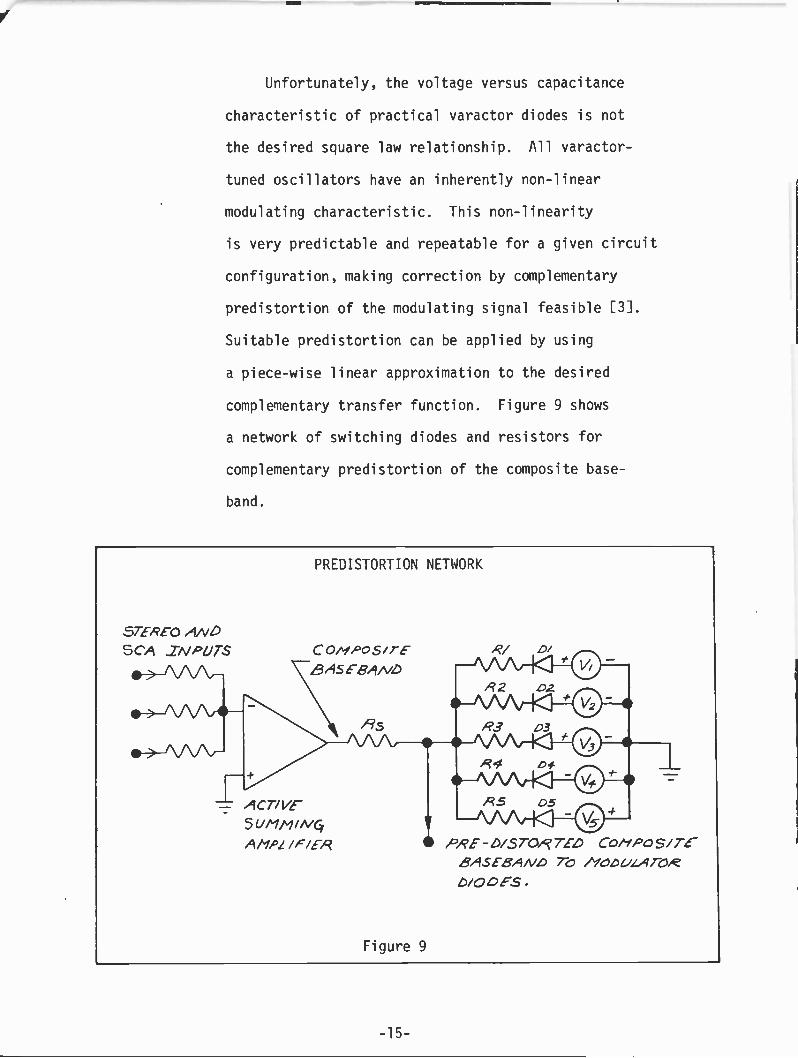
Suitable predistortion can be applied by using
a piece -wise linear approximation to the desired
complementary transfer function. Figure 9 shows
a network of switching diodes and resistors for
complementary predistortion of the composite base -
band.
PREDISTORTION NETWORK
STEREO ANDSCA INPUTS COriPosirE->-f\AA,- BASES/WO
->
i\A.Ay---
-- ACTIVE5uMmtiv4AMP? /E/ER
Figure 9
z2)/
0,2
/q3 03
O
mot0R4 Di -
/5 .05
0
PRE - 7-0/i' TED Cofr,Po S/ 7E -BAS BAND TO /vo.ncizAIrcleDia ES
-15-

Figure 10 shows how the predistortion retwork
is cascaded with a non-linear voltage -tuned oscillator
to produce a linearized FM modulator
LINEARIZED FM MODULATOR BLOCK DIAGRAM
5 TERI 0
AND SCA1NPVTS PRE- D/SToRTzont VOLTAGE
/V GA/E TWDRICAcff'Z f TUNED FM
OSCILLATCli/4":
Oc/TPtir
COPipos/rrBASER/IND \- PRE -D/S70R7ED
comeosiTE BASE -BAND
Figure 10
Modulator linearization has reduced harmonic
and intermodulation distortion to less than .05%
in newly -developed equipment.
Any distortion of the baseband signal caused
by the modulated oscillator will have secondary
effects on stereo and SCA crosstalk, which are
quite noticable at the receiver in spite of the
rather small amounts of distortion to the base -
band. For example, if the harmonic distortion
to the baseband is increased from .05% to 1.0%,
as much as 26dB additional crosstalk into the
SCA can be expected.
For illustrative purposes, Figure T1A, 11B,
and 11C give representations of the fundamental and
second order terms in the composite baseband spectrum
with increasing amounts of harmonic distortion in the
modulated oscillator.
-16-

_TOEAL DE/10.01/L4TEIO CoAfPos/ re BASES4A/D 5"/YC7,4'.NY h//77/ NO/00%=- OcK8-
-60/8 (LiR)naDUL 4 roR Disr.0,2r/ON
///i
F/ //..e
F/G. //C.
-/c3 -
-20-
-30
-40
O -50-i' -60-
-70 -
-80
(0D7L.73r)
- /2d8 (L -R)
-20dB - -/09.; //V-TECT/0/1/
I I5 /5 /9 23 33 38 4,3 53 76
PRE-QC/EA/CY Wiz)R ONLY MODULATED /00°9g 5-04. Onoiati/2472-4 5C4 /60% /A/JEcnoN
DEMODULATED COMPOS/TE e4SEe3.4A40 SPFCrewy In.// TA/ 0. O5 A/A 4WD/WC/00% = oc/8_ 0/570,q7/0A/ /A/ /%101)tiZAT&Z.
-6d8 <L +R)
-/0 -
-30 -
-40 -
,Q1 -50 -
- 60 -
-70 -
-80
Cercor)-
-72d8
I
-/ 2 ./49 -
-761dB -78de
-20dB
-78c'
0 5 10 /5 /9 23 33 38 1.3 53FRE 0 11 ENC y (KHz)
R 0A/Ly IsioDut4Tep /00 % ski/z. LIN,40DziLATED SCA di) /047c1 //V-TECT/.0A/._.7-A.rrEAFE.c/evq- SEcoN0 //.1.4/4onfiC srEkio 5/0684.v.O.,5_ "We Q'8 Reza k/ 5c4.on/LK oivodifoflenir14 AND SECOND 1.-/4R/44DNIC TERMS ARE" 51/dowN.
/0(14 /N.TECTion/
4667
- 78d8
76 8G
/00% 018- DE-A,01)1/L.47-ED ColiPoS/ re- BASE6A/VD -SPEC7RLI/11 kliTH A 0% IMAY-feiv/C_-600 tR) b/57-oRr/o,V //i/ /400frz 4 raiz
-/0 -
-20
(2--R)-1 (P/40r)
0 -30
v
O -go -
-70-
-80 -
-1'6d8
-52 da
-60 de
-0 S8
-52c0 I I I -52d8
0 5 / /9 23 33 3,9 43 53 '6 47
/0% /N-rec7zon/
0.4? R cwzy AioptizAire-z) /Coold 5Alk . e/NAlooe/LATED -ce..4 /04:. /NrEcT/O, k_T/vre-.veRwv0 st-ccvw, IlivotioN/C STEREO sADERANzS ARE 12°45 BELOW SCAONLY fONDAMENIAL AND SECOND 1-/A4/44,6N/c. TERMS ARE S//d141/V.
-17-
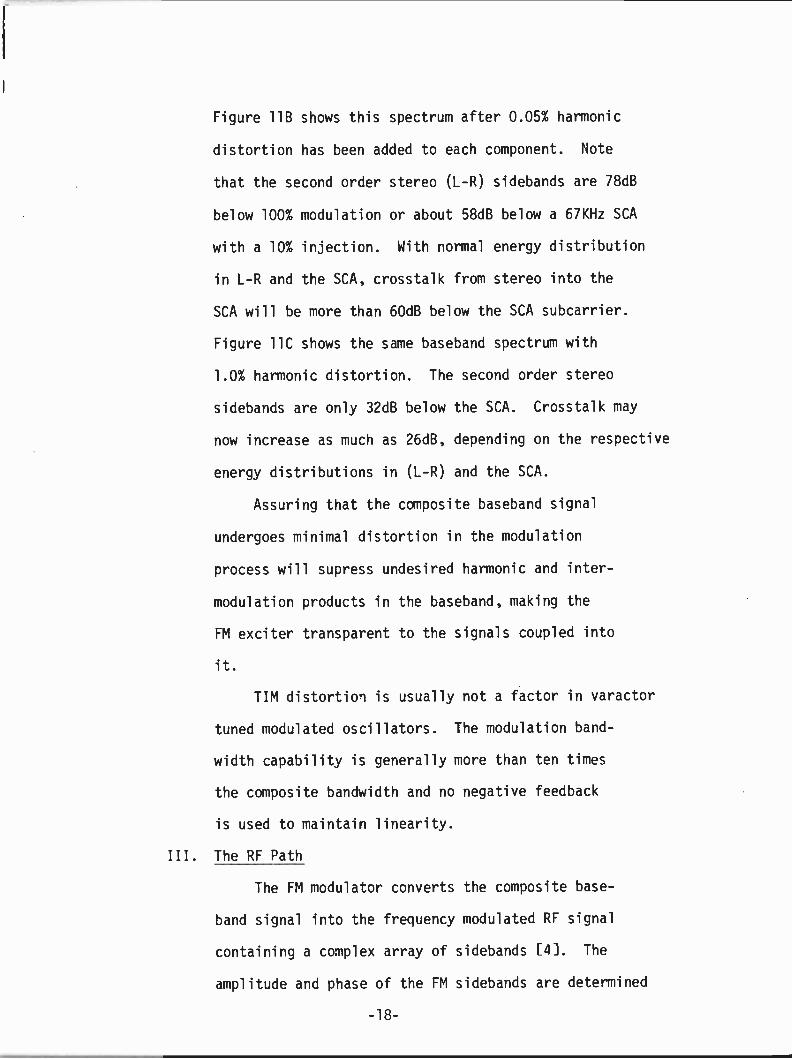
Figure 11B shows this spectrum after 0.05% harmonic
distortion has been added to each component. Note
that the second order stereo (L -R) sidebands are 78dB
below 100% modulation or about 58dB below a 67KHz SCA
with a 10% injecticn. With normal energy distribution
in L -R and the SCA, crosstalk from stereo into the
SCA will be more than 60dB below the SCA subcarrier.
Figure 11C shows the same baseband spectrum with
1.0% harmonic distortion. The second o''der stereo
sidebands are only 32dB below the SCA. Crosstalk may
now increase as much as 26dB, depending on the respective
energy distributions in (L -R) and the S:A.
Assuring that the composite baseband signal
undergoes minimal distortion in the modulation
process will supress undesired harmonic and inter -
modulation products in the baseband, making the
FM exciter transparent to the signals coupled into
it.
TIM distortion is usually not a factor in varactor
tuned modulated oscillators. The modulation band-
width capability is generally more thar ten times
the composite bardwidth and no negative feedback
is used to maintain linearity.
III. The RF Path
The FM modulator converts the composite base -
band signal into the frequency modulated RF signal
containing a complex array of sidebands 14]. The
amplitude and phase of the FM sidebands are determined
-18-
EQ
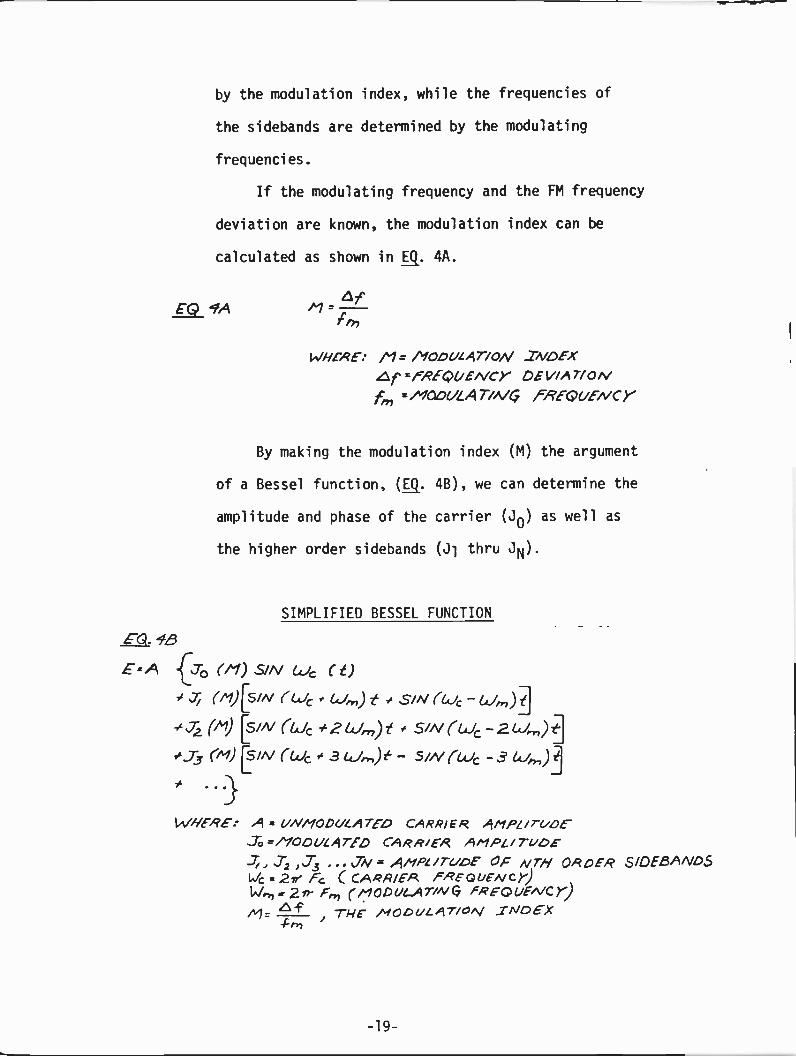
by the modulation index, while the frequencies of
the sidebands are determined by the modulating
frequencies.
If the modulating frequency and the FM frequency
deviation are known, the modulation index can be
calculated as shown in EQ. 4A.
of-
WHORE: /-1 = /slope/LAT/0N _INDEX.6,pc,REVIEA/CY DEV/ArIoNfm x/%10,01/LAT/A/6 FREQUENCY
By making the modulation index (M) the argument
of a Bessel function, (EQ. 4B), we can determine the
amplitude and phase of the carrier (J0) as well as
the higher order sidebands (J1 thru JN).
SIMPLIFIED BESSEL FUNCTION
k7.921i,e9
E=A j To (m)S/A/ L-' (i)
OvV[sw (6_4 # 6.J,) z, ,.57A/(44 -c4.4,)]
(Al) [SW(u # tc.4,7)f 0 SW (6./c- 2CAJerdd
0.73 (,4) p7A, ruk f 3 4/4f - 5//V (Lac -3 A47-,)1
WHERE: A = 1/N/TODUZATED CARRIER AMPLirc/DETo =/%70.01/LATED CARR/EA AmpL/Tv.oh--7; , T1 ,g3 LTN = ,11-1Pz/re.hor OF NrN ORDER SIDEBANDS1,./c 277' fc ( CARR/ER FREQUENCY)WPn 2. re ic,1 n op U1_4 T/NCB FRED L/EA/C Y)
0'f f THE "40.0uL.9710A/ "Nogx
-19-
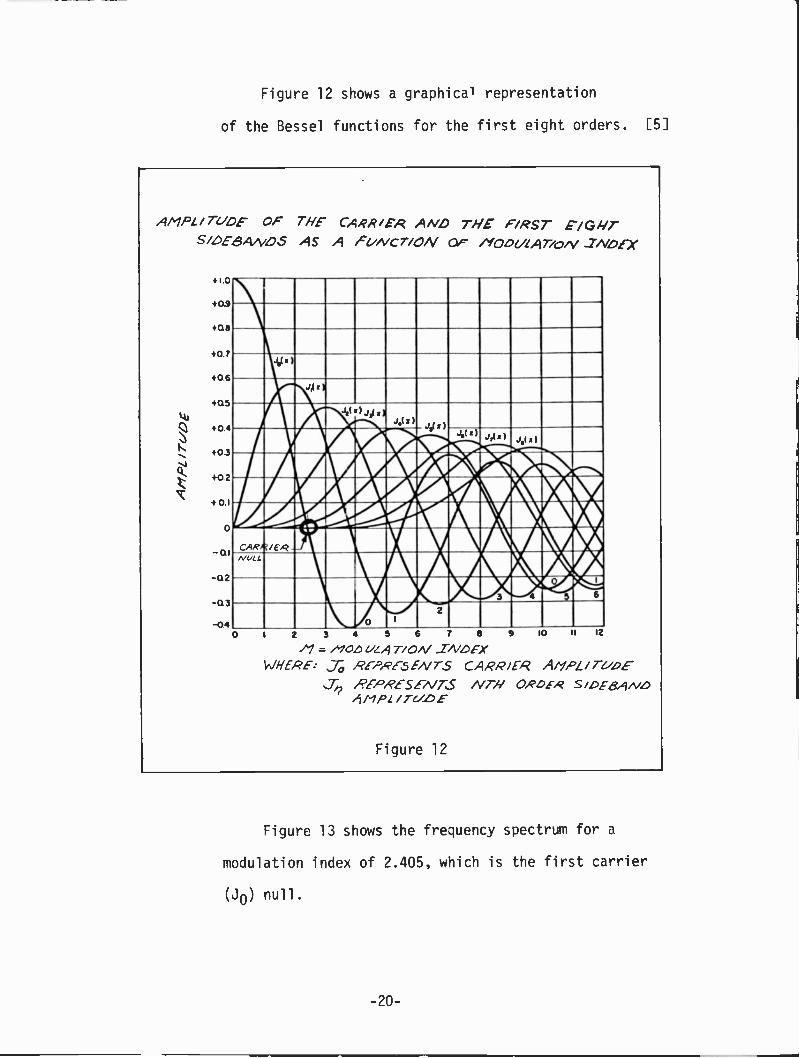
Figure 12 shows a graphical representation
of the Bessel functions for the first eight orders. [5]
AMPL TI/OF OF THE CARR /ER AND THE FIRST E GAITS 40E6AA40.5 AS A /"VA/c7/ON Q. /Y0,04/1Arion, -7A/PEX
+1.0
+0.9
+0.8
+0.7
+0.6
+0.5
+0.4
+0.3
(1.4 +0.2
+0.1
0
Q1
-Q2
0.3
-0.4
e, cs,i4ss,A;,3 4 6
CAR /EARNVC
02
0 2 3 4 5 6 T 6 9
= /VOL) z/ z4 770/V -INDEXWHERE: ,..75 REPRESENTS CARR /ER AMPL/ TUDE
J Re -PRE S EA/ TS NT/I ORDER S / DE -8,1A40/TUBEftIMP[
Figure 12
10 11 12
Figure 13 shows the frequency spectrum for a
modulation index of 2.405, which is the first carrier
(J0) null.
-20-

FM RF SPECTRUM SHOWING OCCUPIED BANDWIDTHAND BESSEL NULL SINGLE TONE @ +/- 75KHz DEVIATION
10d8* 0100 MHZ 3 Trig ea
(FOR M=2.405, Fm=31,185Hz, Fc=100.00MHz)
Figure 13
After examining the Bessel function and the
resulting spectra, it becomes clear that the occupied
bandwidth of an FM signal is far greater than the
amount of deviation from the carrier frequency. The
occupied bandwidth is actually irfinite if all the side-
bands are taken into account. It is also interesting
to note that at certain modulation indices, the carrier
amplitude goes to zero with all the transmitted power
distributed at frequencies other than the carrier frequency.
This carrier null phenomenon is useful as an extremely
-21-

accurate method for the calibration of modulation moni-
tors. (See carrier null in Figure 13.)
We have established that the FM spectrum occupies
a bandwidth far greater than the deviation width that
one might incorrectly assume is the bandwidth.
Practical considerations in the transmitter RF
circuitry make it necessary to restrict the RF band
width to less than infinity. As a result, the higher
order sidebands will be altered in amp-itude and phase.
Bandwidth limitation will add to the distortion in
any FM system.
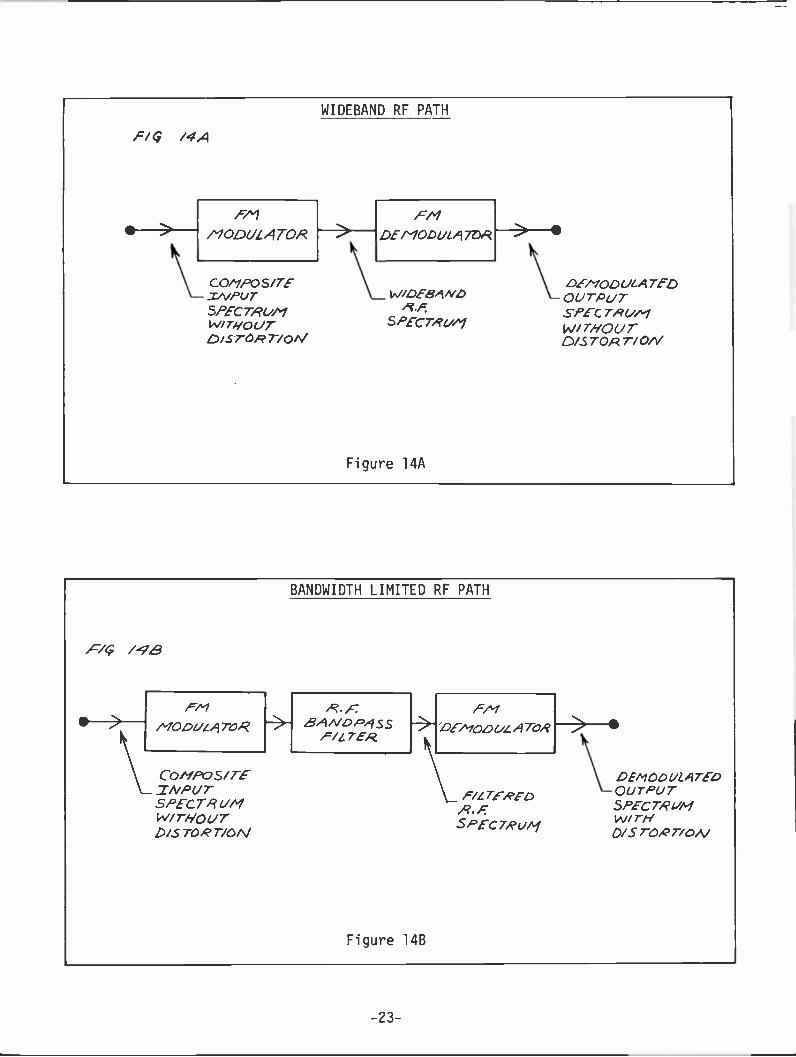
Consider the model shown in Figure 14A, where
a perfect FM modulator is connected to a perfect
demodulator via an RF path of infinite bandwidth.
The demodulated audio contains no distortion com-
ponents.
fi/q /4A
qb-->--. F/v1
/MODULATOR
WIDEBAND RF PATH
-->--
c0/iPOS/TE_i/v/DurSPECTR0/1v.,/ 7-1/oUTD / -S7-0.97 / on/
FMDE MODUL,ITOR -->--
VI/DE-8.1NL)R.F.
SPEC TR ei/T
Figure 14A
DEMODULATEDOUTPUTSPEcTR(//%1WITHOUT0iSTOA770/V
BANDWIDTH LIMITED RF PATH
F/Q /-9a
FM R. F.' /c/v-->---
\_.CoivPoShrE
MO 40Z/L "ITO R BA/ vD ,c,,Iss/ 7 LreiR
--* acit-tao tit 41ToR
_INPUTSPECTRUMW I 7:47,01/7-DiSTORT/ON
/c/zTERcc,R . A:5P i cTR ()Ai
Figure 14B
DEMODULATEDOUTPUTSPECTRUMWI TN0/S TOR T/ o/V
-23-

In Figure 14B, a passive LC bandpass filter is
inserted between tie modulator and demodulator in order
to restrict the bandwidth. Audio distcrtion products
now appear at the output of our perfect demodulator,
due solely to the bandwidth restriction imposed by the
passive BPF.
As you can see, the distortion in any practical
FM system will depend on the amount of bandwidth avail-
able versus the ncdulation index being transmitted.
Relating the specific quantative effect of the band-
width limitations imposed by a particular transmitter
to the actual distortion of the demodulated composite
baseband is a complicated problem indeed. Some of the
factors involved are shown in Figure 15.
LIMITING FACTORS WITHIN FM TRANSMITTER
1. Total number of tunec circuits involved.
2. Amplitude and phase response of the total
combination of tuned circuits in the RF
path.
3. Amount of drive (saturation effects) to
each class "C" stage.
4. Non-linear transfer function within each
amplifier stage.
Figure 15
-24-
In Figures 16 thru 18 we view the various spectra
generated by the composite basebard at different Points
within the system. As the bandwidth is reduced, the
RF spectrum and demodulated spectrum will change. The
change in the RF spectrum is subtle, but the resulting
spectrum after demodulation is clearly modified.
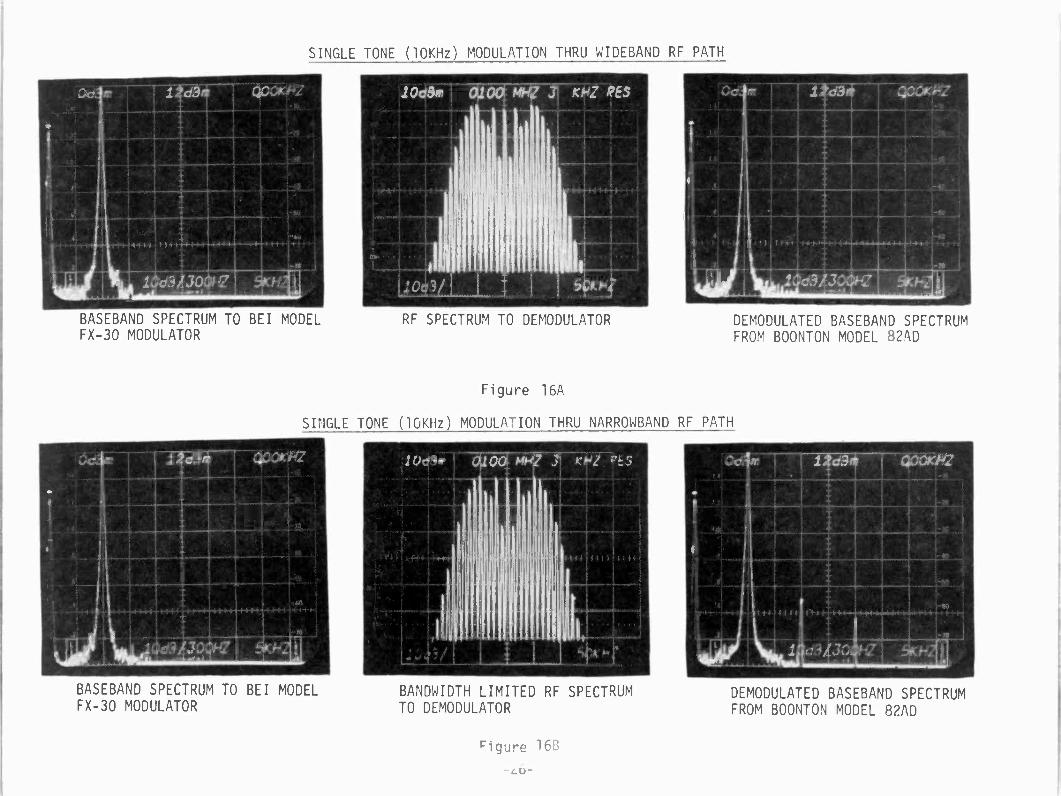
SINGLE TONE (10KHz) MODULATION THRU WIDEBAND RF PATH
BASEBAND SPECTRUM TO BEI MODELFX-30 MODULATOR
RF SPECTRUM TO DEMODULATOR
Figure 16A
SINGLE TONE (10KHz) MODULATION THRU NARROWBAND RF PATH
-3104 M 3i xrt r!..
BASEBAND SPECTRUM TO BEI MODELFX-30 MODULATOR
BANDWIDTH LIMITED RF SPECTRUMTO DEMODULATOR
Figure 16E
DEMODULATED BASEBAND SPECTRUMFROM BOONTON MODEL 82AD
1
T 1
IAte
i
i r r r- +1,4 4.4.4.1.4tit+4 .+4-t-i-tit
441.32J6
DEMODULATED BASEBAND SPECTRUMFROM BOONTON MODEL 82AD
-_u-
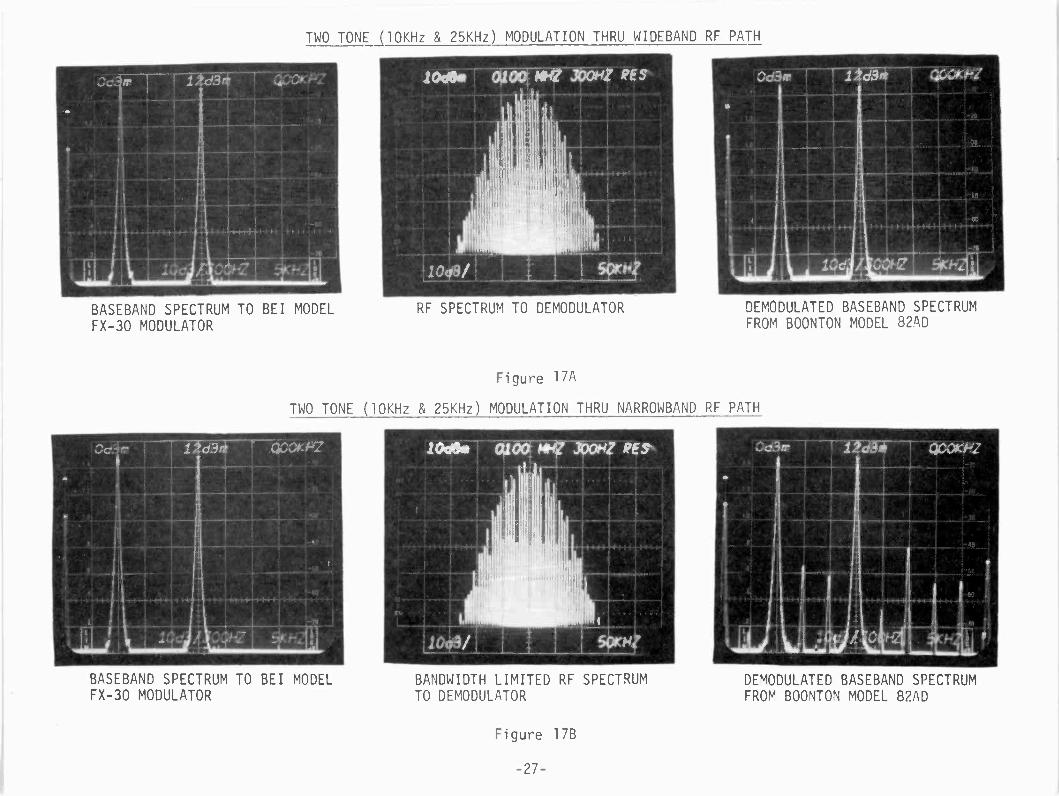
TWO TONE (10KHz & 25KHz) MODULATION THRU WIDEBAND RF PATH
BASEBAND SPECTRUM TO BEI MODELFX-30 MODULATOR
2008, 00017hOrjtkorq REs
RF SPECTRUM TO DEMODULATOR DEMODULATED BASEBAND SPECTRUMFROM BOONTON MODEL 82AD
Figure 17A
TWO TONE (10KHz & 25KHz) MODULATION THRU NARROWBAND RF PATH
BASEBAND SPECTRUM TO BEI MODELFX-30 MODULATOR
BANDWIDTH LIMITED RF SPECTRUMTO DEMODULATOR
Figure 17B
DEMODULATED BASEBAND SPECTRUMFROM BOONTON MODEL 82AD
-27-

STEREO (L or R=4.5KHz) PLUS SCA (UNMOD.) MODULATION THRU WIDEBAND RF PATH
BASEBAND SPECTRUM TO BEI MODELFX-30 MODULATOR
RF SPECTRUM TO DEMODULATOR DEMODULATED BASEBAND SPECTRUMFROM BOONTON MODEL 82AD
Figure 18A
STEREO (L or R=4.5KHz) PLUS SCA (UNMOD.) MODULATION THRU NARROWBAND RF PATH
BASEBAND SPECTRUM TO BEI MODELFX-30 MODULATOR
BANDWIDTH LIMITED RF SPECTRUMTO DEMODULATOR
Figure 18B
-28-
DEMODULATED BASEBAND SPECTRUMFROM BOONTON MODEL 82AD
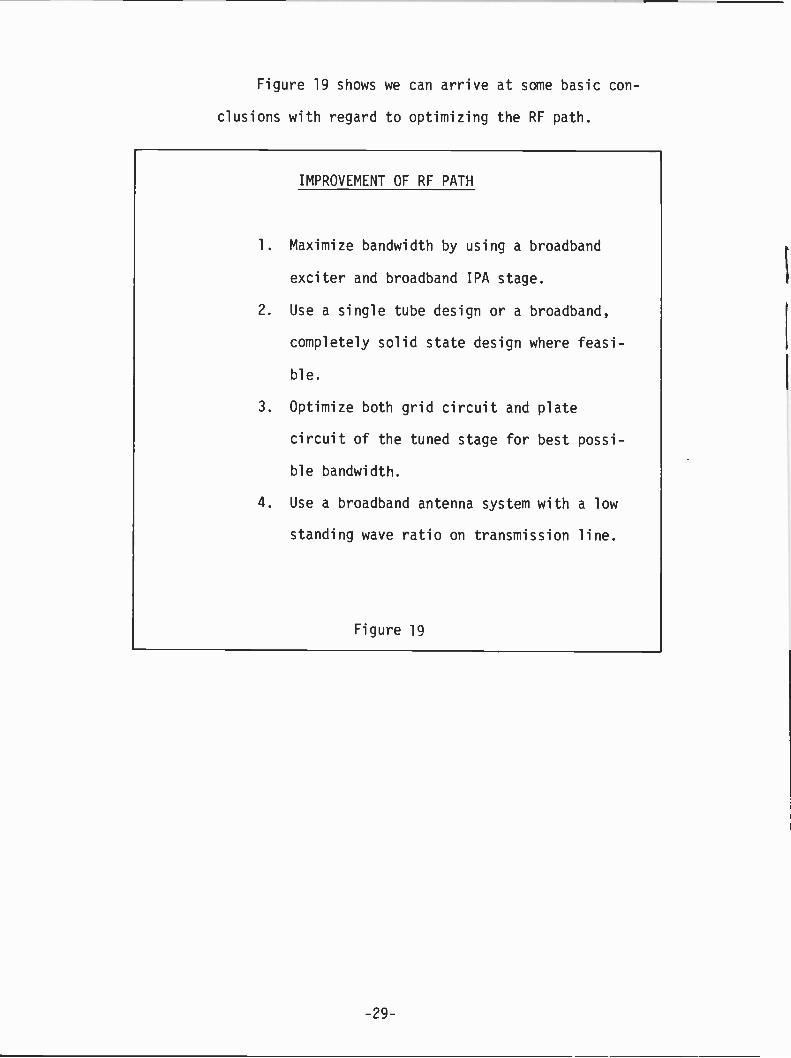
Figure 19 shows we can arrive at some basic con-
clusions with regard to optimizing the RF path.
IMPROVEMENT OF RF PATH
1. Maximize bandwidth by using a broadband
exciter and broadband IPA stage.
2. Use a single tube design or a broadband,
completely solid state design where feasi-
ble.
3. Optimize both grid circuit and plate
circuit of the tuned stage for best possi-
ble bandwidth.
4. Use a broadband antenna system with a low
standing wave ratio on transmission line.
Figure 19
-29-
TIPS ON HOW TO FIELD ADJUSTA TRANSMITTER FOR BEST AUDIO PERFORMANCE
We should start out by remembering that all
optimization should be done with the transmitter
connected to the normal antenna system rather than
to a dummy load.
The transmitter is first tuned for normal out-
put power and proper efficiency. A simple method
for centering the transmitter passband on the car-
rier frequency involves adjustment for minimum
synchronous AM. Synchronous AM is AM modulation
of the carrier caused by frequency modulation of
the carrier frequency. If the bandwidth is narrow
or skewed, increasing amplitude modulation of the carrier
will result.
A typical adjustment procedure is to FM modulate
100% at 400Hz and fine-tune the transmitter for
minimum 400Hz AM modulation as detected by a wide -
band envelope detector (diode and line probe).
It should be possible to minimize synchronous
AM while maintaining output and efficiency.
Another more sensitive test is to tune for
minimum intermodulation distortion in left only or
right only stereo transmissions. Stereo separation
will also vary with tuning.
For stations employing a 67KHz SCA, transmitter tuning

becomes very critical to minimizing crosstalk into the SCA.
Modulate one channel only on the stereo generator to 100%
with a 4.5KHz tone. This will place the lower second harmonic (L -R)
stereo sideband on top of 67KHz SCA. Activate the SCA at normal
injection level without modulation in the SCA. Tune the
transmitter for minimum output from the SCA demodulator.
This adjustment can also be made by listening to the
residual SCA audio while normal stereo programming is being
broadcast.
Figure 20 lists these field adjustment techniques in
ascending order of sensitivity.
FIELD ADJUSTMENT TECHNIQUES
1. Tune for minimum synchronous AM noise.
2. Tune for minimum IMD in left or right
only channel.
3. Tune for minimum crosstalk into unmodu-
lated SCA subcarrier.
Figure 20
In any of these tests, the grid tuning is frequently
more critical than the plate tuning. This is because the
impedance match into the input capacitance of the grid becomes
the bandwidth limiting factor. Even though the amplitude
response appears flattened when the grid is heavily driven,
the phase response has a serious effect on the higher order
FM sidebands.
-31-

CONCLUSION
I have discussed the three areas in the transmission
system that affect the composite baseband performance as
listed in Figure 2.
I. The composite link to the FM modulator
(stereo generator, SCA generator, compo-
site processor, and STL equipment)
II. The FM modulator
III. The RF path to the demodulator (FM ex-
citer, IPA, PA, and antenna system)
Figure 21
Each of these subsystems must be individually optim-
ized before your complete transmission system can
give you the best possible performance.
I hope that this presentation will encourage you
to investigate your particular system and will help
you optimize your composite signal, the key to quality
broadcasting at your station.
ACKNOWLEDGMENTS
The author is grateful to Mr. Robert Weirather
for his encouragement and his assistance in editing
this presentation. The author wishes to thank
Nancy Quellhorst and Lori Ash for their assistance
in preparing this manuscript.
-32-

REFERENCES
[1] Robert Orban - Orban Associates, "An Investigationof Baseband Clipping", presented at the 1980 NRBAEngineering Conference.
[2] Robert Orban - "Degradation of the FM Signal byBaseband Clipping", BME Magazine, p. 51 (1980 Aug.).
[3] Geoffrey Mendenhall - "Designing a New FM Exciter",Broadcast Communications, Vol. 3, No. 2, pp. 30-36 (1980 June).
[4] Frederick Terman - Electronic and Radio Engineering,pp. 586-600, McGraw-Hill Book Company, Copyright 1955.
[5] Reference Data for Radio Engineers, pp. 44-38 andpp. 45-20 thru 45-22, Howard W. Sams & Co., Inc.,Copyright 1968.
THE AUTHOR
Geoffrey N. Mendenhall earned a BEE degree from the
Georgia Institute of Technology, Atlanta, Georgia.
Mr. Mendenhall has designed communications equipment
for various manufacturers, including E.F. Johnson Co. and
Harris Corporation. He led the design efforts for both the
Harris MS -15 product line and the Broadcast Electronics
FX-30 FM Exciter. His practial field experience has involved
engineering and operations work for several radio and television
stations, including Storer Broadcasting.
The author is presently Manager of FM Products for Broadcast
Electronics in Quincy, Illinois. He is an active amateur radio
operator and is experimenting with home satellite reception.
Mr. Mendenhall holds two U.S. Patents for electronic designs
and is a registered professional engineer in the State of Illinois.
He has authored numerous technical papers and is a member of the
Institute of Electrical and Electronics Engineers.

' r3
.00
wiT
-
I .t
OM .r
-?'
1w.

.
4`4,
01)7
4,4% -'1"".
il_rt.
4-'' -
,- '
'n--1r.
.Y
.-14
-!r
2'4
Li1.
.iudr'
14;...
Prte,,
tit. e-*rarlr-
-
`
P1:F4`4;
''41:4"-I.4,a
;4444-, 4.
114';"-
le.91 401: A
'f
.
i)
-'r"f
J-
'; 9
3-
.
-i
.it-.. ,..
i' -
'',..-:.,
-4.
14 -,
t.,_
till'
.-1
rt4-1 -.
--
4-. 7 -.
.
,..,..4
'
,n.
4v.4,
.'07.4...!
,,1.1C
tyr I .4'
."."1;k,r441- 4 ;
1),k.I
-: sill, - -
,.ir.. 4
.
;4,1119.1, -...1, -,.''14-.k. I .:-.Q..,i,ttl:-.
...-,;,--,
'L"...97,^
,!
-I--_,-. ,.,r"...
7-..99
,i4,,-1--.4 ,.-It
4.r
.!,. .,...... '-'1..:
L'u '
. .4''
'.
(7'' i9.'
'' t-- -"!..'
'g%
..:.. r'1',.''
-I' `
il.h' '".
...-;"11.4,
Or.,
.11.._.f.
-,'
.J._A
:4_,-
-.,...!
'-
.1
./... ,-*P',.
...,,,,t,- 4 L
ot is
..
'"
t.--
4'..
.
S.
i-
- z '.:!. ' .
..'
4v
,t;sK
ti:-..
, . ,!_...
-...F.
..:-.,....,, t
A:, tog
".!.7.":
it '-''.
,' .*
.
14'..
te'''
-
...1,,,..
,k -i:.: r
.,
44
._,
..
_ tr.
. re. _:,..,.
7:,-.1-,:
.. '
-. ,er o'fii 't.....j.-
ch,. A
,: nit:It t.st..,'''. - -'
'.-'
,c
... . 7 ,- .I.
yam
,_,-t
-ie*s;. 40
':ill-..7!'4
4t
7
9.
,,
hI
.* -:fil 57,7
.-,....11.4.,..rm
1Ir
,:5k ' ....,!! .-
...E. .141,,,..
,:.n .,..,,
....'gr.,
;-,
-4;!r
4.4,i
ti.
, 'flif:Li.
t-,'.'
'.E
'.' , r.(---
4::- :t.. :711:81.ra
.
-- ),'"..4'V'',,,ii
m .
j.,,_et z-9, tre_9
:ar .
- '
,4. ;;11%!. :;.:.
,
s.,..?'
' ".41 *A
Y,,
.,1 J.I
."7 ,-
7-i
.,
-
18,
il-_...,,,.-.,
., - ,.-,'.- :,*- 4
4--.
-
el' 1-1,7,-;4,1'si
es.10._
k L
"_-'...I. , 4 zrio. 9,.
'
'- 1
-s',, 717. :.1.1:1..'-' '7"
''F.i4f.i I' -1,-..
.4* -.1174.e.-:11;. T ':-
'11. taiv.::1::.,10:na.
-;(....th;T
2..r.1.-_ h 7,''',th.42i.,-,...,_?:,,
:
.76.1,;!'4
'
at,i,`,-t -.
rtrtt: ,:rr,
,s t.7--:, tit
41%. -
.'s.
,
-1_73.;
,
__
Top Related