


Languages
Pages
Legal

BUSSINESS MATHEMATICS
LINEAR FUNCTION
y = a + bx
Cost Revenue Profit BEP
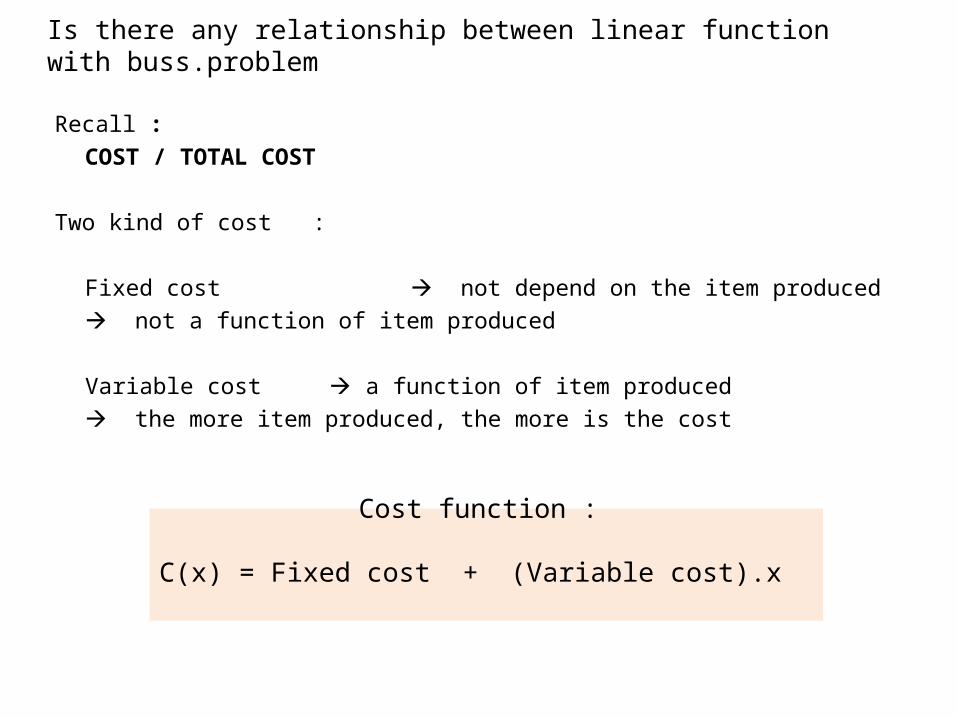
Is there any relationship between linear function with buss.problem
Recall : COST / TOTAL COST
Two kind of cost :
Fixed cost not depend on the item produced not a function of item produced
Variable cost a function of item produced the more item produced, the more is the cost
Cost function :
C(x) = Fixed cost + (Variable cost).x
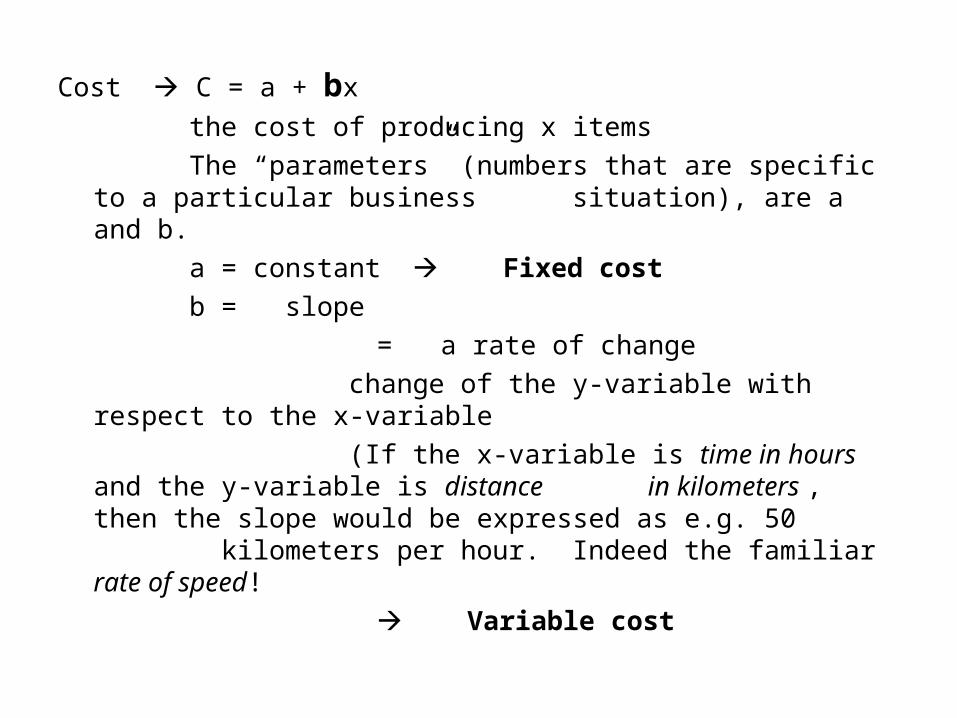
Cost C = a + bxthe cost of producing x itemsThe “parameters” (numbers that are specific to a particular
business situation), are a and b. a = constant Fixed costb = slope
= a rate of change change of the y-variable with respect to the x-variable (If the x-variable is time in hours and the y-variable is
distance in kilometers , then the slope would be expressed as e.g. 50 kilometers per hour. Indeed the familiar rate of speed!
Variable cost
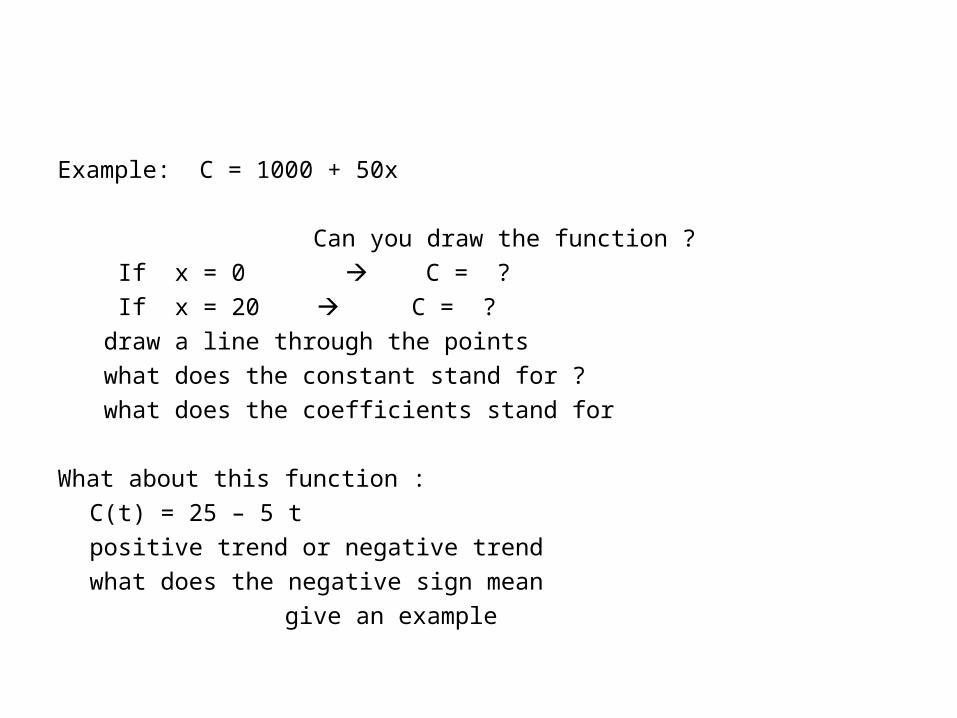
Example: C = 1000 + 50x
Can you draw the function ? If x = 0 C = ? If x = 20 C = ? draw a line through the points what does the constant stand for ? what does the coefficients stand for
What about this function :C(t) = 25 – 5 t positive trend or negative trendwhat does the negative sign mean
give an example
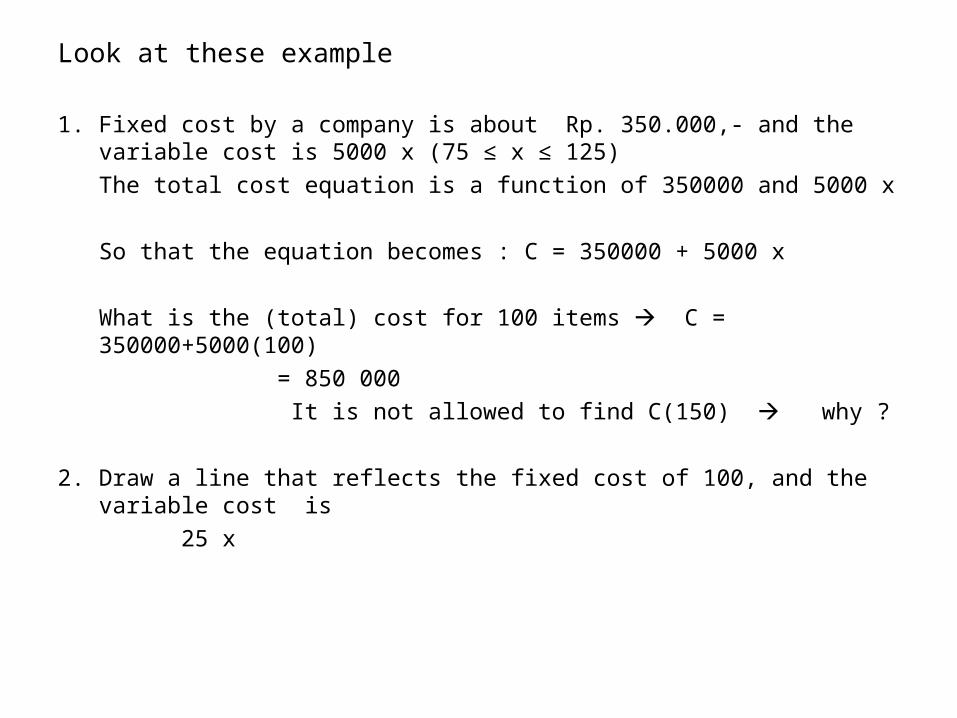
Look at these example
1. Fixed cost by a company is about Rp. 350.000,- and the variable cost is 5000 x (75 ≤ x ≤ 125)
The total cost equation is a function of 350000 and 5000 x
So that the equation becomes : C = 350000 + 5000 x
What is the (total) cost for 100 items C = 350000+5000(100) = 850 000
It is not allowed to find C(150) why ?
2. Draw a line that reflects the fixed cost of 100, and the variable cost is 25 x
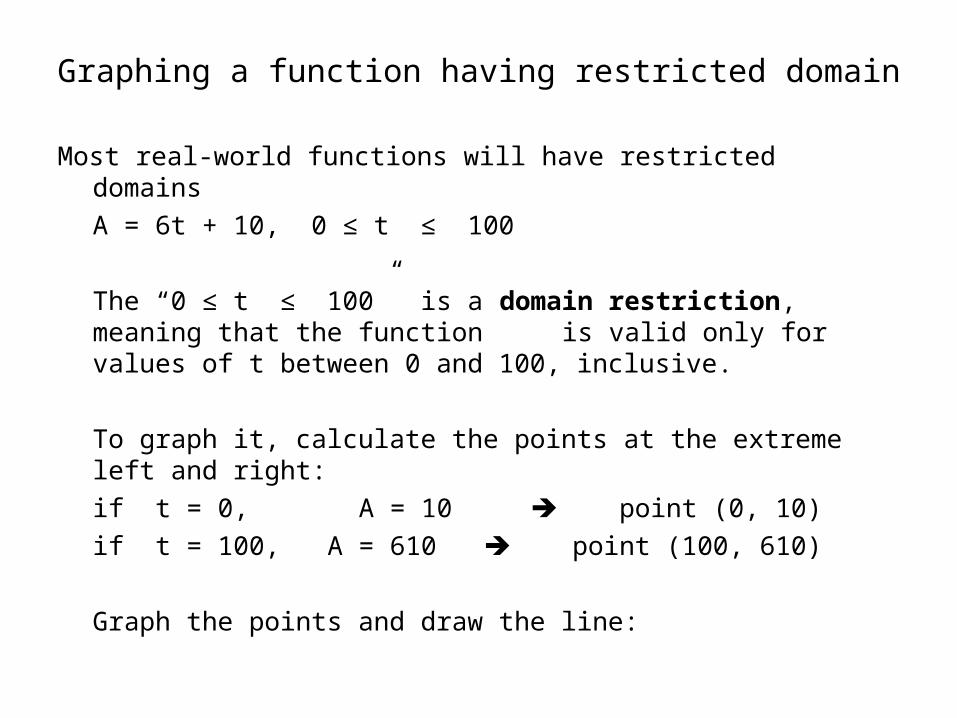
Graphing a function having restricted domain
Most real-world functions will have restricted domainsA = 6t + 10, 0 ≤ t ≤ 100
The “0 ≤ t ≤ 100” is a domain restriction, meaning that the function is valid only for values of t between 0 and 100, inclusive.
To graph it, calculate the points at the extreme left and right:if t = 0, A = 10 point (0, 10)if t = 100, A = 610 point (100, 610)
Graph the points and draw the line:
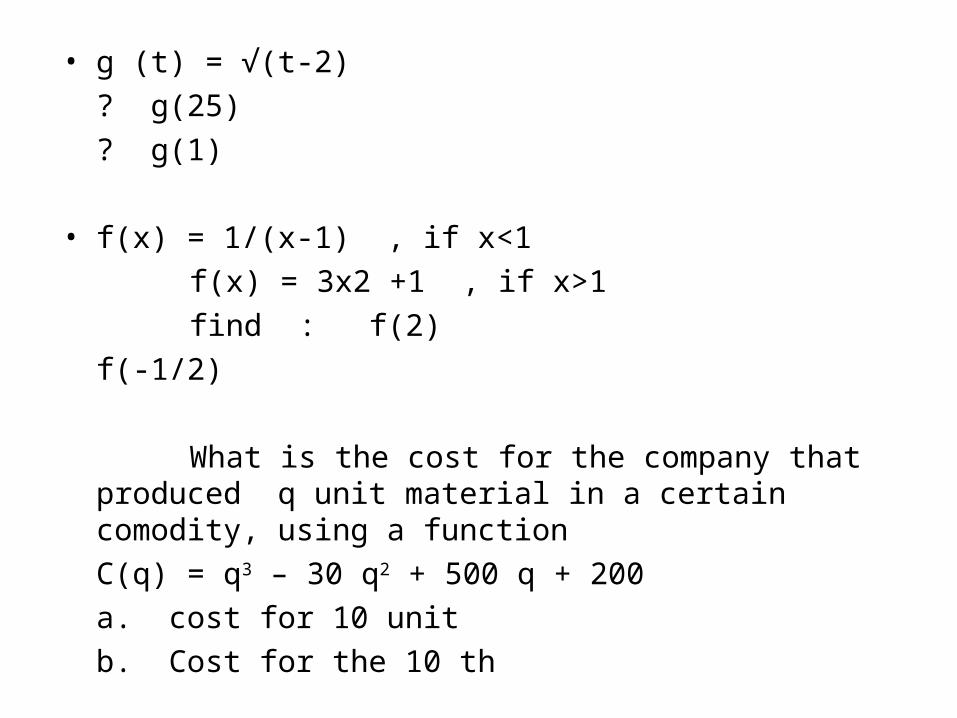
• g (t) = √(t-2) ? g(25) ? g(1)
• f(x) = 1/(x-1) , if x<1 f(x) = 3x2 +1 , if x>1 find : f(2)
f(-1/2)
What is the cost for the company that produced q unit material in a certain comodity, using a functionC(q) = q3 – 30 q2 + 500 q + 200a. cost for 10 unitb. Cost for the 10 th
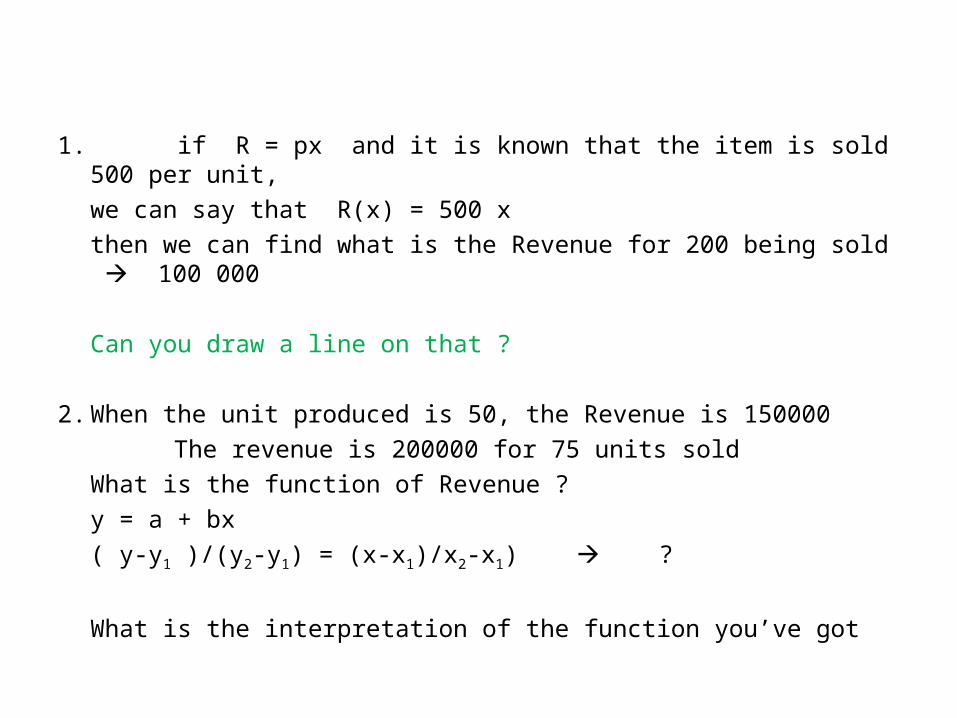
1. if R = px and it is known that the item is sold 500 per unit,we can say that R(x) = 500 xthen we can find what is the Revenue for 200 being sold 100 000
Can you draw a line on that ?
2. When the unit produced is 50, the Revenue is 150000 The revenue is 200000 for 75 units sold
What is the function of Revenue ?y = a + bx( y-y1 )/(y2-y1) = (x-x1)/x2-x1) ?
What is the interpretation of the function you’ve got
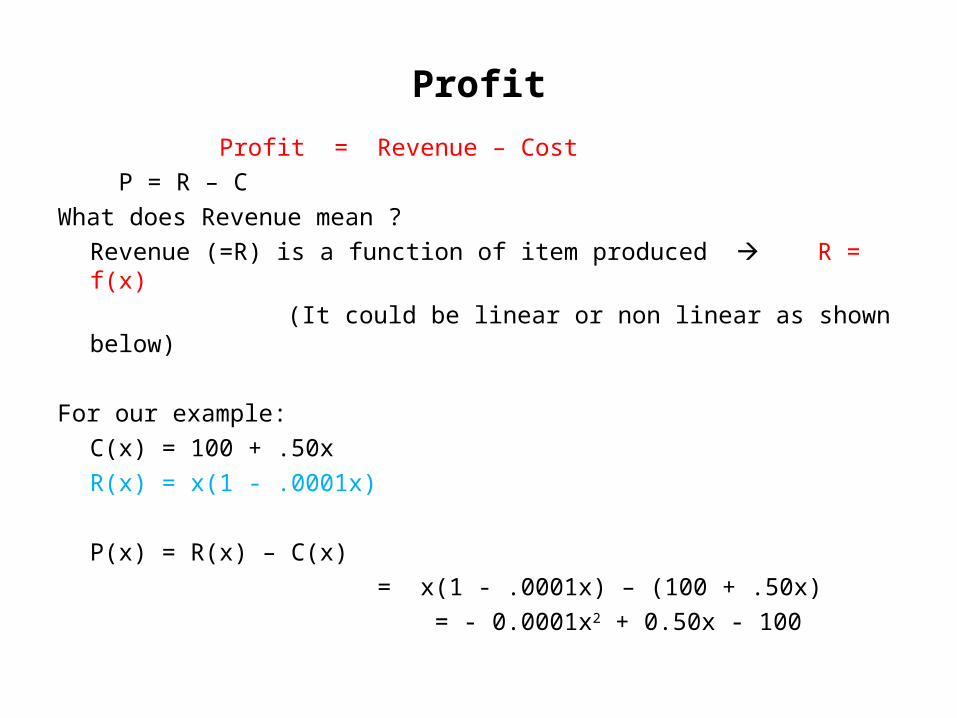
Profit
Profit = Revenue – Cost P = R – C
What does Revenue mean ?Revenue (=R) is a function of item produced R = f(x)
(It could be linear or non linear as shown below)
For our example:C(x) = 100 + .50xR(x) = x(1 - .0001x)
P(x) = R(x) – C(x)
= x(1 - .0001x) – (100 + .50x) = - 0.0001x2 + 0.50x - 100
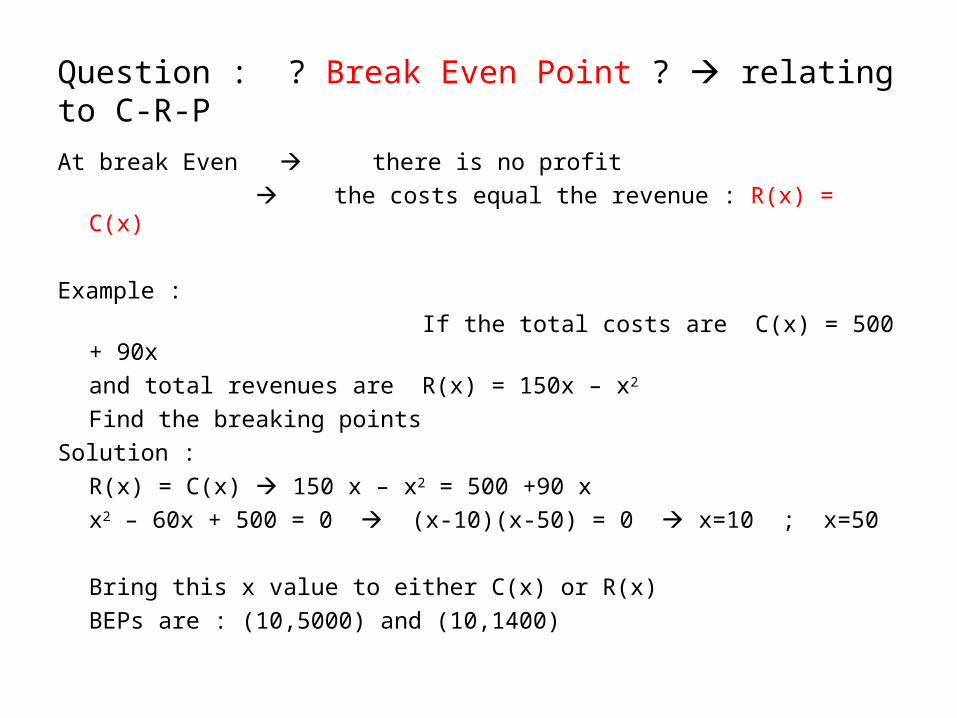
Question : ? Break Even Point ? relating to C-R-P
At break Even there is no profit the costs equal the revenue : R(x) = C(x)
Example : If the total costs are C(x) = 500 + 90x
and total revenues are R(x) = 150x – x2
Find the breaking pointsSolution :
R(x) = C(x) 150 x – x2 = 500 +90 xx2 – 60x + 500 = 0 (x-10)(x-50) = 0 x=10 ; x=50
Bring this x value to either C(x) or R(x)BEPs are : (10,5000) and (10,1400)
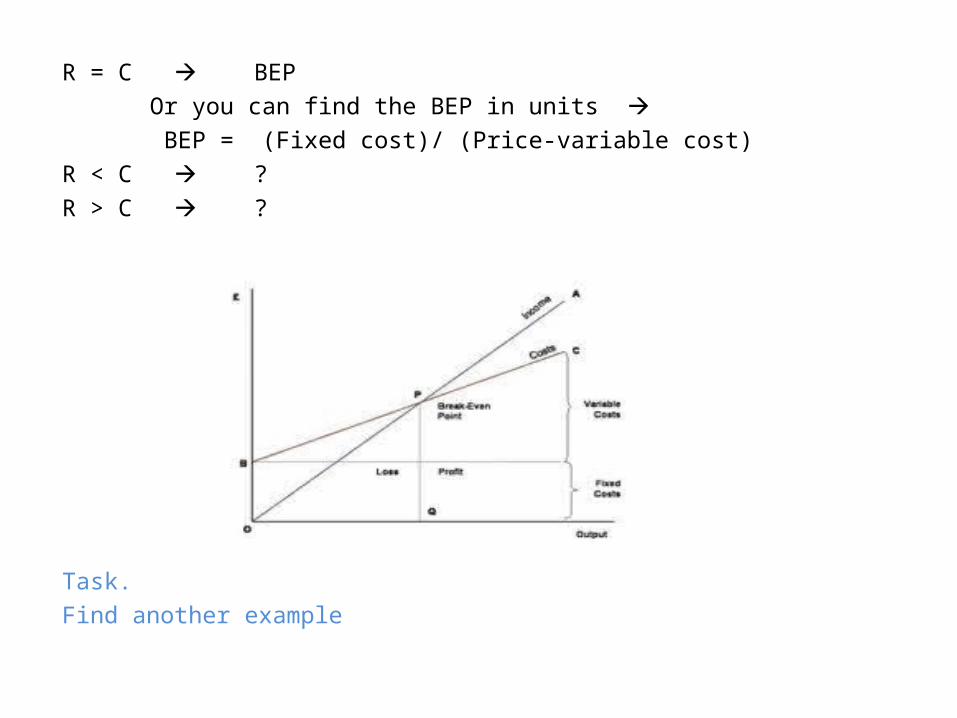
R = C BEP Or you can find the BEP in units BEP = (Fixed cost)/ (Price-variable cost)
R < C ?R > C ?
Task.Find another example
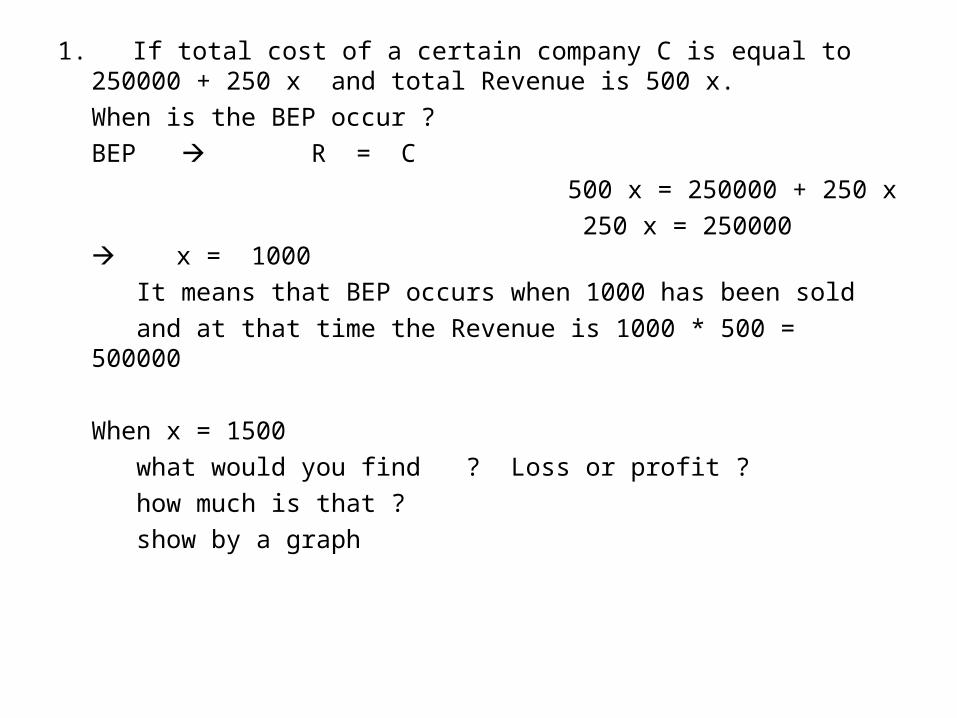
1. If total cost of a certain company C is equal to 250000 + 250 x and total Revenue is 500 x.
When is the BEP occur ?BEP R = C
500 x = 250000 + 250 x 250 x = 250000 x = 1000
It means that BEP occurs when 1000 has been sold and at that time the Revenue is 1000 * 500 = 500000
When x = 1500 what would you find ? Loss or profit ? how much is that ? show by a graph
Task : Find such a real problem in daily activity (the Revenue is in linear function)
a. What is the Revenue function draw a line b. What is the cost function draw c. Find out when it would be loss d. When will you get profit and how much is that,
Show it in a graph as well
• Average Fixed Cost & Average Variable cost
usually in percentage
Task. Find out an example about Av Fixed cost & Av Var cost
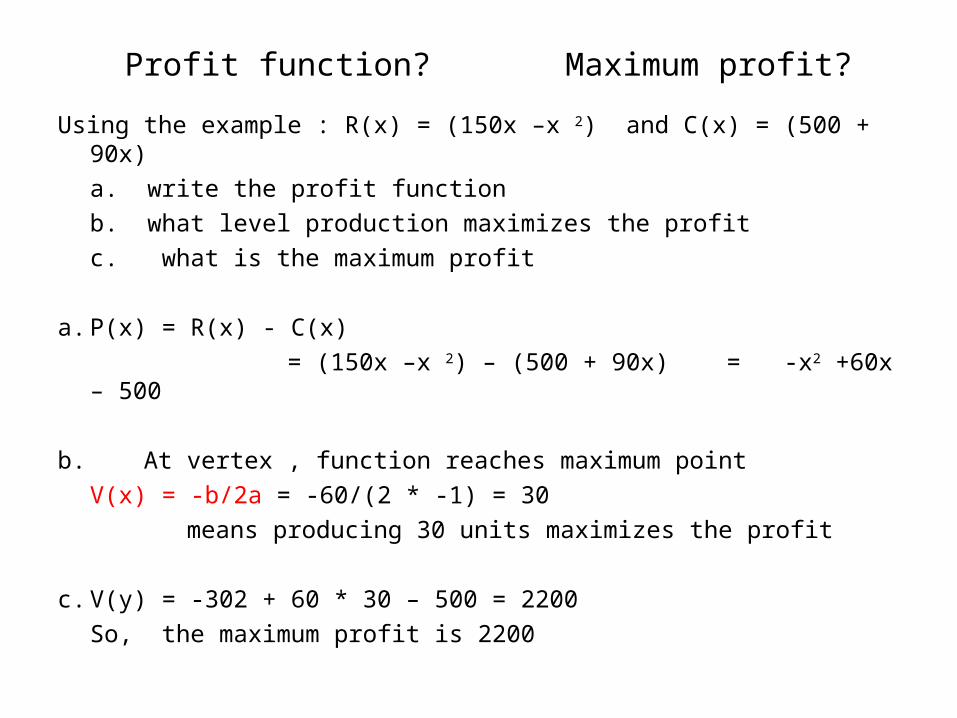
Profit function? Maximum profit?
Using the example : R(x) = (150x –x 2) and C(x) = (500 + 90x) a. write the profit function b. what level production maximizes the profitc. what is the maximum profit
a. P(x) = R(x) - C(x) = (150x –x 2) – (500 + 90x) = -x2 +60x – 500
b. At vertex , function reaches maximum pointV(x) = -b/2a = -60/(2 * -1) = 30
means producing 30 units maximizes the profit
c. V(y) = -302 + 60 * 30 – 500 = 2200 So, the maximum profit is 2200
EQUILIBRIUM
• a term relating to a 'state of rest‘• there is no tendency to change. In economics, equilibrium is an important
concept. Equilibrium analysis enables us to look at what factors might bring about change and what the possible consequences of those changes might be. Remember, that models are used in economics to help us to analyse and understand how things in reality might work.
• equilibrium analysis is one aspect of that process in that we can look at cause and effect and assess the possible impact of such changes.
• market equilibrium occurs where the amount consumers wish to purchase at a particular price is the same as the amount producers are willing to offer for sale at that price.
• it is the point at which there is no incentive for producers or consumers to change their behaviour.
• graphically, the equilibrium price and output are found where the demand curve intersects (crosses) the supply curve.
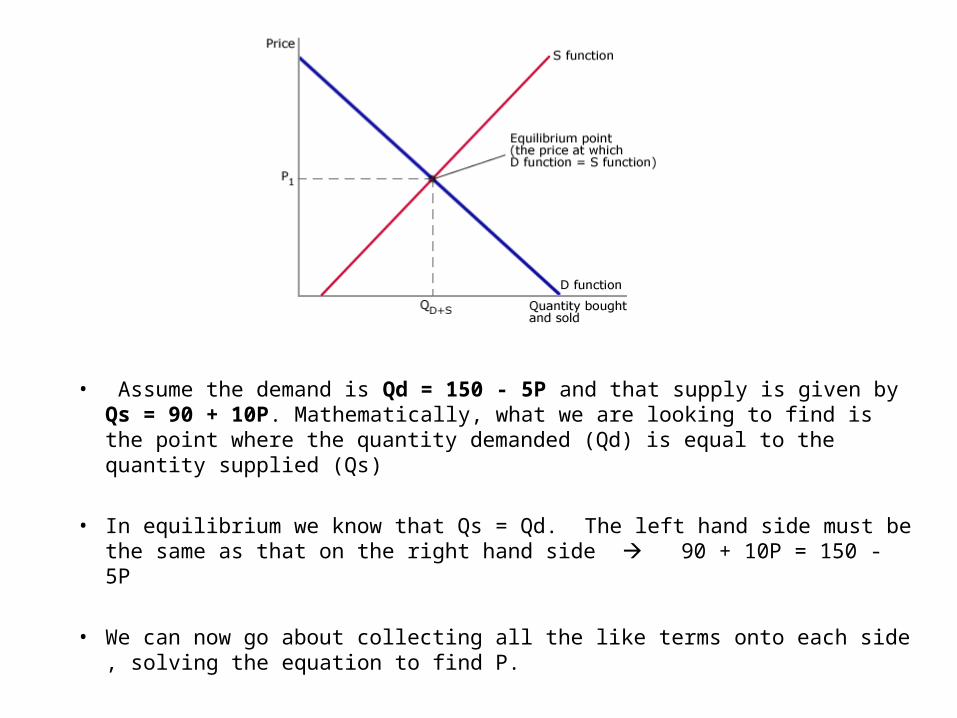
• Assume the demand is Qd = 150 - 5P and that supply is given by Qs = 90 + 10P. Mathematically, what we are looking to find is the point where the quantity demanded (Qd) is equal to the quantity supplied (Qs)
• In equilibrium we know that Qs = Qd. The left hand side must be the same as that on the right hand side 90 + 10P = 150 - 5P
• We can now go about collecting all the like terms onto each side , solving the equation to find P.
DEMAND FUNCTION AND SUPPLY FUNCTION
• The law of demand : as price goes up, demand goes down as price goes down, demand goes up
• What sort of things that affected the demand consumers’ willingnessconsumers’ incomeprices , etc
• The function is P = b – ax ; X = -ap + b P is price, a as a constant, x is quantity demanded P and x are always positive 0 ≤ P ≤ a
0 ≤ x ≤ b• The Demand function is monotonically decreasing Look at this simple example :
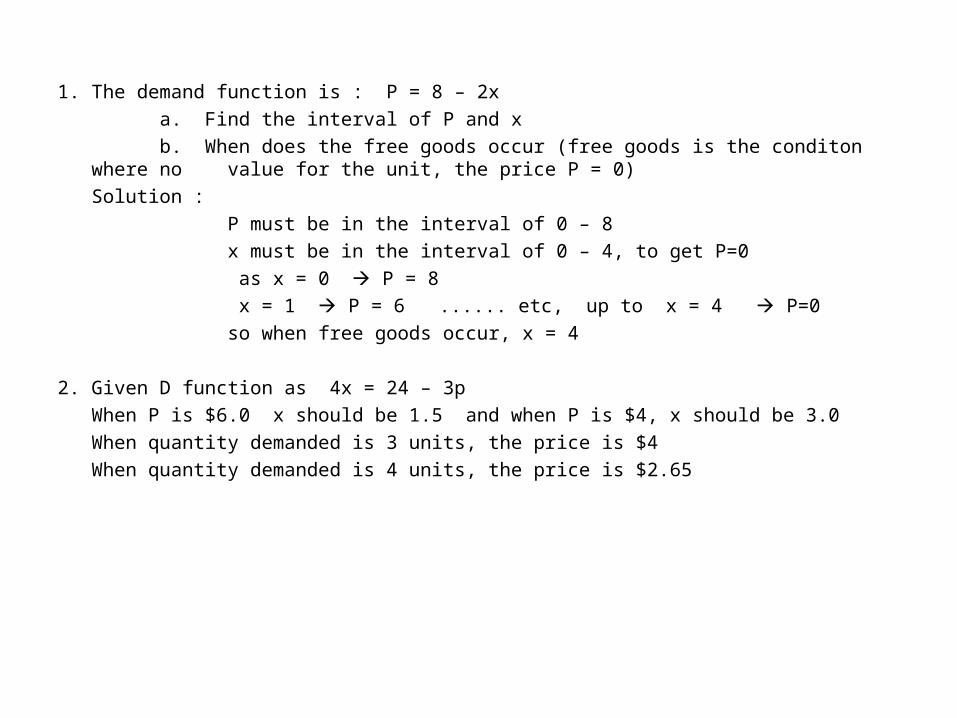
1. The demand function is : P = 8 – 2x a. Find the interval of P and x b. When does the free goods occur (free goods is the conditon where no value for the unit,
the price P = 0)Solution :
P must be in the interval of 0 – 8 x must be in the interval of 0 – 4, to get P=0 as x = 0 P = 8
x = 1 P = 6 ...... etc, up to x = 4 P=0 so when free goods occur, x = 4
2. Given D function as 4x = 24 – 3pWhen P is $6.0 x should be 1.5 and when P is $4, x should be 3.0When quantity demanded is 3 units, the price is $4When quantity demanded is 4 units, the price is $2.65
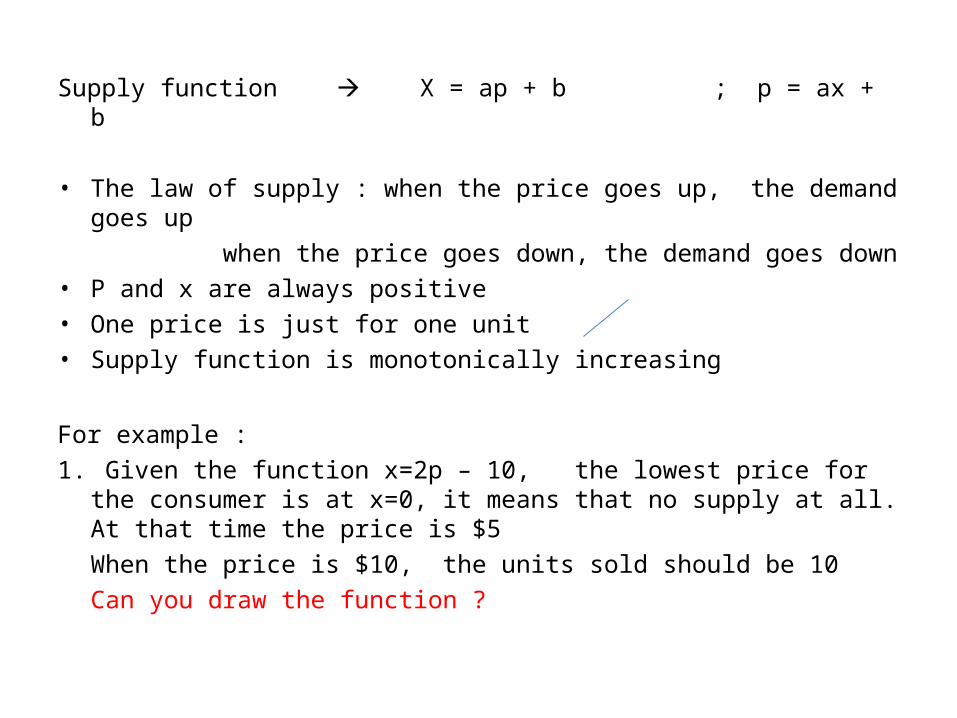
Supply function X = ap + b ; p = ax + b
• The law of supply : when the price goes up, the demand goes up when the price goes down, the demand goes down
• P and x are always positive• One price is just for one unit• Supply function is monotonically increasing
For example : 1. Given the function x=2p – 10, the lowest price for the consumer is at
x=0, it means that no supply at all. At that time the price is $5When the price is $10, the units sold should be 10Can you draw the function ?

2. When the goods is 200 units, the supply is $1000 For 250 units, the supply is $1500
Solution :Remember : (y-y1)/(y2-y1) = (x-x1)/(x2-x1)When the ordinate is P (p-p1)/(p2-p1) = (x-x1)/(x2-x1)(p-1000)/(1500-1000)= (x-200)/(250-200)p = 10x – 1000
Draw the supply function
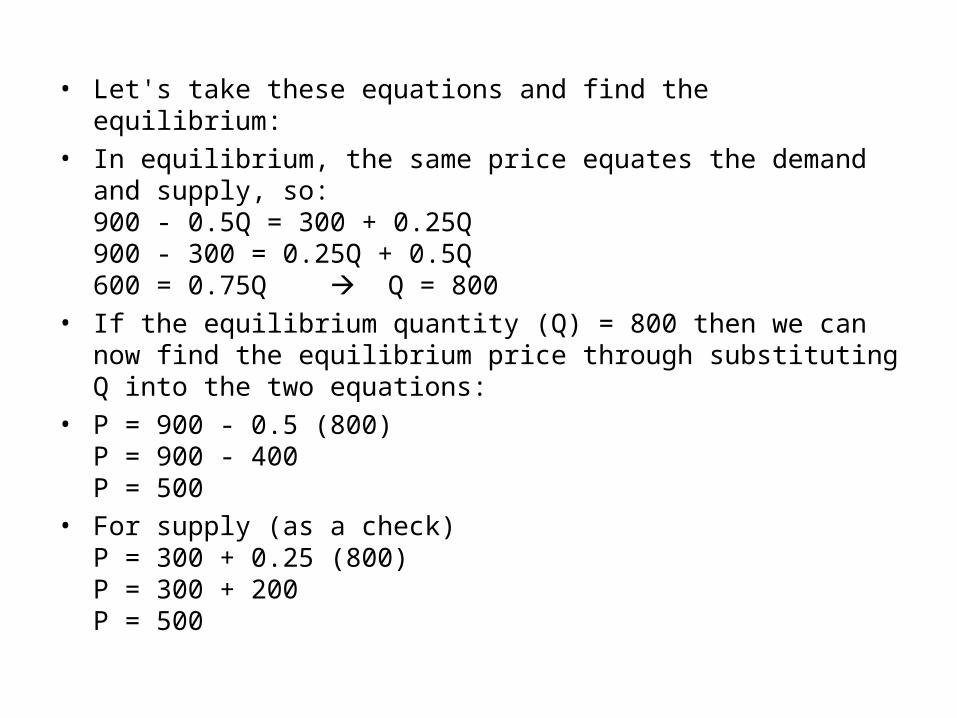
• Let's take these equations and find the equilibrium:• In equilibrium, the same price equates the demand and supply, so:
900 - 0.5Q = 300 + 0.25Q 900 - 300 = 0.25Q + 0.5Q600 = 0.75Q Q = 800
• If the equilibrium quantity (Q) = 800 then we can now find the equilibrium price through substituting Q into the two equations:
• P = 900 - 0.5 (800)P = 900 - 400P = 500
• For supply (as a check)P = 300 + 0.25 (800)P = 300 + 200P = 500
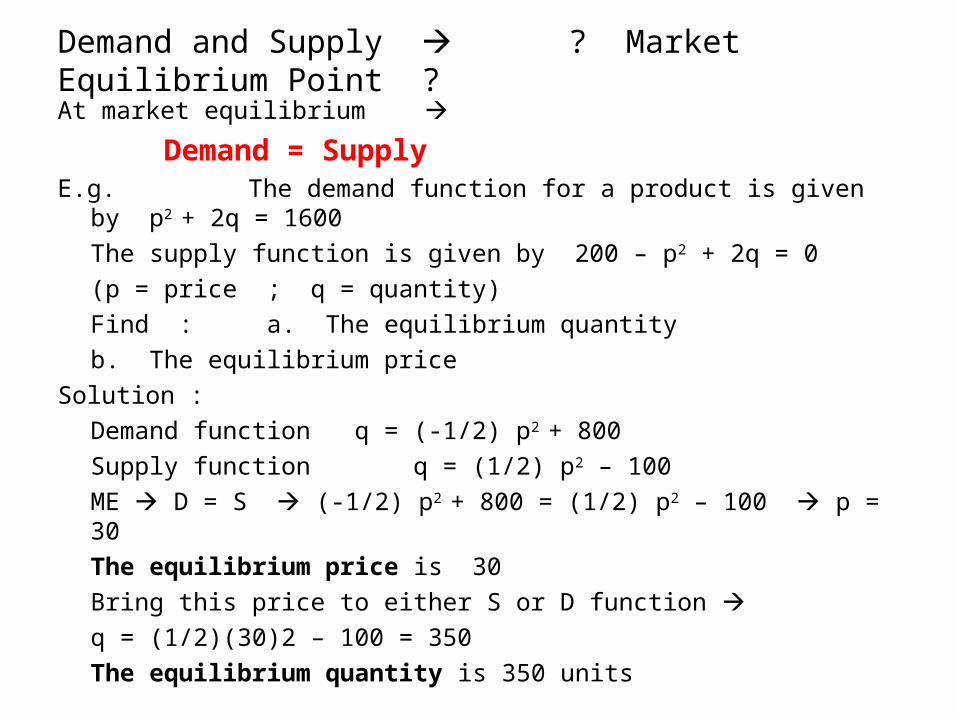
Demand and Supply ? Market Equilibrium Point ?
At market equilibrium
Demand = SupplyE.g. The demand function for a product is given by p2 + 2q = 1600
The supply function is given by 200 – p2 + 2q = 0(p = price ; q = quantity)Find : a. The equilibrium quantity
b. The equilibrium priceSolution :
Demand function q = (-1/2) p2 + 800Supply function q = (1/2) p2 – 100ME D = S (-1/2) p2 + 800 = (1/2) p2 – 100 p = 30The equilibrium price is 30
Bring this price to either S or D function q = (1/2)(30)2 – 100 = 350The equilibrium quantity is 350 units
