


Languages
Pages
Legal


Electronic copy available at: http://ssrn.com/abstract=2651158
1 !
Business Accelerators and New-Venture Performance:
Evidence from Start-Up Chile
Juanita Gonzalez-Uribe1 and Michael Leatherbee2
August 2015
Do business accelerators add value? If so, how? We investigate these questions by focusing on Start-Up Chile, an accelerator sponsored by the Chilean government. Using a regression discontinuity design, we show the mentoring services of accelerators can significantly increase new-venture performance by improving the managerial capital of participants. We speculate about the existence of two performance-enhancing mechanisms: the increase in the start-up’s social capital by enabling access to mentor networks, and the provision of an accountability structure in the form of board oversight. We find no support for the causal effect of basic services of cash and co-working space. JEL codes: G24, L26, M13
Keywords: Accelerators, Entrepreneurship, Start-ups, Managerial Capital !!!!!!!!!!!!!!!!!!!!!!!!!!!!!!!!!!!!!!!!!!!!!!!!!!!!!!!!!!!!!We thank Start-Up Chile and YouNoodle for generous access to the data, and numerous interviewed participants for their time. Special thanks go to Konrad Fernández, Horacio Melo, Nicolas Shea, and Sebastian Vidal for helpful discussions on the data, the program, and Chile’s entrepreneurial community. We also thank Pat Akey, Ulf Axelson, Taylor Begley, Shai Bernstein, Vicente Cunat, Slava Fos, Joan Farre-Mensa, Thomas Hellman, Stefan Lewellen, Ramana Nanda, Daniel Paravisini, Dina Pomeranz, Farzad Saidi, Merih Sevilir, Rui Silva, Moqi Xu, and the seminar participants at the Department of Finance at LSE, the NBER Entrepreneurship Meeting 2014, the Adam Smith Conference 2015, the UNC Junior Roundtable 2015, the 8th Private Equity Findings Symposium 2015, the CEPR ESSFM 2015, and the finance seminar at the University of Urbana Champaign. Su Wang provided excellent research assistance. Financial support from Abraaj Group and from Chile’s National Commission for Scientific and Technological Research (CONICYT) Núcleo Milenio Research Center in Entrepreneurial Strategy Under Uncertainty (NS130028) is gratefully acknowledged. Corresponding author: Juanita Gonzalez-Uribe. 1 London School of Economics, [email protected] 2 Pontificia Universidad Católica de Chile, [email protected]

Electronic copy available at: http://ssrn.com/abstract=2651158
2 !
An increasingly important institutional form in the entrepreneurial ecosystem is the business
accelerator: a fixed-term, cohort-based, financial intermediary that offers start-ups cash,
shared office space, and business education. From only one in 2005—Y Combinator—
thousands now exist worldwide,3 with public funds sponsoring approximately 18% of the
programs (Lewis et. al, 2011). Accelerators distinguish themselves from other early-stage
financiers in their strong emphasis on the business-education component (Cohen and
Hochberg, 2014), which is often imparted in the form of mentoring (e.g., Bernthal, 2015).
This component is informally believed by practitioners to be the largest value-added source
of these programs.4 Although evidence about the function of early-stage financiers going
beyond information-based roles (e.g., Hellman and Puri, 2002) and about “managerial
capital” constraints limiting subsistence business performance (e.g., Bruhn et al., 2011;
Bloom and Van Reenen, 2010) seems to support this belief, very little rigorous evidence
exists regarding the mechanisms through which business accelerators affect new ventures.5, 6
This issue is particularly relevant given the importance of new ventures for economic growth
(Davis et al., 1998; Haltiwanger et al., 2013), and the relevant public and private resources
spent to foster entrepreneurial activity.
This article provides the first quasi-experimental evidence on the effect of accelerator
programs on start-up performance, and on the importance of managerial capital in new
ventures.7 The setting is Start-Up Chile, a business accelerator that has been promoted by the
!!!!!!!!!!!!!!!!!!!!!!!!!!!!!!!!!!!!!!!!!!!!!!!!!!!!!!!!!!!!!3!At least 5,593 institutions self-identify as an accelerator. See F6S, https://www.f6s.com (last visited August 4, 2015).!4! See, for example, this opinion piece, http://avc.com/2011/06/financing-options-contestsprizesaccelerator-programs/, by Fred Wilson, venture capital partner at Venture Square Ventures in New York and a revered blogger in the start-up space.!5 By new ventures, we mean start-ups founded by transformational entrepreneurs: individuals who aim to create large, vibrant businesses (Schoar, 2009). 6!A few exceptions include the work by Bernthal (2015), Cohen and Hochberg (2014), Leatherbee and Eesley (2014), Fehder and Hochberg (2014), Hallen et al. (2013), and Yu (2015). 7!A few related exceptions include the work by Klinger and Schundeln (2011) and Mckenzie (2015) looking at the impact of formal and structured business training programs offered by business-plan competitions: Technoserve in Central America and YouWin! in Africa, respectively. These contributions differ from our work in that they focus on the role of formal business training and not on mentoring. The difference is that although

Electronic copy available at: http://ssrn.com/abstract=2651158
3 !
Chilean government since 2010. The program offers participants a cash infusion of
US$40,000 (equity free), shared office space, and the possibility of being selected into the
mentor arm, where participants are paired with experienced mentors and receive intensive
support. Using a fuzzy regression discontinuity design (RDD), which exploits the fact that the
program accepts a fixed number of participants every round based on an application score,
we provide causal estimates of the effect of basic accelerator services (i.e., cash and co-
working space) on start-up performance. Further, exploiting the unique feature of Start-Up
Chile—that only 20% of participants are selected into the mentor arm based on a “pitch
competition” and a qualification score cut-off—we provide casual estimates of the value-
added effect of mentoring (conditional on basic services), also using a fuzzy RDD.
We find participation in the mentor arm (bundled with the basic services of cash and
co-working space) leads to a significantly higher likelihood of fund-raising and scale—at
least for borderline start-ups scoring close to the qualification threshold. We estimate an
18.1% to 42.4% higher probability of securing seed and venture capital financing, which
corresponds to a 0.61 to 1.43 standard deviation increase. These start-ups also appear to hire
more, grow their customer base faster, and be more likely to survive, especially those funded
by Chilean entrepreneurs. By contrast, we find no evidence that the basic accelerator services
of cash and co-working space have a treatment effect on venture fund-raising, scale, or
survival for “compliers” ranking close to the program’s capacity threshold (i.e., those
subjects whose treatment status switched from non-accelerated to accelerated because their
ranking crossed the capacity threshold).8 Although participants in the accelerator outperform
rejected applicants on average, the selection skill of the recruiters appears to explain the
differences in performance.
!!!!!!!!!!!!!!!!!!!!!!!!!!!!!!!!!!!!!!!!!!!!!!!!!!!!!!!!!!!!!!!!!!!!!!!!!!!!!!!!!!!!!!!!!!!!!!!!!!!!!!!!!!!!!!!!!!!!!!!!!!!!!!!!!!!!!!!!!!!!!!!!!!!!!!!!!!!!!!!!!!!!!!!!!!!!!!!!!!!!!!!!!!!!!mentoring is less structured, it includes additional sources of potential value added from connections of mentors, the certification effect of having been accepted into the mentor arm, the preferential treatment participants in the mentor arm enjoy, and the structured accountability of managerial milestones. !8 Compliers correspond to applicants who adhered to the selection rule (Imbens and Angrist, 1994).

4 !
Why do the cash and co-working space have no impact on borderline compliers?
Other than the null hypothesis being true (i.e., basic accelerator services add no value), one
potential reason is that borderline start-ups are of heterogeneous quality, and the program
accelerates the success of some but the demise of others—with a resulting zero average
effect. A second potential reason is that the cash infusion and co-working space (especially
given the cost of relocation to Santiago to participate in the program) are not enough to
significantly affect performance. Indeed, returns to capital in start-ups may not always be
positive; for example, cash infusions may lead founders to discover fundamental flaws in
their prototypes that shut down the venture, or the capital stock may be too low to generate
positive returns (Banerjee and Newman, 1993; Aghion and Bolton, 1997). A third potential
reason is that we lack statistical power to distinguish the effect. Yet standard sample-size
calculations, as a nod to the literature on randomized control trials (see McKenzie, 2010),
suggest we have sufficient power to reject the null. A fourth potential reason is that rejected
applicants secured acceleration services elsewhere, or raised alternative sources of financing,
dampening the estimated effect of the basic services. However, analysis of supplementary
data does not support this possibility: only 2% of rejected applicants secure financing in other
accelerator programs, and only 1% raise seed or VC financing.9
Given the large positive impact of participation in the mentor arm, the natural
questions ask how mentoring adds value to new ventures, and why these start-ups had not
previously invested in this managerial capital. Our evidence, though speculative, suggests the
existence of two value-adding, scarcely supplied mechanisms pertaining to managerial capital
(Lucas, 1987). First, an increase in the “social capital” (Burt, 1997) of the start-up—via
access to business and fund-raising connections of the mentors, preferential access to foreign !!!!!!!!!!!!!!!!!!!!!!!!!!!!!!!!!!!!!!!!!!!!!!!!!!!!!!!!!!!!!9!Another potential explanation is that the mechanisms imposed by the program to curb opportunistic behavior (i.e., capital staging) are not enough. However, interview responses by the program’s staff do not render much credibility to this explanation: in only one instance has apparent misuse of funds been reported. Moreover, the reputational consequences of misbehaviour for founders are too high. Bernthal (2015) describes at length the support for the role of reputational concerns mitigating agency costs in the context of business accelerators.

5 !
guest speakers, certification from the program, and entrepreneurial self-efficacy. Second, the
introduction of “structured accountability,” which induced entrepreneurs to report about the
activities they had, during the previous meetings with mentors, committed to execute.
We rule out the alternative explanation of managerial capital improving as a
consequence of “business training,” because entrepreneurs and their assigned mentors
formally meet only four times throughout the program (once a month for approximately one
hour), which suggests improvements in managerial capital in the form of learning how to
conduct business are unlikely to explain the results. Complementing these claims,
interviewed mentees mentioned the certification clout and constant preferential access to their
mentors’ and the program’s staff connections as a key contribution. In addition, interviewed
non-mentored participants argued that access to good connections is a key to success, albeit
very hard to secure, conforming to the idea that participants’ pre-program lack of social
capital is mainly due to supply constraints. Consistent with this view, the work by Hsu (2004)
shows entrepreneurs are willing to pay for affiliation with reputed investors,10 and the work
of Hochberg et al. (2007, 2015) demonstrates that networks are highly important for the
success of early-stage start-up companies.
These additional results, together with evidence of regional positive spillovers of the
program—for example, increased local business incorporation rates in regions and industry
sectors related to the program—allow us to argue the accelerator adds value to the
entrepreneurial community and not only to participants, which is consistent with the work by
Fehder and Hochberg (2014) for the United States. The accelerator offers scarce services and
hence does not appear to be crowding out private market institutions; on the contrary, it likely
“crowds them in” and attracts them by generating and showcasing deal flow. Indeed,
!!!!!!!!!!!!!!!!!!!!!!!!!!!!!!!!!!!!!!!!!!!!!!!!!!!!!!!!!!!!!10!Decisions by participants in the BBC’s show Dragon’s Den also provide informal evidence on the scarcity and consequent value of mentoring. Throughout the show, Peter Jones acquires equity at an average discount relative to offers by other investors. Interviewed participants claim that access to Peter Jones’s connections is worth the discount they part with.!

6 !
following their participation in Start-Up Chile, several start-ups take part in other Chilean
(e.g., Wayra) and external (e.g., 500 Startups) accelerator programs.
The major challenge in the setting was collecting outcome measures for all applicants
to the accelerator. Most applicant start-ups do not appear in standard business data sources,
because they are seldom legally incorporated. Furthermore, the likelihood that these early-
stage start-ups change their business models or “pivot” (see Leatherbee and Katila, 2015) is
quite large, making defining, let alone adequately measuring, post-application performance
difficult. We address this challenge by hand collecting data using extensive web searches
about the start-ups and their founders in fund-raising sites such as AngelList and CrunchBase,
social media sites such as Facebook and LinkedIn, and industry sources such as CBInsights.
One concern with this data-collection method is that participation in the accelerator
may change a start-up’s likelihood of reporting to these sites, irrespective of whether it
actually changes performance (see Drexler, 2014; Berge et al., 2014; de Mel et al., 2014). For
example, Start-Up Chile encourages participants’ use of AngelList (including listing
information of their start-ups in this fund-raising webpage) as a platform for communication
across alumni. We attempt to address this issue in two ways. We cross-check information
retrieved from AngelList with that from other sites, and collected information by directly
surveying participants. We find a significant discrepancy in survival proxies of participants
collected from AngelList and other sources, justifying our cross-checking exercise. We note
that no difference in reporting practices across mentored and non-mentored participants is
evident in the data, likely because these practices are common program-wide and not specific
to the mentor arm. This evidence is reassuring because it suggests differences in reporting are
unlikely to drive mentees’ superior performance.
This paper is related to several strands of the literature. First, a growing body of
literature assesses the value added of early-stage financiers in firms (e.g., Hellman and Puri,

7 !
2000, 2002; Kortum and Lerner, 2000; Kerr et al., 2014; Lerner et al., 2015). This literature
has mostly focused on venture capital and angels. This paper is the first to provide rigorous
evidence for business accelerators. In addition, the setting allows us to advance on
uncovering casual estimates and to trace the impact to specific mechanisms for value
creation: increased managerial capital, likely in the forms of social capital, and structured
accountability. This evidence complements extant work on the importance of networks and
human capital in the private equity industry (Hochberg et al., 2007; Ewens and Rhodes-
Kropf, 2015). Moreover, our paper offers suggestive empirical evidence to complement
recent theoretical perspectives regarding the role of boards for new-venture performance
(Garg, 2013). As such, we distinguish the idea of structured accountability as a distinct
phenomenon in board oversight.
Second, our results complement the several emerging studies on accelerators. These
studies focus on conceptual descriptions of the accelerator model (e.g., Bernthal, 2015;
Cohen, 2013; Cohen and Hochberg, 2014; Kim and Wagman, 2014; Radojevich-Kelley and
Hoffman, 2012), the cognitive and behavioral effects of social interaction (Leatherbee and
Eesley, 2014), emergence of regional early-stage financiers (Fehder and Hochberg, 2014),
and acceleration of new-venture outcomes (Hallen et al., 2104; Yu, 2015; Winston-Smith and
Hannigan, 2015). Our paper provides evidence regarding specific aspects of the accelerator
model—capital, co-working space, and mentorship—and identifies the value-added role of
these services.
Third, our article builds on the literature about firms’ management practices and
business training programs. We provide quasi-experimental evidence that a type of
managerial capital—in the form of social network connections and structured
accountability—would be profitable for start-ups to access, at least in new ventures. Our
results complement those in recent field experiments in developing countries exploring

8 !
returns to business-training interventions (e.g., Drexler et al., 2014; Karlan and Valdivia,
2011; Bruhn and Zia, 2013; Bruhn, Karlan and Schoar, 2012; Karlan, Knight, and Udry,
2012). The evidence from this prior work suggests some of the important factors determining
the impact of business training on self-subsistence businesses are differences in the quality
and intensity of training, the size of the recipient enterprises, and the gender of the founding
manager. Our research contributes to this literature by examining the instructional effect of
mentoring in business-accelerator programs, which focus instead on new ventures.
The rest of this paper is as follows. In section 1, we describe the institutional setting, the
data, and the selection process into the program and the mentor arm. In section 2, we describe
the identification strategy that we use to assess the causal impact of the basic accelerator
services on start-up outcomes, and present results. We explain the methodology we use to
distinguish the casual effect of mentoring, and summarize the results in section 3. In section
4, we discuss the potential impact of the program beyond participants (i.e., treatment on the
treated), and focus on the consequences for the region. Section 5 concludes and summarizes
policy implications.
1. INSTITUTIONAL SETTING: START-UP CHILE
Start-Up Chile is a government-sponsored program launched in August 2010 aimed at
attracting early-stage, high-potential entrepreneurs to bootstrap their ventures in Chile.11 The
program is managed by the Ministry of Economy and is executed by the Chilean Economic
Development Agency (CORFO), the leading organization for promoting innovation and
entrepreneurship in the country. Its main long-term goal is to transform Chile into the
innovation and entrepreneurial hub of Latin America by attracting foreign entrepreneurs into
the country.12 The expectations are that the policy will help domestic entrepreneurs access the
!!!!!!!!!!!!!!!!!!!!!!!!!!!!!!!!!!!!!!!!!!!!!!!!!!!!!!!!!!!!!11 For more details on Start-Up Chile, see Applegate et al.. (2012) and Gonzalez-Uribe (2014). 12! Accelerators often actively recruit founders from areas outside their region: “Many participants in an accelerator program are not local to the community where the program occurs, which creates a magnificent

9 !
resources of foreign entrepreneurial hubs (through their relationships with the foreign
entrepreneurs), increase deal flow for early-stage domestic investors (e.g., angel investors and
venture capital firms), and legitimize the occupation of high-growth entrepreneurship.
The program is designed in the same spirit of a business accelerator. It is a fixed-term,
cohort-based program that offers cash—US$40,000 in equity-free seed capital—and shared
office space to all participants, and additional mentoring services to some.13 Workshops on
business-plan making, coding, and pitch training conducted by cohort peers are held on-site,
and free high-speed Internet access is also provided. At the end of the six-month program,
start-ups “graduate” through a “demo day” (i.e., a formal presentation of the companies to
external investors). Although the program takes no equity stake in participants, it relies on
two mechanisms to mitigate opportunistic behaviour by entrepreneurs: capital staging and
social norms. The capital is delivered in two instalments: 50% at the beginning of the
program, and the remaining 50% three months after, conditional on survival.14 The “socially
integrated financial organization” of business accelerators, which distinguishes them from
incubators, angels, and venture capitalists, gives the accelerator the power to impose high
penalties through general collective sanctions (Bernthal, 2015).
Every six months, 100 competitively selected applicants receive an invitation to
participate in the program. As of August 2015, approximately 1,000 start-ups have
participated in the program, and nearly 6,000 have applied. Participants are required to
relocate to Santiago for the six-month duration of the program and contribute to building an
!!!!!!!!!!!!!!!!!!!!!!!!!!!!!!!!!!!!!!!!!!!!!!!!!!!!!!!!!!!!!!!!!!!!!!!!!!!!!!!!!!!!!!!!!!!!!!!!!!!!!!!!!!!!!!!!!!!!!!!!!!!!!!!!!!!!!!!!!!!!!!!!!!!!!!!!!!!!!!!!!!!!!!!!!!!!!!!!!!!!!!!!!!!!!opportunity for cross-fertilization of talent and start-up experience across the world” (Deering, Cartagena, and Dowdeswell, 2014). 13!Foreign entrepreneurs receive a one-year work visa. The program also helps foreign participants settle in Chile through a “buddy system” that pairs foreign entrepreneurs with local members of the Santiago business community based on interests and language. Local buddies advise participants on opening Chilean bank accounts, registering with the police, obtaining a local ID, and securing housing and mobile phones, and they check in with participants once or twice a month throughout the entrepreneurs’ stay in the country.!14 At the inception of the program, capital disbursements were neither pre-expense nor staged. This system was implemented in the first semester of 2013.

10 !
entrepreneurial culture in Chile through activities of their choosing (i.e., giving a talk at a
school or mentoring a local entrepreneur or student).15
Two months into the program, participants have the option to apply to the
accelerator’s mentor arm—a highly sought-out award. On average, 80% of participants apply.
About 20% of participants are selected into the program’s mentor arm based on a pitch-day
competition. Participants in the mentor arm are paired with experienced mentors. Mentor
assignment follows a rough classification of mentees into industry-based groups. Each group
is assigned between three and five local mentors. The pool of mentors consists mostly of men
(90%), early-stage investors (29%), current and past entrepreneurs (41%), and established
company executives (32%).16 As a consequence of participating in the mentor arm,
entrepreneurs receive a series of exclusive benefits, including one-on-one meetings with the
high-profile guests Start-Up Chile frequently flies in (e.g., Steve Wozniak, Paul Ahlstrom,
Neil Robertson, and Rafael Corrales), and invitations to talk at high-profile public events,
which grant the entrepreneurs greater exposure to potential customers and partners, as well as
an increased feeling of self-confidence and “grandeur,” according to interviewed staff.17
Mentee start-ups meet privately for 30 to 40 minutes with their assigned group of
mentors approximately four times throughout the program (roughly once a month). During
each meeting, a Start-Up Chile staff member takes notes and prepares a list of milestones that
mentees commit to advance toward. The mentees and corresponding mentors review the list
at the beginning of the next monthly meeting, a procedure that increases the accountability of
entrepreneurs’ vis-à-vis mentors. Moreover, mentors may provide entrepreneurs with advice
on overcoming challenges, and make introductions with key business stakeholders (e.g.,
!!!!!!!!!!!!!!!!!!!!!!!!!!!!!!!!!!!!!!!!!!!!!!!!!!!!!!!!!!!!!15!According to several interviewed entrepreneurs, these additional activities are not time consuming, and they do not find themselves forced to take time away from their companies to complete them.!16!Source: http://www.startupchile.org/mentors.!17!Note that these kinds of activities are part of the community service that Start-Up Chile participants are expected to perform. That is, non-mentored participants also must spend time doing community service, but typically do not get access to these high-profile events as part of that service.!
11 !
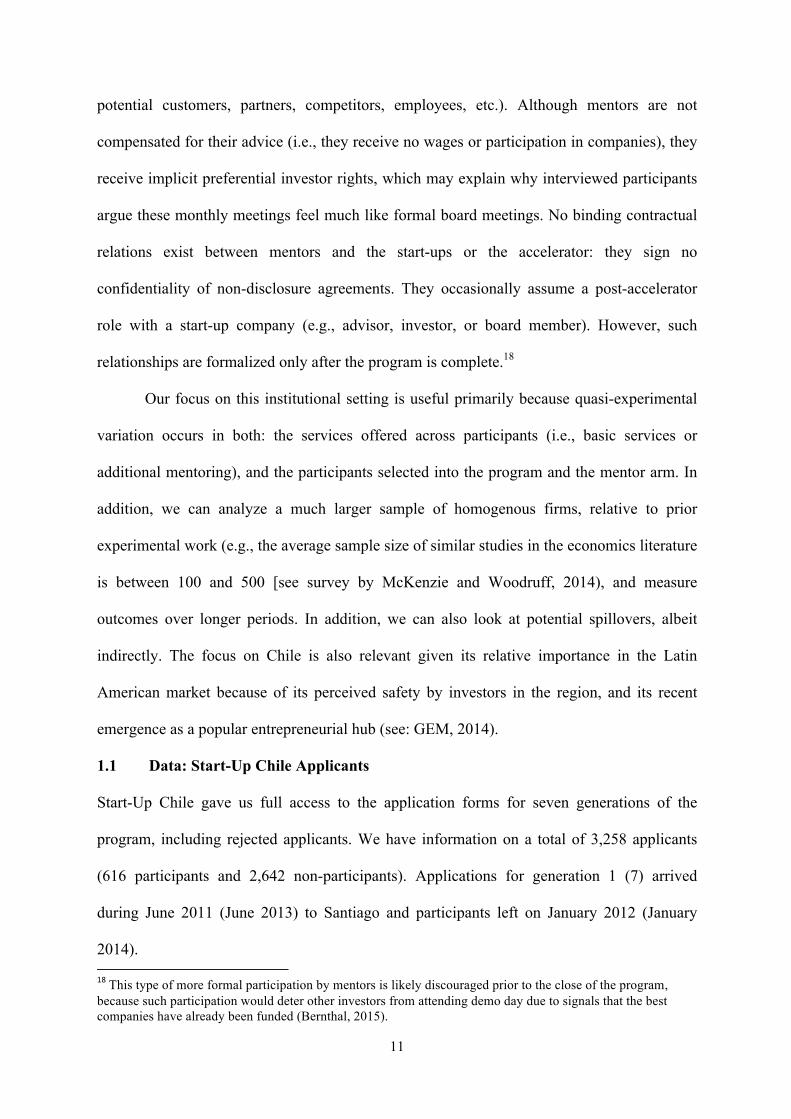
potential customers, partners, competitors, employees, etc.). Although mentors are not
compensated for their advice (i.e., they receive no wages or participation in companies), they
receive implicit preferential investor rights, which may explain why interviewed participants
argue these monthly meetings feel much like formal board meetings. No binding contractual
relations exist between mentors and the start-ups or the accelerator: they sign no
confidentiality of non-disclosure agreements. They occasionally assume a post-accelerator
role with a start-up company (e.g., advisor, investor, or board member). However, such
relationships are formalized only after the program is complete.18
Our focus on this institutional setting is useful primarily because quasi-experimental
variation occurs in both: the services offered across participants (i.e., basic services or
additional mentoring), and the participants selected into the program and the mentor arm. In
addition, we can analyze a much larger sample of homogenous firms, relative to prior
experimental work (e.g., the average sample size of similar studies in the economics literature
is between 100 and 500 [see survey by McKenzie and Woodruff, 2014), and measure
outcomes over longer periods. In addition, we can also look at potential spillovers, albeit
indirectly. The focus on Chile is also relevant given its relative importance in the Latin
American market because of its perceived safety by investors in the region, and its recent
emergence as a popular entrepreneurial hub (see: GEM, 2014).
1.1 Data: Start-Up Chile Applicants
Start-Up Chile gave us full access to the application forms for seven generations of the
program, including rejected applicants. We have information on a total of 3,258 applicants
(616 participants and 2,642 non-participants). Applications for generation 1 (7) arrived
during June 2011 (June 2013) to Santiago and participants left on January 2012 (January
2014). !!!!!!!!!!!!!!!!!!!!!!!!!!!!!!!!!!!!!!!!!!!!!!!!!!!!!!!!!!!!!18!This type of more formal participation by mentors is likely discouraged prior to the close of the program, because such participation would deter other investors from attending demo day due to signals that the best companies have already been funded (Bernthal, 2015).

12 !
Table 1 displays the number of applications judged per generation, as well as the
number of the following: rejections (i.e., no offer is extended by the program), selected
participants (i.e., an offer is extended by the program), participants (i.e., the start-up accepts
the offer), pitch-day competitors (i.e., start-up competed to get accepted into the mentor arm),
and mentored participants (i.e., ventures that took part in the mentor arm).19 The proportion of
accepted applicants dropped from roughly 31% in generation 1 to approximately 7% from
generation 5 onward, reflecting the increasing legitimization of the program in the
international entrepreneurship community.20
We retrieved start-ups’ and participants’ characteristics from the application forms.
Table 1 describes the applicants to Start-Up Chile by start-up characteristics. Roughly 23% of
applicants have raised external financing prior to their application (Panel B),21 76% have
more than one full-time employee (Panel C), 70% don’t yet have a working prototype (Panel
E), and 56% are less than six months old (Panel F). As is natural, applicant start-ups are
concentrated in IT related sectors22—E-commerce (13%), IT& Enterprise Software (12%),
!!!!!!!!!!!!!!!!!!!!!!!!!!!!!!!!!!!!!!!!!!!!!!!!!!!!!!!!!!!!!19!The program imposes no restrictions on reapplications. Hence, we had to make a decision on how to deal with re-appliers. Because of their small size, they constitute less than 5% of the sample; we kept them in our main analysis. Results are immaterially unchanged if we remove them from the sample. 20!The program’s legitimization is also evident from the evolution of participants presented in Table 1. Over time, the fraction of applicants with no previous financing goes from 85% to 64%, and most of this difference corresponds to an increase in those having risen between US$500,000 – US$1M. Start-up size also increases over time: one-worker start-ups go from 31% in generation 4 to 17% in generation 7, with most of the increase in those with more than two employees. Although changes in start-up development stage cannot explain these differences, they may be associated with changes in industry composition, which shifted out of E-commerce and IT and into education, media, and tourism throughout the sample. 21!The application format was changed at the start of generation 2. By mistake, the new form did not include information about capital raised. This mistake was corrected for generation 3. As a result, no information on capital raised is available for applicants of generation 2.!22! Heterogeneity is present in the number of start-ups reporting a missing industry classification. Missing observations spike during generations 5 and 7, possibly because of the application format used at the time. !

13 !
Mobile and Wireless (7%), and Social Media (9%)23—for which US$40,000 in seed capital is
more likely to compensate the associated costs of relocating to Santiago, Chile (Panel D).24
[INSERT TABLE 1 HERE]
Table 2 describes the composition of the sample based on founder characteristics.
Chileans constitute 20.7% of all applicants (Panel A) ranging from 2% in generation 1 to
31% in generation 5. During generation 1, Chileans were explicitly denied participation,
because the program officials desired to build a sufficiently large international presence to
successfully attract foreign talent. During generations 6 and 7, the fraction of Chilean
applicants decreased substantially, mostly because of a dramatic increase in applicants from
Asia (70%).
[INSERT TABLE 2 HERE]
For the empirical analysis, we pool all generations. Although we acknowledge that the
average quality of start-ups applying to the accelerator is likely to change over time, and we
control for these potential changes parametrically, we analyze pooled data because of
statistical power considerations. Table 3 displays the summary statistics for applicants’
characteristics. The average applicant is 30.3 years old, is 20% likely to be Chilean, 14%
likely to be female, has founded a start-up with 2.5 full-time employees, is 20% (49%) likely
to have raised external financing (have a working prototype in development), and is more
likely than not (56%) to have been funded in the six months before the application.25, 26
1.2 Performance Metrics
!!!!!!!!!!!!!!!!!!!!!!!!!!!!!!!!!!!!!!!!!!!!!!!!!!!!!!!!!!!!!23 This industry composition contrasts the distribution of local Chilean micro entrepreneurs, whose businesses tend to belong to the retail, restaurant, and hotel (34%), agriculture and fishing (24%), and manufacturing (13%) sectors. Source: Survey on Chilean Micro entrepreneurs (EME), 2012. 24 The initial costs for this type of start-up amount to the salaries of coders, which are not very high, because most compensation is traditionally in stock. In an interview, Amit Aharoni from Cruise Wise claimed that “it made sense to us to go to Start-Up Chile, one doesn’t need to be in Silicon Valley to code.” 25 These percentages are calculated as a fraction of all applicants, not only those reporting age and gender. The corresponding percentages in that case are 62% and 8%. 26 By contrast, the average micro-entrepreneur in Chile tends to be older, on average 37.5 years old (74% report they are responsible for a home), and is more likely to be female (roughly 30%). Source: EME, 2012.

14 !
Collecting performance measures for all applicants to the accelerator is particularly
challenging. Because most of the applicants are fledgling businesses, they are not registered
in standard business data sources. Furthermore, the likelihood that the applicant start-ups
change their names or pivot their business models entirely is quite large, making defining and
measuring post-application performance difficult. We address these challenges by hand
collecting data using extensive web searches about the start-ups and their founders in fund-
raising sites and industry sources. One concern with this data-collection method is that
participation in the accelerator may change the reporting likelihood of start-ups, irrespective
of whether it actually changes performance (see Drexler, 2014; Berge et al., 2014; de Mel et
al., 2014). We address this issue by cross-checking information retrieved from the different
sources, as will be described below.
We develop three categories of outcomes: venture survival, venture scale, and venture
financing. Table 3 presents summary statistics.
[INSERT TABLE 3 HERE]
1.2.1 Venture Survival
Our simplest performance measures are binary indicator variables for start-up survival as of
January 2014 (short-term survival) and June 2015 (long-term survival), which are a minimum
of six months and two years after potential arrival to the accelerator. We collect information
on both short-term and long-term survival, because results from evaluations of business-
training programs in the developing world suggest short- and long-term effects differ
substantially (Mckenzie and Woodruff, 2014). For mentoring, one might expect firms to
make some relatively quick changes after their meetings with mentors. However, the full
impact may take some time to materialize. By contrast, start-ups may adopt some specific
practices from the interaction with mentors, only to drop them over time. Therefore, measures

15 !
of long-term survival may miss the period of experimentation. We develop these measures
through several data sources.
First, we searched for the names of the companies in AngelList and CrunchBase, both
of which are webpages used to advertise venture activity and fund-raising.27 Second, we
looked for evidence of the venture’s survival in the industry database CB Insights. Finally,
we examine every venture website, as reported in the application.
We remark that neither the existence of a webpage nor of a profile in AngelList is
sufficient for identifying survival. Some ventures leave a website running after closing
operations. Because the program encourages participants to use AngelList as a platform for
communication with alumni, we cross-check information retrieved from this source with all
other available sources. We find a significant discrepancy in survival proxies of participants
collected from AngelList and other sources, justifying our cross-checking exercise. No
difference in reporting practices across mentored and non-mentored participants is evident in
the data, likely because using AngeList is a common program-wide practice and not specific
to the mentor arm.
1.2.2 Venture Scale
Our second set of metrics quantifies the venture scale after the potential participation in the
accelerator program. Although we would ideally consider a broad range of performance
variables, such as sales and product introductions, obtaining data on early-stage private
ventures is extremely challenging, especially for non-incorporated or unfunded ventures. We
are able to employ two outcome variables: employment and size of customer base.28
!!!!!!!!!!!!!!!!!!!!!!!!!!!!!!!!!!!!!!!!!!!!!!!!!!!!!!!!!!!!!27!AngelList is a US website for start-ups, angel investors, and job seekers looking to work at start-ups. The site allows start-ups to create profiles and raise money from angel investors free of charge (https://angel.co/). See also Bernstein et al. (2015). Crunchbase is a data set of start-up activity managed by TechCrunch, a leading technology media property, dedicated to profiling start-ups, reviewing new Internet products, and covering technology-related news (https://www.crunchbase.com/). !28 We also attempted to construct measures of website traffic. We used both Google insights and Alexa. On close inspection, we discovered the data were rather noisy. For Google insights, we relied on searches made of the company name, which is not a very accurate approach. Start-ups with names based on common search words

16 !
We consider the employment level of the venture in January 2014. We collected
employment measures using LinkedIn (January 2014) and AngelList (June 2015).29 We first
retrieved team size from AngelList and cross-checked it with information from companies’
profiles in LinkedIn. We then retrieved information on the number of employees according to
LinkedIn, reported in ranges. We had to transform these ranges into point estimates. We
applied a consistent rule to all ventures within the specified range. The chosen point estimates
correspond to the minimum firm size in the range (e.g., we assigned an employment level of
1 when the reported range was 1-10 employees, and 11 if the reported range was 11-50
employees). We further coded the employment levels of closed ventures with a zero value.
We faced the question of how to code employment levels for very successful start-ups. These
outliers with more than 50 employees can have large effects on the outcomes. To address this
issue, we cap the maximum employment level at 50 employees. The results are robust to
using a cap of 100 employees.
Using a maximum of 11-50 employees, the average applicant had 0.53 employees by
January 2014 versus 2.46 employees at the time of application. The average decrease reflects
the attrition rate (e.g., when we assign an employment level of 5 when the reported range was
1-10 employees, the average number of employees is still smaller than at the time of
application).30
We also want to measure sales, but acquiring the ongoing operational data of early-
stage ventures is challenging. However, we are able to use information from Facebook to
!!!!!!!!!!!!!!!!!!!!!!!!!!!!!!!!!!!!!!!!!!!!!!!!!!!!!!!!!!!!!!!!!!!!!!!!!!!!!!!!!!!!!!!!!!!!!!!!!!!!!!!!!!!!!!!!!!!!!!!!!!!!!!!!!!!!!!!!!!!!!!!!!!!!!!!!!!!!!!!!!!!!!!!!!!!!!!!!!!!!!!!!!!!!!were naturally associated with a high ranking. For Alexa, the limitation was that the data are primarily collected by tracking the browsing patterns of web users who have installed Alexa Toolbar, a piece of software that attaches itself to a user’s Internet browsers and records in detail the user’s website. This collection method can introduce biases for certain types of ventures, in particular those that are not US based. Only 20% of the sample is US based, and a disproportionate fraction is selected into the program, potentially biasing this scale measure upward.!29! LinkedIn is a business-oriented social networking service. It allows companies to create profiles free of charge and advertise their company, particularly to potential job seekers. For example, companies can advertise job openings (http://www.linkedin.com/).!30!One potential explanation is that applicants lie about the number of full-time employees in the hope of increasing their chance of being selected by the accelerator.
17 !
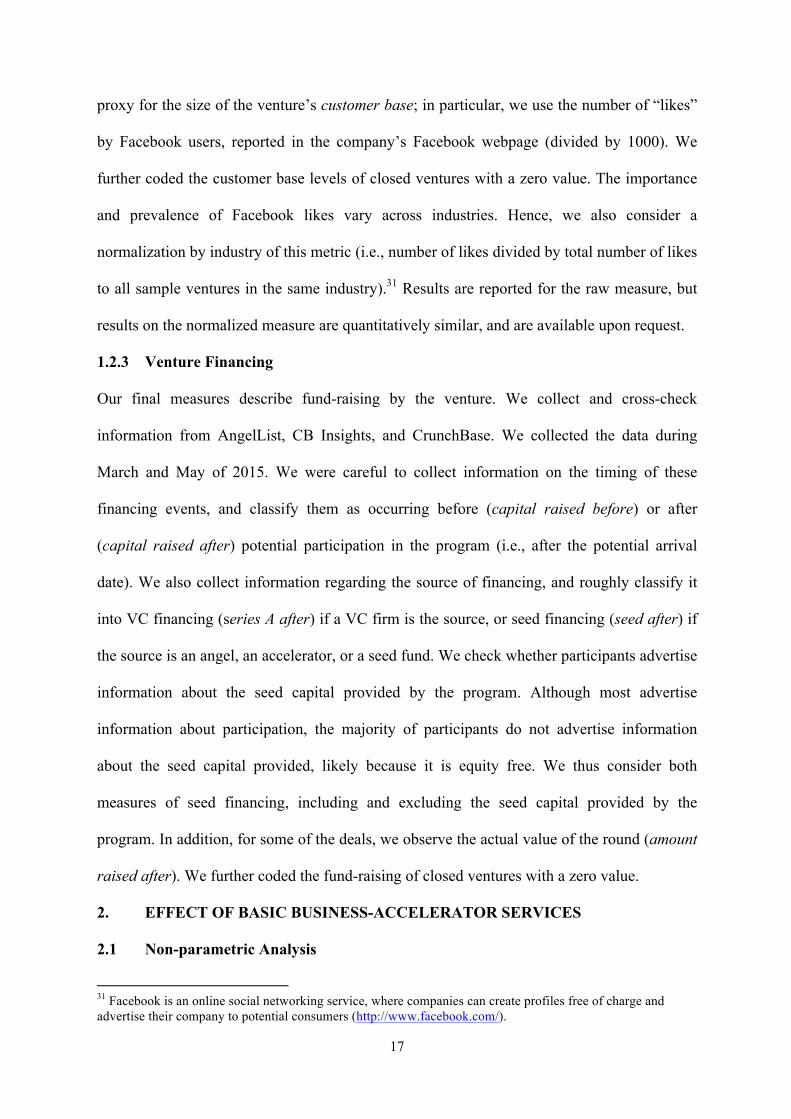
proxy for the size of the venture’s customer base; in particular, we use the number of “likes”
by Facebook users, reported in the company’s Facebook webpage (divided by 1000). We
further coded the customer base levels of closed ventures with a zero value. The importance
and prevalence of Facebook likes vary across industries. Hence, we also consider a
normalization by industry of this metric (i.e., number of likes divided by total number of likes
to all sample ventures in the same industry).31 Results are reported for the raw measure, but
results on the normalized measure are quantitatively similar, and are available upon request.
1.2.3 Venture Financing
Our final measures describe fund-raising by the venture. We collect and cross-check
information from AngelList, CB Insights, and CrunchBase. We collected the data during
March and May of 2015. We were careful to collect information on the timing of these
financing events, and classify them as occurring before (capital raised before) or after
(capital raised after) potential participation in the program (i.e., after the potential arrival
date). We also collect information regarding the source of financing, and roughly classify it
into VC financing (series A after) if a VC firm is the source, or seed financing (seed after) if
the source is an angel, an accelerator, or a seed fund. We check whether participants advertise
information about the seed capital provided by the program. Although most advertise
information about participation, the majority of participants do not advertise information
about the seed capital provided, likely because it is equity free. We thus consider both
measures of seed financing, including and excluding the seed capital provided by the
program. In addition, for some of the deals, we observe the actual value of the round (amount
raised after). We further coded the fund-raising of closed ventures with a zero value.
2. EFFECT OF BASIC BUSINESS-ACCELERATOR SERVICES
2.1 Non-parametric Analysis
!!!!!!!!!!!!!!!!!!!!!!!!!!!!!!!!!!!!!!!!!!!!!!!!!!!!!!!!!!!!!31 Facebook is an online social networking service, where companies can create profiles free of charge and advertise their company to potential consumers (http://www.facebook.com/).
18 !
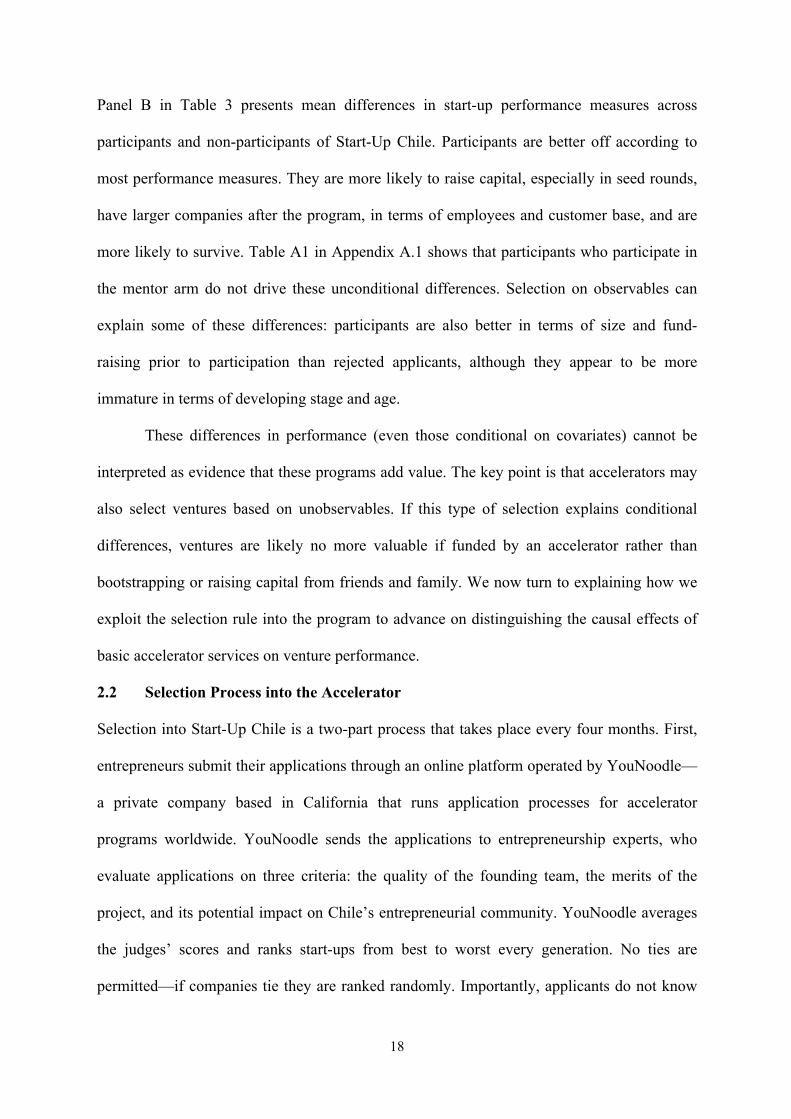
Panel B in Table 3 presents mean differences in start-up performance measures across
participants and non-participants of Start-Up Chile. Participants are better off according to
most performance measures. They are more likely to raise capital, especially in seed rounds,
have larger companies after the program, in terms of employees and customer base, and are
more likely to survive. Table A1 in Appendix A.1 shows that participants who participate in
the mentor arm do not drive these unconditional differences. Selection on observables can
explain some of these differences: participants are also better in terms of size and fund-
raising prior to participation than rejected applicants, although they appear to be more
immature in terms of developing stage and age.
These differences in performance (even those conditional on covariates) cannot be
interpreted as evidence that these programs add value. The key point is that accelerators may
also select ventures based on unobservables. If this type of selection explains conditional
differences, ventures are likely no more valuable if funded by an accelerator rather than
bootstrapping or raising capital from friends and family. We now turn to explaining how we
exploit the selection rule into the program to advance on distinguishing the causal effects of
basic accelerator services on venture performance.
2.2 Selection Process into the Accelerator
Selection into Start-Up Chile is a two-part process that takes place every four months. First,
entrepreneurs submit their applications through an online platform operated by YouNoodle—
a private company based in California that runs application processes for accelerator
programs worldwide. YouNoodle sends the applications to entrepreneurship experts, who
evaluate applications on three criteria: the quality of the founding team, the merits of the
project, and its potential impact on Chile’s entrepreneurial community. YouNoodle averages
the judges’ scores and ranks start-ups from best to worst every generation. No ties are
permitted—if companies tie they are ranked randomly. Importantly, applicants do not know

19 !
who their judges are, nor do they know their position in the rank; thus, they are unable to
manipulate their ranking.
Four to five experts are randomly assigned per application. They are selected from
YouNoodle’s network, which is comprised of circa 200 entrepreneurship experts—roughly
40% from Silicon Valley, 25% from Latin America, 20% from EMEA, and 10% from the rest
of the United States. Each expert evaluates approximately 10 start-ups per generation, does
not know the identity of other judges evaluating the same start-ups, and no single judge
observes all applications. Thus, judges are unlikely to be able to precisely manipulate the
ranking (e.g., to help an applicant friend qualify).
A committee at CORFO handles the second part of the selection process, making the
final decision based on YouNoodle’s ranking. A capacity threshold is pre-specified each
round (normally 100), and the top-ranking companies—those ranking higher than the
threshold—are selected.32 The threshold corresponds to the predetermined size of the
program, and CORFO determines the threshold as a function of its budget before the
application process begins. No perfect compliance with the selection rule is evident in the
data: not all participants who rank higher than the 100th company threshold end up
participating in the program, nor do all accepted participants rank higher than the threshold
venture (of the top 100 ranked applicants, typically only 75% are accelerated). Two reasons
explain the less-than-perfect compliance: (1) government officials have their own agenda—
businesses in sectors traditional to the Chilean economy are usually not selected, and
preference is given to new ventures; and (2) some selected applicants ultimately reject the
offer. In the latter case, other candidates, usually ranking lower, are selected. For example,
although start-ups ranking higher than the capacity threshold (and ranking within 50 spots
!!!!!!!!!!!!!!!!!!!!!!!!!!!!!!!!!!!!!!!!!!!!!!!!!!!!!!!!!!!!!32!The threshold has been 100 in every generation except the second generation, where the threshold was set at 150.!

20 !
from it) are 26% more likely to participate in the program than those ranking lower, they are
31% more likely to be selected and offered a spot.33
Panel A in Table 1 illustrates some of the discrepancies in the selection rule: across
generations, the capacity restriction never binds. In generations 5 and 6, extra offers were
extended to make up for rejections. Ideally, the program would have kept records of the order
in which the offers were made, but it did not. Finally, the first generation had an unusually
low number of selected start-ups: program officials deemed start-up quality insufficient. By
contrast, we see an almost four-fold increase in the number of judged applications for
generation 2 (due to the popularization of the program), motivating the program’s officials to
increase the capacity threshold to 150 places. After this experiment, the capacity threshold
dropped to 100 in later generations because the program’s officials deemed that 150 start-ups
greatly surpassed a reasonable use of the building that hosted the entrepreneurs during their
tenure in Start-Up Chile.
Although strict compliance of the selection rule does not occur, the program’s
reliance on a capacity threshold implies the probability of acceleration changes
discontinuously as a function of the ranking, as shown in Figure 1. The figure plots the
fraction of participating applicants against the normalized rank, as defined by the ranking of
the start-up minus the generation’s predetermined size of the program (i.e., 100 for all
generations except generation 2, which had a capacity threshold of 150). The average
participation rates are calculated across bins of 10 ranks and plotted in dots. The discontinuity
in probability of participation around the capacity threshold is visible in the figure. !!!!!!!!!!!!!!!!!!!!!!!!!!!!!!!!!!!!!!!!!!!!!!!!!!!!!!!!!!!!!33!To explore this point further, we attempted a classification of companies into “desirable” and “non-desirable” industries based on the self-reported industry in the application. Roughly, the idea was to re-estimate the size of the jump and the average probability of acceleration on either side of the threshold if start-ups that were obviously not going to be accepted into the program because of the policy agenda (“non-desirable” industries) were excluded from the sample and the remaining start-ups were re-ranked. Using this procedure, we estimate a much higher jump and a much lower participation rate for start-ups ranking lower than the capacity threshold (based on the re-rank). Because the industry classification is too broad and several applicants self-classify into the “Other” industry sector (see Figure A1 in Appendix A.1), we had to base the classification on the pitch reported the application, making the procedure somewhat subjective. Thus, to conserve space, we do not report the procedure here.!

21 !
[INSERT FIGURE 1 HERE]
We estimate the size of the discontinuity using the following equation:
(1) !""#$#%!&'()! = ! + !ℎ!"ℎ!"! + ! !"#$! − !"#$%%! + !! + !!,
where s indexes start-ups, ℎ!"ℎ!"! is a dummy that equals 1 if the start-up ranks higher than
the threshold, and !! is a vector of controls including start-up and founder characteristics. We
include in the estimation a fourth-degree polynomial of the normalized rank (i.e., ! !"#$! −
!"#$%%! , where ! indexes generation), which controls for all non-linearities in the
probability of selection and the ranking.34 Figure 1 plots the fitted values and 90%
confidence interval from this equation. The vertical line represents the capacity threshold. As
per visual inspection, a discontinuity is present in the probability of participation around the
cut-off, which is sizable and significant. The vertical difference in the estimated probability
of acceleration across the threshold corresponds to ! in equation (1), the size of the
discontinuity.
Table 4 presents estimates of ! across different specifications of equation (1):
including only the polynomials as controls (column 1), adding generation fixed effects
(column 2), adding covariates (column 3), allowing the polynomial controls to differ in either
side of threshold (column 4), and restricting the sample to a window of 73 observations
around the cut-off—except generation 2, which includes 75 observations—as calculated
using the optimal bandwidth procedure of Calonico et al. (2014) and differentially weighting
observations using a triangular kernel (column 5). The coefficient in column (3) implies that
ranking higher than the capacity threshold increases the probability of acceleration by 21%,
relative to other start-ups in the same generation and controlling for observable differences
across start-ups (e.g., nationality and gender of founder). The estimated effect is robust across
!!!!!!!!!!!!!!!!!!!!!!!!!!!!!!!!!!!!!!!!!!!!!!!!!!!!!!!!!!!!!34 The polynomial is evaluated on !"#$! − !"#$%%! so that the coefficient on higher! corresponds to the effect of the selection rule on participation at the cut-off.

22 !
the columns: it is significant at the 1% level (except in the last column, in which it is
significant at the 5% level) and stable throughout.
[INSERT TABLE 4 HERE]
We note the relatively poor fit of the polynomial for companies ranking around 150,
which is not mechanically driven by including generation 2 in the data. The estimated
participation probability for companies ranking in positions 150, 155, and 159 is lower than
the observed probability of 0.6 across generations 3 to 8. In unreported analysis, we checked
whether the participants ranking in these positions are observationally different (they are not)
and whether a discontinuity exists here (it doesn’t). Alternative explanations for the poor fit
include a statistical issue (i.e., we have information about only 7 generations and it so
happens that in this sample start-ups ranking around 150 are comparatively of good quality)
and checking thresholds by program officials (i.e., start-ups around 150 and 160 constitute
the final checking threshold for judges, such that if some spots are still available, they are
filled in with these).
2.3 Exploiting the Selection Rule to Estimate the Causal Effect of Basic Accelerator
Services
The discontinuity in the probability of acceleration driven by the capacity threshold shown in
Figure 1 can be used to advance on distinguishing the causal effect of basic accelerator
services. The key intuition is that the dramatic change in the probability of acceleration
around the threshold is likely continuously related to performance. Hence, the difference in
expected outcomes between start-ups on opposite sides of but sufficiently near the threshold
provides the basis for an unbiased treatment-effect estimate.
More formally, we are interested in the effect of acceleration on venture outcomes, as
summarized by the following equation:
(2) !"#$!%&! = ! + ! ∙ !""#$#%!&'()! + !!,

23 !
where the coefficient ! is the effect of acceleration on an outcome of interest (e.g., survival),
and !! represents all other determinants of performance (where ! !! = 0). The problem
with estimating a regression such as (2) is that selection into the accelerator may be
endogenous to the start-up’s performance (e.g., the accelerator picks start-ups with higher
performance potential, and hence ! !""#$#%!&'()!!, !! ≠ 0), in which case, the ordinary
least squares (OLS) estimate of ! in equation (2) is biased.
2.3.1 The Fuzzy RDD
To obtain a consistent estimate of !, we would ideally want participation in the accelerator to
be a randomly assigned variable. The selection process at the accelerator approximates this
ideal setup: conditional on ranking within a sufficiently small interval around the cut-off,
ranking above the capacity threshold is as good as random.
We exploit this characteristic of the selection process using a fuzzy RDD. Intuitively,
the RDD approach compares outcomes of participants ranking closely above and below the
threshold. Heuristically, because observations immediately to one side of the threshold are
unlikely to differ in systematic ways from the observations immediately to the other side, the
former group acts as a valid control for the latter.35
In practice, we replace equation (2) with the following system of equations:
(3) !""#$#%!&'()! = ! + !ℎ!"ℎ!"! + ! !"#$! − !"#$%%! + !!,
(4) !"#$!%&! = ! + !!""#$#%!&'()! + ! !"#$! − !"#$%%! + !!,
where !"#$! − !"#$%%! is the normalized ranking of the start-up, and we instrument
!""#$#%!&'()! with the selection rule—a dummy that equals 1 if the project is ranked higher
than the threshold (ℎ!"ℎ!"!)—while controlling for potential nonlinearities of the ranking
using high-order polynomials (i.e., ! . !!"#!! . ).
!!!!!!!!!!!!!!!!!!!!!!!!!!!!!!!!!!!!!!!!!!!!!!!!!!!!!!!!!!!!!35!Instead,!comparing participants with rejected applicants, even if focusing only on those around the threshold, is biased because these groups likely differ along unobservables related to outcome.!

24 !
We carry out the estimation of this system using a two-stage least squares approach.
In theory, with enough data, one could focus on the area just around the threshold for
inferences. In practice, this approach is problematic because a sufficiently small region will
likely run into power problems. We emphasize power (over bias) by using all of the data,
borrowing strength from observations far from the cut-off to estimate the average outcome
for observations near it. We mitigate the potential bias introduced by this borrowing through
observable control variables and in particular high-order polynomials of the ranking (e.g.,
Lee and Lemieux 2010). As is well known, the cost of using this approach is that results may
be more dependent on functional form (e.g., Gelman and Imbens, 2014). Thus, an important
consideration is the choice of polynomial order. Although the statistics literature offers some
help in the form of generalized cross-validation procedures (e.g., van der Klaauw, 2002;
Black, Galdo, and Smith, 2007), the correct order is ultimately unknown. Our approach here
is to show our results are robust to using different polynomial orders.36
As with all IV estimators, inference based on the fuzzy RDD is restricted to those
observations affected by the instrument—compliers (i.e., those applicants who end up
accelerated because they ranked above the cut-off). Offsetting this restriction are the
relatively mild conditions required for identification. To be precise, the nonlinear relation in
equation (1) provides for identification of the local average treatment effect (LATE) (Imbens
and Angrist, 1994) provided (i) local continuity in potential outcomes exists (i.e., potential
outcomes for subjects just below the threshold are similar to those just above the threshold)
and (ii) the treatment and the assignment rule are jointly independent from the ranking near
the threshold (Roberts and Whited, 2013).
!!!!!!!!!!!!!!!!!!!!!!!!!!!!!!!!!!!!!!!!!!!!!!!!!!!!!!!!!!!!!36!We attempted to use an alternative approach based on local linear regressions (e.g., Hahn, Todd, and van der Klaauw, 2001). This approach discards observations beyond some bandwidth h away from the cut-off and estimates low-degree polynomial regressions on the remaining observations (e.g., Gelman and Imbens, 2014). Several methods to choose the bandwidth exist; we used the approach by Calonico et al., (2014). Although our results continue to hold when using this alternative method, due to the small sample size, we rely on the high-order polynomial approach, because with the local linear regression method, we run into power limitations.!

25 !
We provide support for the identification assumptions (i) and (ii). The first condition
is equivalent to assuming a continuous distribution of !! at the ranking cut-off. Following
Lee and Lemieux (2010), we test whether the data reject this assumption, by inspecting the
cross-sectional distribution of observed pre-treatment variables at the cut-off. We estimate
equation (4) using the covariate instead of acceleration as the dependent variable, and test for
a potential discontinuity. Figure 2 shows the fitted values and confidence interval. Visual
inspection suggests no statistical discontinuities are present in the cross-sectional
distributions of any of these variables around the capacity threshold (results removed for
space and available upon request).
[INSERT FIGURE 2 HERE]
An important consideration for the second condition to hold is the ability of subjects
to manipulate the forcing variable and, consequently, their assignment to treatment and
control groups. As argued previously, neither the start-ups nor the judges are likely to
precisely manipulate their ranking near the cut-off. Indeed, the distribution of application
scores is relatively smooth around the capacity threshold, as is verified by visual inspection
of the application-score histogram shown in Figure 3. More formally, McCrary (2008)
provides a statistical test of continuity in the density of participants at the threshold. We
cannot reject the null hypothesis of no discontinuity in the distribution of the normalized
application scores at the threshold: the t-statistic from the McCrary test is -0.262.37
[INSERT FIGURE 3 HERE]
Finally, given the sizable fraction of rejected offers, one natural concern may be that
applicants near the threshold self-select into accepting the offers made by Start-Up Chile
(e.g., applicants with the better options do not accept Start-Up Chile’s offer). However, Hahn,
!!!!!!!!!!!!!!!!!!!!!!!!!!!!!!!!!!!!!!!!!!!!!!!!!!!!!!!!!!!!!37!We note that the test is run using the application scores as opposed to the application ranking, because by construction, the histogram representation of the ranking is a flat line. We use information on the application scores for generations 1 through 6. Start-Up Chile provided no information on the application scores for generation 7.
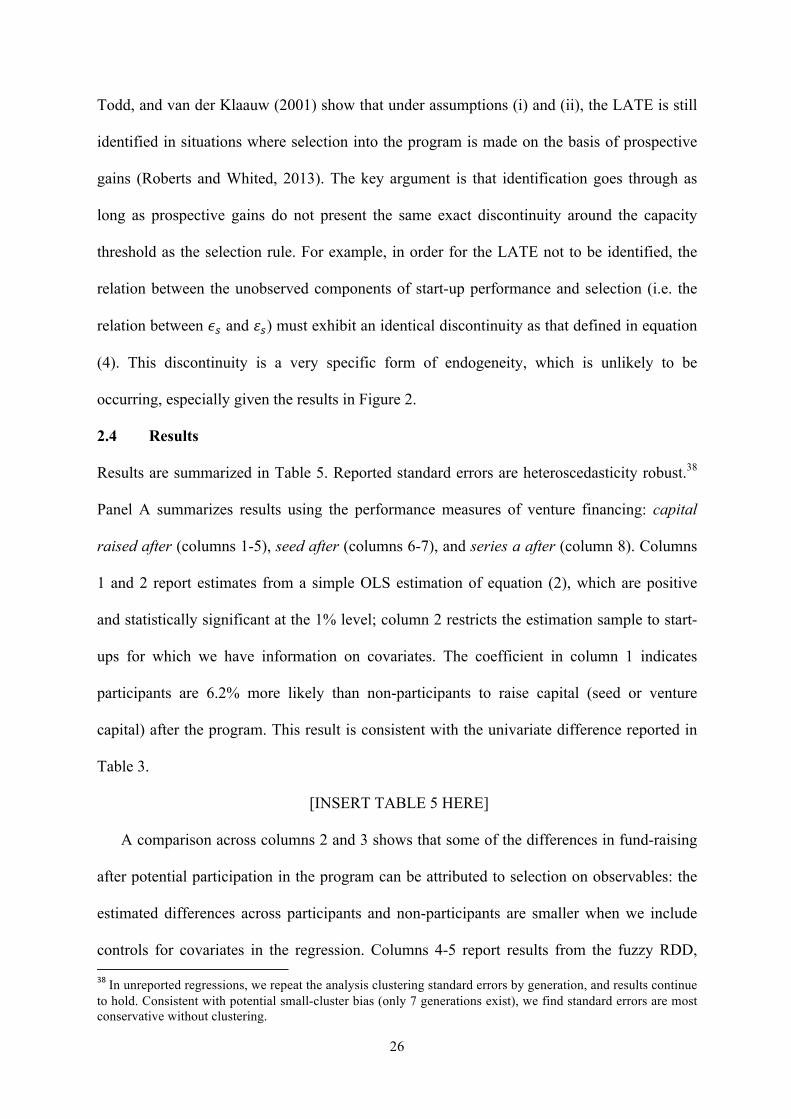
26 !
Todd, and van der Klaauw (2001) show that under assumptions (i) and (ii), the LATE is still
identified in situations where selection into the program is made on the basis of prospective
gains (Roberts and Whited, 2013). The key argument is that identification goes through as
long as prospective gains do not present the same exact discontinuity around the capacity
threshold as the selection rule. For example, in order for the LATE not to be identified, the
relation between the unobserved components of start-up performance and selection (i.e. the
relation between !! and !!) must exhibit an identical discontinuity as that defined in equation
(4). This discontinuity is a very specific form of endogeneity, which is unlikely to be
occurring, especially given the results in Figure 2.
2.4 Results
Results are summarized in Table 5. Reported standard errors are heteroscedasticity robust.38
Panel A summarizes results using the performance measures of venture financing: capital
raised after (columns 1-5), seed after (columns 6-7), and series a after (column 8). Columns
1 and 2 report estimates from a simple OLS estimation of equation (2), which are positive
and statistically significant at the 1% level; column 2 restricts the estimation sample to start-
ups for which we have information on covariates. The coefficient in column 1 indicates
participants are 6.2% more likely than non-participants to raise capital (seed or venture
capital) after the program. This result is consistent with the univariate difference reported in
Table 3.
[INSERT TABLE 5 HERE]
A comparison across columns 2 and 3 shows that some of the differences in fund-raising
after potential participation in the program can be attributed to selection on observables: the
estimated differences across participants and non-participants are smaller when we include
controls for covariates in the regression. Columns 4-5 report results from the fuzzy RDD, !!!!!!!!!!!!!!!!!!!!!!!!!!!!!!!!!!!!!!!!!!!!!!!!!!!!!!!!!!!!!38!In unreported regressions, we repeat the analysis clustering standard errors by generation, and results continue to hold. Consistent with potential small-cluster bias (only 7 generations exist), we find standard errors are most conservative without clustering.!

27 !
with and without controlling for covariates (note that inclusion of covariates in the RDD is
not necessary, but doing so can increase precision of the estimates). To conserve space, we do
not include the estimates for the polynomial terms. None of the estimated coefficients are
statistically significant.
One potential explanation for why the estimated coefficients are not significant is that we
don’t have enough statistical power to reject the null (i.e., no statistical ability to distinguish
the estimate effect from zero). To explore this possibility, and using standard sample-size
calculation methodologies (see McKenzie, 2010), we report in the last row of the table
estimates of the sample size needed to distinguish the reported effects from zero. Across all
columns in the table (except column 8), the sample size is large enough for us to distinguish
the estimated effect with an 80% probability.39
Panels B and C in Table 5 analyze the impact on measures of venture scale and survival.
The same pattern holds for these other outcome measures: participants outperform non-
participants, and selection-on-observables by the program can explain some of this
outperformance. The outperformance is, however, no longer significant, and the numerical
estimates are close to zero when we use the RDD approach. In the vast majority of
circumstances, we appear to have enough power to reject the null.
2.4.1 Robustness Checks
In an unreported analysis, we check the robustness of the results using different degree
polynomials and allowing polynomials to differ on either side of the threshold. Results are
similar across the different specifications; that is, OLS estimates are positive and significant,
and fuzzy RDD estimates are not significant, quantitatively smaller than the OLS estimates,
and often negative. Results also continue to hold if we exclude observations from generations
1 and 2 and all mentored participants. Finally, in unreported results, we look at potential
!!!!!!!!!!!!!!!!!!!!!!!!!!!!!!!!!!!!!!!!!!!!!!!!!!!!!!!!!!!!!39!We use the STATA command sampsi and the mean and standard deviation of the sample of non-participants as the baseline, as well as the observed sample-size ratio (participants vs. non participants). !

28 !
heterogeneity of the effect across several founder and start-up characteristics such as gender,
nationality, and age. We find no clear patterns in the data.
2.5 Why Did Basic Accelerator Services of Cash and Co-working Space Have No
Impact (on Compliers)?
Other than the null hypothesis being true (i.e., basic accelerator services add no value), one
potential explanation is that compliers are of heterogeneous quality and the program
accelerated the success of some but the demise of others, with a resulting zero average effect.
Indeed, returns to capital in start-ups may not always be positive. For example, cash infusions
may lead founders to discover fundamental flaws in their prototypes, inducing them to shut
down the venture (Yu, 2015), or lead founders to discover substantially different
opportunities that justify pivoting or starting a different venture than originally planned
(Leatherbee and Katila, 2015).40
We explore the validity of this potential explanation by conducting analysis at the
founder level as opposed to the start-up level. Only observing failed ventures (ignoring new
ventures created after the program) precludes insights regarding the pursuit of better
opportunities by entrepreneurs. In particular, we examine the persistence of the
“entrepreneurial occupation” by recording whether founders were still entrepreneurs after
potential participation in the program.41 We collected information on the occupations of
founders from LinkedIn, using searches based on the founder’s name and cross-checked for
location. The key distinction of this analysis is that it allows us to identify survival not only
of the application company, but also instances in which another venture replaces the
application company, likely because of the program’s influence. Consistent with this
potential explanation, we find suggestive evidence that the program has a permanent effect on
the entrepreneurial occupation of founders: compliers are relatively more likely to remain as !!!!!!!!!!!!!!!!!!!!!!!!!!!!!!!!!!!!!!!!!!!!!!!!!!!!!!!!!!!!!40!For example, in Appendix A.3. we document that 20% of surveyed applicants self-declare to have pivoted their company since the application to the program. 41 We recorded occupations as entrepreneur, student, analyst, and consultant.

29 !
entrepreneurs after the program (see Appendix A.2). These additional results suggest we may
be underestimating the treatment effect of the accelerator (because we are not including the
performance measures of the ventures that pivoted into new start-ups). They also have
important implications for the design of future evaluations of early-stage entrepreneurship
programs: more effort should be placed on collecting information and measuring the effects
at the founder level, and not only at the venture level. Because the demise of a venture does
not signify the demise of its founder, a richer assessment of the economic impact of
accelerators should include the performance-enhancing effect on treated entrepreneurs.
Another potential explanation why basic accelerator services had no impact on
venture performance could be that the capital stock in start-ups may be too low to generate
positive returns (Banerjee and Newman, 1993; Aghion and Bolton, 1997). That is, the rent-
generating capability of fledgling start-ups is limited to such an extent that the potential
returns of the seed capital provided by the accelerator are very low. However, this
explanation does not resonate in our case, given the predominantly “new economy” nature of
the ventures in our sample, for which the necessary levels of physical capital stock to
generate positive returns are generally low (e.g., Rajan and Zingales, 2000).
Another related potential explanation is that the cash infusion is not enough to
significantly affect performance. However, the funding needs of start-ups have decreased
over time, particularly given the significant decrease in the costs of experimentation over the
last decade (Kerr, Nanda, and Rhodes-Kropf, 2014). Indeed, whereas building a software
company may have cost US$5 million on average 10 years ago, today it can often be
accomplished with US$500,000, and start-ups can often accomplish with a US$50,000 seed
investment what used to take US$500,000 to US$1 million (Hochberg, 2015). Nonetheless,
one can still argue, at least for foreign entrepreneurs, that the net cash windfall from the
program is too low, given that an important part of their seed capital must be used to pay for

30 !
their relocation to Santiago. However, this explanation is unlikely to be the main one as we
find no difference in the effect of basic services on performance across foreign and Chilean
entrepreneurs.
Analysis of supplementary data does not support the alternative story—that rejected
applicants secured acceleration services elsewhere or raised alternative sources of financing,
thereby dampening the estimated effect of the basic services. We collected information from
AngelList and Seed-DB42 regarding non-participants’ acceptance into other accelerator
programs, and find only 2% of rejected applicants secure financing in other accelerator
programs, and this minority is not concentrated in companies ranking close to the threshold.
In addition, the effect does not change if we exclude Chileans from the analysis, which are
entitled to apply to other domestic sources of early-stage financing.43 Therefore, the null
effect does not seem to be a consequence of rejected applicants securing funding elsewhere.
Another explanation is that the mechanisms the program uses to curb entrepreneurs’
opportunistic behaviour are not enough, and hence the expected value gains from early-stage
financiers in the form of agency costs’ mitigation are not materialized. Indeed, the intensive
monitoring and powerful allocation of control rights known to alleviate agency conflicts and
add value to start-ups (Admati and Pfleiderer, 1994; Berglof, 1994; Bergemann and Hege,
1998; Hellman, 1998; Cornelli and Yosha, 2003) are likely most pronounced in mentor-arm
participants, and not for non-mentees. According to the program’s staff, however,
entrepreneurs are very motivated, and since the inception of the program, only one case of
questionable use of funds has occurred. One potential explanation for the lack of perceived
!!!!!!!!!!!!!!!!!!!!!!!!!!!!!!!!!!!!!!!!!!!!!!!!!!!!!!!!!!!!!42 Seed-DB is an open source accelerator database built on CrunchBase data (http://www.seed-deb.com/). 43 Between 2010 and 2012 close to 280 Chilean start-ups were funded through the Ministry of Economy’s incubation program. This program offers entrepreneurs circa $80,000 dollars—twice as much as Start-Up Chile—in exchange for a small percentage of the venture’s ownership, which is retained by the corresponding incubator. In contrast, only 52 Chilean entrepreneurs were selected to participate in Start-Up Chile during the same period, while 209 were refused participation. (Sistema Nacional de Innovación 2010-2013: Principales avances y hechos relevantes desde la Política Pública. Published by the Ministry of Economy of Chile)

31 !
opportunistic behavior by participants is that potential reputational consequences act as
disciplinary devices (see Bernthal, 2015).
A final interpretation for the lack of effect of the cash and the co-working space (at
least for borderline applicants) is that our web-based measures of performance are not
capturing real effects. However, investors in start-ups use these metrics, so although not
standard in academic research,44 they are relevant for this type of company. One natural
argument would be that because the program is Chilean, performance metrics should be
retrieved from local data sources (e.g., Chilean business registry) or even local web-based
networks. However, most participants are foreign (see Table 2), and if registered, they have
done so abroad because the vast majority do not end up in Chile. In addition, the program is
internationally oriented; for example, the official language in Start-Up Chile is English, and
“exits” via participation in international accelerators (e.g., Y Combinator) is a common goal
among participants.
Nevertheless, we explored this alternative interpretation in more detail by conducting
a survey to collect non-web-based measures of performance. The results from analyzing
survey responses are consistent with the results presented here. To conserve space, we do not
report them in the main body of the article, but Appendix A.3 has a detailed explanation of
how the survey was conducted, and summarizes this additional analysis.
Finally, a question remains regarding the influence of peer effects on venture
performance in the accelerator. Because the structural (co-working spaces) and programmatic
(bonding activities organized by the program’s staff) elements of Start-Up Chile encourage
high levels of social interaction, we might expect peer effects to be a substantive mechanism
at play. However, our evidence does not point in that direction. One potential explanation is
that participants are too heterogeneous to benefit from the close interaction at Start-Up Chile.
!!!!!!!!!!!!!!!!!!!!!!!!!!!!!!!!!!!!!!!!!!!!!!!!!!!!!!!!!!!!!44 The practice of using web-based metrics to measure start-up performance goes back at least to the paper by Kerr, Lerner, and Schoar (2014).

32 !
Interviews with participants that later joined private accelerators in the United States mention
how the sheer size of the program makes peer effects less likely: “participants in Start-Up
Chile are too diverse…. They are at different stages of development, cover different markets,
and work in different industries. In smaller programs (Y Combinator) we are all in similar
stages, and going through the same milestones and challenges. The opportunity for peer
learning is much higher in this context” (Gonzalez-Uribe, 2014). However, this heterogeneity
may be an important source of learning of novel ideas and practices. As one interviewee
reported, “This is the only [program] that truly has entrepreneurs from any country you can
think of. In this environment you will meet tons of people that bring ideas […] that you have
never thought of. Ideas [and] solutions that might be popular in their region, but not yet heard
of in your part of the world” (Leatherbee and Katila, 2015). Yet another alternative is that our
performance measures do not capture the peer effects. Indeed, most papers on peer effects in
entrepreneurship measure impacts on entrepreneurial attitudes rather than venture
performance. In this sense, our results on the permanent effect on entrepreneurial occupations
could be interpreted as reflecting peer effects. Future efforts to assess accelerators should
explore ways to study peer effects more carefully.
3. THE VALUE OF MANAGERIAL CAPITAL IN START-UPS: THE EFFECT
OF MENTORING IN BUSINESS ACCELERATORS
The idea that managerial technology affects the productivity of inputs is central to the Lucas
(1978) model of firm size, and goes back at least to Leibenstein (1966) and Walker (1887). A
growing literature measures differences in managerial practices and finds large variations
across establishments and a strong association between these practices and higher
productivity and profitability (Acemoglu et al., 2007; Bloom and Van Reenen, 2010). Some
evidence from evaluations on business training and entrepreneurship evaluations in the
developing world suggests differences in managerial practices may also explain part of the
33 !
heterogeneity in venture survival. However, not only is existing evidence mixed (McKenzie
and Woodruff, 2014); it has not focused on transformational ventures. Although evidence of
beyond-information-based roles for early-stage financiers (e.g., Hellman and Puri, 2002)
would suggest new ventures also face managerial capital constraints, little rigorous evidence
on this topic exists. The setting in this paper provides a unique opportunity to provide
rigorous evidence, because only a fraction of participants are competitively selected into the
mentor arm.
We start the analysis of the value of managerial capital in new ventures in our setting
by exploring non-parametric performance differences across mentored and non-mentored
participants in Panel C of Table 3. Participants in the mentor arm have better performance
post participation (except survival), and selection on observables may explain some of this
outpeformance, given the differences in characteristics across mentored and non-mentored at
the time of application. Although this superior performance suggests mentoring by business
accelerators increases managerial capital, it is not definite, because mentoring is potentially
endogenous: the program likely picks the best start-ups for mentoring. Similar to our
evaluation of the basic services of cash and co-working space in section 2, we exploit
nonlinearities in the selection rule to the mentor arm to distinguish the casual effect of
mentoring as explained in detail below.
3.1 Selection Process into the Mentor Arm
Two months into the program, start-ups have the option to apply for the mentor arm in a
competition dubbed “pitch day.” The mentor arm is not open to all participants, because the
program does not have enough specialized mentors, monitoring requirements are too
burdensome for the staff, and providing the preferential access to external speakers and SV
contacts to all participants is infeasible.

34 !
During the pitch day, competing start-ups do a formal presentation or “pitch” of their
business to a group of local judges (an independent group from the accelerator application-
process judges), both external (i.e., staff at other private accelerators in Chile, e.g.,
Telefonica’s Wayra) and internal (i.e., staff at Start-Up Chile). Participants do not know the
identity of these judges beforehand, and it is only announced minutes prior to the
competition. The judges independently score each start-up (from 1 to 5), and no judge
observes all scores. The judges have no clear incentive for manipulation: they are not
mentors, and although some may want to help their friends, they are unlikely able to precisely
manipulate the scores.
Participants are allotted five minutes for their pitch. A guideline for the pitch is provided.
Applicants are expected to discuss (i) the problem their business is trying to solve, (ii) the
proposed solution, (iii) the business model, (iv) the size of the market, and (v) what they are
looking for (e.g., fund-raising needs). A team usually receives a brief description, and, time
permitting, information on any milestones the start-up has achieved.
Based on the pooled scores from the pitch day, the accelerator’s staff selects roughly
20% of the participants (approximately 15 start-ups for each generation). Although in each
generation the number of accepted participants into the mentor arm is not strictly or ex-ante
determined, an implicit selection rule is evident in the data. Start-ups scoring at least 3.6 (out
of 5) during the pitch day are unconditionally 34% more likely to be selected into the mentor
arm. When asked, staff recalled no formal use of this rule other than that it highlighted those
start-ups that “had just passed” the pitch competition.
[INSERT FIGURE 4 HERE]
Figure 4 shows by bins of 0.2 (scores) the fraction of applicants participating in the
pitch day that are selected into the mentoring program. Visual inspection reveals the

35 !
discontinuity in the selection rule, which exhibits a jump for pitch-day scores above 3.6. The
figure also shows the OLS fitted values and 90% confidence interval of the regression:
(5) !"#$%&! = ! + !"#$%!!.! + ! !"#$ℎ_!"#!!!"#$%! + !!,
where the outcome variable mentor is an indicator variable that equals 1 if the participant was
mentored, !"#$!!.! is an indicator variable that equals 1 if the participant scored above 3.6
during the pitch day, and ! !"#$ℎ_!"#!!!"#$%! is a fourth-degree polynomial of the pitch-
day score. The polynomial, ! . , controls for any underlying relationship between the
fraction of participants that are mentored and the score of the pitch day. The coefficient !,
which in the plot corresponds to the difference in the vertical axis between the points where
the left and right polynomials intersect with the cut-off, is a measure of the size of the
discontinuity. As per visual inspection, and as confirmed in the regressions reported in Table
6, the discontinuity is large—33.2% and statistically significant—at the 1% level, and robust
to different specifications of equation (5): including generation fixed effects (column 2),
covariates (column 3), and restricting the sample to start-ups scoring between 3.3 and 3.8
during the pitch day (column 4).
[INSERT TABLE 6 HERE]
3.2 The Fuzzy RDD
To assess the value of mentorship, the selection rule for the mentoring arm can be exploited
in a manner analogous to that of participation in the program. We instrument mentoring using
the selection rule into the mentor arm and estimate the following system of equations:
(6) !"#$%&! = ! + !"#$%!!.! + ! !"#$ℎ_!"#!!!"#$%! + !!,
(7) !"#$!%&! = ! + !!"#$%&! + ! !"#$ℎ_!"#!!!"#$%! + !!,
where we control for potential nonlinearities of the pitch-day score using high-order
polynomials (i.e.,! . !!"#!! . ).

36 !
The nonlinearity in equation (6) identifies the LATE as long as potential outcomes for
start-ups that score just below 3.6 during the pitch day are similar to those just above 3.6
(local continuity) and we see a joint independence of (i) the mentoring effect and (ii) the
selection into the mentor arm from the ranking near the pitch score of 3.6. Threats to
identification would obtain only if the joint relation exhibits the same discontinuity as
!"#$%&! around 3.6.
Validating these identification assumptions are the evidence of both a balanced
sample (Figure 5) and smoothness in the distribution of pitch-day scores (Figure 6), across
participants scoring closely around the 3.6 cut-off. We cannot reject the null hypothesis of
local continuity: the t-statistic from the McCrary test is -0.198 (see Figure 6).
[INSERT FIGURE 5 HERE]
The only significant (observable) difference in covariates regards the dummy money
raised before: participants who scored above 3.6 during the pitch day are significantly more
likely to have secured external financing prior to joining the accelerator. Further inspection
reveals, however, that the difference is due to having raised capital from non-specialized
financiers such as family and friends: no difference is evident when restricting to seed
(including angel financing or other accelerator programs) or VC fund-raising. We control for
this significant difference in the RDD approach below by including the variable money raised
before as a covariate and checking whether the estimated coefficients differ significantly with
and without this control (a tell-tale sign of the discontinuity in the outcome being driven by a
discontinuity in an observable characteristic, and not the discontinuity in the selection rule).
[INSERT FIGURE 6 HERE]
3.3 Results
Tables 7 and 8 document the effect of participation in the mentor arm on performance using
OLS and the fuzzy RDD. Column (1) in Panel A shows that mentored participants are 9.1%

37 !
more likely to raise funds after the program (as measured by the dummy capital raised after).
Column (2) shows this better fund-raising ability is not related to selection on observables
(i.e., after controlling for money raised before), which indicates effective fund-raising from
family and friends before participation in the program does not explain the effect.
Column (3) shows participation in the mentor arm has a positive and large causal
effect on total fund-raising—for compliers: it increases probability of fund-raising by 20.3%.
The economic significance is sizable: it implies a 0.32 standard deviation increase in the
likelihood of fund-raising.45 Controlling for observable covariates only marginally affects
statistical significance, and importantly, does not affect the magnitude of the estimated
treatment effect (column 4). The estimates range between 18.1% and 42.4% and are robust to
using different methodologies: a fifth-degree polynomial (column 4), a local linear approach
(column 5), and allowing polynomials to differ on either side of the threshold (columns 7 and
8).
[INSERT TABLE 7 HERE]
Results in Table 7 also show that an increased probability of seed financing appears to
explain most of the estimated treatment effect from participation in the mentor arm on fund-
raising. Although the coefficient for series A is positive in all specifications (Panel C), the
estimated effect for seed is the most robust across the different specifications (Panel B).
[INSERT FIGURE 7 HERE]
Table 8 summarizes the effect of participation in the mentor arm on venture scale and
survival. Participation in the mentor arm increases the customer base size and employment,
although the effect is less robust than the estimated impact on fund-raising. Across all
columns in Panels A and B of Table 8, the coefficients are positive, and the estimated effect
across most is statistically significant. The economic significance is sizable: the estimate of
!!!!!!!!!!!!!!!!!!!!!!!!!!!!!!!!!!!!!!!!!!!!!!!!!!!!!!!!!!!!!45!The calculation is based on standardized coefficients, which, to conserve space, we do not report.!

38 !
2.381 in column 3 (of 0.422 in column 7) implies participation in the mentor arm yields a
0.47 (0.34) standard deviation increase in the customer base (team size). Controlling for
financing prior to participation (i.e., the dummy money raised before) only slightly decreases
the point estimates (columns 4 and 8) but renders them insignificant, which is not surprising
given the small sample size. Indeed, evidence suggests the lack of statistical power might
explain the lack of significance: the last row of column 8 in Panel A shows the sample size
necessary to distinguish the estimated effect of mentoring on team size exceeds the
estimation sample’s size. Finally, no effect on survival is evident from the data. Figure 7 plots
some of the reduced-form estimates of mentoring on start-up outcomes. Results reported in
Table 8 suggest mentoring has real effects, as opposed to only teaching start-ups how to pitch
and fundraise.
[INSERT TABLE 8 HERE]
In Table 9, we summarize results exploring the potential heterogeneity of the effect of
mentoring across start-up and founder characteristics. In particular, we explore the effects on
Chilean entrepreneurs given the policy’s orientation towards fostering a connection between
domestic and foreign entrepreneurs. Across all outcomes (except seed financing), the point
estimates suggest a stronger effect for Chileans; however, the difference is only statistically
significant for short-term survival. This finding is consistent with prior work that studies the
cognitive and behavioral effects of the program on domestic entrepreneurs vis-à-vis foreign
entrepreneurs, regarding improvements in entrepreneurial opportunity-discovery skills
(Leatherbee and Eesley, 2014).
In unreported regressions, we find no difference in the estimated effect for females, in
contrast to related work on female subsistence micro-entrepreneurs (de Mel et al., 2009), or
by type of start-up (e.g., prototype in development). Estimated coefficients across the
aforementioned subsamples are generally not statistically significant, and no consistent

39 !
patterns are present across the OLS and fuzzy RDD estimates. To conserve space, we do not
report results.46
[INSERT TABLE 9 HERE]
3.4 How Does Participation in the Mentor Arm Add Value?
Given the large positive impact of participation in the mentor arm reported in Tables 7-9, the
natural questions ask how mentoring adds value in new ventures, and why these start-ups had
not previously invested in this managerial capital. Although our empirical setting does not
allow us to directly answer this question, we can use additional information gathered via
interviews with staff and mentored and non-mentored participants to draw some preliminary
conclusions.47
One source of value added is apparent from the interviews: an increase in the social
capital of the start-up in four specific forms. First, mentees seemed to get access to mentors’
valuable business and fund-raising connections. Interviewed non-mentored participants
argued that good mentoring is a scarce resource. Second, mentees had preferential access to
foreign, high-profile guest speakers. This fact may have further increased the acquisition of
useful insights and connections. Third, mentees were typically invited to speak at high-profile
events—the program executives preferred to recommend mentor-arm participants for these
events because of their perceived higher quality. This certification effect may have helped
increase mentees’ exposure to potential customers, partners, employees, and investors.
Fourth, winning the pitch day competition may have increased mentees’ entrepreneurial self-
efficacy (Bandura, 1982; Chen et al., 1998), which is an individual’s belief in her ability to
!!!!!!!!!!!!!!!!!!!!!!!!!!!!!!!!!!!!!!!!!!!!!!!!!!!!!!!!!!!!!46 In Appendix A.3, we also explore differences in performance across mentees and non-mentees as measured by survey-based outcome measures. One limitation of this additional analysis is response attrition: few respondents participated in the pitch day, even fewer were mentored, and none of the mentored respondents are Chilean. Based on this sample, we find little evidence of outperformance by mentees; however, this finding is likely due to response-rate attrition of Chilean entrepreneurs, as explained in more detail in the appendix. 47!We explored the possibility of collecting information about assigned mentors (e.g., occupation, background, gender, etc.) to further investigate this question. Unfortunately, the program has kept no record of these assignments and was not keen to pursue this line of research. We are limited by our setting in finding out in more depth the value-added source of participation in the mentor arm.

40 !
successfully execute entrepreneurial tasks, and can affect venture performance (Forbes,
2005).
A second source of value added may have come from the structured monthly
meetings. During each of the meetings between entrepreneurs and their corresponding
mentors, a Start-Up Chile staff member would take notes and list the tasks implicitly agreed
upon between mentors and mentees. This list would be reviewed at the beginning of the next
meeting, and mentees were asked by the mentors and the staff about the progress since the
last meeting. This structured accountability, whereby entrepreneurs were encouraged to
report their progress, may have served as a guide for action. As March and Simon (1993)
suggested, “the greater the clarity of goals associated with an activity, the greater the
propensity to engage in it.” Therefore, by imposing an accountability structure that would
otherwise be absent, mentees may have increased their managerial capital by becoming more
effective in the pursuit of their venture goals.
Another potential source of value added pertains to the instruction of how to manage
the business. That is, mentors may have taught entrepreneurs how to better operate their start-
ups. However, mentees and mentors formally meet only four times throughout the program
for periods of approximately one hour. This limited interaction suggests the teaching of
managerial capital by mentors is unlikely to explain our results. Alternatively, alleviation of
agency conflicts from the more intensive monitoring may be also part of the explanation,
although as already mentioned, incentives of entrepreneurs and the program appear to be
aligned, with only one (reported) occurrence since the inception of the program of potential
opportunistic behavior by the founders.
One further potential source of value added from the mentoring arm are the peer
effects from the closer interaction with other start-ups in the same industry, because mentor
assignment is industry based. Interviewed mentees did not mention this potential effect, but it

41 !
can be a likely source of value as shown in other contexts (see Hallen et al., 2013) and using
different measures (Leatherbee and Eesley, 2014). One limitation of the setting is that we
cannot distinguish the benefit from peer effects from other sources of value in the mentor
arm. Future research aimed at understanding these issues is needed to provide more concrete
policy guidelines.
If structured accountability effectively increases new-venture performance, why did
entrepreneurs not contract it in the first place? We speculate they did not contract this
accountability prior to participation in the program because of informational constraints:
founders are typically unaware of these practices or underestimate their importance a priori.
As Bloom et al. (2013) suggested, management is a technology that diffuses slowly.
Furthermore, entrepreneurs might self-select into an entrepreneurial occupation because of
their inclination to avoid being captured by a hierarchical structure that requires them to
report to an authority figure. Therefore, building an accountability structure that feels like the
hierarchy they are choosing to avoid may feel unnatural to them.
Our interviews further suggest participants’ pre-program lack of social capital is
mainly due to supply constraints. Interviewed mentees mentioned the certification clout and
constant preferential access to their mentors’ and the program’s staff connections as a key
contribution. In addition, interviewed non-mentored participants argued that access to good
connections is a key to success, albeit hard to secure. Consistent with this view, the work by
Hsu (2004) shows entrepreneurs are willing to pay for affiliation with reputed investors.
The main implication is that the program does not appear to be crowding out private
managerial-capital providers in the community (i.e., private accelerators, angels); instead, it
appears to be providing a scarce resource, and thus adding value to the ecosystem and not
simply redistributing rents from private to public institutions (we return to this point in the
next section).

42 !
4. GOVERNMENT-FUNDED BUSINESS ACCELERATORS AND THE
ENTREPRENEURIAL COMMUNITY
Many local governments have adopted the accelerator model, hoping to transform their local
economies through the establishment of new-venture clusters (Fehder and Hochberg, 2014).
Start-Up Chile is an example of this trend and a very influential one, having inspired the
adoption of similar programs in the region (e.g., Start-Up Peru). If accelerators serve to shift
the general equilibrium of the entrepreneurial ecosystem by, for instance, improving
outcomes or resources for both the treated start-ups, but also more generally for the local
venture ecosystem, our analysis thus far does not capture the full effects of the accelerator in
this setting. Alternatively, if public accelerators are in competition for deals with private
accelerators, we may have overestimated the value added to the venture community, by
ignoring the potential crowding out of private early-stage investors.
Although the evidence points toward the program adding value—interviewed non-
participants claimed good mentoring was scarce—exploring in more depth whether the
program also affected the venture community would help inform policy design. Prior work
showing a positive impact of accelerators on regional development (Fehder and Hochberg
2014), and the main policy objective of Start-Up Chile of building an innovation culture in
the country, justifies this additional analysis. Indeed, Nicolas Shea, founder of the program,
argued when interviewed that “to accelerate was never the objective. What we wanted was a
cultural change in Chile. To reach that goal all you need is a group of highly qualified
entrepreneurs. Making sure they came to Chile was our job, making sure they succeeded was,
and will always be, theirs.”
Measuring the regional effects of the program is, however, challenging. How to
measure “mentality changes” (i.e., the program’s objective), or how to distinguish the effect
of the program from other concomitant regional changes (e.g., arrival of new innovation

43 !
opportunities), is not clear. To overcome the first challenge, we started by interviewing local
entrepreneurs, examining entrepreneurship reports for the region (e.g., The Global
Entrepreneurship Monitor reports) and specialized press articles. Since the inception of the
program, Chile has become an entrepreneurial hub dubbed as “Chilecon Valley,” and
according to local practitioners, much of this evolution is due to the program (see Gonzalez-
Uribe, 2014).
Given this suggestive evidence, we then collected information on new business
creation as a measure of a regional effect, in particular, the annual number of new registered
businesses by “comunas” (i.e., fiscally independent localities in Chile) and industry for the
2005-2013 period. Our focus on registered business aims at distinguishing the
entrepreneurship sponsored by Start-Up Chile—new ventures by transformational
entrepreneurs—from more subsistence businesses, as suggested by Levine and Rubinstein
(2014). The source of these data is the Department of Economic and Tax Studies of the local
tax authority. The data were extracted through a procedure akin to a Freedom of Information
Act information request (Ley de Transparencia) on October 17, 2014.
We advance in overcoming the second challenge, using a difference-in-differences
methodology, where we compare business-creation rates before and after inception of the
program, across industries related and not related to the program (e.g., software), and in
comunas close to and far from the headquarters of Start-Up Chile. Macroeconomic factors—
such as the multiple policies and regulatory changes that occurred in Chile between 2010 and
2014—may certainly affect overall business-registration rates.48 However, if the program
indeed had an impact on the local entrepreneurial community, it would most likely affect
registrations in industries such as software, as opposed to, say, timber, that are directly related
to Start-Up Chile, and in comunas close to the headquarters of the program, where every
!!!!!!!!!!!!!!!!!!!!!!!!!!!!!!!!!!!!!!!!!!!!!!!!!!!!!!!!!!!!!48 See report for details of changes: Sistema Nacional de Innovación 2010-2013: Principales avances y hechos relevantes desde la Política Pública. Published by the Ministry of Economy of Chile.

44 !
Wednesday a “meet-up” is held for aspiring and established entrepreneurs to share their
experiences and network. In detail, the “treated” industries include: activities of experimental
research and development, auxiliary transport activities, business-to-business services,
information services, other types of financial intermediation, retail trade not realized in shops,
telecommunications, and travel agencies. The “treated” comunas include Santiago Central,
where the headquarters of Start-Up Chile is located, and all contiguous comunas:
Independencia, Providencia, Nunoa, San Joaquin, San Miguel, Pedro Aguirre Cerda, Estación
Central, and Quinta Normal (note these comunas are all within Santiago, the capital of Chile).
[INSERT TABLE 10 HERE]
Table 10 summarizes results. The estimate in column 3 shows the number of
registered businesses increased by 0.024% after 2010 and relative to same types of businesses
in other comunas and to other industries in the same comuna. The estimated effect in column
2 implies that post 2010, an increase in 0.095 standard deviations occurred in the number of
businesses registered in the industries and comunas treated by Start-Up Chile. Naturally, the
economic significance of this effect is small. Business registration is the final objective of the
mentality change, but it is likely a lower bound of the effect of the program—a larger impact
may be evident in the long term in the future generations of Chileans exposed earlier and for
a longer time to the Start-Up Chile transformation.
These additional results can be interpreted as suggestive evidence of
entrepreneurship-related spillovers of the program. They are consistent with the program’s
main objective and complementary to recent results by Fehder and Hochberg (2014). Taken
together with the results in section 3, they suggest Start-Up Chile adds value to the
entrepreneurial community.
5. CONCLUSIONS

45 !
How accelerators affect new-venture performance is an important question, both in the
academic literature and for practice. However, little evidence exists about whether
accelerators are effective, and if so, which underlying mechanisms make them so. This paper
provides the first quasi-experimental evidence of the effect of accelerator programs and the
importance of managerial capital on new-venture performance.
We evaluated a business-accelerator program that provided all participants seed
capital (equity-free) and co-working space. It also provided mentoring services to a
competitively selected few. We find that mentoring (bundled with the basic services of cash
and co-working space) led to significant increases in fund-raising: the probability of raising
seed and venture-capital funding increased between 28.1% and 42.4%, which corresponds to
standard deviation increases of 0.61 to 1.43. These start-ups also appear to hire more and
grow their customer base faster. By contrast, we find no evidence that the basic accelerator
services of cash and co-working space led to improved venture fund-raising, scale, or
survival. Although participants in the accelerator outperformed rejected applicants, the
selection skill of the recruiters appears to explain average differences in performance.
Our results suggest the cash and co-working space add—on average—no value to
complier borderline start-ups. We speculate about potential explanations, other than the null
hypothesis of no added value from basic accelerator services. These additional explanations
include: first, complier borderline start-ups may be of heterogeneous quality, such that the
resulting estimated effect is zero because the program accelerates the success of some but the
demise of others. Second, a lack of statistical power may limit our ability to distinguish the
effect, yet standard sample-size calculations, as a nod to the literature on randomized control
trials (see McKenzie, 2010), suggest we have sufficient power to reject the null. Third,
rejected applicants may have secured accelerator financing elsewhere. However, we find
limited support for this explanation.

46 !
How does mentoring add value to new ventures, and why had these start-ups not
previously invested in this managerial capital? Our evidence, though speculative, suggests the
existence of two value-adding, scarcely supplied mechanisms pertaining to managerial
capital: increased social capital and structured accountability. The lack of investment in
managerial capital prior to the program appears to be mainly due to supply constraints.
We further explore the effects of the accelerator at a more macro-level. We find
evidence that start-up activity (in the form of business incorporation) increased in the
localities and industries influenced by the program. Together, our results allow us to
speculate the accelerator adds value to the entrepreneurial community, and not only to
participants.
In terms of future research, understanding further the mechanisms through which
mentoring adds value is crucial. Experiments could be devised to test which of the observed
mechanisms has the greatest impact. Moreover, the exploration regarding the peer effects of
accelerators seems particularly interesting, specifically in terms of the heterogeneity of
participants. Whereas some accelerators seem to select homogeneous cohorts, others such as
Start-Up Chile encourage heterogeneity. Our results suggest stronger performance-enhancing
effects for Chilean entrepreneurs across most of our measures. Is this finding a consequence
of learning, access to diverse networks, or the advantage of natives? Furthermore, a better
notion of whether part of the value added from the mentor arm is peer effects from same-
industry ventures would be of special interest. Their existence would suggest a potential
alternative to scaling up the value added of the program: increasing the number of accepted
participants, conditional on working in the same industry as those competitively selected.
Finally, results from our analysis at the founder and regional levels have profound
implications on the design of future evaluations of accelerator programs. Understanding how
accelerators influence the likelihood of founders engaging in entrepreneurial activity, and
47 !
how the entrepreneurial experience influences a founder’s managerial capital for the creation
of economic value, are two important questions future research should try to answer.
Our paper has policy implications, in particular regarding design of policies to
sponsor entrepreneurship. Our results suggest that if the policy objective is to accelerate
treated start-ups, more resources should be allocated toward mentoring. For example, the
program may reduce its size and instead make sure all start-ups are mentored, as is common
in private accelerators worldwide. Naturally, the challenge is scaling mentoring resources that
are scarce, in contrast to cash infusions, which are more easily scalable (in 2015, the Chilean
government agreed to more than double the budget to the program).
However, a policy’s primary objective may not always be to accelerate participants—
as in the case of Start-Up Chile. In that case, the verdict may be different. If instigating an
ecosystem change is the policy objective, size may matter—as suggested by our evidence of
regional spillovers and the persistence of an entrepreneurial occupation, and that of other
work showing the program’s effect on entrepreneurial skills (Leatherbee and Eesley, 2014).
In this case, funding larger programs—even at the expense of not providing mentoring to all
participants—may be the better option.
! !

48 !
References
Acemoglu, D., P. Aghion, C. Lelarge, J. van Reenen, F. Zilibotti. 2007. Technology, Information, and the Decentralization of the Firm. Quarterly Journal of Economics 122(4): 1759–1799.
Admati, A. R., and P. Pfleidere. 1994. Robust Financial Contracting and the Role of Venture Capitalists. Journal of Finance 49:371–402.
Aghion, P., and P. Bolton. 1997. A Theory of Trickle-down Growth and Development. The Review of Economic Studies 64:151–72.
Applegate, L., W. R. Kerr, J. Lerner, D. D. Pomeranz, G. Herrero, and C. Scott. 2012. Start-Up Chile. Harvard Business Review .
Bandura, A. 1982. Self-Efficacy Mechanism in Human Agency. American Psychologist 37:122–47.
Banerjee, A. V., and A. F. Newman. 1993. Occupational Choice and the Process of Development. Journal of Political Economy 101:274.
Berge, L. I., Bjorvatn, K. and B. Tungodden. 2014. Human and Financial Capital for Microenterprise Development: Evidence from a Field and Lab Experiment, Management Science 61(4):702-722.
Bergemann, D., and U. Hege. 1998. Venture Capital Financing, Moral Hazard, and Learning. Journal of Banking & Finance 22:703–35.
Berglof, E. 1994. A Control Theory of Venture Capital Finance. Journal of Law, Economics, and Organizations10:247–67.
Bernstein, S., A. G. Korteweg, and K. Laws. 2015. Attracting Early Stage Investors: Evidence from a Randomized Field Experiment. Journal of Finance Forthcoming.
Bernthal, B. 2015. Investment Accelerators. Available at SSRN: http://ssrn.com/abstract=2642436.
Bloom, N., B. Eifert, A. Mahajan, D. McKenzie, and J. Roberts. 2013. Does Management Matter? Evidence from India. Quarterly Journal of Economics 128:1–51.
Bloom, N., and J. Van Reenen. 2010. Why Do Management Practices Differ across Firms and Countries? Journal of Economic Perspectives 24:203–24.
Bruhn, M., D. Karlan, and A. Schoar. 2012. The Impact of Offering Consulting Services to Small and Medium Enterprises. World Bank mimeo .
Bruhn, M., and B. Zia. 2013. Stimulating Managerial Capital in Emerging Markets: The Impact of Business Training for Young Entrepreneurs. Journal of Development Effectiveness 5:232–66.

49 !
Burt, R. S. 1997. The Contingent Value of Social Capital. Administrative Science Quarterly 42:339–65.
Calonico, S., Cattaneo M. D., and R. Titiunik.2014. Robust Nonparametric Confidence Intervals for Regression�Discontinuity Designs. Econometrica 82 (6): 2295-2326.
Chen, C. C., P. G. Greene, and A. Crick. 1998. Does Entrepreneurial Self-Efficacy Distinguish Entrepreneurs From Managers? Journal of Business Venturing 13:295–316.
Cohen, S. G. 2013. What Do Accelerators Do? Insights from Incubators and Angels. innovations 8:19–25.
Cohen, S. G., and Y. V. Hochberg. 2014. Accelerating Startups: The Seed Accelerator Phenomenon.
Cornelli, F., and O. Yosha. 2003. Stage Financing and the Role of Convertible Debt. Review of Economic Studies 70:1–32
Davis, S. J., J. C. Haltiwanger, and S. Schuh. 1998. Job Creation and Destruction. MIT Press Books 1.
de Mel, S., D. McKenzie and C. Woodruff. 2014. Business Training and Female Enterprise Start-up, Growth, and Dynamics: Experimental Evidence From Sri Lanka, Journal of Development Economics106:199-210
De Mel, S., D. McKenzie and C. 2009. Are Women more Credit Constrained? Experimental Evidence on Gender and Microenterprise Returns. American Economic Journal: Applied Economics 1(3): 1-32.
Deering, L., M. Cartagena, and C. Dowdeswell. 2014. Accelerate: Founder Insights Into Accelerator Programs. FG Press.
Drexler, A., G. Fischer, and A. Schoar. 2014. Keeping It Simple: Financial Literacy and Rules of Thumb. American Economic Journal: Applied Economics 6:1–31.
Ewens, M., and M. Rhodes-Kropf. 2015. Is a VC Partnership Greater Than the Sum of Its Partners? Journal of Finance 70:925–1327.
Forbes, D. P. 2005. The Effects of Strategic Decision Making on Entrepreneurial Self-Efficacy. Entrepreneurship Theory and Practice 29:599–627.
Galdo, J., J. A. Smith, and D. Black. 2007. Bandwidth Selection and the Estimation of Treatment Effects with Unbalanced Data.
Garg, S. 2013. Venture Boards: Distinctive Monitoring and Implications for Firm Performance. Academy of Management Review 38:90–108.
Gelman, A., and G. W. Imbens. 2014. Why High-Order Polynomials Should Not Be Used in Regression Discontinuity Designs. Working Paper.
Gonzalez-Uribe, J. 2014. El Caso de Start-Up Chile. Programa de Atracción de Talento Para Fomentar El Emprendimiento. CAF, Development Bank of Latin America .
50 !
Hahn, J., P. Todd, and W. van der Klaauw. 2001. Identification and Estimation of Treatment Efects with a Regression Discontinuity Design. Econometrica 69:201–9.
Hallen, B. L., C. B. Bingham, and S. G. Cohen. 2013. Do Accelerators Accelerate? A Study of Venture Accelerators as a Path to Success. Working Paper.
Haltiwanger, J., R. S. Jarmin, and J. Miranda. 2013. Who Creates Jobs? Small versus Large versus Young. The Review of Economics and Statistics XCV:347–61.
Hellmann, T. 1998. The Allocation of Control Rights in Venture Capital Contracts. RAND Journal of Economics 29:57–76.
Hellmann, T., and M. Puri. 2000. The Interaction Between Product Market and Financing Strategy: The Role of Venture Capital. Review of Financial Studies 13:959–84.
Hellmann, T., and M. Puri. 2002. Venture Capital and the Professionalization of Start-Up Firms: Empirical Evidence. The Journal of Finance LVII:169–97.
Hochberg, Y. V. 2015. Accelerating Entrepreneurs and Ecosystems: The Seed Accelerator Model. Innovation Policy and the Economy. . Vol. 16University of Chicago Press.
Hochberg, Y. V., L. A. Lindsey, and M. M. Westerfield. 2015. Resource Accumulation through Economic Ties: Evidence from Venture Capital. Journal of Financial Economics Forthcoming.
Hochberg, Y. V., A. Ljungqvist, and Y. Lu. 2007. Whom You Know Matters: Venture Capital Networks and Investment Performance. The Journal of Finance 62:251–301.
Hoffman, D. L., and N. Radojevich-Kelley. 2012. Analysis of Accelerator Companies: An Exploratory Case Study of Their Programs, Processes, and Early Results. Small Business Institute Journal 8:54–70.
Hsu, D. H. 2004. What Do Entrepreneurs Pay for Venture Capital Affiliation? The Journal of Finance 59:1805–44.
Imbens, G. W., and J. D. Angrist. 1994. Identification and Estimation of Local Average Treatment Effects. Econometrica 62:467–75.
Karlan, D., R. Knight, and C. Udry. 2012. Hoping to Win, Expected to Lose: Theory and Lessons on Micro Enterprise Development. Working Paper.
Karlan, D., and M. Valdivia. 2011. Teaching Entrepreneurship: Impact of Business Training on Microfinance Clients and Institutions. Review of Economics and Statistics 93:510–27.
Kerr, W. R., J. Lerner, and A. Schoar. 2014. The Consequences of Entrepreneurial Finance: Evidence from Angel Financings. Review of Financial Studies 27:20–55.
Kerr, W. R., R. Nanda, and M. Rhodes-Kropf. 2014. Entrepreneurship as Experimentation. Journal of Economic Perspectives 28:25–48.
Kim, J.-H., and L. Wagman. 2014. Portfolio Size and Information Disclosure: An Analysis of Startup Accelerators. Journal of Corporate Finance 29:520–34.

51 !
Klaauw, W. van der. 2002. Estimating the Effect of Financial Aid Offers on College Enrollment: A Regression–Discontinuity Approach. International Economic Review 43:1249–87.
Klaauw, W. van der. 2008. Regression–Discontinuity Analysis: A Survey of Recent Developments in Economics. Labour 22:219–45.
Klinger, B., and M. Schundeln. 2011. Can Entrepreneurial Activity Be Taught? Quasi-Experimental Evidence from Central America. World Development 39:1592–1610.
Kortum, S., and J. Lerner. 2000. Assessing the Contribution of Venture Capital to Innovation. The RAND Journal of Economics 31:674–92.
Leatherbee, M., and C. E. Eesley. 2014. Boulevard of Broken Behaviors: Socio-Psychological Mechanisms of Entrepreneurship Policies. Working Paper. Available at SSRN: http://ssrn.com/abstract=2488712.
Leatherbee, M., and R. Katila. 2015. Entrepreneurial Pivoting: Honing the Business Model. Working Paper.
Lee, D. S., and T. Lemieux. 2010. Regression Discontinuity Designs in Economics. Journal of Economic Literature 48:281–355.
Leibenstein, H. 1966. Allocative Efficiency vs. “X-Efficiency.” The American Economic Review 56:392–415.
Lerner, J., A. Schoar, S. Sokolinski, and K. Wilson. 2015. The Globalization of Angel Investments. Working Paper.
Levine, R., and Y. Rubinstein. 2013. Smart and Illicit: Who Becomes an Entrepreneur and Does It Pay? Working Paper.
Lewis, D.A., Harper-Anderson, E. and L. A. Molnar. 2011. Incubating Success. Incubation Best Practices That Lead to Successful New Ventures. Working Paper.
Lucas Jr., R. E. 1978. Asset Prices in an Exchange Economy. Econometrica 46:1429–45.
March, J. G., and H. A. Simon. 1993. Organizations. New York: Wiley.
McCrary, J. 2008. Manipulation of the Running Variable in the Regression Discontinuity Design: A Density Test. Journal of Econometrics 142:698–714.
McKenzie, D. 2010. Impact Assessments in Finance and Private Sector Development: What Have We Learned and What Should We Learn? World Bank Research Observer 25(2): 209–233.
McKenzie, D. 2015. Using RCTs to Identify the Impact: Evaluating YouWin! World Bank Research Observer 25:209–33.
McKenzie, D., and C. Woodruff. 2014. What Are We Learning from Business Training and Entrepreneurship Evaluations around the Developing World? World Bank Research Observer 29(1):48–82.

52 !
Rajan, R. G., and L. Zingales. 2000. The Governance of the New Enterprise. Corporate Governance: Theoretical and Empirical Perspectives. Cambridge, MA: Cambridge University Press.
Roberts, M. R., and T. M. Whited. 2013. Endogeneity in Corporate Finance in Handbook of the Economics of Finance 2: 493-572.
Schoar, A. 2010. The Divide between Subsistence and Transformational Entrepreneurship. Innovation Policy and the Economy 10:57–81.
Walker, F. A. 1887. The Source of Business Profits. Quarterly Journal of Economics 1:265–88.
Winston Smith, S., and T. J. Hannigan. 2015. Swinging for the Fences: How Do Top Accelerators Impact the Trajectories of New Ventures? Working Paper.
Yu, S. 2015. The Impact of Accelerators on High-Technology Ventures. Working Paper.

53
Figure 1 – Fraction of Accelerated Applicants
The figure shows the average fraction of accelerated applicants in bins of 10 transformed ranks (i.e.,") and the fitted values and 90% confidence interval from the regression #$$%&%'#()*+ = - + /#0*1% +234#+5 − $7(*228 + 9, where the outcome variable acceleration is an indicator variable that equals 1 if the applicant participated in the accelerator, and 234#+5 − $7(*228 is a fourth-degree polynomial of the transformed rank. The vertical line represents the ranking cutoff normalized at 0 for the modified ranking. Only observations ranking below 201 are included in the plot.
0.2
.4.6
.8Fr
actio
n of
Acc
erat
ed A
pplic
ants
-100 0 100 200z=Rank-cutoff

54
Figure 2 – Balanced Sample around the Application Capacity Threshold
The figure shows that predetermined variables are continuous at the cutoff for applicants. Five plots are shown for the variables Chilean, Female, Money raised before, Prototype, Full-time employees, and Young. Age corresponds to the age of the founder, Chilean (Female) is a dummy that equals 1 if the founder is Chilean (Female), Full-time workers is the number of workers reported by the start-up at the time of application (censored at 10), Money raised before is a dummy that equals 1 if the start-up raised financing before potential participation in the program, Prototype equals 1 if the start-up has a prototype in development, and Young equals 1 if the start-up is less than a year old. All variables are as of the application date. Plots show averages grouped in bins of 10 applicants (dots). The plots also show the fitted values and 90% confidence interval of a modified version of the regression in equation (1), !"#$!%& = ( + *+,!-& + ./01+23 − $"#!..5 + 6 , with each of these variables as outcomes, on +,!-&, a variable that equals 1 if the applicant ranks above the capacity threshold in its generation, and 0 otherwise, and ./01+23 − $"#!..5, a fourth-degree polynomial of the modified rank (i.e., 8 = 1+23 −$"#!..). The vertical line represents the ranking cutoff normalized at 0 for the modified ranking.
0.1
.2.3
-100 -50 0 50 100 150z=Rank-cutoff
Chilean
0.1
.2.3
.4
-100 -50 0 50 100 150z=Rank-cutoff
Female.3
.4.5
.6
-100 -50 0 50 100 150z=Rank-cutoff
Prototype
22.
53
3.5
44.
5
-100 -50 0 50 100 150z=Rank-cutoff
Full-time workers
0.1
.2.3
.4.5
-100 -50 0 50 100 150z=Rank-cutoff
Money raised before
.3.4
.5.6
.7
-100 -50 0 50 100 150z=Rank-cutoff
Young

55
Figure 3 – Density of Judge’s Scores Application Forms
The figure presents a finely gridded histogram of the normalized application scores. For each applicant, the score of the capacity-threshold-ranking company (of its generation) is subtracted from the application score. Judges give applications a score from 1 to 10. Average scores range in practice from 1.28 to 8.9. The null hypothesis of no discontinuity in the distribution of the normalized application scores at the threshold cannot be rejected: the t-statistic from the McCrary (2008) test is -0.262. The McCrary test uses a local linear regression of the histogram separately on either side of the threshold to accommodate the discontinuity. For more detail, see McCrary (2008).
0.2
.4.6
.81
-5 0 5
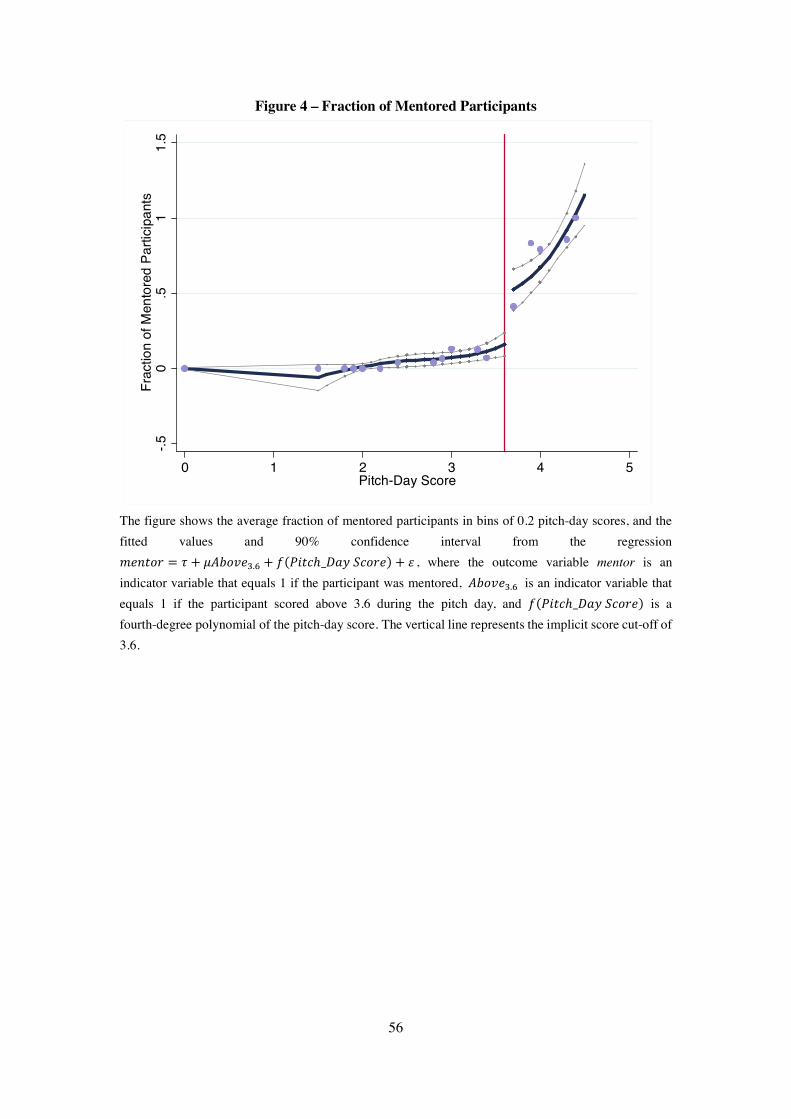
56
Figure 4 – Fraction of Mentored Participants
The figure shows the average fraction of mentored participants in bins of 0.2 pitch-day scores, and the fitted values and 90% confidence interval from the regression !"#$%& = ( + *+,%-"..0 + 1234$5ℎ_89:<5%&"= + > , where the outcome variable mentor is an indicator variable that equals 1 if the participant was mentored, +,%-"..0 is an indicator variable that equals 1 if the participant scored above 3.6 during the pitch day, and 1234$5ℎ_89:<5%&"= is a fourth-degree polynomial of the pitch-day score. The vertical line represents the implicit score cut-off of 3.6.
-.50
.51
1.5
Frac
tion
of M
ento
red
Parti
cipa
nts
0 1 2 3 4 5Pitch-Day Score

57
Figure 5– Balanced Sample around the 3.6 Pitch-Day-Score Cut-off
The figure shows that predetermined variables are continuous at the pitch-day cutoff for participants. Six plots are shown for the variables Chilean, Female, Money raised before, Prototype, Full-time employees,
0.2
.4.6
.81
0 1 2 3 4 5Pitch-Day Score
Chilean
0.5
1
0 1 2 3 4 5Pitch-Day Score
Female0
.2.4
.6.8
1
0 1 2 3 4 5Pitch-Day Score
Prototype
12
34
56
0 1 2 3 4 5Pitch-Day Score
Full-time workers
0.5
1
0 1 2 3 4 5Pitch-Day Score
Young
-.50
.51
0 1 2 3 4 5Pitch-Day Score
Money raised before
-.1-.0
50
.05
.1
0 1 2 3 4 5Pitch-Day Score
Capital Raised Before

58
and Young. Age corresponds to the age of the founder, Chilean (Female) is a dummy that equals 1 if the founder is Chilean (Female), Full-time workers is the number of workers reported by the start-up at the time of application (censored at 10), Money raised before is a dummy that equals 1 if the start-up raised financing before potential participation in the program, Prototype equals 1 if the start-up has a prototype in development, and Young equals 1 if the start-up is less than a year old. All variables are as of the application date. Plots show averages grouped in bins of 0.2 in pitch-day score. The plots also show the fitted values and 90% confidence interval of a modified versions of the regression in equation (2), !"#$%&$'( = * + ,-."#(/.1 + 2345&'!ℎ_8$9;!"%(< + = , with each of these variables as outcomes, -."#(/.> is an indicator variable that equals 1 if the participant scored above 3.6 during the pitch day, and 245&'!ℎ_8$9;!"%(< is a fourth-degree polynomial of the pitch-day score. The vertical line represents the implicit score cut-off of 3.6.

59
Figure 6 – Density of Pitch-Day Scores
The figure presents a finely gridded histogram of the pitch-day scores for all participants looking to qualify for the mentor arm. Judges give applications a score from 1 to 5. Average scores range in practice from 0 to 4.45. The null hypothesis of no discontinuity in the distribution of the normalized application scores at the threshold cannot be rejected: the t-statistic from the McCrary test is -0.191. The McCrary test uses a local linear regression of the histogram separately on either side of the threshold to accommodate the discontinuity. For more detail, see McCrary (2008).
0.2
.4.6
.8
-2 0 2 4 6Pitch-Day Score

60
Figure 7– Start-Up Outcomes and Mentoring
The figure shows the reduced form of the estimated effect of participation in the mentor arm on performance. The plots depict the fitted values and 90% confidence interval of estimates from the equation,outcome' = α + β,-./01.3 + g56Pitch_DayScore'A + ϵ' , where ,-./01.3 is an indicator variable that equals 1 if the participant scored above 3.6 during the pitch day, and C56DEFGℎ_IJKLG.M0NA, a fourth-degree polynomial of the pitch-day score. Three performance outcomes are included in the figure: Capital raised after, Employees, and Customer base. Capital raised after is a dummy that equals 1 if the venture raised capital after potential participation in the program, Employees corresponds to the number of employees, and Customer base is a measure of the size of the market normalized by industry.
-.20
.2.4
.6
0 1 2 3 4 5Pitch-Day Score
Capital Raised After
-20
24
68
0 1 2 3 4 5Pitch-Day Score
Employees
-.50
.51
1.5
0 1 2 3 4 5Pitch-Day Score
Customer base

61
Table 1 - Composition Sample: Start-Up Characteristics at Application by Generation Panel A: Applicants and Participants
Panel B: Capital Raised
Generation 1 2 3 4 5 6 7 Total - 1 462 3 13 0 0 0 479 No (Bootsrapped) 107 10 290 354 492 450 357 2,060 < 50K 10 1 72 72 116 92 134 497 50 K to 100K 3 1 20 15 24 24 50 137 100K to 500K 5 0 0 0 0 0 0 5 500K to 1 M 0 0 7 13 19 11 14 64 <5M 0 0 2 5 4 4 1 16 Total 126 474 394 472 655 581 556 3,258
Panel C: Number of Full-Time Workers
Generation 1 2 3 4 5 6 7 Total
- 126 474 394 9 6 1 0 1,010 1 0 0 0 145 180 149 96 570 2 0 0 0 173 239 221 193 826 3 0 0 0 83 126 131 142 482 4 0 0 0 37 51 42 55 185 5 0 0 0 15 24 20 38 97 6 0 0 0 8 11 13 16 48 7 0 0 0 0 5 1 5 11 8 0 0 0 0 4 2 3 9 9 0 0 0 0 1 0 4 5 10+ 0 0 0 2 8 1 4 15 Total 126 474 394 472 655 581 556 3,258
Generation Applicants Rejections Selections Participants Competed in Pitch Day
Mentored
1 126 40 86 64 2 474 324 150 125 3 394 295 99 85 4 472 374 98 74 62 13 5 655 554 101 90 80 15 6 581 476 105 95 89 18 7 556 456 100 83 45 13 Total 3,258 2,519 739 616 276 59

62
Panel D: Industry of Start-Up Generation
1 2 3 4 5 6 7 Total - 5 95 64 135 206 83 347 935 Consulting 0 0 0 0 3 0 0 3 E-commerce 32 81 54 57 73 95 35 427 Education 0 0 36 26 45 32 25 164 Energy & Clean Technology 6 24 10 4 13 10 9 76 Finance 6 12 10 7 5 12 5 57 Healthcare & Biotechnology 5 0 12 16 15 21 12 81 IT & Enterprise Software 29 97 59 48 57 67 30 387 Media 0 0 17 22 15 33 7 94 Mobile & Wireless 12 53 24 25 42 36 20 212 Natural Resources 0 0 6 4 13 10 2 35 Other 22 82 32 35 40 48 21 280 Social Enterprise 9 30 14 15 20 21 8 117 Social Media/Social Network 0 0 40 55 81 79 28 283 Tourism 0 0 16 23 27 34 7 107 Total 126 474 394 472 655 581 556 3,258
Panel E: Start-Up Development Stage
Generation 1 2 3 4 5 6 7 Total
- 126 14 2 2 5 0 0 149 Concept 0 118 100 124 155 137 53 687 Functional Product with users 0 83 69 87 140 126 195 700 Scaling Sales 0 21 11 24 19 18 35 128 Working Prototype in Development 0 238 212 235 336 300 273 1,594 Total 126 474 394 472 655 581 556 3,258
Panel F: Start-Up Age
Generation 1 2 3 4 5 6 7 Total
- 0 2 0 9 6 1 0 18 Less than 6 months 66 276 231 276 389 352 233 1,823 6-12 months 30 119 108 135 204 174 250 1,020 12-24 months 19 51 33 52 56 54 73 338 More than 2 years 11 26 22 0 0 0 0 59 Total 126 474 394 472 655 581 556 3,258
Table 1 describes the composition of the sample, which includes 3,258 applicant start-ups to the accelerator. Observations are at the start-up level. Panel A describes the fraction of rejected applicants, selected applicants, participants, participants that compete in the pitch day, and mentored participants. Participants can differ from selected applicants, because some start-ups do not ultimately accept the invitation to participate in the accelerator. Panels B through F show the sample composition across different characteristics of start-up applicants.
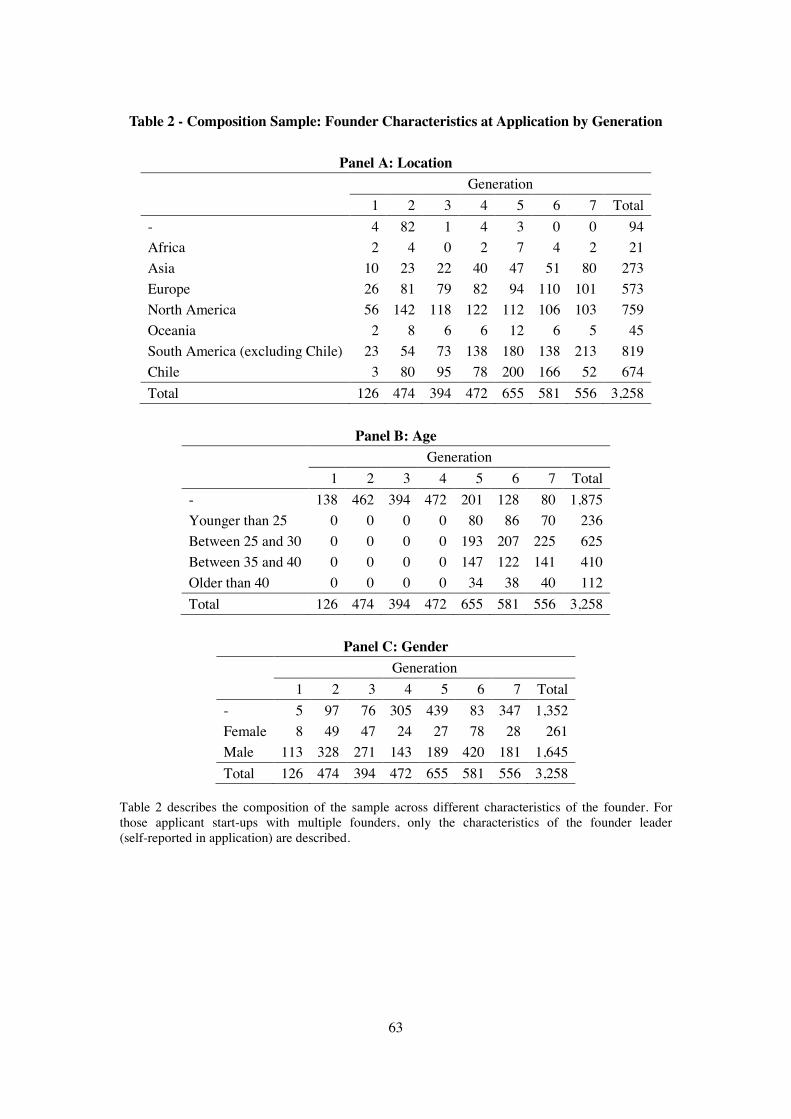
63
Table 2 - Composition Sample: Founder Characteristics at Application by Generation
Panel A: Location
Generation 1 2 3 4 5 6 7 Total - 4 82 1 4 3 0 0 94 Africa 2 4 0 2 7 4 2 21 Asia 10 23 22 40 47 51 80 273 Europe 26 81 79 82 94 110 101 573 North America 56 142 118 122 112 106 103 759 Oceania 2 8 6 6 12 6 5 45 South America (excluding Chile) 23 54 73 138 180 138 213 819 Chile 3 80 95 78 200 166 52 674 Total 126 474 394 472 655 581 556 3,258
Panel B: Age
Generation 1 2 3 4 5 6 7 Total
- 138 462 394 472 201 128 80 1,875 Younger than 25 0 0 0 0 80 86 70 236 Between 25 and 30 0 0 0 0 193 207 225 625 Between 35 and 40 0 0 0 0 147 122 141 410 Older than 40 0 0 0 0 34 38 40 112 Total 126 474 394 472 655 581 556 3,258
Panel C: Gender
Generation 1 2 3 4 5 6 7 Total
- 5 97 76 305 439 83 347 1,352 Female 8 49 47 24 27 78 28 261 Male 113 328 271 143 189 420 181 1,645 Total 126 474 394 472 655 581 556 3,258
Table 2 describes the composition of the sample across different characteristics of the founder. For those applicant start-ups with multiple founders, only the characteristics of the founder leader (self-reported in application) are described.

64
Table 3- Summary Statistics and Mean Differences
Panel A- All Applicants Variable Obs. Mean Std. Dev. Min. Max. Age 1,582 30.33 6.76 19.00 84.00 Chilean 3,258 0.21 0.41 0.00 1.00 Female 1,906 0.14 0.34 0.00 1.00 Full-time workers 2,248 2.46 1.46 1.00 10.00 Money raised before 2,779 0.26 0.44 0.00 1.00 Prototype 3,258 0.49 0.50 0.00 1.00 Young 3,258 0.56 0.50 0.00 1.00 Capital raised after 3,258 0.03 0.16 0.00 1.00 Amount raised after 3,258 1.59 39.77 0.00 2,100 Seed after 3,258 0.02 0.15 0.00 1.00 Series A after 3,258 0.00 0.05 0.00 1.00 Employees 3,258 0.53 1.94 0.00 11.00 Team size 3,258 0.20 0.64 0.00 3.00 Customer base 3,258 0.23 3.20 0.00 117.98 Short-term survival 3,258 0.08 0.27 0.00 1.00 Long-term survival 3,258 0.21 0.41 0.00 1.00
Panel B- Participants and Non-participants
Participants Non-participants Difference Variable Obs. Mean Std. Dev. Obs. Mean Std. Dev.
Age 264 30.73 6.50 1,318 30.25 6.81 0.47 Chilean 616 0.19 0.40 2,642 0.21 0.41 -0.04* Female 567 0.15 0.36 1,339 0.13 0.34 0.02 Full-time workers 340 2.74 1.71 1,908 2.41 1.40 0.33*** Money raised before 488 0.32 0.47 2,291 0.25 0.43 0.07*** Prototype 616 0.45 0.50 2,642 0.50 0.50 0.05** Young 616 0.50 0.50 2,642 0.57 0.49 -0.07*** Capital raised after 616 0.08 0.27 2,642 0.01 0.12 0.06*** Amount raised after 616 2.45 19.79 2,642 1.39 43.12 1.06 Seed after 616 0.07 0.26 2,642 0.01 0.11 0.06*** Series A after 616 0.00 0.07 2,642 0.00 0.04 0.00 Employees 616 1.06 2.66 2,642 0.41 1.71 0.65*** Team size 616 0.48 0.95 2,642 0.14 0.53 0.34*** Customer base 616 0.62 6.01 2,642 0.14 2.04 0.47*** Short-term survival 616 0.22 0.41 2,642 0.05 0.21 0.17*** Long-term survival 616 0.46 0.50 2,642 0.15 0.36 0.30***

65
Panel C- Mentored and Non-mentored Participants Mentored Non-mentored Difference
Variable Obs. Mean Std. Dev. Obs. Mean Std. Dev.
Age 44 29.68 5.44 166 30.95 6.93 -1.27 Chilean 59 0.10 0.30 217 0.24 0.43 -0.14** Female 48 0.13 0.33 199 0.18 0.38 -0.05 Full-time workers 59 2.69 1.83 215 2.67 1.68 0.03 Money raised before 59 0.42 0.50 215 0.28 0.45 0.14** Prototype 59 0.36 0.48 217 0.57 0.50 -0.21** Young 59 0.41 0.50 217 0.48 0.50 -0.08 Capital raised after 59 0.17 0.38 217 0.08 0.27 0.09** Amount raised after 59 9.88 34.36 217 2.08 24.52 7.80** Seed after 59 0.15 0.36 217 0.08 0.27 0.07* Series A after 59 0.05 0.22 217 0.00 0.00 0.05*** Employees 59 1.20 2.71 217 0.82 2.29 0.38 Team size 59 0.83 1.19 217 0.47 0.91 0.36** Customer base 59 0.75 2.86 217 0.10 0.33 0.65** Short-term survival 59 0.27 0.45 217 0.18 0.39 0.09 Long-term survival 59 0.64 0.48 217 0.54 0.50 0.10
This table presents the summary statistics of the main variables used in the empirical analysis (Panel A), and their mean differences across participants and non-participants (Panel B) and across mentored and non-mentored participants (Panel C). Observations are at the applicant level. Variables in the first panel are retrieved from the application forms. Age corresponds to the age of the founder, Chilean (Female) is a dummy that equals 1 if the founder is Chilean (Female), Full-time workers is the number of workers reported by the start-up at the time of application (censored at 10), Money raised before is a dummy that equals 1 if the start-up raised financing before potential participation in the program, Prototype equals 1 if the start-up has a prototype in development, and Young equals 1 if the start-up is less than a year old. Variables in the second panel are retrieved from AngelList, Crunchbase, Facebook, Linkedin, and CBInsights. Section 1.2 includes a detailed explanation. Capital raised after is a dummy that equals 1 if the venture raised capital after potential participation in the program, Amount raised after corresponds to the dollar value raised after potential participation in the program (in tens of thousands), Seed after (Series A after) is an indicator for having raised seed (Series A) financing after potential participation, Employees corresponds to the number of employees, and Team size corresponds to the team size including the founders and employees in executive positions. Customer base is a measure of the size of the market normalized by industry, and Short-term Survival (Long-term Survival) is a dummy that equals 1 if the venture is still in operation by January 2014 (January 2015).

66
Table 4- Discontinuity Probability of Participation around the Capacity Threshold
(1) (2) (3) (4) (5) Above 0.166*** 0.169*** 0.210*** 0.278*** 0.189** (0.041) (0.041) (0.056) (0.103) (0.085) Constant 0.311*** 0.285*** 0.349*** 0.337*** (0.022) (0.043) (0.075) (0.083) Observations 3,258 3,258 1,519 1,519 513 R-squared 0.399 0.400 0.476 0.476 Generation FE No Yes Yes Yes No Covariates No No Yes Yes No Degree Poly. 4 4 4 4(3) 1 Diff. poly. left and right No No No Yes Estimate OLS OLS OLS OLS CCT
This table shows the discontinuity in the probability of participation in the business accelerator around the capacity-threshold-ranking cutoff. Columns (1)-(3) report the constant (!" and the coefficient of #$%&' ( (" of the regression, #))'*'+#,-%. = ! + (ℎ-2ℎ'+ + 345#.6 − )8,%33" + 9 , where participation is a variable that equals 1 if the applicant participated in the accelerator, on ℎ-2ℎ'+, a variable that equals 1 if the applicant ranks higher than the capacity threshold in its generation, and 0 otherwise, and 345#.6 − )8,%33" a fourth-degree polynomial of the modified rank (i.e., : = 5#.6 −)8,%33). To conserve space, the estimated coefficients for the polynomial terms are not presented in the table. Columns (2) and (3) present the estimates when the regression additionally includes generation fixed effects and covariates, respectively. The covariates included are Chilean, Female, Money raised before, Prototype, and Young. Column (4) allows the degree of the polynomial to differ on either side of the threshold, 4 and 3 (left and right), respectively. Column (5) reports the estimates when using a local linear estimation following Calonico et al. (2014) (CCT). The optimal bandwidth-selection algorithm is based on Calonico et al. (2014) (CCT) and generates a bandwidth of 73 (except generation 2 with 75) observations around the capacity threshold. Robust standard errors are presented in parentheses. *, **, and *** indicate statistical significance at the 10%, 5%, and 1% levels, respectively.

67
Table 5- Start-Up Outcomes and Basic Acceleration Services
Panel A-Venture Financing (1) (2) (3) (4) (5) (6) (7) (8) Dep.Variable Capital raised after Seed after Series
A after Acceleration 0.062*** 0.069*** 0.063*** 0.049 -0.045 0.061*** -0.031 0.005 (0.011) (0.015) (0.015) (0.103) (0.138) (0.015) (0.133) (0.005) Constant 0.014*** 0.024*** -0.170** 0.027 -0.119 -0.170** -0.127 -0.004 (0.002) (0.005) (0.070) (0.040) (0.097) (0.071) (0.097) (0.005) Observations 3,258 1,519 1,519 3,258 1,519 1,519 1,519 1,519 R-squared 0.024 0.023 0.076 0.025 0.054 0.078 0.061 0.005 Gen. FE No No Yes No Yes Yes Yes Yes Covariates No No Yes No Yes Yes Yes Yes Degree poly. 4 4 4 Estimate OLS OLS OLS RDD RDD OLS RDD OLS #80% power 221 211 214 352 417 191 737 3,785
Panel B–Venture Scale
(1) (2) (3) (4) (5) (6) (7) (8) Dep.Variable Customer Base Team Size Acceleration 0.475* 0.145 -0.731 2.404 0.344*** 0.296*** 0.244 0.294 (0.245) (0.178) (2.956) (1.599) (0.039) (0.052) (0.388) (0.485) Constant 0.140*** 0.818 0.403 -0.353 0.410*** -0.172 1.227** 0.804 (0.040) (0.683) (1.010) (0.599) (0.033) (0.541) (0.545) (0.968) Observations 3,258 1,519 3,258 1,519 3,258 1,519 3,258 1,519 R-squared 0.003 0.009 0.003 0.009 0.044 0.068 0.046 0.073 Gen. FE No Yes No Yes No Yes No Yes Covariates No Yes No Yes No Yes No Yes Degree poly. 4 4 4 4 Estimate OLS OLS RDD RDD OLS OLS RDD RDD #80% power 1,080 11,580 456 43 140 189 277 191
Panel D–Venture Survival
(1) (2) (3) (4) (5) (6) (7) (8) Dep.Var. Short-term survival Long-term survival Accelerat. 0.316*** 0.190*** -0.049 0.023 0.305*** 0.254*** 0.272 0.184 (0.020) (0.027) (0.237) (0.275) (0.021) (0.027) (0.238) (0.265) Constant 0.084*** 0.446** 0.234** 0.524** 0.154*** 0.240 0.203** 0.273 (0.005) (0.222) (0.091) (0.254) (0.007) (0.249) (0.093) (0.280) Obs. 3,258 1,519 3,258 1,519 3,258 1,519 3,258 1,519 R-squared 0.124 0.130 0.057 0.118 0.085 0.121 0.094 0.130 Gen. FE No Yes No Yes No Yes No Yes Covariates No Yes No Yes No Yes No Yes

68
Deg. Pol. 4 4 4 4 Estimate OLS OLS RDD RDD OLS OLS RDD RDD #80% pow. 34 73 1,075 4,878 83 118 104 225
This table reports the effects of basic acceleration services (cash and co-working space) on venture performance. Estimates are based on the regression outcomes=π+β,--./.0,12345 + 6789,4:5 −-<1366=> + ?5, where ,--./.0,1234 is a variable that equals 1 if the applicant participated in the accelerator. The outcome variable is specified in the title of the panel and on top of each column, and the type of estimate (i.e., OLS or RDD) is reported at the bottom of each column. For the OLS estimate, the high-order polynomials of the normalized ranking (i.e., 6789,4:5 − -<1366=>) are excluded from the estimation. For the RDD estimate, @,012-2@,1234 is instrumented using ℎ2Bℎ.0, a variable that equals 1 if the applicant ranks ℎ2Bℎ.0 than the capacity threshold in its generation, and 0 otherwise, and 689,4: − -<1366>, a fourth-degree polynomial of the modified rank (i.e., C = 9,4: − -<1366). To conserve space, the estimated coefficients for the polynomial terms in the second stage are not presented in the table. The covariates included are Chilean, Female, Money raised before, Prototype, and Young. The bottom row reports the sample size necessary to distinguish the estimated effect from zero with an 80% probability estimated using the sampsi command in Stata based on the mean and standard deviation of the sample of non-participants as the baseline, as well as the observed sample-size ratio (participants vs. non-participants). Robust standard errors are presented in parentheses. *, **, and *** indicate statistical significance at the 10%, 5%, and 1% levels, respectively.

69
Table 6- Discontinuity Probability of Mentoring Around Pitch-Day Score of 3.6
(1) (2) (3) (4) Above 0.332*** 0.268** 0.247** 0.229* (0.116) (0.115) (0.117) (0.116) Constant 0.133*** 0.136*** 0.090 0.160*** (0.039) (0.036) (0.077) (0.007) Observations 276 276 245 78 R-squared 0.426 0.468 0.522 0.227 Generation FE No Yes Yes No Covariates No No Yes No Degree Polynomial 4 4 4 1 Sample All All All Restricted Estimate OLS OLS OLS OLS
This table shows the discontinuity in the probability of participation in the mentor arm around the pitch-day-score cutoff. Columns (1)-(3) report the constant (!" and the coefficient of #$%&'(.* (+" of the regression: ,'-.%/ = ! + +#$%&'(.* + 2345.6ℎ_9:;=6%/'" + > , where the outcome variable mentor is an indicator variable that equals 1 if the participant was selected into the mentor arm, #$%&'(.* is an indicator variable that equals 1 if the participant scored above 3.6 during the pitch day, and 2345.6ℎ_9:;=6%/'" is a fourth-degree polynomial of the pitch-day score. To conserve space, the estimated coefficients for the polynomial terms are not presented in the table. Columns (2) and (3) present the estimates when the regression additionally includes generation fixed effects and covariates, respectively. The covariates included are Chilean, Female, Money raised before, Prototype, and Young. In column (4), the observations are restricted to start-ups that scored between 3.3 and 3.8 during the pitch day. Robust standard errors are presented in parentheses. *, **, and *** indicate statistical significance at the 10%, 5%, and 1% levels, respectively.

70
Table 7- Venture Financing and the Mentor Arm
Panel A–Capital Raised after (1) (2) (3) (4) (4) (6) (7) (8) Acceleration 0.091* 0.094* 0.203** 0.181** 0.211** 0.275* 0.424** 0.424** (0.052) (0.053) (0.091) (0.090) (0.094) (0.154) (0.200) (0.213) Constant 0.078*** 0.035 0.063** 0.031 0.049 0.039 0.001 0.013 (0.018) (0.031) (0.029) (0.040) (0.034) (0.034) (0.043) (0.046) Observations 276 274 276 274 276 158 274 274 R-squared 0.016 0.056 0.047 0.047 0.031 0.037 0.030 0.030 Gen. FE No Yes No Yes No No Yes Yes Covariates No Yes No Yes No No Yes Yes Degree poly. 4 4 5 1 4,4 5,5 Estimate OLS OLS RDD RDD RDD RDD RDD RDD #80% power 415 388 84 106 78 46 20 20
Panel B-Seed after
(1) (2) (3) (4) (5) (6) (7) (8) Acceleration 0.074 0.076 0.176** 0.156* 0.183** 0.275* 0.374* 0.383* (0.050) (0.052) (0.088) (0.088) (0.091) (0.154) (0.193) (0.206) Constant 0.078*** 0.038 0.064** 0.034 0.051 0.039 0.005 0.016 (0.018) (0.031) (0.028) (0.040) (0.034) (0.034) (0.042) (0.045) Observations 276 274 276 274 276 158 274 274 R-squared 0.011 0.050 0.042 0.037 0.042 0.042 Gen. FE No Yes No Yes No No Yes Yes Covariates No Yes No Yes No No Yes Yes Degree poly. 4 4 5 1 4,4 5,5 Estimate OLS OLS RDD RDD RDD RDD RDD RDD #80% power 625 592 111 141 103 46 26 25
Panel C-Series A after
(1) (2) (3) (4) (5) (6) (7) (8) Acceleration 0.051* 0.052* 0.081* 0.073* 0.082* 0.061 0.121 0.119 (0.029) (0.029) (0.045) (0.041) (0.046) (0.060) (0.092) (0.092) Constant -0.000 0.006 0.000 0.008 -0.002 -0.009 0.001 0.001 (0.000) (0.015) (0.008) (0.021) (0.011) (0.009) (0.015) (0.015) Observations 276 274 276 274 276 158 274 274 R-squared 0.040 0.051 0.032 0.051 0.032 0.002 0.021 0.025 Gen. FE No Yes No Yes No No Yes Yes Covariates No Yes No Yes No No Yes Yes Degree poly. 4 4 5 1 4,4 5,5 Estimate OLS OLS RDD RDD RDD RDD RDD RDD #80% power 420 412 261 291 258 350 172 176

71
This table reports the effects of participation in the mentor arm (bundled with the basic services of cash and co-working space) on venture performance. Estimates are based on the regression !"#$!%&' =) + +%&,#!-' + ./012#$ℎ_5679$!-&': + ;' , where %&,#!-' is a variable that equals 1 if the participant was selected into the mentor arm. The outcome variable is specified in the title of the panel and on top of each column, and the type of estimate (i.e., OLS or RDD) is reported at the bottom of each column. For the OLS estimate, the high-order polynomials of the pitch-day score (i.e., ./012#$ℎ_5679$!-&': ) are excluded from the estimation. For the RDD estimate, %&,#!-' is instrumented using <=!>&?.A, an indicator variable that equals 1 if the participant scored above 3.6 during the pitch day, and .012#$ℎ_5679$!-&:, a fourth-degree polynomial of the pitch-day score. To conserve space, the estimated coefficients for the polynomial terms in the second stage are not presented in the table. The covariate included is Money raised before. The bottom row reports the sample size necessary to distinguish the estimated effect from zero with an 80% probability estimated using the sampsi command in Stata based on the mean and standard deviation of the sample of non-mentored pitch-day participants as the baseline, as well as the observed sample-size ratio (mentored vs. non-mentored pitch-day participants). Robust standard errors are presented in parentheses. *, **, and *** indicate statistical significance at the 10%, 5%, and 1% levels, respectively.

72
Table 8- Other Venture Outcomes and the Mentor Arm Panel A–Venture Scale
(1) (2) (3) (4) (5) (6) (7) (8) Dep. Variable Customer Base Team Size Acceleration 0.646* 0.667* 2.381* 2.495 0.356** 0.330** 0.422* 0.336 (0.371) (0.344) (1.391) (1.571) (0.166) (0.159) (0.251) (0.235) Constant 0.101*** 0.112*** -0.424 0.055 0.475*** 0.445*** 0.441*** 0.455*** (0.022) (0.035) (0.332) (0.085) (0.062) (0.125) (0.101) (0.150) Observations 276 276 276 276 276 276 276 276 R-squared 0.000 0.038 0.000 0.047 0.022 0.102 0.031 0.117 Generation FE
No Yes No Yes No Yes No Yes
Covariates No Yes No Yes No Yes No Yes Degree poly. 4 4 4 4 Estimate OLS OLS RDD RDD OLS OLS RDD RDD #80% power 13 13 2 2 308 357 219 345
Panel B–Venture Scale Continued (1) (2) (3) (4) Dep. Variable Employees Acceleration 0.379 0.325 5.372* 6.007 (0.350) (0.394) (2.735) (4.195) Constant 0.825*** 0.702** 3.007 3.200 (0.162) (0.279) (2.342) (2.493) Observations 276 274 276 274 R-squared 0.004 0.063 5.372* 6.007 Generation FE No Yes No Yes Covariates No Yes No Yes Degree poly. 4 4 Estimate OLS OLS RDD RDD #80% power 1,712 2,328 11 10
Panel C–Venture Survival (1) (2) (3) (4) (5) (6) (7) (8) Short-term survival Long-term survival Acceleration 0.091 0.091 0.133 0.044 0.100 0.072 0.443 0.132 (0.064) (0.065) (0.391) (0.465) (0.071) (0.071) (0.447) (0.504) Constant 0.180*** 0.000 0.188 0.001 0.544*** 0.000 0.378*** -0.009 (0.026) (0.000) (0.122) (0.014) (0.034) (0.000) (0.139) (0.016) Obs. 276 276 276 276 276 276 276 276 R-squared 0.009 0.022 0.015 0.031 0.007 0.065 0.081 0.081 Gen. FE No Yes No Yes No Yes No Yes Covariates No Yes No Yes No Yes No Yes Degree Pol. 4 4 4 4 Estimate OLS OLS RDD RDD OLS OLS RDD RDD #80% power 863 863 404 3,685 1,173 2,262 61 674

73
This table reports the effects of participation in the mentor arm (bundled with the basic services of cash and desk) on venture performance. Estimates are based on the regression !"#$!%&' = ) + +%&,#!-' + ./012#$ℎ_5679$!-&': + ;', where %&,#!-' is a variable that equals 1 if the participant was selected into the mentor arm. The outcome variable is specified in the title of the panel and on top of each column, and the type of estimate (i.e., OLS or RDD) is reported at the bottom of each column. For the OLS estimate, the high-order polynomials of the pitch-day score (i.e., ./012#$ℎ_5679$!-&': ) are excluded from the estimation. For the RDD estimate, %&,#!-' is instrumented using <=!>&?.A, an indicator variable that equals 1 if the participant scored above 3.6 during the pitch day, and .012#$ℎ_5679$!-&:, a fourth-degree polynomial of the pitch-day score. To conserve space, the estimated coefficients for the polynomial terms in the second stage are not presented in the table. The covariate included is Money raised before. The bottom row reports the sample size necessary to distinguish the estimated effect from zero with an 80% probability estimated using the sampsi command in Stata based on the mean and standard deviation of the sample of non-mentored pitch-day participants as the baseline, as well as the observed sample-size ratio (mentored vs. non-mentored pitch-day participants). Robust standard errors are presented in parentheses. *, **, and *** indicate statistical significance at the 10%, 5%, and 1% levels, respectively.

74
Table 9- Heterogeneity in Mentoring Impact on Venture Outcomes
Panel A–Venture Financing (1) (2) (3) (4) (5) (6) Dep. Variable Total Seed VC Acceleration 0.404 0.184* 0.091 0.184* 0.313 0.055 (0.350) (0.093) (0.351) (0.093) (0.241) (0.039) Constant -0.153* 0.054 -0.109 0.054 -0.044 0.015 (0.087) (0.047) (0.087) (0.047) (0.041) (0.027) Observations 58 216 58 216 58 216 R-squared 0.271 0.033 0.198 0.033 0.262 0.039 Generation FE Yes Yes Yes Yes Yes Yes Covariates Yes Yes Yes Yes Yes Yes Chilean Yes No Yes No Yes No Degree poly. 4 4 4 4 4 4 Estimate RDD RDD RDD RDD RDD RDD z-value diff. 0.61 -0.26 1.06
Panel B–Venture Scale
(1) (2) (3) (4) Dep. Variable Customer Base Team Size Acceleration 3.328 0.190 1.692** 0.269 (2.483) (0.315) (0.754) (0.249) Constant -0.387 0.017 -0.019 0.600*** (0.432) (0.131) (0.238) (0.188) Observations 58 216 58 216 R-squared 0.214 0.084 0.359 0.115 Generation FE Yes Yes Yes Yes Covariates Yes Yes Yes Yes Chilean Yes No Yes No Degree poly. 4 4 4 4 Estimate RDD RDD RDD RDD z-value diff. 1.25 1.79
Panel C–Venture Survival
(1) (2) (3) (4) Dep. Variable Short-term Long-term Acceleration 0.910* -0.090 0.456 0.052 (0.475) (0.117) (0.420) (0.105) Constant 0.155 0.430*** 0.185 0.196*** (0.178) (0.091) (0.133) (0.072) Observations 58 216 58 216 R-squared 0.214 0.084 0.359 0.115 Generation FE Yes Yes Yes Yes

75
Covariates Yes Yes Yes Yes Chilean Yes No Yes No Degree poly. 4 4 4 4 Estimate RDD RDD RDD RDD z-value diff. 2.04 0.93
This table reports the effects of participation in the mentor arm (bundled with the basic services of cash and desk) on venture performance. Estimates are based on the regression !"#$!%&' = ) + +%&,#!-' + ./012#$ℎ_5679$!-&': + ;', where %&,#!-' is a variable that equals 1 if the participant was selected into the mentor arm. The outcome variable is specified in the title of the panel and on top of each column, and the type of estimate (i.e., OLS or RDD) is reported at the bottom of each column. For the OLS estimate, the high-order polynomials of the pitch-day score (i.e., ./012#$ℎ_5679$!-&': ) are excluded from the estimation. For the RDD estimate, %&,#!-' is instrumented using <=!>&?.A, an indicator variable that equals 1 if the participant scored above 3.6 during the pitch day, and .012#$ℎ_5679$!-&:, a fourth-degree polynomial of the pitch-day score. To conserve space, the estimated coefficients for the polynomial terms in the second stage are not presented in the table. The covariate included is Money raised before. The bottom row reports the z-value of coefficient comparison across estimates for Chileans and non-Chileans. Robust standard errors are presented in parentheses. *, **, and *** indicate statistical significance at the 10%, 5%, and 1% levels, respectively.

76
Table 10- Regional Effects: New-Business Registration Rates
(1) (2) (3) (4) Number Number Log. Log. Post 2010× Contiguous 0.314*** 0.024*** (0.097) (0.005) Post 2010× Contiguous ×Venture 0.483** 0.060*** (0.213) (0.022) Observations 426,180 426,180 426,180 426,180 R-squared 0.043 0.900 0.062 0.783 Comuna FE Yes Yes Year FE Yes Yes Industry×Year FE Yes Yes Industry×Comuna FE Yes Yes Comuna×Year FE Yes Yes
This table reports the regional effects of the program on new-business registration rates. Estimates in columns (1) and (3) are based on the regression !"#%&'()"''*+, = ., + .* + 01'2_2010, ×81)2(9&1&'* + :*+, , where !"#%&'()"''*+, corresponds to the number and logarithm of new businesses registered in comuna c, industry i, and time t, respectively, and 01'2_2010 is a dummy that equals 1 after 2010 (i.e., the inception year of the program) and 81)2(9&1'* equals 1 if the comuna neighbors the comuna where the program is headquartered. In detail, the contiguos comunas correspond to Independencia, Providencia, Nunoa, San Joaquin, San Miguel, Pedro Aguirre Cerda, Estacion Central, Quinta Normal, and Santiago Central. Estimates in columns (2) and (4) are based on the regression !"#%&'()"''*+, = .+, + .+* + .*; + 01'2_2010, × 81)2(9&1&'* × <")2&="+ + :*+,, where <")2&="+ equals 1 for all those industries similar to the industries of the program’s participants (i.e., venture industries): activities of experimental research and development, auxiliary transport activities, business-to-business services, information services, other types of financial intermediation, retail trade not realized in shops, telecommunications, and travel agencies. Robust standard errors are presented in parentheses. *, **, and *** indicate statistical significance at the 10%, 5%, and 1% levels, respectively.

77
Appendix A.1- Complementary Tables and Figures
Table A1. Differences across Non-mentored Participants and Non-participants
Non-mentored Participants
Non-participants Difference Variable Obs. Mean Std. Dev. Obs. Mean Std. Dev. Age 212 30.98 6.77 1,318 30.25 6.81 0.72 Chilean 548 0.20 0.40 2,642 0.21 0.41 -0.01 Female 512 0.16 0.36 1,339 0.13 0.34 0.03 Full-time workers 272 2.75 1.71 1,908 2.41 1.40 0.34*** Money raised before 420 0.31 0.46 2,291 0.25 0.43 0.07*** Prototype 548 0.46 0.50 2,642 0.50 0.50 -0.04*** Young 548 0.51 0.50 2,642 0.57 0.49 -0.01** Capital raised after 548 0.07 0.25 2,642 0.01 0.12 0.05*** Amount raised after 548 1.69 17.57 2,642 1.39 43.12 0.29 Seed after 548 0.07 0.25 2,642 0.01 0.11 0.05*** Series A after 548 0.00 0.00 2,642 0.00 0.04 0.00 Employees 548 1.06 2.68 2,642 0.41 1.71 0.65*** Team size 548 0.43 0.90 2,642 0.14 0.53 0.30*** Customer base 548 0.61 6.30 2,642 0.14 2.04 0.47*** Short-term survival 548 0.21 0.41 2,642 0.05 0.21 0.17*** Long-term survival 548 0.44 0.50 2,642 0.15 0.36 0.28***
This table presents mean differences for the main variables used in the analysis across non-mentored participants and non-participants. Observations are at the applicant level. Variables in the first panel are retrieved from the application forms. Age corresponds to the age of the founder, Chilean (Female) is a dummy that equals 1 if the founder is Chilean (Female), Full-time workers is the number of workers reported by the start-up at the time of application (censored at 10), Money raised before is a dummy that equals 1 if the start-up raised financing before potential participation in the program, Prototype equals 1 if the start-up has a prototype in development, and Young equals 1 if the start-up is less than a year old. Variables in the second panel are retrieved from AngelList, Crunchbase, Facebook, Linkedin, and CBInsights. Section 1.2 includes a detailed explanation. Capital raised after is a dummy that equals 1 if the venture raised capital after potential participation in the program, Amount raised after corresponds to the dollar value raised after potential participation in the program (in tens of thousands), Seed after (Series A after) is an indicator for having raised seed (Series A) financing after potential participation, and Employees corresponds to the number of employees. Customer base is a measure of the size of the market normalized by industry, and Short-term survival (Long-term survival) is a dummy that equals 1 if the venture is still in operation by January 2014 (January 2015).

78
Figure A1 –Industry Distribution near Threshold
Panel A. Industry Distribution across Participants
Panel B. Industry Distribution across Non-participants
The figure shows distribution across industries of participants and non-participants near the capacity threshold.

79
Appendix A.2- Business Accelerators and Founder Survival
Panel A- Basic Accelerator Services
Panel B- Mentor Arm
The figure shows the reduced-form estimates on founder survival of participation in the program and of participation in the mentor arm. Founder survival is measured as the probability that the founder remains working as an entrepreneur by January 2014. Panel A depicts the fitted values and 90% confidence interval of estimates from equation,!"#$%&')#'*+*,-. = 0 + 2ℎ+4ℎ&'. + !567,$8. − :#;"!!<= + >., where ℎ+4ℎ&'. is an indicator variable that equals 1 if the applicant ranks above the capacity threshold of its generation, and 0 otherwise, and !567,$8. − :#;"!!<= , a fourth-degree polynomial in the normalized ranking. Panel B depicts the fitted values and 90% confidence interval of estimates from equation !"#$%&')#'*+*,-. = ? + 2@A"*&B.D + 4E6F+;:ℎ_H,IJ:"'&.= + >., where @A"*&B.D is an indicator variable that equals 1 if the participant scored above 3.6 during the pitch day, and 4E6F+;:ℎ_H,IJ:"'&.=, a fourth-degree polynomial of the pitch-day score.
.1.2
.3.4
.5
-100 0 100 200z=Rank-cutoff
Founder
0.5
1
0 1 2 3 4 5Pitch-Day Score
Founder

80
Appendix A.3- Survey Real Outcomes for Start-Up Chile Applicants
In October of 2014, we sent all applicants to Start-Up Chile, from the first generation through the seventh, including the 3,258 applicants in our sample, an email invitation to participate in our survey. Companies in generation 1 applied to the program in March of 2011, and those from generation 7 did so in March of 2013. Generation 7 graduated from the program in January of 2014. Therefore, the surveyed population of start-ups had a considerable amount of time since inception and graduation from Start-Up Chile. Of the total number of invitations, 184 bounced due to email addresses that no longer existed, likely because individuals who applied to the program did so using their start-up’s Internet domain name, which may cease to exist when the venture is no longer pursued. Of the remaining population, 332 submitted fully completed surveys, the rest initiated but did not submit the survey, or opted out. The response rate ranged from 6% for generation 1 to 16% for generation 7. The larger response rate for latter generations probably reflects a greater sense of commitment to Start-Up Chile for those more recently involved in the program.
We dropped 176 observations because the respondents did not answer beyond the first few questions. We further dropped 24 observations because of response ambiguity, that is, survey respondents who declared they had participated in Start-Up Chile, but who were not in the registry of the program, or who declared they had not participated in Start-Up Chile, but who were in the program’s registry. This process left us with a total of 298 unambiguous survey responses.
Panel A in Figure A3.1 plots the distribution of the respondent’s rank around the capacity threshold. The distribution exhibits “patches;” for example, no companies ranking between 30-40 below the capacity threshold completed the survey. Of the 298 survey responses, 198 correspond to non-participants, 100 correspond to program participants, and 13 to mentored ventures. Of respondents with a normalized ranking between -75 and +75 (-50 and +50), 62 (36) correspond to participants, and 39 (5) to non-participants.
Panel B in Figure A3.1 plots the distribution of respondent-participants’ pitch-day score. Of the 75 participants from generations 4 to 7 who answered the survey, only 57 participated in the pitch-day competition. The distribution of respondent-participants that competed in the pitch day is concentrated in scores close to 3.0, with 30% of pitch-day scores between 2.8 and 3.0. The number of participants that scored close to 3.6 during the threshold is small; in particular, if we restrict the sample to those scoring between 2.9 and 4.4, the sample reduces in size to 34 observations (11 mentored and 23 non-mentored participants).
Panel A in Table A3.2 shows respondents are different from non-respondents on several dimensions; in particular, they are on average more successful, as measured by the web-based metrics. They are more likely to have secured financing, to grow

81
their customer base and teams, and to have survived. These differences are consistent with standard positive biases in surveys (i.e., those ventures that have been more successful are more likely to answer the survey). They are also expected, given the motivation provided to respondents: receiving a report comparing their performance to similar start-ups and participation in an IPAD raffle. Panels B and C compare participants and non-participants, and mentored and non-mentored participants, among survey respondents. On average, participants outperform non-participants on fund-raising, scale, and survival. Average differences in performance among mentored and non-mentored survey respondents are not visible in Panel C.
A.3.1 Measures of Real Outcomes
Our survey comprised questions related to venture survival, venture scale, and venture fund-raising. We constructed indicator variables for venture survival (Survey survival) and venture pivoting (Survey pivoting), which equal 1 if the venture was still in operation by October 2014 and if the founder was operating a venture at that date but the company did not coincide with the one in the application. To measure venture scale, we collected information on the value of sales during the six months prior to the application (Survey Sales) and on the number of full-time employees (Survey Employees). Finally, we measured venture fund-raising as capital raised (Survey Capital) since inception and valuation as the pre-money valuation (Survey Valuation). Table A3.3 spells out the exact questions asked in the survey, and presents summary statistics of the real outcomes measures.
A.3.2 Analysis
Table A3.4 compares participants and non-participants that responded the survey. Consistent with Table A3.2, on average, participants are more likely to raise financing (column (1) in Panel A) and have higher valuations (column (5), Panel A) than non-participants. Consistent with the results presented in section 2, however, differences across applicants on either side of the capacity threshold—in the same spirit as the RDD—are not significant and the point estimate is close to zero (columns (2) and (6) in Panel A), particularly when the sample is restricted to observations near the capacity threshold: companies ranking between -75 and +75 (columns (3) and (7), Panel A) and between -50 and +50 (columns (4) and (8), Panel A). Similarly, columns (1) and (3) in Panels B and C show the estimated average differences in sales, team size, and survival across participants and non-participants are positive (albeit not significant). But these differences are not significant and are reduced in magnitude when comparing participants on either side of the capacity threshold—namely, the reduced form of the RDD approach of section 2—as reported in columns (2)-(4) and (6)-(8) of panels B and C. Overall, results are consistent with those presented in section 2. We note that the limitation of this additional analysis is the potential sample selection: we only observe the survey measures for applicants that choose to answer the survey. As noted in section A3.1, respondents differ from non-respondents along several observable dimensions (and likely unobservable dimensions as well), which
82
makes interpretation of results challenging.
Table A.3.5 compares mentored and non-mentored participants that responded to the survey. Consistent with Panel B in Table A3.2, on average, respondents across these two groups of participants do not differ substantially in outcomes. The same conclusion holds when we compare mentored and non-mentored respondents scoring close to 3.6 during the pitch day—analogously to the reduced form of the RDD analysis in section 3. Note, however, that among the respondents in our sample, no mentored Chileans and no Chileans scored above 3.6 during the pitch day (the total number of Chilean respondents that participated in the pitch day is 8, and the maximum score among these participants was 3.2). The unfortunate lack of mentored Chileans likely explains why we observe no evidence of a significant impact of mentoring on performance, contrasting the results in section 3. Indeed, as shown in Table 9, the effect of mentoring on performance is strongest among Chilean participants.

83
Figure A3.1. Distribution of Survey Respondents Panel A. Distribution of Survey Respondents across the Normalized Rank
Panel B. Distribution of Survey Respondents across the Pitch-Day Score
Figure A3.1 plots the distribution of survey respondents across the normalized rank (Panel A) and the pitch-day score (Panel B). Panel A (B) plots the number of respondents in bins of 10 ranks (0.2 scores), where observations are at the start-up level. The total number of survey respondents in 298. Respondents in Panel B are restricted to 57 start-ups that participated during the pitch day and for which we observe the pitch-day score.
05
1015
Num
ber o
f Res
pond
ents
-200 -100 0 100 200Normalized Rank
05
10Nu
mbe
r of R
espo
nden
ts
0 1 2 3 4 5Pitch-Day Score

84
Table A3.1- Distribution of Survey Respondents
Table A3.1 describes the composition of the survey respondents, which includes a final sample of 298 ventures. Observations are at the start-up level. The table summarizes the number of respondents that participated in the accelerator, those that competed during the pitch day, and those that were ultimately selected into the mentor arm.
Gen. Surveyed Non- respondents
Ambiguous All Participants Competed Pitch Day
Mentored
1 126 118 8 3 2 474 443 31 13 3 394 366 1 27 9 4 472 438 5 29 13 13 4 5 655 598 5 52 17 14 2 6 581 517 4 60 15 15 3 7 556 459 6 91 30 15 4 Total 3,258 2,939 21 298 100 57 13

85
Table A3.2- Sample Comparisons
Panel A- Respondents and Non-respondents Respondents Non-respondents Difference
Variable Obs. Mean Std. Dev. Obs. Mean Std. Dev.
Age 198 30.85 6.88 1,370 30.23 6.74 0.62 Chilean 298 0.23 0.42 2,939 0.20 0.40 0.03 Female 205 0.13 0.34 1,689 0.14 0.34 -0.01 Full-time workers 231 2.55 1.45 1,998 2.44 1.45 0.11 Money raised before 265 0.30 0.46 2,493 0.25 0.43 0.05** Prototype 298 0.53 0.50 2,939 0.48 0.50 0.045 Young 298 0.50 0.50 2,939 0.57 0.50 0.07** Capital raised after 298 0.05 0.21 2,939 0.02 0.15 0.02** Amount raised after 298 1.45 17.65 2,939 1.50 40.97 -0.05 Seed after 298 0.04 0.20 2,939 0.02 0.15 0.02** Series A after 298 0.00 0.06 2,939 0.00 0.05 0.00 Employees 298 0.59 1.79 2,939 0.53 1.95 0.06 Team size 298 0.31 0.80 2,939 0.19 0.62 0.13*** Customer base 298 0.64 6.06 2,939 0.19 2.76 0.45** Short-term survival 298 0.12 0.32 2,939 0.07 0.26 0.04*** Long-term survival 298 0.32 0.47 2,939 0.20 0.40 0.12***
Panel B- Participant and Non-participant Respondents
Participants Non-participants Difference Variable Obs. Mean Std. Dev. Obs. Mean Std. Dev.
Age 59 32.59 7.97 139 30.12 6.25 2.48** Chilean 99 0.21 0.41 199 0.25 0.43 -0.03 Female 83 0.22 0.41 122 0.07 0.26 0.14*** Full-time workers 74 2.74 1.65 157 2.45 1.34 0.29 Money raised before 85 0.34 0.48 180 0.28 0.45 0.06 Prototype 99 0.60 0.49 199 0.50 0.50 0.10 Young 99 0.53 0.50 199 0.49 0.50 0.04 Capital raised after 99 0.10 0.30 199 0.02 0.14 0.08*** Amount raised after 99 1.14 5.29 199 1.61 21.29 0.47 Seed after 99 0.10 0.30 199 0.02 0.12 0.086*** Series A after 99 0.00 0.00 199 0.01 0.07 -0.01 Employees 99 0.96 2.38 199 0.41 1.38 0.55** Team size 99 0.53 0.97 199 0.21 0.68 0.32*** Customer base 99 0.87 7.45 199 0.52 5.25 0.35 Short-term survival 99 0.20 0.40 199 0.08 0.26 0.13*** Long-term survival 99 0.10 0.30 199 0.19 0.39 0.39***

86
Panel C- Mentored and Non-mentored Respondents Mentored Non mentored Difference
Variable Obs. Mean Std. Dev. Obs. Mean Std. Dev.
Age 8 31.25 6.04 34 33.15 8.80 -1.90 Chilean 13 0.00 0.00 44 0.18 0.39 -0.18* Female 9 0.22 0.44 37 0.27 0.45 -0.05 Full-time workers 13 2.23 1.09 44 2.86 1.85 -0.63 Money raised before 13 0.46 0.52 43 0.30 0.46 0.16 Prototype 13 0.38 0.51 44 0.73 0.45 -0.34** Young 13 0.54 0.52 44 0.45 0.50 0.08 Capital raised after 13 0.15 0.38 44 0.14 0.35 0.02 Amount raised after 13 4.00 11.31 44 1.24 4.92 2.76 Seed after 13 0.00 0.00 44 0.14 0.35 -0.02 Series A after 13 0.00 0.00 44 0.00 0.00 0.00 Employees 13 1.23 2.98 44 1.09 2.75 0.14 Team size 13 0.54 1.13 44 0.57 1.02 -0.03 Customer base 13 0.04 0.09 44 0.17 0.61 -0.13 Short-term survival 13 0.23 0.44 44 0.18 0.39 0.05 Long-term survival 13 0.77 0.44 44 0.64 0.49 0.13
This table presents sample comparisons across respondents and non-respondents (Panel A), participant and non-participant respondents (Panel B), and mentored and non-mentored respondents (Panel C). Observations are at the applicant level. Variables in the first panel are retrieved from the application forms. Age corresponds to the age of the founder, Chilean (Female) is a dummy that equals 1 if the founder is Chilean (Female), Full-time workers is the number of workers reported by the start-up at the time of application (censored at 10), Money raised before is a dummy that equals 1 if the start-up raised financing before potential participation of the program, Prototype equals 1 if the start-up has a prototype in development, and Young equals 1 if the start-up is less than a year old. Variables in the second panel are retrieved from AngelList, Crunchbase, Facebook, Linkedin, and CBInsights. Section 1.2 includes a detailed explanation. Capital raised after is a dummy that equals 1 if the venture raised capital after potential participation in the program, Amount raised after corresponds to the dollar value raised after potential participation in the program (in tens of thousands), Seed after (Series A after) is an indicator for having raised seed (Series A) financing after potential participation, Employees corresponds to the number of employees, and Team size corresponds to the team size including the founders and employees in executive positions. Customer base is a measure of the size of the market normalized by industry, and Short-term survival (Long-term survival) is a dummy that equals 1 if the venture is still in operation by January 2014 (January 2015).

87
Table A3.3 Survey Measures of Real Outcomes Panel A. Questions Survey and Variable Definitions
Question Variable names and definition What is the fate of the start-up? Potential answers:
1. The company is alive, but I sold or gave my shares to someone else.
2. The company is alive, and I still own shares, but I no longer work primarily at that company.
3. The company was sold to (or it merged with) another company, and it no longer exists as an independent entity.
4. The company is alive and I am currently working there.
5. I pivoted this company into my current start-up.
6. The start-up is currently on stand-by while I am working on starting a new company.
7. I closed that company and have started a new company.
8. I closed that company and I am not currently working at my own startup.
9. The start-up is currently on stand-by (nobody is working on it), and I am not currently working at my own startup.
Survey Survival equals 1 if answer was “The company is alive and I am currently working there,” and 0 otherwise. Survey Pivot equals 1 if answer was “I pivoted this company into my current startup,” and 0 otherwise.
What are your accumulated sales in US dollars during the last 6 months?
Survey Sales equals logarithm of reported sales
What is your start-up's "people count" for the following categories?
• Full-time founders • Part-time founders • Full-time employees • Part-time employees
Survey Employees equals the number of reported full-time employees
What is your accumulated profit in US dollars during the last 6 months?
Survey Profit equals logarithm of reported profit
How much money have you raised in US dollars since the beginning of your start-up?
Survey Capital Raised equals logarithm of reported capital raised
What is your estimated pre-money valuation in US dollars?
Survey Valuation equals logarithm of reported pre-money valuation

88
Panel B-Summary Statistics Observations Mean Std. Dev. Min Max
Survey Capital Raised 297 6.91 5.27 0 14.51 Survey Valuation 297 7.58 6.53 0 16.12 Survey Survival 298 0.92 0.27 0 1.00 Survey Pivot 298 0.12 0.32 0 1.00 Survey Sales 298 3.60 4.58 0 13.12 Survey Employees 298 1.49 3.09 0 30.00
Panel A in this table describes the questions asked in the survey, and the real outcome variables constructed based on these questions. Panel B presents summary statistics of the real outcome variables based on the survey used in the analysis.

89
Table A3.4- Start-Up Outcomes and Basic Acceleration Services Panel A-Venture Financing and Valuation
(1) (2) (3) (4) (5) (6) (7) (8) Dep. Var. Survey Capital Raised Survey Valuation Accelerate 2.773*** 1.351* (0.610) (0.805) Higher 1.830*** -0.215 -0.602 1.230 -0.020 0.182 (0.666) (1.033) (1.326) (0.850) (1.304) (1.677) Constant 5.986*** 6.387*** 7.873*** 7.878*** 7.130*** 7.228*** 8.454*** 7.898*** (0.374) (0.359) (0.769) (0.988) (0.461) (0.443) (0.967) (1.268) Observations 297 297 101 61 297 297 101 61 R-2 0.062 0.025 0.000 0.003 0.010 0.007 0.000 0.000 [-75, 75] Yes Yes [-50, 50] Yes Yes
Panel B–Venture Scale
(1) (2) (3) (4) (5) (6) (7) (8) Dep. Var. Survey Sales Survey Employees Accelerate 0.285 0.512 (0.574) (0.392) Higher 0.546 -0.233 -0.834 0.554 -0.587 -1.063 (0.594) (0.952) (1.243) (0.430) (0.827) (1.263) Constant 3.507*** 3.445*** 3.977*** 4.325*** 1.317*** 1.329*** 2.214*** 2.577** (0.319) (0.312) (0.739) (0.968) (0.211) (0.198) (0.731) (1.156) Observations 298 298 101 61 298 298 101 61 R-2 0.001 0.003 0.001 0.008 0.006 0.007 0.006 0.014 [-75, 75] Yes Yes [-50, 50] Yes Yes
Panel C–Venture Survival
(1) (2) (3) (4) (5) (6) (7) (8) Dep. Var. Survey Survival Survey Pivot Accelerate 0.045 -0.009 (0.030) (0.023) Higher 0.047 -0.003 0.048 -0.016 -0.089 -0.107 (0.031) (0.044) (0.060) (0.025) (0.029) (0.048) Constant 0.905*** 0.906*** 0.952*** 0.923*** 0.050*** 0.047*** 0.024 0.038 (0.021) (0.020) (0.033) (0.053) (0.016) (0.015) (0.024) (0.038) Obs. 298 298 101 61 298 298 101 61 R-2 0.006 0.006 0.000 0.012 0.002 0.001 0.001 0.001 [-75, 75] Yes Yes [-50, 50] Yes Yes This table reports the effects of basic acceleration services (cash and co-working space) on venture performance. Estimates on columns (1)-(2) ((3)-(8)) are based on the regression

90
outcomes=π+β,--./.0,12345 + 65 ( outcomes=π'+β'ℎ29ℎ.05 + 6′5; , where ,--./.0,1234 is a variable that equals 1 if the applicant participated in the accelerator, and ℎ29ℎ.0 equals 1 if the applicant ranks ℎ29ℎ.0 than the capacity threshold in its generation, and 0 otherwise. The outcome variable is specified in the title of the panel and on top of each column, and the variable definitions are in Table A3.2. Columns (3) and (7) ((4) and (8)) restrict observations to respondents with a normalized ranking between [-75, 75] ([-50, 50]). Robust standard errors are presented in parentheses. *, **, and *** indicate statistical significance at the 10%, 5%, and 1% levels, respectively.

91
Table A3.5- Start-Up Outcomes and Mentoring Panel A-Venture Financing and Valuation
(1) (2) (3) (4) (5) (6) Dep. Var. Survey Capital Raised Survey Valuation Mentor 1.853 2.396 (1.143) (1.968) !"#$%3.6 -0.179 -1.952 0.257 -1.875 (1.475) (1.621) (2.126) (2.248) Constant 8.842*** 9.309*** 10.636*** 8.597*** 9.080*** 11.559*** (0.712) (0.662) (0.581) (0.977) (0.957) (0.936) Obs. 57 57 34 57 57 34 R-2 0.031 0.000 0.060 0.025 0.000 0.028
Panel B–Venture Scale (1) (2) (3) (5) (6) (7) Dep. Var. Survey Sales Survey Employees Mentor -2.389* -1.177 (1.326) (0.761) !"#$%3.6 -1.440 -1.701 -0.148 -0.265 (1.459) (1.819) (1.054) (1.242) Constant 4.029*** 3.838*** 4.498*** 2.023*** 1.791*** 2.182*** (0.760) (0.753) (1.108) (0.558) (0.518) (0.645) Obs. 57 57 34 57 57 34 R-2 0.043 0.016 0.026 0.022 0.000 0.002
Panel C–Venture Survival
(1) (2) (3) (4) (5) (6) Dep. Var. Survey Survival Survey Pivot Mentor -0.154 0.003 (0.102) (0.085) !"#$%3.6 -0.143 -0.083 -0.095* -0.150* (0.095) (0.082) (0.080) (0.094) Constant 1.000*** 1.000*** 1.000*** 0.068* 0.070* 0.045 (0.000) (0.000) (0.000) (0.039) (0.040) (0.046) Obs. 57 57 34 57 57 34 R-2 0.123 0.112 0.056 0.000 0.000 0.006
This table reports the effects of basic acceleration services (cash and co-working space) on venture performance. Estimates on columns (1)-(2) ((3)-(8)) are based on the regression outcomes=α+γ4%56#78 + 98 (outcomes=α'+γ'!"#$%3.68 + 9′8<, where 4%56#7 is a variable that equals 1 if the participant took part in the mentor arm, and !"#$%=.> is an indicator variable that equals 1 if the participant scored above 3.6 during the pitch day. The outcome variable is specified in the title of the panel and on top of each column, and the variable definitions are in Table A3.2. Columns (3) and (6) restrict observations to respondents with a pitch-day score between 2.9 and 4.4. Robust standard errors are presented in parentheses. *, **, and *** indicate statistical significance at the 10%, 5%, and 1% levels, respectively.
Top Related